SlideShare a Scribd company logo
SQL Power XBRL Analytics   MOBILE DASHBOARD DEMO Demo featuring XBRL Analytics for iPad as an example of SQL Power pre-built MicroStrategy mobile dashboards UNLEASH THE INTELLIGENCE WITHIN WWW.SQLPOWER.CA
Introduction An integral component to  SQL Power's end-to-end XBRL filing and reporting solution,  XBRL Analytics  enables companies to extract knowledge from their XBRL data quickly, easily and affordably using a sleek, intuitive mobile app. This example shows the SQL Power XBRL Analytics for iPad dashboard application, developed using MicroStrategy. Please n ote that XBRL Analytics and other MicroStrategy dashboards are also available on other desktop/mobile devices, and can support any type of data source. For more information, contact us at  [email_address]
SQL Power XBRL Analytics runs on the MicroStrategy Mobile BI platform on the iPad, which is free to download. We can launch SQL Power XBRL Analytics by tapping the MicroStrategy app icon.
This is the SQL Power XBRL Analytics home screen. The large buttons lead to 4 unique analytical dashboards.  (This particular demo is pre-built for a USA Bank Regulator, but other dashboards can be easily customized.)
We can tap any button to view the corresponding dashboard.
The first dashboard is the XBRL Health Check dashboard, which provides a quick overview of the top Key Performance Indicators (KPIs). It includes various gauges and charts to describe overall organizational health at a glance.
Let's take a look at some of the XBRL Analytics basic functionality. Across the top of every dashboard  are drop-down menus which allow you to instantly filter results based on geographic dimensions.
Next we have the Sections button, which allows you to quickly navigate to the other XBRL Analytics dashboards.
  On the far right there is also an Info button, which displays help and information for the current dashboard.
Certain panels can also contain additional views/content which can be accessed by swiping the panel.
Using the Sections panel, we can proceed to the next dashboard.
This is the Loans Analysis dashboard, which uses line charts to show trends over time.
Here, individual dimensions can be checked on or off, to further customize the current view.
We can use the Sections panel again to jump to the next dashboard.
This is the Investments & Assets dashboard. This dashboard uses dual-axis bar & line charts to plot various assets together over time.
You can also click on data points in the chart to reveal more detailed information.
Now let's take a look at the last dashboard.
The Deposit Analysis dashboard shows deposits by band. As you can see, XBRL Analytics is capable of displaying data in many different ways - and SQL Power can build custom dashboards for  desktop, web or mobile to suit your specific analysis needs.
This concludes our brief walkthrough of XBRL Analytics, just one example of SQL Power's pre-built Business Intelligence dashboard solutions. For more information, please contact us at info@sqlpower.ca.
To learn more about SQL Power  XBRL Analytics, contact us at:   www.sqlpower.ca [email_address] UNLEASH THE INTELLIGENCE WITHIN WWW.SQLPOWER.CA

More Related Content

PPTX
ITB_BeGraphic
PPT
Excel 2016 top features
PPTX
Power point mc1_mcgovern_alessandra
PPTX
3D Geospatial Visualization Using Power Map
ODP
Presentation calc
PPT
PDF
UC Analytics Brochure
PDF
Geo spatial analytics using Microsoft BI
ITB_BeGraphic
Excel 2016 top features
Power point mc1_mcgovern_alessandra
3D Geospatial Visualization Using Power Map
Presentation calc
UC Analytics Brochure
Geo spatial analytics using Microsoft BI

What's hot (8)

PPTX
alma lubugan
PPSX
What does Scott do?
PDF
IntelligentEnterprise
PDF
Esri Maps for MicroStrategy
PDF
Zebra Direct Sensing Visualizations
PDF
What are uses_of
PPTX
12 Panorama Necto 14 infographic usage - visualization & data discovery solution
PPTX
Acumatica Summit 2017 - Business Intelligence for Business Leaders
alma lubugan
What does Scott do?
IntelligentEnterprise
Esri Maps for MicroStrategy
Zebra Direct Sensing Visualizations
What are uses_of
12 Panorama Necto 14 infographic usage - visualization & data discovery solution
Acumatica Summit 2017 - Business Intelligence for Business Leaders
Ad

Viewers also liked (7)

PDF
The Art and Science behind Dashboarding by Taha Azizi
PPT
Designing Dashboards
PPTX
Keeping it Real with Dashboards in The Financial Edge
PDF
Financial Trends | Forecast
PPTX
Balanced Scorecard Strategies And Hr Metrics Workshop Sept 13 Chicago, Il
PDF
Effective Dashboard Design
PPTX
Regulatory Reporting Dashboard
The Art and Science behind Dashboarding by Taha Azizi
Designing Dashboards
Keeping it Real with Dashboards in The Financial Edge
Financial Trends | Forecast
Balanced Scorecard Strategies And Hr Metrics Workshop Sept 13 Chicago, Il
Effective Dashboard Design
Regulatory Reporting Dashboard
Ad

Similar to XBRL Analytics Demo | SQL Power Group (20)

PDF
SQL Power - XBRL Power Suite
PPT
MicroStrategy - Effective Business Dashboards
PPT
Business Intelligence Software Tools
PPTX
SAP Business Objects - Lopes Supermarket
PPTX
Business Visualization: Dashboard & Storyboarding
PPTX
Advance Data Visualization and Storytelling Virtual Workshop
 
PDF
2. Getting Started
PPT
Search Driven Analytics - A New Approach for Data Discovery
PDF
Business intelligence in Microsoft Dynamics NAV 2016
PPTX
Dynamics Day 2014: Microsoft Dynamics NAV - Business Insight (Reporting and A...
PDF
7ANALYSE Business Intelligence made simple!
PDF
7ANALYSE Business Intelligence made simple!
PPTX
Evolved BI with SQL Server 2012
PDF
Microsoft BI reporting capabilities (on-prem solutions) Presentation
PPTX
Portfolio
PDF
Data Analytics Company |Techknomatic
PPTX
SQL: Enough business intelligence time for administration intelligence
PDF
BA and data visualization.pdf
PDF
Florida MicroStrategy User Group Meeting
 
PDF
CBDA Study Group
SQL Power - XBRL Power Suite
MicroStrategy - Effective Business Dashboards
Business Intelligence Software Tools
SAP Business Objects - Lopes Supermarket
Business Visualization: Dashboard & Storyboarding
Advance Data Visualization and Storytelling Virtual Workshop
 
2. Getting Started
Search Driven Analytics - A New Approach for Data Discovery
Business intelligence in Microsoft Dynamics NAV 2016
Dynamics Day 2014: Microsoft Dynamics NAV - Business Insight (Reporting and A...
7ANALYSE Business Intelligence made simple!
Evolved BI with SQL Server 2012
Microsoft BI reporting capabilities (on-prem solutions) Presentation
Portfolio
Data Analytics Company |Techknomatic
SQL: Enough business intelligence time for administration intelligence
BA and data visualization.pdf
Florida MicroStrategy User Group Meeting
 
CBDA Study Group

Recently uploaded (20)

PPTX
AI-assistance in Knowledge Collection and Curation supporting Safe and Sustai...
PDF
How to Get Funding for Your Trucking Business
PDF
Training And Development of Employee .pdf
DOCX
unit 2 cost accounting- Tender and Quotation & Reconciliation Statement
PDF
COST SHEET- Tender and Quotation unit 2.pdf
PPTX
job Avenue by vinith.pptxvnbvnvnvbnvbnbmnbmbh
PPT
340036916-American-Literature-Literary-Period-Overview.ppt
PDF
Katrina Stoneking: Shaking Up the Alcohol Beverage Industry
PPT
Data mining for business intelligence ch04 sharda
PDF
Stem Cell Market Report | Trends, Growth & Forecast 2025-2034
PPTX
Dragon_Fruit_Cultivation_in Nepal ppt.pptx
PPTX
Belch_12e_PPT_Ch18_Accessible_university.pptx
PDF
Elevate Cleaning Efficiency Using Tallfly Hair Remover Roller Factory Expertise
PDF
Types of control:Qualitative vs Quantitative
PDF
Chapter 5_Foreign Exchange Market in .pdf
PDF
kom-180-proposal-for-a-directive-amending-directive-2014-45-eu-and-directive-...
DOCX
Euro SEO Services 1st 3 General Updates.docx
PDF
Nidhal Samdaie CV - International Business Consultant
PDF
BsN 7th Sem Course GridNNNNNNNN CCN.pdf
PDF
Laughter Yoga Basic Learning Workshop Manual
AI-assistance in Knowledge Collection and Curation supporting Safe and Sustai...
How to Get Funding for Your Trucking Business
Training And Development of Employee .pdf
unit 2 cost accounting- Tender and Quotation & Reconciliation Statement
COST SHEET- Tender and Quotation unit 2.pdf
job Avenue by vinith.pptxvnbvnvnvbnvbnbmnbmbh
340036916-American-Literature-Literary-Period-Overview.ppt
Katrina Stoneking: Shaking Up the Alcohol Beverage Industry
Data mining for business intelligence ch04 sharda
Stem Cell Market Report | Trends, Growth & Forecast 2025-2034
Dragon_Fruit_Cultivation_in Nepal ppt.pptx
Belch_12e_PPT_Ch18_Accessible_university.pptx
Elevate Cleaning Efficiency Using Tallfly Hair Remover Roller Factory Expertise
Types of control:Qualitative vs Quantitative
Chapter 5_Foreign Exchange Market in .pdf
kom-180-proposal-for-a-directive-amending-directive-2014-45-eu-and-directive-...
Euro SEO Services 1st 3 General Updates.docx
Nidhal Samdaie CV - International Business Consultant
BsN 7th Sem Course GridNNNNNNNN CCN.pdf
Laughter Yoga Basic Learning Workshop Manual

XBRL Analytics Demo | SQL Power Group

  • 1. SQL Power XBRL Analytics MOBILE DASHBOARD DEMO Demo featuring XBRL Analytics for iPad as an example of SQL Power pre-built MicroStrategy mobile dashboards UNLEASH THE INTELLIGENCE WITHIN WWW.SQLPOWER.CA
  • 2. Introduction An integral component to  SQL Power's end-to-end XBRL filing and reporting solution, XBRL Analytics enables companies to extract knowledge from their XBRL data quickly, easily and affordably using a sleek, intuitive mobile app. This example shows the SQL Power XBRL Analytics for iPad dashboard application, developed using MicroStrategy. Please n ote that XBRL Analytics and other MicroStrategy dashboards are also available on other desktop/mobile devices, and can support any type of data source. For more information, contact us at [email_address]
  • 3. SQL Power XBRL Analytics runs on the MicroStrategy Mobile BI platform on the iPad, which is free to download. We can launch SQL Power XBRL Analytics by tapping the MicroStrategy app icon.
  • 4. This is the SQL Power XBRL Analytics home screen. The large buttons lead to 4 unique analytical dashboards.  (This particular demo is pre-built for a USA Bank Regulator, but other dashboards can be easily customized.)
  • 5. We can tap any button to view the corresponding dashboard.
  • 6. The first dashboard is the XBRL Health Check dashboard, which provides a quick overview of the top Key Performance Indicators (KPIs). It includes various gauges and charts to describe overall organizational health at a glance.
  • 7. Let's take a look at some of the XBRL Analytics basic functionality. Across the top of every dashboard are drop-down menus which allow you to instantly filter results based on geographic dimensions.
  • 8. Next we have the Sections button, which allows you to quickly navigate to the other XBRL Analytics dashboards.
  • 9.   On the far right there is also an Info button, which displays help and information for the current dashboard.
  • 10. Certain panels can also contain additional views/content which can be accessed by swiping the panel.
  • 11. Using the Sections panel, we can proceed to the next dashboard.
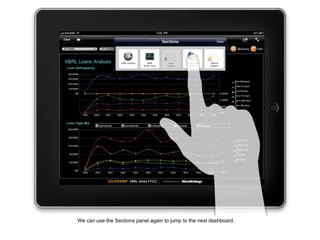
  • 12. This is the Loans Analysis dashboard, which uses line charts to show trends over time.
  • 13. Here, individual dimensions can be checked on or off, to further customize the current view.
  • 14. We can use the Sections panel again to jump to the next dashboard.
  • 15. This is the Investments & Assets dashboard. This dashboard uses dual-axis bar & line charts to plot various assets together over time.
  • 16. You can also click on data points in the chart to reveal more detailed information.
  • 17. Now let's take a look at the last dashboard.
  • 18. The Deposit Analysis dashboard shows deposits by band. As you can see, XBRL Analytics is capable of displaying data in many different ways - and SQL Power can build custom dashboards for desktop, web or mobile to suit your specific analysis needs.
  • 19. This concludes our brief walkthrough of XBRL Analytics, just one example of SQL Power's pre-built Business Intelligence dashboard solutions. For more information, please contact us at info@sqlpower.ca.
  • 20. To learn more about SQL Power XBRL Analytics, contact us at:   www.sqlpower.ca [email_address] UNLEASH THE INTELLIGENCE WITHIN WWW.SQLPOWER.CA