SlideShare a Scribd company logo
MONSTER BEVERAGE CORP
FORM 8-K
(Current report filing)
Filed 01/13/15 for the Period Ending 01/13/15
Address 1 MONSTER WAY
CORONA, CA 92879
Telephone 909-739-6200
CIK 0000865752
Symbol MNST
SIC Code 2086 - Bottled and Canned Soft Drinks and Carbonated Waters
Industry Beverages (Non-Alcoholic)
Sector Consumer/Non-Cyclical
Fiscal Year 12/31
http://www.edgar-online.com
© Copyright 2015, EDGAR Online, Inc. All Rights Reserved.
Distribution and use of this document restricted under EDGAR Online, Inc. Terms of Use.
UNITED STATES
SECURITIES AND EXCHANGE COMMISSION
Washington, D.C. 20549
FORM 8-K
CURRENT REPORT
Pursuant to Section 13 or 15(d) of the
Securities Exchange Act of 1934
Date of Report (Date of earliest event reported): January 13, 2015
Monster Beverage Corporation
(Exact name of registrant as specified in its charter)
Delaware
(State or other jurisdiction of incorporation)
1 Monster Way
Corona, California 92879
(Address of principal executive offices and zip code)
(951) 739 - 6200
(Registrant’s telephone number, including area code)
N/A
(Former name or former address, if changed since last report)
Check the appropriate box below if the Form 8-K filing is intended to simultaneously satisfy the filing obligation of the registrant under any of the following
provisions:
Written communications pursuant to Rule 425 under the Securities Act (17 CFR 230.425)
Soliciting material pursuant to Rule 14a-12 under the Exchange Act (17 CFR 240.14a-12)
Pre-commencement communications pursuant to Rule 14d-2(b) under the Exchange Act (17 CFR 240.14d-2(b))
Pre-commencement communications pursuant to Rule 13e-4(c) under the Exchange Act (17 CFR 240.13e-4(c))
0-18761 39-1679918
(Commission File Number) (IRS Employer Identification No.)
Item 7.01. Regulation FD Disclosure.
On January 13, 2015, Rodney C. Sacks, Chairman and Chief Executive Officer, and Hilton H. Schlosberg, Vice Chairman,
President and Chief Financial Officer, of Monster Beverage Corporation (the “Company”) will host an investor meeting to provide an
update on the Company’s business and operations at the Harvard Club of New York.
The Company’s presentation will be open to all interested parties as a live webcast at approximately 4:15 p.m. Eastern Time on
the “Events & Presentation” section of the Company’s web site at www.monsterbevcorp.com. A copy of the slides that will be used in
the meeting is furnished as Exhibit 99.1 hereto.
Item 9.01. Financial Statements and Exhibits .
(d) Exhibits
The following exhibit is furnished herewith:
Exhibit 99.1 Presentation slides.
SIGNATURES
Pursuant to the requirements of the Securities Exchange Act of 1934, the registrant has duly caused this report to be signed on its behalf
by the undersigned hereunto duly authorized.
Monster Beverage Corporation
Date: January 13, 2015 /s/ Hilton H. Schlosberg
Hilton H. Schlosberg
Vice Chairman of the Board of Directors,
President and Chief Financial Officer
Exhibit 99.1
[LOGO]
Certain statements made
in this presentation may
constitute "forward-
looking statements"
within the meaning of the
U.S. federal securities
laws, regarding the
expectations of
management with respect
to Monster’s future
operating results and
other future events
including revenues and
profitability. Monster
cautions that these
statements are based on
management's current
knowledge and
expectations and are
subject to certain risks
and uncertainties, many
of which are outside of
the control of the
Company, that could
cause actual results and
events to differ materially
from the statements made
herein. Such risks and
uncertainties include, but
are not limited to, the
following: whether and
when The Coca-Cola
Company transactions are
completed, and results
expected from them;
unanticipated litigation
concerning the
Company's products; the
current uncertaint y and
volatility in the national
and global economy;
changes in consumer
preferences; changes in
demand due to both
domestic and
international economic
conditions; activities and
strategies of competit ors,
including the introduction
of new products and
competitive pricing
and/or marketing of
similar products; actual
performance of the
parties under the new
distribution agreements;
potential disruptions
arising out of t he
transition of certain
territories to new
distributors; changes in
sales levels by existing
distributors;
unanticipated costs
incurred in connection
with the termination of
existing distribution
agreements or the
transition to new
distributors; changes in
the pri ce and/ or
availability of raw
materials; other supply
issues, including the
availability of products
and/or suitable
production facilities;
product distribution and
placement decisi ons by
retailers; changes i n
governmental regulation;
the imposition of new
and/or increased excise
and/or sales or other
taxes on our products;
criticism of energy drinks
and/or the energy drink
market generally; the
impact of proposals to
limit or restrict the sale of
energy drinks to minors
and/or persons below a
specified age and/or
restrict the venues and/or
the size of containers in
which energy drinks can
be sold; political,
legislative or other
governmental actions or
events, including the
outcome of any state
attorney general and/ or
government or quasi-
government agency
inquiries, in one or more
regions in which we
operate. For a more
detailed discussion of
these and other risks t hat
could affect our operating
results, see Monster’s
reports filed with the
SEC. Monster’s actual
results could differ
materiall y from those
contained in t he forward-
looking statements.
Monster assumes no
obligation to update any
forward-looking
statements, whether as a
result of new
information, future events
or otherwise. Safe Harbor
Statement
Coca-Cola Transaction
Overview The Coca-Cola
Company (KO) will
purchase an
approximately 16.7%
equity stake in Monster
KO will contribute its
energy portfolio to
Monster, and Monster its
non-energy portfolio to
KO Monster will become
a pure play global energy
drinks company KO will
expand the Monster
distribution relationship
in North America and
become Monster’s
preferred global
distributor Monster will
be KO’s exclusive energy
drinks partner
Transaction expected to
close end of first quarter
2015, subject to
customary conditions At
Closing, Monster will
receive a cash payment of
$2.15bn (1) (1) cash
payment includes cash
held in escrow
Coca-Cola Transaction
Overview (Cont’d)
Beginning Structure Pro
Forma S tructure KO
Public Shareholders
Monster Public
Shareholders KO Public
Shareholders Monster
Public Shareholders KO
Monster KO Monster KO
Non-Energy Monster
Energy Monster Non-
Energy Monster Non-
Energy Monster Energy
KO Non-Energy KO
Energy KO Energy
~16.7% Ownership
Coca-Cola Transaction
Rationale S ecures fully
aligned access to KO’s
leading global
distribution system and
provides opportunity to
accelerate Monster’s
international performance
Enhances route-to market
strengt h in countries
where Monster has an
existing presence
Accesses new countries
through KO’s strong
platform Adds
complementary brands
and focuses Monster as a
pure play in energy
Purchase of KO energy
brands provides scale and
platform synergies in a
range of international
geographies where
Monster currently has
limited presence More
than doubles the size of
Monster’s energy
business in a number of
international geographies,
and establishes a st rong
presence in a number of
additional countri es
Powerful balance sheet
can be used for
substantial return of
capital to shareholders
after closing
The Coca-Cola Company
Energy Portfolio
Overview * Leadi ng
portfoli o of energy
brands Achieved
~$330mm in Net Sales in
2013 Operates as a
concentrate model
International 2013 Net
Sales Source: The Coca-
Cola Company
management. Not e:
Brand portfolio also
includes BU (Papua New
Guinea), Gladiator
(Russia, Ukraine,
Turkey), BPM (Ireland),
Blackfire (Argentina) and
Nalu (Belgium). North
America Key Brands *
Key Countries NOS Burn
Full Throt tle Play +
Power Play Relentless
Mother U.S., Canada
Russia, Brazil, Spain,
Turkey, Norway, Pol and
U.S., Canada Sout hern
Africa Great Bri tain,
Germany Australia, New
Zealand Samurai
Cambodia, Vietnam,
Philippines 40% 60%
Brands Transferred From
The Coca-Cola Company
to Monster From Monster
to The Coca-Cola
Company Concentrate
Business Model
~$330mm 2013 Net Sales
~$150mm 2013 Net Sales
New Distribution
Agreements Source:
Monster management,
The Coca-Cola Company
management.
International Monster
Pro Forma Impact
Product Portfolio and
Geography
Standalone Monster
Source: Monster
management, The
Coca-Cola Company
management. Not e:
All figures based on
2013 Net Sales in
Dollars. North
America Pro Forma
Monster Non-Energy
Energy Energy
International North
America 93% 7%
100% 78% 22% 85%
15%
Monster Pro Forma
Impact (Cont ’d) Current
Monster Pro Forma
Monster 2013 Net Sales
2013 Operating Income
(1) 3Q 2014 Cash
Balance (2) Source:
Monster management,
The Coca-Cola Company
management. 1. Monster
financials have been
adjusted for one-off items
such as distributor
termination expenses and
legal expenses related to
regulatory matters and
litigation concerning
Monster brand energy
drinks. Pro Forma
Monster does not include
nonrecurring charges,
credits and related tax
effects resulting from the
KO Transaction. 2. Cash
balance reflects cash &
cash equivalents as well
as short-term investments
as of third quarter 2014
balance sheet. Pro forma
cash balance includes
cash held in escrow, net
of estimat ed taxes and
estimated distributor
termination fees. ($ i n
millions) ($ in billions)
($ in billions) +9% $2.2
$2.4 $600 $ 700 + +17%
$1.0 $2.8
Beverage Landscape U.S.
Energy Drink Category at
5.5% YTD Growth is
outpacing total Beverage
category growth of 1.9%
*Source: Nielsen AMC
YTD M/E 12.27.14
Monster is leading
growth in the Energy
Category, up +9.4% vs
Total NA Energy +6.1%.
Monster has gained 1.1
share points, t o become
the #1 brand in the
Category with 35.2%
$ Share. Both NOS and
Full Throt tle are also
showing strong sales
momentum versus
previous year. Brand
Performance - Total U.S .
All Channels/Dollars
AMC Conv Food Drug
Mass incl WM $ Vol
$ Vol Year Ago $ % ? vs
Year Ago $ ? vs Year
Ago $ Share $ Share ? vs
Year Ago TNA TOTAL
NON-ALCOHOL
ENERGY 2,552,615,808
2,405,944,156 6.1%
146,671,652 100.0% 0.0
1 TOTAL MONSTER
898,976,294 821,511,634
9.4% 77,464,660 35.2%
1.1 2 TOTAL RED
BULL 879,870,751
822,769,471 6.9%
57,101,280 34.5% 0.3 3
TOTAL 5-HOUR
ENERGY 238,834,680
252,818,820 -5.5%
(13,984,140) 9.4% (1.2)
4 TOTAL ROCKSTAR
177,496,941 189,060,553
-6.1% (11,563,612) 7.0%
(0.9) 5 TOTAL NOS
93,383,687 67,560,437
38.2% 25,823,250 3.7%
0.9 6 TOTAL
STARBUCKS COFFEE
80,102,698 63,996,628
25.2% 16,106,070 3.1%
0.5 7 TOTAL AMP
51,345,650 57,554,385 -
10.8% (6,208,735) 2.0%
(0.4) 8 TOTAL
MOUNTAIN DEW
KICKS TART 50,783,318
33,140,464 53.2%
17,642,854 2.0% 0.6 9
TOTAL FULL
THROTTLE 29,997,375
28,218,057 6.3%
1,779,318 1.2% 0.0 10
TOTAL PRIVATE
LABEL 12,140,930
13,241,095 -8.3%
(1,100,165) 0.5% (0.1)
All Other 39,683,484
56,072,612 -29.2%
(16,389,128) 1.6% (0.8)
Source: AC Nielsen 13
Weeks Ending 12/27/14 -
All Measured Channels
[Convenience, Grocery,
Drug and Mass
(including Wal Mart)] All
Measured Channels
Snapshot
Brand Performance –
Total US All Channels/
Units AMC Conv F ood
Drug Mass incl WM U
Vol U Vol Year Ago U
% ? vs Year Ago U ? vs
Year Ago U Share U
Share ? vs Year Ago
TNA TOTAL NON-
ALCOHOL ENERGY
976,641,662 917,705,154
6.4% 58,936,508 100.0%
0.0 1 TOTAL
MONSTER 362,010,648
329,459,767 9.9%
32,550,881 37.1% 1.2 2
TOTAL RED BULL
282,796,380 264,300,517
7.0% 18,495,863 29.0%
0.2 3 TOTAL
ROCKSTAR 91,901,072
96,207,221 -4.5%
(4,306,149) 9.4% (1.1) 4
TOTAL 5-HOUR
ENERGY 63,068,094
67,938,933 -7.2%
(4,870,839) 6.5% (0.9) 5
TOTAL NOS 43,132,917
31,905,379 35.2%
11,227,538 4.4% 0.9 6
TOTAL MOUNTAIN
DEW KICKSTART
35,435,467 23,339,382
51.8% 12,096,085 3.6%
1.1 7 TOTAL
STARBUCKS COFFEE
29,136,707 23,339,451
24.8% 5,797,256 3.0%
0.4 8 TOTAL AMP
27,189,719 29,487,457 -
7.8% (2,297,738) 2.8%
(0.4) 9 TOTAL FULL
THROTTLE 14,738,698
13,890,459 6.1% 848,239
1.5% (0.0) 10 TOTAL
PRIVATE LABEL
9,433,406 9,889,346 -
4.6% (455,940) 1.0%
(0.1) All Other
17,798,554 27,947,242 -
36.3% (10,148,688) 0.7%
(0.5) S ource: AC Nielsen
13 Weeks Ending
12/27/14 - All Measured
Channels [Convenience,
Grocery, Drug and Mass
(including Wal Mart)] All
Measured Channels
Snapshot
Energy Category: Dollar
Share – All Measured
Channels Source: AC
Nielsen Total US All
Measured Channels – 5
Weeks Ending 12.27.14
Energy Category: Unit
Share – All Measured
Channels Source: AC
Nielsen Total US All
Measured Channels – 5
Weeks Ending 12.27.14
Brand Performance-
Convenience/ Dollars
Convenience $ Vol $ Vol
Year Ago $ % ? vs Year
Ago $ ? vs Year Ago
$ Share $ Share ? vs Year
Ago TNA TOTAL NON-
ALCOHOL ENERGY
1,915,261,731
1,807,087,508 6.0%
108,174,223 100.0% 0.0
1 TOTAL MONSTER
688,622,410 631,587,738
9.0% 57,034,672 36.0%
1.0 2 TOTAL RED
BULL 655,276,215
614,229,414 6.7%
41,046,801 34.2% 0.2 3
TOTAL 5-HOUR
ENERGY 166,095,394
178,275,682 -6.8%
(12,180,288) 8.7% (1.2)
4 TOTAL ROCKSTAR
134,784,995 146,958,530
-8.3% (12,173,535) 7.0%
(1.1) 5 TOTAL NOS
79,095,532 56,200,716
40.7% 22,894,816 4.1%
1.0 6 TOTAL
STARBUCKS COFFEE
59,099,886 48,754,881
21.2% 10,345,005 3.1%
0.4 7 TOTAL AMP
42,954,908 47,173,588 -
8.9% (4,218,680) 2.2%
(0.4) 8 TOTAL
MOUNTAIN DEW
KICKS TART 32,241,878
21,890,362 47.3%
10,351,516 1.7% 0.5 9
TOTAL FULL
THROTTLE 24,016,462
22,686,820 5.9%
1,329,642 1.3% (0.0) 10
TOTAL PRIVATE
LABEL 10,495,946
9,524,907 10.2% 971,039
0.5% 0.0 All Other
22,578,105 29,804,870 -
24.2% (7,226,765) 1.2%
(0.5) S ource: AC Nielsen
13 Weeks Ending
12/27/14 - Convenience
Convenience Snapshot
Brand Performance –
Convenience/ Units
Convenience U Vol U
Vol Year Ago U % ? vs
Year Ago U ? vs Year
Ago U Share U Share ?
vs Year Ago TNA
TOTAL NON-
ALCOHOL ENERGY
767,172,798 720,385,480
6.5% 46,787,318 100.0%
0.0 1 TOTAL
MONSTER 294,542,623
266,564,439 10.5%
27,978,184 38.4% 1.4 2
TOTAL RED BULL
224,220,396 210,897,992
6.3% 13,322,404 29.2%
(0.0) 3 TOTAL
ROCKSTAR 67,583,965
73,272,376 -7.8%
(5,688,411) 8.8% (1.4) 4
TOTAL 5-HOUR
ENERGY 49,152,402
53,508,142 -8.1%
(4,355,740) 6.4% (1.0) 5
TOTAL NOS 36,249,778
26,135,898 38.7%
10,113,880 4.7% 1.1 6
TOTAL AMP
22,101,512 23,792,756 -
7.1% (1,691,244) 2.9%
(0.4) 7 TOTAL
STARBUCKS COFFEE
21,041,754 17,485,617
20.3% 3,556,137 2.7%
0.3 8 TOTAL
MOUNTAIN DEW
KICKS TART 19,982,440
14,045,933 42.3%
5,936,507 2.6% 0.7 9
TOTAL FULL
THROTTLE 11,625,720
10,908,099 6.6% 717,621
1.5% 0.0 10 TOTAL
PRIVATE LABEL
8,736,817 8,722,997
0.2% 13,820 1.1% (0.1)
All Other 11,935,391
15,051,231 -20.7%
(3,115,840) 0.6% (0.2)
Source: AC Nielsen 13
Weeks Ending 12/27/14 -
Convenience
Convenience Snapshot
Energy Category: Dollar
Share - Convenience
Source: AC Nielsen Total
US Convenience – 5
Weeks Ending 12.27.14
Energy Category: Unit
Share - Convenience
Source: AC Nielsen Total
US Convenience – 5
Weeks Ending 12.27.14
Combined Brand
Portfolio Monster Energy
Company will now have
a portfolio of brands with
different positionings to
compete in both premium
and price segments.
Current Monster Energy
Global Distribution
Distribution of at least
one MEC brand
following KO
Transaction
Energy Portfolio
Energy Portfolio
Energy Portfolio
Energy Portfolio
Selected Market: Great
Britain Source: Nielsen
Total GB market data to
12.2.14* Tesco Express
new shelf layout Last
Last 13 Weeks 4 weeks
Energy Category Value
Growth + 3.1% + 3.9%
Monster Value Growth
+15.1% + 34.8% Monster
Value Share 12.3%
13.5% Rel entl ess Value
Growth + 7.6% - 8.0%
Relentless Value Share
6.5% 5.8% Total Monster
Energy Company 18.8%
19.3% value share
following KO transaction
10.4% 6.2% 11.1% 6.2%
12.3% 6.5% GB Market
Share Monster & KO
Brand
Source: Nielsen data
Germany retail channel
11.2.14 Grocery: Rewe
Supermarket Last Last 13
Weeks 4 weeks Energy
Category Value Growth
+ 7.7% + 5.5% Monster
Value Growth + 33.8% +
42.3% Monster Value
Share 10.4% 11.3%
Relentless Value Growth
+ 8.9% + 9.4% Relentless
Value Share 5.1% 4.9%
Total Monster Energy
Company 15.5% 16.3%
value share following KO
transaction Selected
Market: Germany 8.9%
5.3% 9.4% 4.9% 10.4%
5.1% Germany Value
Share Monster & KO
Brand
Source: Nielsen data total
Spanish Market to
11.2.14 S elected Market:
Spain Grocery: Carrefour
Maquinista, Barcelona
Last Last 13 Weeks 4
weeks Energy Category
Value Growth + 3.4% +
5.7% Monster Val ue
Growth + 3.6% + 2.9%
Monster Value Share
22.5% 22.2% Burn Value
Growth + 9.9% + 8.4%
Burn Value Share 11.4%
11.8% Total Monster
Energy Company 33.9%
34.0% value share
following KO transaction
21.0% 11.7% 22.2%
11.6% 22.5% 11.4%
Spain Value S hare
Monster & KO Brand
Energy Category Value
Growth Monster Value
Share Source: IRI total
Greek market data
10.31.14 Selected
Market: Greece At hens
Convenience Grocery:
AB Vasilopoulos –
Athens Last 13 Weeks +
4.4% + 26.5% 28.9%
Last 4 Weeks + 1.7%
+23.7% 29.3% 21.8%
26.9% 28.9% Monster
Value Share
Source: Nielsen data
Belgium Retail channel
to end of 10.31.14
Selected Market:
Belgium Grocery :
Carrefour, Korbeek-Lo
Last Last 13 Weeks 4
weeks Energy Category
Value Growth + 12.1% +
22.1% Monster Value
Growth + 13.5% + 24.3%
Monster Value Share
8.0% 7.7% Nalu Value
Growth +16.0% + 22.2%
Nalu Value Share 9.4%
8.3% Total Monster
Energy Company 17.3%
16.0% value share
following KO transaction
7.2% 8.8% 7.9% 9.8%
8.0% 9.4% Belgium
Value Share Monster &
KO Brand
Selected Market: Brazil
3- Months Ending
November 2014
November 2014 Energy
Category Growth - 2.6%
- 1.6% Monster Value
Growth + 45.0% + 36.5%
Monster Value Share
5.7% 5.7% Burn Value
Growth - 0.7% - 3.5%
Burn Value Share 10.3%
10.1% Total Monster
Energy Company 16.0%
15.8% value share
following KO transaction
Source: Nielsen as of
11.14, All channels data
Ipiranga/AmPm Brazil
value share Monster &
KO brands 5.7 10.3 5.7
10.1 - 2.0 4.0 6.0 8.0 10.0
12.0 Monster Burn Last 3
Months Nov-14
Selected Market: Mexico
3- Months Ending
October 2014 October
2014 Energy Category
Growth + 11.2% + 9.7%
Monster Value Growth +
9.5% + 4.2% Monster
Value Share 33.5%
33.2% Burn & Gladiator
Value Growth - 35.3% -
37.1% Burn & Gladiator
Value Share 6.3% 6.3%
Total Monster Energy
Company 39.8% 39.3%
value share following KO
transaction Source:
Nielsen as of 10.14, All
channels data Mexico
value share Monster &
KO brands Walmart 33.5
6.3 33.2 6.3 - 5.0 10.0
15.0 20.0 25.0 30.0 35.0
40.0 Monster Burn &
Gladiator Last 3 Months
Oct-14
Selected Market:
Australia 3- Months
Ending September 2014
September 2014 Energy
Category Growth + 1.9%
+ 1.7% Monster Value
Growth - 13.3% - 8.7%
Monster Value Share
4.6% 4.5% Mother Value
Growth + 11.7% 8.0%
Mother Value Share
17.7% 17.7% Total
Monster Energy
Company 22.3% 22.2%
value share following KO
transaction Source:
Nielsen as of 9.14, All
channels data
Woolworth’s Australia
value share Monster &
KO brands 4.6 17.7 4.5
17.7 - 2.0 4.0 6.0 8.0 10.0
12.0 14.0 16.0 18.0 20.0
Monster Mother Last 3
Months Sep-14
Global Properties
Formula 1 – Factory
Mercedes Lewis
Hamilton 2014 World
Champion MotoGP –
Factory Yamaha
Valentino Rossi 9 time
World Champion Major
X Games Sponsor Team
Evil Genius - eSports
U.S. Properties Kyle
Busch Most Wi nning
Nation Wide Driver
Supercross – Factory
Kawasaki Ryan Villopoto
4-time Worl d Champion
Bellator MMA Monster
Energy Bi g Ticket Music
Festival
EMEA Properties Liam
Doran World Rally Ti tle
Sponsor MotoGP Le
Mans Title Sponsor –
GROEZROCK Festival
Meerhout, Belgium,
Europe’s Biggest Punk
and Hardcore Festival
Greg Hancock Speedway
Champion
Brazil Properties
Professional Bull Riders
Series Sponsor
Motocross Series
Sponsor F ilipe Toledo –
ASP Event Champion
Atila Abrea Stock Car
Japan Properties Toyota
Big Air Sponsor Taka –
Dominant Free S tyle
Champion Subway Take-
Over: Connecting with
20 million Commuters
Maximum the Hormone
Heavy Metal Band
Media Ken Block –
Gymkhana 7 22.8 million
views1 (all rel ated
videos) ABC “World of
X” – Integration i nto 38
Episodes Live ESPN
Cam Zink World Record
Back F lip 101 Mil lion
total YouTube Views
Source: 1 Youtube.com
as of 1.12.2015
Social Media 25 Million
Facebook Fans 4th
largest Beverage Brand
1.4 Million Instagram
Followers #3 Beverage
Brand2 2.0 Million
Twitter Followers #3
Beverage Brand1 Larger
following than Red Bull
9th largest
Beverage/FMCG Food
Brand on Facebook1 (and
we don’t buy likes)
Source:
1SocialBakers.com as of
1.12.2015 2Totems.co as
of 1.12.2015
U.S. Retail Promotions -
2015 Trimester 1 Bellator
MMA & Rampage
Jackson Trimester 2
Major Theatri cal Release
Trimester 3 Ultimate
Gaming Experience
(Tentative)
EMEA Retail P romotions
- 2015 Q1 MotoGP Q2
Formula 1 Q3 P oint
Break Theatrical Release
Q4 Ultimate Gaming
Experience (Tentative)
Japan Retail Promotions -
2015 Q4 MotoGP Q2
Music Festival Ticket
Give-Away Q3 Monster
Energy Gear Program
Late Q1 Video Game
Tie-In
Rossi: Promo to
Permanent Rossi #2
Monster SKU in One
Stop with a Rate of Sale
60% of Monster Energy
500ml. Promotional
package featuring nine-
time MotoGP World
Champion Valentino
Rossi. Launched in May
2014 as a limited time
offering. After strong
consumer acceptance,
became a permanent
SKU for EMEA Source:
Litmus to 12.7.14
New Products 1/14 5/14
Exclusive 7-Eleven 9/14
10/14 11/ 14 2/15 2/15
Packing Refresh 9/14
10/14
Solid Financial Results
22 consecutive years of
increased sales the since
acquisition of the Hansen
beverage business in
1992. Achieved $2.25
billion in net sales in
2013, up 9.0% over net
sales of $2.06 billion in
2012. For the nine
months ended September
30, 2014, achieved $1.86
billion in net sales, up
9.0% over net sales of
$1.71 billion for the same
period in 2013. Net sales
for the third quarter of
2014 increased to $636.0
million, up 7.7% from the
same quarter last year.
Net income for the third
quarter of 2014 increased
to $121.6 million, up
31.9% from the same
quarter last year.
Monster Beverage
Corporation Net Sales
($ in millions) 35.1%
CAGR to December 2013
2003 2004 2005 2006
2007 2008 2009 2010
2011 2012 2013 YTD
9/30 2013 YTD 9/30
2014 $110.4 $180.3
$348.9 $605.8 $904.5
$1,033.8 $1,143.3
$1,303.9 $1,703.2
$2,060.7 $2,246.4
$1,705.6 $1,859.3
Monster Beverage
Corporation Reported
Operat ing Income ($ in
millions) 2003 2004 2005
2006 2007 2008 2009
2010 2011 2012 2013
YTD 9/30 2013 YTD
9/30 2014 $9.8 $33.9
$103.4 $158.6 $231.0
$163.6 $337.3 $347.8
$456.4 $550.6 $572.9
$438.2 $554.6
Monster Beverage
Corporation Adjusted
Operat ing Income (“OI”)
($ in millions) Reported
OI $9.8 $33.9 $103.4
$158.6 $231.0 $163.6
$337.3 $347.8 $456.4
$550.6 $572.9 $438.2
$554.6 *Adjustments
16.5 25.0 117.9 - 2.8 -
1.8 1.1 3.5 28.7 23.9 17.5
Adjusted OI $9.8 $33.9
$103.4 $175.1 $256.0
$281.5 $334.5 $346.0
$457.5 $554.1 $601.6
$462.1 $572.1 * Adjusted
operating income is a
non-GAAP financial
measure that includes
adjustments for (1)
termination costs to prior
distributors; (2)
professional service fees,
net of insurance
reimbursements,
associated with the
review of stock option
grants and granting
practices; and (3)
expenditures related to
regulatory matters and
litigation concerning the
advertising, marketing,
promotion, ingredi ents,
usage, safety and sale of
the Company’s Monster
Energy brand energy
drinks.. 51.1% CAGR to
December 2013 * Non-
GAAP financial
measures are not
prepared in accordance
with GAAP and may be
different from non-
GAAP financial
measures used by other
companies. Non-GAAP
financial measures should
not be considered as a
substitute for, or superior
to, measures of financial
performance prepared in
accordance with GAAP.
We include these non-
GAAP financial
measures because we
believe they are useful to
investors in allowing for
greater transparency
related to our ongoing
operations. Investors are
encouraged to review the
reconciliat ion of the non-
GAAP financial
measures used to their
most directly comparable
GAAP financial
measures as provided in
the table above. 2003
2004 2005 2006 2007
2008 2009 2010 2011
2012 2013 YTD 9/30
YTD 9/30 $9.8 $33.9
$103.4 $175.1 $256.0
$281.5 $334.5 $346.0
$457.5 $554.1 $601.6
$462.1 $572.1
Monster Beverage
Corporation Reported
Net Income ($ in
millions) 2003 2004 2005
2006 2007 2008 2009
2010 2011 2012 2013
YTD 9/30 YTD 9/30
$5.9 $20.4 $62.8 $97.9
$149.4 $108.0 $208.7
$212.0 $286.2 $340.0
$338.7 $262.6 $357.9
Monster Beverage
Corporation Reported
Diluted Earnings Per
Share As adjusted for
Stock Splits 2003 2004
2005 2006 2007 2008
2009 2010 2011 2012
2013 YTD 9/30 2013
YTD 9/30 2014 $0.04
$0.11 $0.33 $0.50 $0.76
$0.55 $1.10 $1.14 $1.53
$1.86 $1.95 $1.51 $2.06
Monster Beverage
Corporation Balance
Sheet Highlights ($ in
thousands) September 30,
2014 December 31, 2013
Percentage Change Cash
and cash equi valents
$ 408,323 $ 211,349 93%
Investments: Short-term
investments $ 588,041
$ 402,247 46% Long-
term investments
$ 28,419 $ 9,792 190%
Total Investments
$ 616,460 $ 412,039 50%
Total cash and
investments $ 1,024,783
$ 623,388 64% Accounts
receivable, net $ 330,176
$ 291,638 13%
Inventories $ 205,449
$ 221,449 -7% Current
liabilities $ 370,611
$ 316,014 17% Deferred
revenue – long-term
$ 105,827 $ 112,216 -6%
Total stockholders’
equity $1,386,440
$ 992,279 40%
Monster Beverage
Corporation 3rd Quarter
Results (in millions
except per share data)
3Q13 3Q14 $590.4
$636.0 Reported Net
Sales 7.7% 3Q13 3Q14
$151.4 $189.9 Reported
Operat ing Income 25.4%
3Q13 3Q14 $92.2 $121.6
Report ed Net Income
31.9% 3Q13 3Q14 $0.53
$0.70 Reported Diluted
EPS 31.7%
[LOGO]

More Related Content

PDF
Monster Beverages 2011 Investor Presentation
PPTX
Presentation Product Failure.New Coke
PPTX
Relaunch of RC Cola
PPTX
Varun Beverages Ltd
PPTX
Why rc cola failed in pakistan
PPTX
Marketing plan for launching crescent pure
PPT
Pepsi group assignment 20110918 final
PPTX
Pepsi co diversification strategy case analysis
Monster Beverages 2011 Investor Presentation
Presentation Product Failure.New Coke
Relaunch of RC Cola
Varun Beverages Ltd
Why rc cola failed in pakistan
Marketing plan for launching crescent pure
Pepsi group assignment 20110918 final
Pepsi co diversification strategy case analysis

What's hot (20)

DOCX
Pepsi project
PPTX
Pepsi perfect marketing plan
PPTX
PEPSICO PPT ON MARKETING
PPTX
Crescent Pure energy drink- case study
PPTX
Pepsi-Co's Reverse Innovation in various Products
PPT
Boston Beer Company Presentation
PDF
7up Advertising Campaign
PPTX
ppt on pepsico
DOCX
Report pepsi co.
PPT
Coca cola New product Marketing
PDF
Coke vs pepsi report
PDF
Pepsico Sales Structure
PPT
Ariel-4p's and stp
PPTX
Pepsi advertisement campaign
PDF
AB InBev Pitch
PPTX
The 4Ps of Coca Cola (Marketing presentation)
PPTX
Launch of New coke
PDF
review Coca cola company
PPTX
Marketing Management - Alcohol Industry
PPTX
Pepsi marketing plan
Pepsi project
Pepsi perfect marketing plan
PEPSICO PPT ON MARKETING
Crescent Pure energy drink- case study
Pepsi-Co's Reverse Innovation in various Products
Boston Beer Company Presentation
7up Advertising Campaign
ppt on pepsico
Report pepsi co.
Coca cola New product Marketing
Coke vs pepsi report
Pepsico Sales Structure
Ariel-4p's and stp
Pepsi advertisement campaign
AB InBev Pitch
The 4Ps of Coca Cola (Marketing presentation)
Launch of New coke
review Coca cola company
Marketing Management - Alcohol Industry
Pepsi marketing plan
Ad

Viewers also liked (9)

PPTX
Marketing Monster Energy Drink Presentation
PPTX
Market Research [Monster Energy]
PDF
California State Polytechnic University Pomona_Full Written Case
PPTX
Monster Presentation
PDF
Ad Campaign for Monster Energy Drink
PPTX
Energy Drink Consumer Research Proposal
PDF
Monster Beverage 2012 Annual Report
PPT
Corporate Planning
PPT
Strategic management ppt
Marketing Monster Energy Drink Presentation
Market Research [Monster Energy]
California State Polytechnic University Pomona_Full Written Case
Monster Presentation
Ad Campaign for Monster Energy Drink
Energy Drink Consumer Research Proposal
Monster Beverage 2012 Annual Report
Corporate Planning
Strategic management ppt
Ad

Similar to Monster Beverage 2015 Annual Presentation (20)

PDF
Project report on coca cola marketing mix
PDF
Hansen's/Monster Beverage 2011 Year End Presentation
PDF
Monster Investor presentation 2021
PDF
Coca Cola Consoldiated incidence pricing agreement with Coca Cola
PDF
2015 Preliminary Results
PDF
Coca-Cola Financial Analysis
PDF
Audit Risk Analysis of the Coca-Cola Company
PDF
Mark Cutifani - BofAML 2015 Global Metals, Mining & Steel Conference
PDF
Fourth Quarter and Year-end 2013 Tim Hortons Inc. Earnings Conference Call
DOCX
Project on marketing strategies of coca cola
PDF
Case Study Of The Coca Cola Company And Coca-Cola FEMA
PDF
CL 2012 10K.pdf
PDF
Crop Infrastructure | Corporate Presentation 2019
PDF
Coca Cola Presentation at CAGNY 2021
PDF
Coca Cola Investor Day 2017 - James Qunicey - CEO
PDF
Clx investor presentation
PDF
Cola Wars
DOCX
Chair speak report -PEPSICO(Dupont analysis with coke)
PDF
Investor deck (fy16 q4) final 9.7.16
DOCX
Marketin Plan of Crystal Cola 2016 - written by Hussain Hashimy
Project report on coca cola marketing mix
Hansen's/Monster Beverage 2011 Year End Presentation
Monster Investor presentation 2021
Coca Cola Consoldiated incidence pricing agreement with Coca Cola
2015 Preliminary Results
Coca-Cola Financial Analysis
Audit Risk Analysis of the Coca-Cola Company
Mark Cutifani - BofAML 2015 Global Metals, Mining & Steel Conference
Fourth Quarter and Year-end 2013 Tim Hortons Inc. Earnings Conference Call
Project on marketing strategies of coca cola
Case Study Of The Coca Cola Company And Coca-Cola FEMA
CL 2012 10K.pdf
Crop Infrastructure | Corporate Presentation 2019
Coca Cola Presentation at CAGNY 2021
Coca Cola Investor Day 2017 - James Qunicey - CEO
Clx investor presentation
Cola Wars
Chair speak report -PEPSICO(Dupont analysis with coke)
Investor deck (fy16 q4) final 9.7.16
Marketin Plan of Crystal Cola 2016 - written by Hussain Hashimy

More from Neil Kimberley (20)

PDF
Mondelez State of Snacking and Future Trends 2023
PDF
2024 Numerator Consumer Study of Cannabis Usage
PDF
Trian White Paper on Creating Value at Disney April 2024
PDF
Diageo Strategy Presentation made in February 2024 CAGNY
PDF
Kraft Heinz Presentation at the 2024 CAGNY.pdf
PDF
Miller Coors Presentation at CAGNY Feb 2024
PDF
PEPSICO Presentation to CAGNY Conference Feb 2024
PDF
Pernod Ricard presentation at CAGNY 2024
PDF
Hershey Presentation at 2024 CAGY Conference
PDF
General Mills Presentation at CAGNY 2024
PDF
The Coca-Cola Company Presentation at CAGNY 2024.pdf
PDF
2022 Beverage Forum Non-Alcoholic Workshop[87].pdf
PDF
Nestle Purina 2023 CAGNY.pdf
PDF
PEP 2023 CAGNY.pdf
PDF
Kraft Heinz CAGNY 2023 Presentation.pdf
PDF
General Mills CAGNY 2023.pdf
PDF
KO 2023 CAGNY Presentation.pdf
PDF
NERA Instacart Analysis
PDF
Flow water July 2021 Investor deck
PDF
Vita Coco S1 Filing in Advance of IPO
Mondelez State of Snacking and Future Trends 2023
2024 Numerator Consumer Study of Cannabis Usage
Trian White Paper on Creating Value at Disney April 2024
Diageo Strategy Presentation made in February 2024 CAGNY
Kraft Heinz Presentation at the 2024 CAGNY.pdf
Miller Coors Presentation at CAGNY Feb 2024
PEPSICO Presentation to CAGNY Conference Feb 2024
Pernod Ricard presentation at CAGNY 2024
Hershey Presentation at 2024 CAGY Conference
General Mills Presentation at CAGNY 2024
The Coca-Cola Company Presentation at CAGNY 2024.pdf
2022 Beverage Forum Non-Alcoholic Workshop[87].pdf
Nestle Purina 2023 CAGNY.pdf
PEP 2023 CAGNY.pdf
Kraft Heinz CAGNY 2023 Presentation.pdf
General Mills CAGNY 2023.pdf
KO 2023 CAGNY Presentation.pdf
NERA Instacart Analysis
Flow water July 2021 Investor deck
Vita Coco S1 Filing in Advance of IPO

Recently uploaded (20)

PPT
DIET FINAL FOR HOTEL MANAGEMENT STUDENTS.ppt
PDF
A Culinary Tour of India Through Its Diverse Thalis
PDF
Brown-Illustrative-Abstract-Group-Project-Presentation-1.pdf
PDF
Understanding the Appeal and Cultural Influence of Burgers Around the World
PPTX
W1 - Intro to Poetry.pptxbhjbhjhvghcgcgfcgc
PPTX
Το κρασί από την αρχαιότητα έως σήμερα.pptx
DOC
Aber毕业证学历认证,西蒙弗雷泽大学毕业证留学学历
PPT
Nuclear Chemistry.dcbskdbcsljbcksjbcsljdbcsljbs
PPTX
plantilla-powerpoint-lactancia-materna-221215162739-ccfab79a
PPTX
英国罗汉普顿大学毕业证复刻,英国罗汉普顿大学文凭成绩单定制在线制作
PPTX
chapter 6 in haccp full lecture .pptx
PPTX
Agrisphere ai powered presision farming marketplace
PPTX
philippines-slides-march-2024-datahub-web.pptx
PDF
Administrative-Order-No.-2006-0012 Milk Code.pdf
PPTX
presentation Brew_Bliss_Business_Plan (1).pptx
PDF
Top 10 Viral Food Menus in 2025 | Menu Makanan Hits yang Lagi Viral!** **Must...
PPTX
Planetary Food Systems and Climate Change.pptx
PDF
Hosting with Sandwich Bottom Dutch Oven.pdf
PDF
Brown-Illustrative-Abstract-Group-Project-Presentation-1.pdf
PPTX
SUSTAINABLE FOOD PRODUCTION and supply chain
DIET FINAL FOR HOTEL MANAGEMENT STUDENTS.ppt
A Culinary Tour of India Through Its Diverse Thalis
Brown-Illustrative-Abstract-Group-Project-Presentation-1.pdf
Understanding the Appeal and Cultural Influence of Burgers Around the World
W1 - Intro to Poetry.pptxbhjbhjhvghcgcgfcgc
Το κρασί από την αρχαιότητα έως σήμερα.pptx
Aber毕业证学历认证,西蒙弗雷泽大学毕业证留学学历
Nuclear Chemistry.dcbskdbcsljbcksjbcsljdbcsljbs
plantilla-powerpoint-lactancia-materna-221215162739-ccfab79a
英国罗汉普顿大学毕业证复刻,英国罗汉普顿大学文凭成绩单定制在线制作
chapter 6 in haccp full lecture .pptx
Agrisphere ai powered presision farming marketplace
philippines-slides-march-2024-datahub-web.pptx
Administrative-Order-No.-2006-0012 Milk Code.pdf
presentation Brew_Bliss_Business_Plan (1).pptx
Top 10 Viral Food Menus in 2025 | Menu Makanan Hits yang Lagi Viral!** **Must...
Planetary Food Systems and Climate Change.pptx
Hosting with Sandwich Bottom Dutch Oven.pdf
Brown-Illustrative-Abstract-Group-Project-Presentation-1.pdf
SUSTAINABLE FOOD PRODUCTION and supply chain

Monster Beverage 2015 Annual Presentation

  • 1. MONSTER BEVERAGE CORP FORM 8-K (Current report filing) Filed 01/13/15 for the Period Ending 01/13/15 Address 1 MONSTER WAY CORONA, CA 92879 Telephone 909-739-6200 CIK 0000865752 Symbol MNST SIC Code 2086 - Bottled and Canned Soft Drinks and Carbonated Waters Industry Beverages (Non-Alcoholic) Sector Consumer/Non-Cyclical Fiscal Year 12/31 http://www.edgar-online.com © Copyright 2015, EDGAR Online, Inc. All Rights Reserved. Distribution and use of this document restricted under EDGAR Online, Inc. Terms of Use.
  • 2. UNITED STATES SECURITIES AND EXCHANGE COMMISSION Washington, D.C. 20549 FORM 8-K CURRENT REPORT Pursuant to Section 13 or 15(d) of the Securities Exchange Act of 1934 Date of Report (Date of earliest event reported): January 13, 2015 Monster Beverage Corporation (Exact name of registrant as specified in its charter) Delaware (State or other jurisdiction of incorporation) 1 Monster Way Corona, California 92879 (Address of principal executive offices and zip code) (951) 739 - 6200 (Registrant’s telephone number, including area code) N/A (Former name or former address, if changed since last report) Check the appropriate box below if the Form 8-K filing is intended to simultaneously satisfy the filing obligation of the registrant under any of the following provisions: Written communications pursuant to Rule 425 under the Securities Act (17 CFR 230.425) Soliciting material pursuant to Rule 14a-12 under the Exchange Act (17 CFR 240.14a-12) Pre-commencement communications pursuant to Rule 14d-2(b) under the Exchange Act (17 CFR 240.14d-2(b)) Pre-commencement communications pursuant to Rule 13e-4(c) under the Exchange Act (17 CFR 240.13e-4(c)) 0-18761 39-1679918 (Commission File Number) (IRS Employer Identification No.)
  • 3. Item 7.01. Regulation FD Disclosure. On January 13, 2015, Rodney C. Sacks, Chairman and Chief Executive Officer, and Hilton H. Schlosberg, Vice Chairman, President and Chief Financial Officer, of Monster Beverage Corporation (the “Company”) will host an investor meeting to provide an update on the Company’s business and operations at the Harvard Club of New York. The Company’s presentation will be open to all interested parties as a live webcast at approximately 4:15 p.m. Eastern Time on the “Events & Presentation” section of the Company’s web site at www.monsterbevcorp.com. A copy of the slides that will be used in the meeting is furnished as Exhibit 99.1 hereto. Item 9.01. Financial Statements and Exhibits . (d) Exhibits The following exhibit is furnished herewith: Exhibit 99.1 Presentation slides.
  • 4. SIGNATURES Pursuant to the requirements of the Securities Exchange Act of 1934, the registrant has duly caused this report to be signed on its behalf by the undersigned hereunto duly authorized. Monster Beverage Corporation Date: January 13, 2015 /s/ Hilton H. Schlosberg Hilton H. Schlosberg Vice Chairman of the Board of Directors, President and Chief Financial Officer
  • 6. Certain statements made in this presentation may constitute "forward- looking statements" within the meaning of the U.S. federal securities laws, regarding the expectations of management with respect to Monster’s future operating results and other future events including revenues and profitability. Monster cautions that these statements are based on management's current knowledge and expectations and are subject to certain risks and uncertainties, many of which are outside of the control of the Company, that could cause actual results and events to differ materially from the statements made herein. Such risks and uncertainties include, but are not limited to, the following: whether and when The Coca-Cola Company transactions are completed, and results expected from them; unanticipated litigation concerning the Company's products; the current uncertaint y and volatility in the national and global economy; changes in consumer preferences; changes in demand due to both domestic and international economic conditions; activities and strategies of competit ors, including the introduction of new products and competitive pricing and/or marketing of similar products; actual performance of the parties under the new distribution agreements; potential disruptions arising out of t he transition of certain territories to new distributors; changes in sales levels by existing distributors; unanticipated costs incurred in connection with the termination of existing distribution agreements or the transition to new distributors; changes in the pri ce and/ or availability of raw materials; other supply issues, including the availability of products and/or suitable production facilities; product distribution and placement decisi ons by retailers; changes i n governmental regulation; the imposition of new and/or increased excise and/or sales or other taxes on our products; criticism of energy drinks and/or the energy drink market generally; the impact of proposals to limit or restrict the sale of energy drinks to minors and/or persons below a specified age and/or restrict the venues and/or the size of containers in which energy drinks can be sold; political, legislative or other governmental actions or events, including the outcome of any state attorney general and/ or government or quasi- government agency inquiries, in one or more regions in which we operate. For a more detailed discussion of these and other risks t hat could affect our operating results, see Monster’s reports filed with the SEC. Monster’s actual results could differ materiall y from those contained in t he forward- looking statements. Monster assumes no obligation to update any forward-looking statements, whether as a result of new information, future events or otherwise. Safe Harbor Statement
  • 7. Coca-Cola Transaction Overview The Coca-Cola Company (KO) will purchase an approximately 16.7% equity stake in Monster KO will contribute its energy portfolio to Monster, and Monster its non-energy portfolio to KO Monster will become a pure play global energy drinks company KO will expand the Monster distribution relationship in North America and become Monster’s preferred global distributor Monster will be KO’s exclusive energy drinks partner Transaction expected to close end of first quarter 2015, subject to customary conditions At Closing, Monster will receive a cash payment of $2.15bn (1) (1) cash payment includes cash held in escrow
  • 8. Coca-Cola Transaction Overview (Cont’d) Beginning Structure Pro Forma S tructure KO Public Shareholders Monster Public Shareholders KO Public Shareholders Monster Public Shareholders KO Monster KO Monster KO Non-Energy Monster Energy Monster Non- Energy Monster Non- Energy Monster Energy KO Non-Energy KO Energy KO Energy ~16.7% Ownership
  • 9. Coca-Cola Transaction Rationale S ecures fully aligned access to KO’s leading global distribution system and provides opportunity to accelerate Monster’s international performance Enhances route-to market strengt h in countries where Monster has an existing presence Accesses new countries through KO’s strong platform Adds complementary brands and focuses Monster as a pure play in energy Purchase of KO energy brands provides scale and platform synergies in a range of international geographies where Monster currently has limited presence More than doubles the size of Monster’s energy business in a number of international geographies, and establishes a st rong presence in a number of additional countri es Powerful balance sheet can be used for substantial return of capital to shareholders after closing
  • 10. The Coca-Cola Company Energy Portfolio Overview * Leadi ng portfoli o of energy brands Achieved ~$330mm in Net Sales in 2013 Operates as a concentrate model International 2013 Net Sales Source: The Coca- Cola Company management. Not e: Brand portfolio also includes BU (Papua New Guinea), Gladiator (Russia, Ukraine, Turkey), BPM (Ireland), Blackfire (Argentina) and Nalu (Belgium). North America Key Brands * Key Countries NOS Burn Full Throt tle Play + Power Play Relentless Mother U.S., Canada Russia, Brazil, Spain, Turkey, Norway, Pol and U.S., Canada Sout hern Africa Great Bri tain, Germany Australia, New Zealand Samurai Cambodia, Vietnam, Philippines 40% 60%
  • 11. Brands Transferred From The Coca-Cola Company to Monster From Monster to The Coca-Cola Company Concentrate Business Model ~$330mm 2013 Net Sales ~$150mm 2013 Net Sales New Distribution Agreements Source: Monster management, The Coca-Cola Company management.
  • 12. International Monster Pro Forma Impact Product Portfolio and Geography Standalone Monster Source: Monster management, The Coca-Cola Company management. Not e: All figures based on 2013 Net Sales in Dollars. North America Pro Forma Monster Non-Energy Energy Energy International North America 93% 7% 100% 78% 22% 85% 15%
  • 13. Monster Pro Forma Impact (Cont ’d) Current Monster Pro Forma Monster 2013 Net Sales 2013 Operating Income (1) 3Q 2014 Cash Balance (2) Source: Monster management, The Coca-Cola Company management. 1. Monster financials have been adjusted for one-off items such as distributor termination expenses and legal expenses related to regulatory matters and litigation concerning Monster brand energy drinks. Pro Forma Monster does not include nonrecurring charges, credits and related tax effects resulting from the KO Transaction. 2. Cash balance reflects cash & cash equivalents as well as short-term investments as of third quarter 2014 balance sheet. Pro forma cash balance includes cash held in escrow, net of estimat ed taxes and estimated distributor termination fees. ($ i n millions) ($ in billions) ($ in billions) +9% $2.2 $2.4 $600 $ 700 + +17% $1.0 $2.8
  • 14. Beverage Landscape U.S. Energy Drink Category at 5.5% YTD Growth is outpacing total Beverage category growth of 1.9% *Source: Nielsen AMC YTD M/E 12.27.14
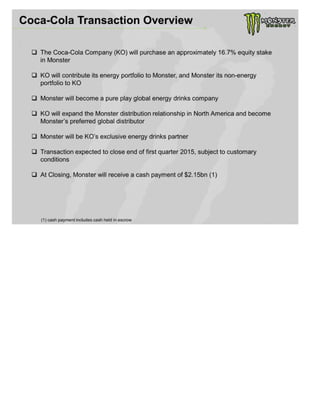
  • 15. Monster is leading growth in the Energy Category, up +9.4% vs Total NA Energy +6.1%. Monster has gained 1.1 share points, t o become the #1 brand in the Category with 35.2% $ Share. Both NOS and Full Throt tle are also showing strong sales momentum versus previous year. Brand Performance - Total U.S . All Channels/Dollars AMC Conv Food Drug Mass incl WM $ Vol $ Vol Year Ago $ % ? vs Year Ago $ ? vs Year Ago $ Share $ Share ? vs Year Ago TNA TOTAL NON-ALCOHOL ENERGY 2,552,615,808 2,405,944,156 6.1% 146,671,652 100.0% 0.0 1 TOTAL MONSTER 898,976,294 821,511,634 9.4% 77,464,660 35.2% 1.1 2 TOTAL RED BULL 879,870,751 822,769,471 6.9% 57,101,280 34.5% 0.3 3 TOTAL 5-HOUR ENERGY 238,834,680 252,818,820 -5.5% (13,984,140) 9.4% (1.2) 4 TOTAL ROCKSTAR 177,496,941 189,060,553 -6.1% (11,563,612) 7.0% (0.9) 5 TOTAL NOS 93,383,687 67,560,437 38.2% 25,823,250 3.7% 0.9 6 TOTAL STARBUCKS COFFEE 80,102,698 63,996,628 25.2% 16,106,070 3.1% 0.5 7 TOTAL AMP 51,345,650 57,554,385 - 10.8% (6,208,735) 2.0% (0.4) 8 TOTAL MOUNTAIN DEW KICKS TART 50,783,318 33,140,464 53.2% 17,642,854 2.0% 0.6 9 TOTAL FULL THROTTLE 29,997,375 28,218,057 6.3% 1,779,318 1.2% 0.0 10 TOTAL PRIVATE LABEL 12,140,930 13,241,095 -8.3% (1,100,165) 0.5% (0.1) All Other 39,683,484 56,072,612 -29.2% (16,389,128) 1.6% (0.8) Source: AC Nielsen 13 Weeks Ending 12/27/14 - All Measured Channels [Convenience, Grocery, Drug and Mass (including Wal Mart)] All Measured Channels Snapshot
  • 16. Brand Performance – Total US All Channels/ Units AMC Conv F ood Drug Mass incl WM U Vol U Vol Year Ago U % ? vs Year Ago U ? vs Year Ago U Share U Share ? vs Year Ago TNA TOTAL NON- ALCOHOL ENERGY 976,641,662 917,705,154 6.4% 58,936,508 100.0% 0.0 1 TOTAL MONSTER 362,010,648 329,459,767 9.9% 32,550,881 37.1% 1.2 2 TOTAL RED BULL 282,796,380 264,300,517 7.0% 18,495,863 29.0% 0.2 3 TOTAL ROCKSTAR 91,901,072 96,207,221 -4.5% (4,306,149) 9.4% (1.1) 4 TOTAL 5-HOUR ENERGY 63,068,094 67,938,933 -7.2% (4,870,839) 6.5% (0.9) 5 TOTAL NOS 43,132,917 31,905,379 35.2% 11,227,538 4.4% 0.9 6 TOTAL MOUNTAIN DEW KICKSTART 35,435,467 23,339,382 51.8% 12,096,085 3.6% 1.1 7 TOTAL STARBUCKS COFFEE 29,136,707 23,339,451 24.8% 5,797,256 3.0% 0.4 8 TOTAL AMP 27,189,719 29,487,457 - 7.8% (2,297,738) 2.8% (0.4) 9 TOTAL FULL THROTTLE 14,738,698 13,890,459 6.1% 848,239 1.5% (0.0) 10 TOTAL PRIVATE LABEL 9,433,406 9,889,346 - 4.6% (455,940) 1.0% (0.1) All Other 17,798,554 27,947,242 - 36.3% (10,148,688) 0.7% (0.5) S ource: AC Nielsen 13 Weeks Ending 12/27/14 - All Measured Channels [Convenience, Grocery, Drug and Mass (including Wal Mart)] All Measured Channels Snapshot
  • 17. Energy Category: Dollar Share – All Measured Channels Source: AC Nielsen Total US All Measured Channels – 5 Weeks Ending 12.27.14
  • 18. Energy Category: Unit Share – All Measured Channels Source: AC Nielsen Total US All Measured Channels – 5 Weeks Ending 12.27.14
  • 19. Brand Performance- Convenience/ Dollars Convenience $ Vol $ Vol Year Ago $ % ? vs Year Ago $ ? vs Year Ago $ Share $ Share ? vs Year Ago TNA TOTAL NON- ALCOHOL ENERGY 1,915,261,731 1,807,087,508 6.0% 108,174,223 100.0% 0.0 1 TOTAL MONSTER 688,622,410 631,587,738 9.0% 57,034,672 36.0% 1.0 2 TOTAL RED BULL 655,276,215 614,229,414 6.7% 41,046,801 34.2% 0.2 3 TOTAL 5-HOUR ENERGY 166,095,394 178,275,682 -6.8% (12,180,288) 8.7% (1.2) 4 TOTAL ROCKSTAR 134,784,995 146,958,530 -8.3% (12,173,535) 7.0% (1.1) 5 TOTAL NOS 79,095,532 56,200,716 40.7% 22,894,816 4.1% 1.0 6 TOTAL STARBUCKS COFFEE 59,099,886 48,754,881 21.2% 10,345,005 3.1% 0.4 7 TOTAL AMP 42,954,908 47,173,588 - 8.9% (4,218,680) 2.2% (0.4) 8 TOTAL MOUNTAIN DEW KICKS TART 32,241,878 21,890,362 47.3% 10,351,516 1.7% 0.5 9 TOTAL FULL THROTTLE 24,016,462 22,686,820 5.9% 1,329,642 1.3% (0.0) 10 TOTAL PRIVATE LABEL 10,495,946 9,524,907 10.2% 971,039 0.5% 0.0 All Other 22,578,105 29,804,870 - 24.2% (7,226,765) 1.2% (0.5) S ource: AC Nielsen 13 Weeks Ending 12/27/14 - Convenience Convenience Snapshot
  • 20. Brand Performance – Convenience/ Units Convenience U Vol U Vol Year Ago U % ? vs Year Ago U ? vs Year Ago U Share U Share ? vs Year Ago TNA TOTAL NON- ALCOHOL ENERGY 767,172,798 720,385,480 6.5% 46,787,318 100.0% 0.0 1 TOTAL MONSTER 294,542,623 266,564,439 10.5% 27,978,184 38.4% 1.4 2 TOTAL RED BULL 224,220,396 210,897,992 6.3% 13,322,404 29.2% (0.0) 3 TOTAL ROCKSTAR 67,583,965 73,272,376 -7.8% (5,688,411) 8.8% (1.4) 4 TOTAL 5-HOUR ENERGY 49,152,402 53,508,142 -8.1% (4,355,740) 6.4% (1.0) 5 TOTAL NOS 36,249,778 26,135,898 38.7% 10,113,880 4.7% 1.1 6 TOTAL AMP 22,101,512 23,792,756 - 7.1% (1,691,244) 2.9% (0.4) 7 TOTAL STARBUCKS COFFEE 21,041,754 17,485,617 20.3% 3,556,137 2.7% 0.3 8 TOTAL MOUNTAIN DEW KICKS TART 19,982,440 14,045,933 42.3% 5,936,507 2.6% 0.7 9 TOTAL FULL THROTTLE 11,625,720 10,908,099 6.6% 717,621 1.5% 0.0 10 TOTAL PRIVATE LABEL 8,736,817 8,722,997 0.2% 13,820 1.1% (0.1) All Other 11,935,391 15,051,231 -20.7% (3,115,840) 0.6% (0.2) Source: AC Nielsen 13 Weeks Ending 12/27/14 - Convenience Convenience Snapshot
  • 21. Energy Category: Dollar Share - Convenience Source: AC Nielsen Total US Convenience – 5 Weeks Ending 12.27.14
  • 22. Energy Category: Unit Share - Convenience Source: AC Nielsen Total US Convenience – 5 Weeks Ending 12.27.14
  • 23. Combined Brand Portfolio Monster Energy Company will now have a portfolio of brands with different positionings to compete in both premium and price segments.
  • 25. Distribution of at least one MEC brand following KO Transaction
  • 30. Selected Market: Great Britain Source: Nielsen Total GB market data to 12.2.14* Tesco Express new shelf layout Last Last 13 Weeks 4 weeks Energy Category Value Growth + 3.1% + 3.9% Monster Value Growth +15.1% + 34.8% Monster Value Share 12.3% 13.5% Rel entl ess Value Growth + 7.6% - 8.0% Relentless Value Share 6.5% 5.8% Total Monster Energy Company 18.8% 19.3% value share following KO transaction 10.4% 6.2% 11.1% 6.2% 12.3% 6.5% GB Market Share Monster & KO Brand
  • 31. Source: Nielsen data Germany retail channel 11.2.14 Grocery: Rewe Supermarket Last Last 13 Weeks 4 weeks Energy Category Value Growth + 7.7% + 5.5% Monster Value Growth + 33.8% + 42.3% Monster Value Share 10.4% 11.3% Relentless Value Growth + 8.9% + 9.4% Relentless Value Share 5.1% 4.9% Total Monster Energy Company 15.5% 16.3% value share following KO transaction Selected Market: Germany 8.9% 5.3% 9.4% 4.9% 10.4% 5.1% Germany Value Share Monster & KO Brand
  • 32. Source: Nielsen data total Spanish Market to 11.2.14 S elected Market: Spain Grocery: Carrefour Maquinista, Barcelona Last Last 13 Weeks 4 weeks Energy Category Value Growth + 3.4% + 5.7% Monster Val ue Growth + 3.6% + 2.9% Monster Value Share 22.5% 22.2% Burn Value Growth + 9.9% + 8.4% Burn Value Share 11.4% 11.8% Total Monster Energy Company 33.9% 34.0% value share following KO transaction 21.0% 11.7% 22.2% 11.6% 22.5% 11.4% Spain Value S hare Monster & KO Brand
  • 33. Energy Category Value Growth Monster Value Growth Monster Value Share Source: IRI total Greek market data 10.31.14 Selected Market: Greece At hens Convenience Grocery: AB Vasilopoulos – Athens Last 13 Weeks + 4.4% + 26.5% 28.9% Last 4 Weeks + 1.7% +23.7% 29.3% 21.8% 26.9% 28.9% Monster Value Share
  • 34. Source: Nielsen data Belgium Retail channel to end of 10.31.14 Selected Market: Belgium Grocery : Carrefour, Korbeek-Lo Last Last 13 Weeks 4 weeks Energy Category Value Growth + 12.1% + 22.1% Monster Value Growth + 13.5% + 24.3% Monster Value Share 8.0% 7.7% Nalu Value Growth +16.0% + 22.2% Nalu Value Share 9.4% 8.3% Total Monster Energy Company 17.3% 16.0% value share following KO transaction 7.2% 8.8% 7.9% 9.8% 8.0% 9.4% Belgium Value Share Monster & KO Brand
  • 35. Selected Market: Brazil 3- Months Ending November 2014 November 2014 Energy Category Growth - 2.6% - 1.6% Monster Value Growth + 45.0% + 36.5% Monster Value Share 5.7% 5.7% Burn Value Growth - 0.7% - 3.5% Burn Value Share 10.3% 10.1% Total Monster Energy Company 16.0% 15.8% value share following KO transaction Source: Nielsen as of 11.14, All channels data Ipiranga/AmPm Brazil value share Monster & KO brands 5.7 10.3 5.7 10.1 - 2.0 4.0 6.0 8.0 10.0 12.0 Monster Burn Last 3 Months Nov-14
  • 36. Selected Market: Mexico 3- Months Ending October 2014 October 2014 Energy Category Growth + 11.2% + 9.7% Monster Value Growth + 9.5% + 4.2% Monster Value Share 33.5% 33.2% Burn & Gladiator Value Growth - 35.3% - 37.1% Burn & Gladiator Value Share 6.3% 6.3% Total Monster Energy Company 39.8% 39.3% value share following KO transaction Source: Nielsen as of 10.14, All channels data Mexico value share Monster & KO brands Walmart 33.5 6.3 33.2 6.3 - 5.0 10.0 15.0 20.0 25.0 30.0 35.0 40.0 Monster Burn & Gladiator Last 3 Months Oct-14
  • 37. Selected Market: Australia 3- Months Ending September 2014 September 2014 Energy Category Growth + 1.9% + 1.7% Monster Value Growth - 13.3% - 8.7% Monster Value Share 4.6% 4.5% Mother Value Growth + 11.7% 8.0% Mother Value Share 17.7% 17.7% Total Monster Energy Company 22.3% 22.2% value share following KO transaction Source: Nielsen as of 9.14, All channels data Woolworth’s Australia value share Monster & KO brands 4.6 17.7 4.5 17.7 - 2.0 4.0 6.0 8.0 10.0 12.0 14.0 16.0 18.0 20.0 Monster Mother Last 3 Months Sep-14
  • 38. Global Properties Formula 1 – Factory Mercedes Lewis Hamilton 2014 World Champion MotoGP – Factory Yamaha Valentino Rossi 9 time World Champion Major X Games Sponsor Team Evil Genius - eSports
  • 39. U.S. Properties Kyle Busch Most Wi nning Nation Wide Driver Supercross – Factory Kawasaki Ryan Villopoto 4-time Worl d Champion Bellator MMA Monster Energy Bi g Ticket Music Festival
  • 40. EMEA Properties Liam Doran World Rally Ti tle Sponsor MotoGP Le Mans Title Sponsor – GROEZROCK Festival Meerhout, Belgium, Europe’s Biggest Punk and Hardcore Festival Greg Hancock Speedway Champion
  • 41. Brazil Properties Professional Bull Riders Series Sponsor Motocross Series Sponsor F ilipe Toledo – ASP Event Champion Atila Abrea Stock Car
  • 42. Japan Properties Toyota Big Air Sponsor Taka – Dominant Free S tyle Champion Subway Take- Over: Connecting with 20 million Commuters Maximum the Hormone Heavy Metal Band
  • 43. Media Ken Block – Gymkhana 7 22.8 million views1 (all rel ated videos) ABC “World of X” – Integration i nto 38 Episodes Live ESPN Cam Zink World Record Back F lip 101 Mil lion total YouTube Views Source: 1 Youtube.com as of 1.12.2015
  • 44. Social Media 25 Million Facebook Fans 4th largest Beverage Brand 1.4 Million Instagram Followers #3 Beverage Brand2 2.0 Million Twitter Followers #3 Beverage Brand1 Larger following than Red Bull 9th largest Beverage/FMCG Food Brand on Facebook1 (and we don’t buy likes) Source: 1SocialBakers.com as of 1.12.2015 2Totems.co as of 1.12.2015
  • 45. U.S. Retail Promotions - 2015 Trimester 1 Bellator MMA & Rampage Jackson Trimester 2 Major Theatri cal Release Trimester 3 Ultimate Gaming Experience (Tentative)
  • 46. EMEA Retail P romotions - 2015 Q1 MotoGP Q2 Formula 1 Q3 P oint Break Theatrical Release Q4 Ultimate Gaming Experience (Tentative)
  • 47. Japan Retail Promotions - 2015 Q4 MotoGP Q2 Music Festival Ticket Give-Away Q3 Monster Energy Gear Program Late Q1 Video Game Tie-In
  • 48. Rossi: Promo to Permanent Rossi #2 Monster SKU in One Stop with a Rate of Sale 60% of Monster Energy 500ml. Promotional package featuring nine- time MotoGP World Champion Valentino Rossi. Launched in May 2014 as a limited time offering. After strong consumer acceptance, became a permanent SKU for EMEA Source: Litmus to 12.7.14
  • 49. New Products 1/14 5/14 Exclusive 7-Eleven 9/14 10/14 11/ 14 2/15 2/15 Packing Refresh 9/14 10/14
  • 50. Solid Financial Results 22 consecutive years of increased sales the since acquisition of the Hansen beverage business in 1992. Achieved $2.25 billion in net sales in 2013, up 9.0% over net sales of $2.06 billion in 2012. For the nine months ended September 30, 2014, achieved $1.86 billion in net sales, up 9.0% over net sales of $1.71 billion for the same period in 2013. Net sales for the third quarter of 2014 increased to $636.0 million, up 7.7% from the same quarter last year. Net income for the third quarter of 2014 increased to $121.6 million, up 31.9% from the same quarter last year.
  • 51. Monster Beverage Corporation Net Sales ($ in millions) 35.1% CAGR to December 2013 2003 2004 2005 2006 2007 2008 2009 2010 2011 2012 2013 YTD 9/30 2013 YTD 9/30 2014 $110.4 $180.3 $348.9 $605.8 $904.5 $1,033.8 $1,143.3 $1,303.9 $1,703.2 $2,060.7 $2,246.4 $1,705.6 $1,859.3
  • 52. Monster Beverage Corporation Reported Operat ing Income ($ in millions) 2003 2004 2005 2006 2007 2008 2009 2010 2011 2012 2013 YTD 9/30 2013 YTD 9/30 2014 $9.8 $33.9 $103.4 $158.6 $231.0 $163.6 $337.3 $347.8 $456.4 $550.6 $572.9 $438.2 $554.6
  • 53. Monster Beverage Corporation Adjusted Operat ing Income (“OI”) ($ in millions) Reported OI $9.8 $33.9 $103.4 $158.6 $231.0 $163.6 $337.3 $347.8 $456.4 $550.6 $572.9 $438.2 $554.6 *Adjustments 16.5 25.0 117.9 - 2.8 - 1.8 1.1 3.5 28.7 23.9 17.5 Adjusted OI $9.8 $33.9 $103.4 $175.1 $256.0 $281.5 $334.5 $346.0 $457.5 $554.1 $601.6 $462.1 $572.1 * Adjusted operating income is a non-GAAP financial measure that includes adjustments for (1) termination costs to prior distributors; (2) professional service fees, net of insurance reimbursements, associated with the review of stock option grants and granting practices; and (3) expenditures related to regulatory matters and litigation concerning the advertising, marketing, promotion, ingredi ents, usage, safety and sale of the Company’s Monster Energy brand energy drinks.. 51.1% CAGR to December 2013 * Non- GAAP financial measures are not prepared in accordance with GAAP and may be different from non- GAAP financial measures used by other companies. Non-GAAP financial measures should not be considered as a substitute for, or superior to, measures of financial performance prepared in accordance with GAAP. We include these non- GAAP financial measures because we believe they are useful to investors in allowing for greater transparency related to our ongoing operations. Investors are encouraged to review the reconciliat ion of the non- GAAP financial measures used to their most directly comparable GAAP financial measures as provided in the table above. 2003 2004 2005 2006 2007 2008 2009 2010 2011 2012 2013 YTD 9/30 YTD 9/30 $9.8 $33.9 $103.4 $175.1 $256.0 $281.5 $334.5 $346.0 $457.5 $554.1 $601.6 $462.1 $572.1
  • 54. Monster Beverage Corporation Reported Net Income ($ in millions) 2003 2004 2005 2006 2007 2008 2009 2010 2011 2012 2013 YTD 9/30 YTD 9/30 $5.9 $20.4 $62.8 $97.9 $149.4 $108.0 $208.7 $212.0 $286.2 $340.0 $338.7 $262.6 $357.9
  • 55. Monster Beverage Corporation Reported Diluted Earnings Per Share As adjusted for Stock Splits 2003 2004 2005 2006 2007 2008 2009 2010 2011 2012 2013 YTD 9/30 2013 YTD 9/30 2014 $0.04 $0.11 $0.33 $0.50 $0.76 $0.55 $1.10 $1.14 $1.53 $1.86 $1.95 $1.51 $2.06
  • 56. Monster Beverage Corporation Balance Sheet Highlights ($ in thousands) September 30, 2014 December 31, 2013 Percentage Change Cash and cash equi valents $ 408,323 $ 211,349 93% Investments: Short-term investments $ 588,041 $ 402,247 46% Long- term investments $ 28,419 $ 9,792 190% Total Investments $ 616,460 $ 412,039 50% Total cash and investments $ 1,024,783 $ 623,388 64% Accounts receivable, net $ 330,176 $ 291,638 13% Inventories $ 205,449 $ 221,449 -7% Current liabilities $ 370,611 $ 316,014 17% Deferred revenue – long-term $ 105,827 $ 112,216 -6% Total stockholders’ equity $1,386,440 $ 992,279 40%
  • 57. Monster Beverage Corporation 3rd Quarter Results (in millions except per share data) 3Q13 3Q14 $590.4 $636.0 Reported Net Sales 7.7% 3Q13 3Q14 $151.4 $189.9 Reported Operat ing Income 25.4% 3Q13 3Q14 $92.2 $121.6 Report ed Net Income 31.9% 3Q13 3Q14 $0.53 $0.70 Reported Diluted EPS 31.7%