SlideShare a Scribd company logo
Geotechnical Aspects in Earthquake Resistant Design by Dr. J.N.Jha Professor & Head Department of Civil Engineering Guru Nanak Dev Engineering College Ludhiana-141006 Email: jagadanand@gmail.com
Conception or rather Misconception of Structure Designer Structure Designer believes erroneously most of the time that superstructure needs to be strengthened more in poor soil than in a good soil. Dynamic behaviour of soil rarely receives any attention  of structure engineer as compared to dynamic behaviour of structure.
Niigatta Earthquake: 1964, Mag. 7.5
Japan earthquake 1964:  Niigata- Mag. 7.5
Tokachi-oki Earthquake: 2003 The Damage of Sewerage Structures kushiro (Town) Lifted up manhole and gushed soil  during liquefaction Lifted up manhole
Caracas Earthquake  1967: Mag. 6.6
Chile Earthquake  1960 :  Island nearValdivia- Mag. 9.5
Alaska Earthquake  1964:Mag. 9.2
Observed Damage from Earthquakes   Chile earthquake 1960 :  An island near Valdivia- Mag.- 9.5 Large settlements and differential settlements of the ground surface - Compaction of loose granular soil by EQ Alaska earthquake 1964:  Turnagain heights landslide- Mag.- 9.2 Major landslide - combination of dynamic stresses and induced pore water pressur e Japan earthquake 1964:  Niigata -Mag.- 7.5 Settlement and tilting of structures - liquefaction of soil Caracas earthquake 1967- Mag.- 6.6 Response of building  during EQ found to depend on the  thickness of soil under the building .
Inference and Attention: Influence of local soil condition  on shaking and damage intensity during earthquake  affects the stability of structure . Large scale tilting of well built houses in  the Niigatta earthquake of 1964 focussed  the attention of profession on  problems  of soil dynamics:  Requiring a careful  attention by Engineers.
Objective of Earthquake Resistant Design Ensuring structural reliability without structural damage  due to ground shaking of  moderate intensities. Special   structures  like high level bridges, tall dams , Nuclear Power Plant  need specific design  procedures (Site specific) supported by detailed investigation.
Geotechnical Aspects of Earthquake Resistant Design  Geotechnical Aspects of Earthquake Resistant Design   of foundation of structures and other soil retaining structures  of soil depends on: Dynamic stress deformation and strength characteristics Earth pressure problems and retaining wall Dynamic bearinng capacity and design of shallow foundation Liquefaction of soil Machine foundations
Influence of local soil conditions on Acceleration(Cause for damage during EQ)  Some Basic Information : Acceleration Response Spectrum A graph showing the maximum accelerations induced in structures with fundamental period ranging from 0 to several seconds Velocity Response Spectrum A plot showing relationship between maximum velocity with fundamental period of the structure  Relation between Velocity Spectrum ( S v  )and Acceleration Spectrum ( S a  ) S v  ≈ (T/2  π )S a   T = fundamental period of the structure  Value  of horizontal peak ground acceleration = 0.6g ? Physical meaning :Movement of the ground can cause a maximum horizontal force  on a rigid structure equal to  60% of its weight
Site approximately same distance from the zone of energy release – 1957 San Francisco Earthquake
Effect of Soil Conditions on form of Response Spectra –Site A
Effect of Soil Conditions on form of Response Spectra –Site B
Effect of Soil Conditions on form of Response Spectra – Site C
Effect of Soil Conditions on form of Response Spectra – Site D
Effect of Soil Conditions on form of Response Spectra – Site E
Effect of Soil Conditions on form of Response Spectra – Site F
Effect of Soil Conditions on form of Response Spectra – Site A - F
Development of Peak/Max. Acceleration Clay (soft): Moulded easily at natural water content and readily excavated  Clay (firm): Moulded by substantial pressure at natural water content and excavated  with a spade Out of six four spectra obtained from the same city in the same EQ at a considerable  distance from the epicenter To eliminate the influence of different amplitudes of surface acceleration, plot made  between period and normalized acceleration (Spectral Acceleration/Maximum  Ground Acceleration  Sites  (Increasing order of softness) Period (sec) (Maximum spectral acceleration)  A 0.3 B 0.5 C 0.6 D 0.8 E 1.3 F 2.5
Clay layer : Amplified seismic shock of glacial till (Both event) Peat deposits : Amplified seismic shocks (Only for distant shock)
Time taken for each complete cycle of oscillation is called FUNDAMETNAL NATURAL PERIOD (T) of the building Time taken by the wave to complete one cycle of motion is called PERIOD OF EQ WAVE (0.03 to 33 seconds) Short EQ wave have large response on short period buildings Long EQ wave have large response on long period buildings Building  Response variation during Earthquake
T (Inherent property of the building) depends on the building flexibility and mass,Any alteration made to the building will change its “T” Bldg (3-5 storey); damage intensity higher in area with underlying soil cover 40-60 m thick and minimal in areas with larger thickness of soil cover Bldg (10-14 storey); damage intensity maximum when soil cover in the range of 150-300m and small for lower thickness of soil cover Soil plays the role of filter allowing some ground waves  to pass  through  and filtering the rest.
Damage potential coefficient varies with building characteristics and soil depth
Relationship between building characteristics, soil depth and damage potential coefficient (S v /k) Structure Fundamental period Damage intensity (D r ) 2 to 3 storey 0.2 sec Remains same regardless of soil depth 4 to 5 storey 0.4 sec Max. damage intensity expected at soil depth of about 20 to 30 m 10 to 12 storey 1.0 sec Damage intensity expected to increase with soil depth up to 150 m or so 15 to 20 storey Damage intensity even greater for soil depth of 150 to 250 m & relatively low for soil depth up to 80 m or so
Dynamic bearing capacity  Soil dynamics: Engineering properties and behaviour of soil under dynamic stress Factors to be considered for estimation of bearing capacity under dynamic condition: Nature of variation of the magnitude of the loading pulse Duration of the pulse Strain rate deformation of soil during deformation
For both static, dynamic and seismic cases bearing capacity failure of foundation grouped into three categories: General shear failure Punching shear failure Local shear failure Various theories concerning dynamic bearing capacity have been presented in last 50 years but  definition of dynamic bearing capacity is yet to evolve till date
Ultimate bearing capacity of continuous shallow foundation (static case)
Seismic bearing capacity
Static case Seismic case q u  = q N q  + ½( γB N γ ) q = γD f N q ,N γ = bearing capacity  factors N q  and N γ  = f (Ø’) Ø’= tan-1[(0.67+ R D  - 0.75R 2 D )tan Ø] q uE   = q N qE  + ½( γB N γE ) q = γD f N qE , N γE  = bearing capacity  factors N qE  and  N γE  = f (Ø’, tanθ) tanθ = k h /(1- k v ) k h &k v  =horizontal and vertical  coefficient of acceleration α AE & α PE = Inclination angles for  active and passive pressure conditions
Static bearing capacity factors Seismic bearing capacity factors Ø N q N γ 0 1 0 10 2.47 1.22 20 6.40 5.39 30 18.40 22.40 40 64.2 109.41 Ø N q N γ 0 1 0 10 2.4 1.4 20 5.9 6.4 30 16.5 23.8 40 59.0 112.0
Variation of N q  and N γ  with Ø’ Variation of N γE /N γ  and N qE / N q  with tanθ and Ø’
Prediction of dynamic load- settlement relationship for foundations on clay (Jackson and Halada,1964) For any given value of  S stat /B, multiply Q/B 2 c u by the strain rate factor  (=1.5) and plot it in the  same graph
Settlement of strip footing due to an earthquake S Eq (m) =  (0.174)(V 2 /Ag)[k h * /A] -4 tan α AE α AE  = Inclination angles for  active pressure conditions V= peak velocity for the  design earthquake (m/sec) A = acceleration coefficient  for the design earthquake g = acceleration due to gravity (9.81 m/sec 2 ) k h /(1- k v ) = k h * , if k v = 0
 
Geotechnical Aspects of Earthquake resistant design Liquefaction of Soil Soils behave like a liquid.  How and why? To understand the above phenomenon: Some understanding  of basics required : Total stress,  Pore water pressure   Effective stress
Total stress, Pore water pressure and Effective stress Figure-1 Figure-2 Case Total Pressure Pore Pressure Effective Pressure Figure- 1 475 150 325 Figure- 2 475 250 225
 
Liquefaction of Soil Shear stress,  τ  = c +  σ n  tanø Effective stress gives more realistic behaviour of soil,  and can be expressed as  τ  = c’   + ( σ n  –u)tanø ’ During the ground motion due to an earthquake,  static pore pressure may increase by an amount u dyn τ  = c’   + ( σ n  – u + u dyn )tanø’  Let us consider a situation  when  u + u dyn =  σ n , then  τ  = c’   In cohesionless soil,  c’= 0, hence  τ  = 0 Soil loose its strength because  of  loss of effective stress Saturated sand when subjected to ground vibration, it tends to compact and decrease in volume ; if drainage is unable to occur, the tendency to decrease in volume results in an increase in pore water pressure and when this becomes equal to the overburden pressure effective stress becomes equal to zero, sand looses its strength completely  and it develops a liquefied state. φΦγ
 
Influence of soil conditions on liquefaction potential
The Damage of Embankment Structures Toyokoro Collapsed Embankment
Place where Embankment was collapsed Abashiri River  (1) Shibetsu River  (6) Kushiro River  (5) Kiyomappu River  (2) Tokachi River  (66) Under investigation Lateral Spread was observed ( ) : the number of collapsed points Tokachi River The Damage of Embankment Structures
Toyokoro Liquefied Soil Collapsed Embankment The Damage of Embankment Structures Liquefied Soil
Failure Mode   (notice : this is only concept) Liquefied Stratum Embankment Settlement Land Slide Lateral Spread The Damage of Embankment Structures
The Damage of Port Structures  (at Kushiro Port) Kushiro Settlement behind Quay Wall Trace of Sand Boiling
Alaska Earthquake ( 1964 )
 
Caracas ( 1967 )
Alaska  2002 Boca del Tocuyo, Venezuela,  1989
Lateral spread at Budharmora (Bhuj, 2001)
Arial view of kandla port, Marked line sows ground crack and sand ejection (Gujrat Earthquake 2001)
Adverse effects of liquefaction Most catastrophic ground failure Lateral displacement of large masses of soil Mass comprised of completely liquefied soil or blocks of  intact material riding on a layer of liquefied soil Flow develop in loose saturated sand or silts or relatively  steep slope (>3 degree) Flow failure
Lateral spread and Ground oscillation Liquefaction at depth-decouple overlaying soil layer from the underlying  ground Lateral displacement of large superficial blocks of  soil as a result of  liquefaction of subsurface layer and Allowing  upper soil to oscillate  back and forth / up and down in the form of  ground wave Displaced ground-Break up internally  causing fissures, scarps etc in the  form of  surface failure
Loss of bearing strength Large deformation occur within the soil allowing the structure to settle & tip  e.g, 1964 Niigata earthquake, Japan-Most spectacular bearing failure
Soil conditions  in Areas where  Liquefaction  has  occurred : Case Study:  Niigata Earthquake  Kawangishicho apartment complex, tipped by 60 degree
Survey of damaged structure (Liquefaction Zone) Zone Damage Soil Characteristics Water table Remark A No damage (Coastal dune area) Dense Sand soil up to depth of 100 ft At great depth from ground level Type of structure: Same Extent of damage: Different Reason: Characteristics of  under lying sand :  Different ii)  Type of  foundation :  Different   B Relatively light damage (Low land area)  Medium to light  Sand soil up to depth of 100 ft Depth of water table less than ‘A’ C Damage and Liquefaction (Low land area) Medium to light  Sand soil up to depth of 100 ft Depth of water table less than ‘A’ But similar to ‘B’
Standard Penetration Resistance Test  (Zone-B & C-Comparison of soil condition) Average Penetration Resistance:  Same  up to  15 ft  in zone  B & C Average Penetration Resistance:  More below 15   ft  depth in  zone-B  (Sand in zone-B are denser than those in zone- C) Sand below 45 ft in both zone: Relatively dense & unlikely to be  involved in liquefaction Difference in Penetration resistance   of  sand in depth range from  15 ft to 45 ft  is  responsible for the major difference   in  foundation and liquefaction behaviour in two zones
Soil Foundation Condition and Building Performance  (Zone-C-Range of penetration resistance:heavy damage zone ) Variation  of Penetration resistance with depth  falls within shaded area  Standard Penetration Resistance: Top 25 ft: Generally less than 15 and sometimes less than 5  Conclusion:  N =28  at the base of the foundation , required, To  prevent major damage
Classification of Extent of Damage for each Building (Zone-C)   Buildings Foundation Supported on Shallow spread footing foundations (Number: 63) Supported on Piles  (Number: 122) Extent of damage due to foundation failure ( Category-I to Category-IV) Category-I:No damage to Building (Tilt: upto 20 min, Settlement: upto 8 inch)  Category-IV: Heavy damage to Building (Tilt: upto 2.3 degree, Settlement: upto 3 ft)
 
Relationship between N at the base of Foundation and Extent of Damage
Relationship between depth of pile, ‘N’  of sand at pile tip and Extent of Damage (Zone-C)
 
 
Case Study :  Gujrat Earthquake, 2001 Soil Condition S.No. Region Type of Soil 1 Ahmedabad and Surrounding region Alluvial belt 2 Bhuj and Surrounding region Silty sand 3 Coastal area (Kandla) Soft clay 4 South Gujrat Expansive Clay
Condition of soil before and after earthquake (Relative density of sand with depth) Change in density observed Increase in density observed upto 5m depth from ground surface Decrease in density from 10-15m depth from ground surface Change in density of sand under saturation during vibration cause for liqufaction and possible reason for large differential settlement at Ahmedabad
D vs depth of layer of three section charaterized by predominant period T p  of microseismic vibrations  Damage  Zone A-Minor,  Zone B- Moderate,  Zone C- Heavy Direct co-relation exists between quality of ground, dynamic characteristics and anticipated consequences of earthquake
Liquefaction Analysis Objective : To ascertain if the soil has the ability or potential to liquefy during an earthquake Assumption : Soil Column move horizontally as a rigid body in response to maximum horizontal acceleration a max  exerted by the earthquake  at ground surface
At equilibrium: Horizontal seismic force  = Max.  shear force at the base of column ( τ max ) Horizontal seismic force = Mass x Accl. = [( γ t  .z)/g]a max  =  σ vo  (a max /g) =  τ max Mass = W/g = ( γ t  .z)/g =  σ vo  /g If effective  vertical stress =  σ ’ vo  ,  Then  ( τ max  /  σ ’ vo  ) =  ( σ vo  /  σ ’ vo  )(a max /g) In  reality, during an earthquake, soil  column does not act as a rigid body ( τ max  /  σ ’ vo  )  = r d  ( σ vo  /  σ ’ vo  )(a max /g) r d  ~ 1- 0.012z ,  also depends upon the magnitude of the earthquake
Conversion of irregular earthquake record to an equivalent series  of uniform stress cycle  by assuming the following:  τ av  =  τ cyc  = 0.65 τ max  = 0.65 r d  ( σ vo  /  σ ’ vo  )(a max /g) To felicitate liquefaction analysis, define a dimensionless parameter CSR or SSR =  τ cyc  /  σ ’ vo  = 0.65 r d  ( σ vo  /  σ ’ vo  )(a max /g) CSR  = Cyclic stress ratio,  SSR = Seismic stress ratio FS  = Factor of safety against liquefaction  = CRR/CSR CRR=  Cyclic resistance ratio Time history of shear stress during earthquake for liquefaction analysis
Cyclic resistance ratio   Represents   liquefaction resistance of soil Data used: EQ ~ 7.5, Line represents dividing line  Three lines contain- 35, 15 or ≤ 5 % fine Data to the left of each line  indicate field liquefaction  Data to the right of each  line indicate no liquefaction  FS = CRR/CSR FS = Factor of safety against liquefaction
Evaluation of liquefaction potential CSR  = Cyclic stress ratio,  CRR=  Cyclic resistance ratio FS  = Factor of safety against liquefaction  = CRR/CSR=  CSR L /CSR =  τ cyc,L  /  τ cyc
Liquefaction Analysis: Niigata 1964 EQ A  site in Japan had the measured SPT resistance as given in the table. The  SPT procedure used in Japan delivered about 72% of the theoretical free  fall energy of the sampler. Assuming that the sands have an average void  ratio of 0.44 and that the water table is at a depth of 1.5m, determine the  extent to which the liquefaction would have been expected in 1964 Niigata  EQ (M=7.5) if the  peak horizontal acceleration in the ground surface  was 0.16g.  D (m) N m D N m D N m D N m D N m 1.2 7 5.2 5 9.2 14 13.2 11 17.2 5 2.2 4 6.2 9 10.2 9 14.2 11 18.2 6 3.2 3 7.2 12 11.2 23 15.2 24 19.2 4 4.2 3 8.2 12 12.2 13 16.2 27 20.2 38
Standard penetration test (SPT) (N 1 ) 60  = (N m  C N )(E m /0.60E ff ) (N 1 ) 60  = Corrected standard penetration resistance (N):To normalize the N value to an overburden pressure of 100kPa and to correct it to an  energy ratio of 60% Energy ratio  is the average ratio of the  actual energy  delivered by safety hammer to the  theoretical  free fall  energy N m  = Measured penetration resistance C N  = Overburden correction factor E m  = Actual hammer energy E ff  = Theoretical free fall hammer energy
Void ratio = 0.44, Gs = 2.7,   Dry and submerged densities 1.874  Mg/m 3  1.180 Mg/m 3    σ vo ’ = Vertical Effective stress at  6.2 m depth = [(1.5m)(1.874 Mg/m 3 )+(4.7m)(1.180Mg/m 3 )](9.81 m/sec 2 ) = 82kPa σ vo  = Total Vertical stress at  6.2 m depth = [(1.5m)(1.874 Mg/m 3 )+(4.7m)(2.180Mg/m 3 )](9.81 m/sec 2 ) = 128.1kPa C N   = {1/(82kPa)[(0.01044 ton/ft 2 )/kPa]} 0.5  = 1.08 (N 1 ) 60   = N m  C N  (E m /0.60 E ff )  = (9)(1.08)(0.72 E ff /0.60 E ff )= 11.7 at  6.2 m depth
SPT overburden correction factor & values of (N 1 ) 60
τ av  =  τ cyc  = 0.65 τ max  = 0.65 r d  ( σ vo  /  σ ’ vo  )(a max /g)  r d  = Stress reduction factor = 0.960 at 6.2m depth=C D
Cyclic Shear Stress  τ cyc  = 0.65 r d  ( σ vo  )(a max /g)  (6.2m depth) =0.65(0.960)(128.1)(0.16g/g) = 12.8 kPa cyclic shear stress required  to initiate liquefaction  depends on liquefaction  resistance of the soil =  Liquefaction resistance  characterized by (N 1 ) 60   CSR M=7.5 = 0.130  when (N 1 ) 60  = 11.7 at  6.2m depth
Magnitude Correction Factor for Cyclic Stress approach:  CSR M  /CSR M=7.5 Magnitude of Niigata EQ = 7.5  CSR M  /CSR M=7.5  =1 CSR =  τ cyc  /  σ ’ vo  = 0.65 r d  ( σ vo  /  σ ’ vo  )(a max /g) Cyclic stress ratio required for liquefaction  τ cyc,L  = CSR L ( σ ’ vo ) = (0.130)(82.0)=10.7 kPa [CSR L = (CSR M=7.5 )(1.0)= 0.130(1.0)= 0.130] FS   = Factor of safety against liquefaction  =  CSR L /CSR =  τ cyc,L  /  τ cyc  = 10.7/12.8= 0.84 [At a depth of 6.2 m]
Details of calculation
Extensive liquefaction observed for upper 8-10m & at greater depth  Peak horizontal acceleration at Niigata  0.2g to 0.3g  (> 0.16g  ) Extensive liquefaction predicted  in this problem is consistent  with actual observation in 1964 Niigata earthquake
Modified Chinese Criteria for liquefaction  Assessment Criteria for Soil to liquefy: Clay Fraction < 15 %,  Liquid Limit < 35 %,  Moisture Content > 0.9 LL
SAFETY AGAINST LIQUEFACTION Zone Depth below ground level ‘ N’ value III, II Up to 5 m 15 III, II Up to 10 m 25 II (For important structure) Up to 5 m 10 II (For important structure) Up to 10 m 20
Liquefaction Potential Damage Range of SPT N corrected Potential Damage 0-20 High 20-30 Medium > 30 No Significant Damage
What are the options for liquefaction mitigations? Strengthen structures to resist predicted ground movements (if small) Select appropriate foundation type and depth including foundation modification of existing structure Stabilize soil to eliminate the potential for liquefaction or to control its effects
Counter measures against Liquefaction Densification Vibro-floatation Blasting Stabilization  of soils Filtration (drainage) Lowering of Ground water Table Application of dead weight  Mitigation of lateral flow by providing baffle walls Reinforced Earth
Uttarkashi Earthquake, 1991 Site: National Highway (NH-58)at Byasi (30 km from Rishkesh towards Badrinath in Garhwal Himalaya): Agency: BRO Geo-synthetic  Retaining Wall (Height-11m, Length- 19.5 m) Location of Existing Retaining Wall of the area
Cross-section(Retaining Geogrid Reinforced cohesionless backfill)
Field Performance of wall 4 O.P. Fixed in the Wall: To monitor the  lateral movement of wall top away from backfill  using Electronic Distance Meter for a  period of 36 months
Average Lateral Deflection of wall with time Stable equilibrium: 700 days Major part of total lateral movement (60~70%) : Short span of 45 days Active earth pressure exerted on wall due to ground shaking  by  Uttarkashi earth quake 1991 Cost: 79% of the cost of retaining wall with conventional earth fill
Hyogoken Nambu Earthquake  1995 Height of wall – 4 to 8 m Conventional Retaining Wall – suffered maximum damage  Geo-synthetic reinforced soil  retaining wall –Performed very well  (due to relatively high ductility  of the wall)
Preloading for oil tanks Site:500 km from the sea shore on a coastal alluvial Plain, 5 km south west of THESSALONIKI  in Northern Greece, area moderately seismic active Pre-loading-Aug. 1979 to June, 1980 Table: Change in the Variation caused by Pre Loading B- Before Preloading, A – After Preloading   Depth Range (Metre)  SPT Resistance (Bloe/0.3m) B  A 0  -  5.5 6  22 5.5 -  8.0 22  34 8.0 -  26.0 10  39
Preloading for Grain Silos   at city THESSALONIKI in north Greece The continuity of settlement time curve was not upset , atleast not appreciably earthquake in 1978  The time rate of settlement  versus time curves does not show however a kink
Rokko & Port (Kobe) Ground improvement : Pre loading /Vertical drain/Sand compaction pile  Untreated ground:  N  -  8 to 15  Subsidence:  30 to 100 cm. (Avg. 50) Treated ground:  N  -  25 or more  Subsidence:  less than 5 cm.
Foundation of modern building that survived earthquake Concrete slab without piles (b) The same at deeper depth (c ) Concrete foundation  grillage on wood built up piles The same but with concrete piles Foundation grillage  suspended by bolts  on concrete piles 1 – Street Level; 2 – Level of compacted soil
Can Liquefaction be predicted? Occurrence of liquefaction can’t be predicted Possible to identify areas giving detailed information that have the potential for liquefaction Mapping of liquefaction potential on a regional scale Maps exists for many regions in USA and Japan  Liquefaction potential map : complied by  superimposing  a  liquefaction susceptibility  map with  liquefaction opportunity map liquefaction susceptibility: capacity of soil to resist liquefaction (Controlling factor: soil type, density and water table) liquefaction opportunity: A function of the intensity of seismic shaking or demand placed on the soil (factor affecting opportunity: Frequency of earthquake occurrence, intensity of seismic ground shaking)
Criteria for liquefaction potential map Area known to have experienced liquefaction during historic earthquakes Area containing liquefaction susceptible material that are saturated , nearly saturated or expected to become saturated Area having sufficient existing geotechnical data indicating the soil are potentially liquefiable Area underlain with saturated geologically young sediments (< 1000 to 15000 year old)
Is it possible to prepare for liquefaction ? Possible to identify areas potentially subject to liquefaction with hazard zone map Emphasis in terms of developing appropriate public policy or selecting mitigation technique in area of major concern Use of hazard map by public and private owners the seriousness of expected damage and most vulnerable structure Using this map local government could designate liquefaction potential areas, and require by ordinance, site investigation and possible mitigation techniques for properties in these area particularly underground pipes and critical transportation routes
Acknowledgements The author wishes to acknowledge all the various sources used and especially Principle of Soil Dynamics (by Das and Ramana, CENGAGE Learning), and paper published by Seed et al. in various Journal/Book at different times during the preparation of this presentation which aided and enhanced the quality either in the form of information, data, figure, photo, graph or table.  Thanks for your attention

More Related Content

PPT
General Geotechnical Presentation
PPTX
Shear strength of soil
PDF
Consolidation of Soil
PPT
site investigation
PDF
Bearing capacity of shallow foundations by abhishek sharma
PPTX
Liquefaction and liquefaction potential
PPTX
Earthquake engineering presentation
PPT
SOIL EXPLORATION
General Geotechnical Presentation
Shear strength of soil
Consolidation of Soil
site investigation
Bearing capacity of shallow foundations by abhishek sharma
Liquefaction and liquefaction potential
Earthquake engineering presentation
SOIL EXPLORATION

What's hot (20)

PDF
Laterally Loaded Piles
PPSX
Geotechnical Engineering-II [Lec #17: Bearing Capacity of Soil]
PPSX
Geotechnical Engineering-II [Lec #13: Elastic Settlements]
PPT
Subsurface Investigation
PDF
Foundation design part_1
PDF
Testing of hardened concrete
 
PDF
Permeability of Soil
PPSX
Geotechnical Engineering-II [Lec #7A: Boussinesq Method]
PPTX
Sheet pile presentation
PPTX
Shear strength of soil
DOC
shear strength of soil
PPT
Soil Structure Interaction.ppt
PDF
5 effective stress concept
PPT
Soil Exploration
PPTX
Basics of soil mechanics
PDF
Lecture 2 bearing capacity
PPTX
Introduction and types of soil mechanics
PPTX
Coffer dam and its type
PDF
Pile Foundations
PPSX
Geotechnical Engineering-II [Lec #0: Course Material]
Laterally Loaded Piles
Geotechnical Engineering-II [Lec #17: Bearing Capacity of Soil]
Geotechnical Engineering-II [Lec #13: Elastic Settlements]
Subsurface Investigation
Foundation design part_1
Testing of hardened concrete
 
Permeability of Soil
Geotechnical Engineering-II [Lec #7A: Boussinesq Method]
Sheet pile presentation
Shear strength of soil
shear strength of soil
Soil Structure Interaction.ppt
5 effective stress concept
Soil Exploration
Basics of soil mechanics
Lecture 2 bearing capacity
Introduction and types of soil mechanics
Coffer dam and its type
Pile Foundations
Geotechnical Engineering-II [Lec #0: Course Material]
Ad

Viewers also liked (20)

PDF
137518876 bearing-capacity-from-spt
PDF
Geotechnical testign methods ii as
PPTX
Geotechnical Aspects
PPT
A Practical Reliability-Based Method for Assessing Soil Liquefaction Potential
PPT
rk Effect of water table on soil During construction
PPTX
Dewatering Equipment By Satyam Dewatering Systems, Chennai
PDF
Preene Groundwater Consulting - Practice Profile
PDF
Composites murali
PPTX
Porous concrete
PPT
Foundation.pptmahesh
PPT
Soil dynamics
PPTX
Electrokinetic geosynthetics
PPTX
PPT
Utilization of plastic waste for improving the subgrades in flexible pavements
PPTX
Groundwater Control for Construction
PPTX
Numerical Question on Terzaghi Bearing Capacity Theory, Meyerhof Bearing Capa...
PPT
Earthquake Resisting Building Structur
PPTX
Liquefaction final
PPTX
Liquefaction of Soil Geotech
137518876 bearing-capacity-from-spt
Geotechnical testign methods ii as
Geotechnical Aspects
A Practical Reliability-Based Method for Assessing Soil Liquefaction Potential
rk Effect of water table on soil During construction
Dewatering Equipment By Satyam Dewatering Systems, Chennai
Preene Groundwater Consulting - Practice Profile
Composites murali
Porous concrete
Foundation.pptmahesh
Soil dynamics
Electrokinetic geosynthetics
Utilization of plastic waste for improving the subgrades in flexible pavements
Groundwater Control for Construction
Numerical Question on Terzaghi Bearing Capacity Theory, Meyerhof Bearing Capa...
Earthquake Resisting Building Structur
Liquefaction final
Liquefaction of Soil Geotech
Ad

Similar to Geotechnical Aspects of EQ Resistant Design (20)

PDF
Seismic Analysis of Structures under Different Soil Conditions
PDF
A review on: The influence of soil conditions on the seismic forces in RC bui...
PPTX
Disaster resistant architecture
PDF
Effect of soil structure interaction on high rise r.c regular frame structur...
PDF
Lec03 Earthquake Force Using Response Specturum Method (1) (Earthquake Engine...
PDF
Failure of foundation due to earthquake
PDF
Soil structure interaction effect on dynamic behavior of 3 d building frames ...
DOCX
7-soil dynamics- presentation and question answer
PDF
Pile response due to earthquake induced lateral spreading
PDF
Pile response due to earthquake induced lateral spreading
PDF
Influence of stratified soil on seismic response of pile supported building
PDF
IRJET- Behaviour of Shallow Foundation for Blast Load on Multi-Story Building...
PPTX
INFLUENCE OF SOIL-STRUCTURE INTERACTION ON RESPONSE OF A MULTI-STORIED BUILDI...
PPTX
Soil dynamics introduction
PDF
Comparative Study of SMRF Structure in the Different Conditions of Soil: A Re...
PPT
Earthquake engineering : Causes, Analysis and Mitigation.
PDF
DYNAMIC ANALYSIS OF HIGH RISE STRUCTURES UNDER DIFFERENT TYPE OF REINFORCED C...
PDF
Seismic Vulnerability of Plan Irregular RC Buildings with Soil-Structure Inte...
PDF
IRJET- The Effect of Soil-Structure Interaction on Raft Foundation
PDF
Dynamic analysis of_high_rise_structures
Seismic Analysis of Structures under Different Soil Conditions
A review on: The influence of soil conditions on the seismic forces in RC bui...
Disaster resistant architecture
Effect of soil structure interaction on high rise r.c regular frame structur...
Lec03 Earthquake Force Using Response Specturum Method (1) (Earthquake Engine...
Failure of foundation due to earthquake
Soil structure interaction effect on dynamic behavior of 3 d building frames ...
7-soil dynamics- presentation and question answer
Pile response due to earthquake induced lateral spreading
Influence of stratified soil on seismic response of pile supported building
IRJET- Behaviour of Shallow Foundation for Blast Load on Multi-Story Building...
INFLUENCE OF SOIL-STRUCTURE INTERACTION ON RESPONSE OF A MULTI-STORIED BUILDI...
Soil dynamics introduction
Comparative Study of SMRF Structure in the Different Conditions of Soil: A Re...
Earthquake engineering : Causes, Analysis and Mitigation.
DYNAMIC ANALYSIS OF HIGH RISE STRUCTURES UNDER DIFFERENT TYPE OF REINFORCED C...
Seismic Vulnerability of Plan Irregular RC Buildings with Soil-Structure Inte...
IRJET- The Effect of Soil-Structure Interaction on Raft Foundation
Dynamic analysis of_high_rise_structures

More from Guru Nank Dev Engineering College, Ludhiana, Punjab, India-141006 (13)

PPTX
Earthquake Hazards: Effects and its mitigation
PPT
Estimation of CBR value using Dynamic Cone Penetrometer
PPT
Shear strength characteristics of fiber reinforced fly ash
PPT
Utilization of plastic wastefor improving the subgrades in flexible pavements
PPT
The Earthquake Tips to make Safe Built Environment
PPT
Challenges for Geotechnical Engineering Education

Recently uploaded (20)

PDF
Hybrid model detection and classification of lung cancer
PDF
project resource management chapter-09.pdf
PPTX
observCloud-Native Containerability and monitoring.pptx
PPT
Module 1.ppt Iot fundamentals and Architecture
PDF
DASA ADMISSION 2024_FirstRound_FirstRank_LastRank.pdf
PDF
TrustArc Webinar - Click, Consent, Trust: Winning the Privacy Game
PDF
ENT215_Completing-a-large-scale-migration-and-modernization-with-AWS.pdf
PDF
August Patch Tuesday
PDF
A novel scalable deep ensemble learning framework for big data classification...
PPTX
Chapter 5: Probability Theory and Statistics
PDF
Profit Center Accounting in SAP S/4HANA, S4F28 Col11
PDF
Developing a website for English-speaking practice to English as a foreign la...
PDF
Transform Your ITIL® 4 & ITSM Strategy with AI in 2025.pdf
PPTX
MicrosoftCybserSecurityReferenceArchitecture-April-2025.pptx
PDF
WOOl fibre morphology and structure.pdf for textiles
PDF
Architecture types and enterprise applications.pdf
PPTX
TechTalks-8-2019-Service-Management-ITIL-Refresh-ITIL-4-Framework-Supports-Ou...
PDF
Getting Started with Data Integration: FME Form 101
PDF
DP Operators-handbook-extract for the Mautical Institute
PDF
STKI Israel Market Study 2025 version august
Hybrid model detection and classification of lung cancer
project resource management chapter-09.pdf
observCloud-Native Containerability and monitoring.pptx
Module 1.ppt Iot fundamentals and Architecture
DASA ADMISSION 2024_FirstRound_FirstRank_LastRank.pdf
TrustArc Webinar - Click, Consent, Trust: Winning the Privacy Game
ENT215_Completing-a-large-scale-migration-and-modernization-with-AWS.pdf
August Patch Tuesday
A novel scalable deep ensemble learning framework for big data classification...
Chapter 5: Probability Theory and Statistics
Profit Center Accounting in SAP S/4HANA, S4F28 Col11
Developing a website for English-speaking practice to English as a foreign la...
Transform Your ITIL® 4 & ITSM Strategy with AI in 2025.pdf
MicrosoftCybserSecurityReferenceArchitecture-April-2025.pptx
WOOl fibre morphology and structure.pdf for textiles
Architecture types and enterprise applications.pdf
TechTalks-8-2019-Service-Management-ITIL-Refresh-ITIL-4-Framework-Supports-Ou...
Getting Started with Data Integration: FME Form 101
DP Operators-handbook-extract for the Mautical Institute
STKI Israel Market Study 2025 version august

Geotechnical Aspects of EQ Resistant Design

  • 1. Geotechnical Aspects in Earthquake Resistant Design by Dr. J.N.Jha Professor & Head Department of Civil Engineering Guru Nanak Dev Engineering College Ludhiana-141006 Email: jagadanand@gmail.com
  • 2. Conception or rather Misconception of Structure Designer Structure Designer believes erroneously most of the time that superstructure needs to be strengthened more in poor soil than in a good soil. Dynamic behaviour of soil rarely receives any attention of structure engineer as compared to dynamic behaviour of structure.
  • 4. Japan earthquake 1964: Niigata- Mag. 7.5
  • 5. Tokachi-oki Earthquake: 2003 The Damage of Sewerage Structures kushiro (Town) Lifted up manhole and gushed soil during liquefaction Lifted up manhole
  • 6. Caracas Earthquake 1967: Mag. 6.6
  • 7. Chile Earthquake 1960 : Island nearValdivia- Mag. 9.5
  • 8. Alaska Earthquake 1964:Mag. 9.2
  • 9. Observed Damage from Earthquakes Chile earthquake 1960 : An island near Valdivia- Mag.- 9.5 Large settlements and differential settlements of the ground surface - Compaction of loose granular soil by EQ Alaska earthquake 1964: Turnagain heights landslide- Mag.- 9.2 Major landslide - combination of dynamic stresses and induced pore water pressur e Japan earthquake 1964: Niigata -Mag.- 7.5 Settlement and tilting of structures - liquefaction of soil Caracas earthquake 1967- Mag.- 6.6 Response of building during EQ found to depend on the thickness of soil under the building .
  • 10. Inference and Attention: Influence of local soil condition on shaking and damage intensity during earthquake affects the stability of structure . Large scale tilting of well built houses in the Niigatta earthquake of 1964 focussed the attention of profession on problems of soil dynamics: Requiring a careful attention by Engineers.
  • 11. Objective of Earthquake Resistant Design Ensuring structural reliability without structural damage due to ground shaking of moderate intensities. Special structures like high level bridges, tall dams , Nuclear Power Plant need specific design procedures (Site specific) supported by detailed investigation.
  • 12. Geotechnical Aspects of Earthquake Resistant Design Geotechnical Aspects of Earthquake Resistant Design of foundation of structures and other soil retaining structures of soil depends on: Dynamic stress deformation and strength characteristics Earth pressure problems and retaining wall Dynamic bearinng capacity and design of shallow foundation Liquefaction of soil Machine foundations
  • 13. Influence of local soil conditions on Acceleration(Cause for damage during EQ) Some Basic Information : Acceleration Response Spectrum A graph showing the maximum accelerations induced in structures with fundamental period ranging from 0 to several seconds Velocity Response Spectrum A plot showing relationship between maximum velocity with fundamental period of the structure Relation between Velocity Spectrum ( S v )and Acceleration Spectrum ( S a ) S v ≈ (T/2 π )S a T = fundamental period of the structure Value of horizontal peak ground acceleration = 0.6g ? Physical meaning :Movement of the ground can cause a maximum horizontal force on a rigid structure equal to 60% of its weight
  • 14. Site approximately same distance from the zone of energy release – 1957 San Francisco Earthquake
  • 15. Site approximately same distance from the zone of energy release – 1957 San Francisco Earthquake
  • 16. Effect of Soil Conditions on form of Response Spectra –Site A
  • 17. Effect of Soil Conditions on form of Response Spectra –Site B
  • 18. Effect of Soil Conditions on form of Response Spectra – Site C
  • 19. Effect of Soil Conditions on form of Response Spectra – Site D
  • 20. Effect of Soil Conditions on form of Response Spectra – Site E
  • 21. Effect of Soil Conditions on form of Response Spectra – Site F
  • 22. Effect of Soil Conditions on form of Response Spectra – Site A - F
  • 23. Development of Peak/Max. Acceleration Clay (soft): Moulded easily at natural water content and readily excavated Clay (firm): Moulded by substantial pressure at natural water content and excavated with a spade Out of six four spectra obtained from the same city in the same EQ at a considerable distance from the epicenter To eliminate the influence of different amplitudes of surface acceleration, plot made between period and normalized acceleration (Spectral Acceleration/Maximum Ground Acceleration Sites (Increasing order of softness) Period (sec) (Maximum spectral acceleration) A 0.3 B 0.5 C 0.6 D 0.8 E 1.3 F 2.5
  • 24. Clay layer : Amplified seismic shock of glacial till (Both event) Peat deposits : Amplified seismic shocks (Only for distant shock)
  • 25. Time taken for each complete cycle of oscillation is called FUNDAMETNAL NATURAL PERIOD (T) of the building Time taken by the wave to complete one cycle of motion is called PERIOD OF EQ WAVE (0.03 to 33 seconds) Short EQ wave have large response on short period buildings Long EQ wave have large response on long period buildings Building Response variation during Earthquake
  • 26. T (Inherent property of the building) depends on the building flexibility and mass,Any alteration made to the building will change its “T” Bldg (3-5 storey); damage intensity higher in area with underlying soil cover 40-60 m thick and minimal in areas with larger thickness of soil cover Bldg (10-14 storey); damage intensity maximum when soil cover in the range of 150-300m and small for lower thickness of soil cover Soil plays the role of filter allowing some ground waves to pass through and filtering the rest.
  • 27. Damage potential coefficient varies with building characteristics and soil depth
  • 28. Relationship between building characteristics, soil depth and damage potential coefficient (S v /k) Structure Fundamental period Damage intensity (D r ) 2 to 3 storey 0.2 sec Remains same regardless of soil depth 4 to 5 storey 0.4 sec Max. damage intensity expected at soil depth of about 20 to 30 m 10 to 12 storey 1.0 sec Damage intensity expected to increase with soil depth up to 150 m or so 15 to 20 storey Damage intensity even greater for soil depth of 150 to 250 m & relatively low for soil depth up to 80 m or so
  • 29. Dynamic bearing capacity Soil dynamics: Engineering properties and behaviour of soil under dynamic stress Factors to be considered for estimation of bearing capacity under dynamic condition: Nature of variation of the magnitude of the loading pulse Duration of the pulse Strain rate deformation of soil during deformation
  • 30. For both static, dynamic and seismic cases bearing capacity failure of foundation grouped into three categories: General shear failure Punching shear failure Local shear failure Various theories concerning dynamic bearing capacity have been presented in last 50 years but definition of dynamic bearing capacity is yet to evolve till date
  • 31. Ultimate bearing capacity of continuous shallow foundation (static case)
  • 33. Static case Seismic case q u = q N q + ½( γB N γ ) q = γD f N q ,N γ = bearing capacity factors N q and N γ = f (Ø’) Ø’= tan-1[(0.67+ R D - 0.75R 2 D )tan Ø] q uE = q N qE + ½( γB N γE ) q = γD f N qE , N γE = bearing capacity factors N qE and N γE = f (Ø’, tanθ) tanθ = k h /(1- k v ) k h &k v =horizontal and vertical coefficient of acceleration α AE & α PE = Inclination angles for active and passive pressure conditions
  • 34. Static bearing capacity factors Seismic bearing capacity factors Ø N q N γ 0 1 0 10 2.47 1.22 20 6.40 5.39 30 18.40 22.40 40 64.2 109.41 Ø N q N γ 0 1 0 10 2.4 1.4 20 5.9 6.4 30 16.5 23.8 40 59.0 112.0
  • 35. Variation of N q and N γ with Ø’ Variation of N γE /N γ and N qE / N q with tanθ and Ø’
  • 36. Prediction of dynamic load- settlement relationship for foundations on clay (Jackson and Halada,1964) For any given value of S stat /B, multiply Q/B 2 c u by the strain rate factor (=1.5) and plot it in the same graph
  • 37. Settlement of strip footing due to an earthquake S Eq (m) = (0.174)(V 2 /Ag)[k h * /A] -4 tan α AE α AE = Inclination angles for active pressure conditions V= peak velocity for the design earthquake (m/sec) A = acceleration coefficient for the design earthquake g = acceleration due to gravity (9.81 m/sec 2 ) k h /(1- k v ) = k h * , if k v = 0
  • 38.  
  • 39. Geotechnical Aspects of Earthquake resistant design Liquefaction of Soil Soils behave like a liquid. How and why? To understand the above phenomenon: Some understanding of basics required : Total stress, Pore water pressure Effective stress
  • 40. Total stress, Pore water pressure and Effective stress Figure-1 Figure-2 Case Total Pressure Pore Pressure Effective Pressure Figure- 1 475 150 325 Figure- 2 475 250 225
  • 41.  
  • 42. Liquefaction of Soil Shear stress, τ = c + σ n tanø Effective stress gives more realistic behaviour of soil, and can be expressed as τ = c’ + ( σ n –u)tanø ’ During the ground motion due to an earthquake, static pore pressure may increase by an amount u dyn τ = c’ + ( σ n – u + u dyn )tanø’ Let us consider a situation when u + u dyn = σ n , then τ = c’ In cohesionless soil, c’= 0, hence τ = 0 Soil loose its strength because of loss of effective stress Saturated sand when subjected to ground vibration, it tends to compact and decrease in volume ; if drainage is unable to occur, the tendency to decrease in volume results in an increase in pore water pressure and when this becomes equal to the overburden pressure effective stress becomes equal to zero, sand looses its strength completely and it develops a liquefied state. φΦγ
  • 43.  
  • 44. Influence of soil conditions on liquefaction potential
  • 45. The Damage of Embankment Structures Toyokoro Collapsed Embankment
  • 46. Place where Embankment was collapsed Abashiri River (1) Shibetsu River (6) Kushiro River (5) Kiyomappu River (2) Tokachi River (66) Under investigation Lateral Spread was observed ( ) : the number of collapsed points Tokachi River The Damage of Embankment Structures
  • 47. Toyokoro Liquefied Soil Collapsed Embankment The Damage of Embankment Structures Liquefied Soil
  • 48. Failure Mode   (notice : this is only concept) Liquefied Stratum Embankment Settlement Land Slide Lateral Spread The Damage of Embankment Structures
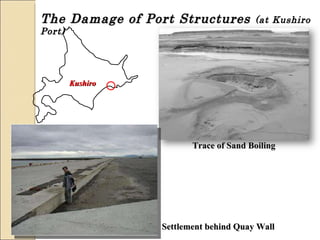
  • 49. The Damage of Port Structures (at Kushiro Port) Kushiro Settlement behind Quay Wall Trace of Sand Boiling
  • 51.  
  • 53. Alaska 2002 Boca del Tocuyo, Venezuela, 1989
  • 54. Lateral spread at Budharmora (Bhuj, 2001)
  • 55. Arial view of kandla port, Marked line sows ground crack and sand ejection (Gujrat Earthquake 2001)
  • 56. Adverse effects of liquefaction Most catastrophic ground failure Lateral displacement of large masses of soil Mass comprised of completely liquefied soil or blocks of intact material riding on a layer of liquefied soil Flow develop in loose saturated sand or silts or relatively steep slope (>3 degree) Flow failure
  • 57. Lateral spread and Ground oscillation Liquefaction at depth-decouple overlaying soil layer from the underlying ground Lateral displacement of large superficial blocks of soil as a result of liquefaction of subsurface layer and Allowing upper soil to oscillate back and forth / up and down in the form of ground wave Displaced ground-Break up internally causing fissures, scarps etc in the form of surface failure
  • 58. Loss of bearing strength Large deformation occur within the soil allowing the structure to settle & tip e.g, 1964 Niigata earthquake, Japan-Most spectacular bearing failure
  • 59. Soil conditions in Areas where Liquefaction has occurred : Case Study: Niigata Earthquake Kawangishicho apartment complex, tipped by 60 degree
  • 60. Survey of damaged structure (Liquefaction Zone) Zone Damage Soil Characteristics Water table Remark A No damage (Coastal dune area) Dense Sand soil up to depth of 100 ft At great depth from ground level Type of structure: Same Extent of damage: Different Reason: Characteristics of under lying sand : Different ii) Type of foundation : Different B Relatively light damage (Low land area) Medium to light Sand soil up to depth of 100 ft Depth of water table less than ‘A’ C Damage and Liquefaction (Low land area) Medium to light Sand soil up to depth of 100 ft Depth of water table less than ‘A’ But similar to ‘B’
  • 61. Standard Penetration Resistance Test (Zone-B & C-Comparison of soil condition) Average Penetration Resistance: Same up to 15 ft in zone B & C Average Penetration Resistance: More below 15 ft depth in zone-B (Sand in zone-B are denser than those in zone- C) Sand below 45 ft in both zone: Relatively dense & unlikely to be involved in liquefaction Difference in Penetration resistance of sand in depth range from 15 ft to 45 ft is responsible for the major difference in foundation and liquefaction behaviour in two zones
  • 62. Soil Foundation Condition and Building Performance (Zone-C-Range of penetration resistance:heavy damage zone ) Variation of Penetration resistance with depth falls within shaded area Standard Penetration Resistance: Top 25 ft: Generally less than 15 and sometimes less than 5 Conclusion: N =28 at the base of the foundation , required, To prevent major damage
  • 63. Classification of Extent of Damage for each Building (Zone-C) Buildings Foundation Supported on Shallow spread footing foundations (Number: 63) Supported on Piles (Number: 122) Extent of damage due to foundation failure ( Category-I to Category-IV) Category-I:No damage to Building (Tilt: upto 20 min, Settlement: upto 8 inch) Category-IV: Heavy damage to Building (Tilt: upto 2.3 degree, Settlement: upto 3 ft)
  • 64.  
  • 65. Relationship between N at the base of Foundation and Extent of Damage
  • 66. Relationship between depth of pile, ‘N’ of sand at pile tip and Extent of Damage (Zone-C)
  • 67.  
  • 68.  
  • 69. Case Study : Gujrat Earthquake, 2001 Soil Condition S.No. Region Type of Soil 1 Ahmedabad and Surrounding region Alluvial belt 2 Bhuj and Surrounding region Silty sand 3 Coastal area (Kandla) Soft clay 4 South Gujrat Expansive Clay
  • 70. Condition of soil before and after earthquake (Relative density of sand with depth) Change in density observed Increase in density observed upto 5m depth from ground surface Decrease in density from 10-15m depth from ground surface Change in density of sand under saturation during vibration cause for liqufaction and possible reason for large differential settlement at Ahmedabad
  • 71. D vs depth of layer of three section charaterized by predominant period T p of microseismic vibrations Damage Zone A-Minor, Zone B- Moderate, Zone C- Heavy Direct co-relation exists between quality of ground, dynamic characteristics and anticipated consequences of earthquake
  • 72. Liquefaction Analysis Objective : To ascertain if the soil has the ability or potential to liquefy during an earthquake Assumption : Soil Column move horizontally as a rigid body in response to maximum horizontal acceleration a max exerted by the earthquake at ground surface
  • 73. At equilibrium: Horizontal seismic force = Max. shear force at the base of column ( τ max ) Horizontal seismic force = Mass x Accl. = [( γ t .z)/g]a max = σ vo (a max /g) = τ max Mass = W/g = ( γ t .z)/g = σ vo /g If effective vertical stress = σ ’ vo , Then ( τ max / σ ’ vo ) = ( σ vo / σ ’ vo )(a max /g) In reality, during an earthquake, soil column does not act as a rigid body ( τ max / σ ’ vo ) = r d ( σ vo / σ ’ vo )(a max /g) r d ~ 1- 0.012z , also depends upon the magnitude of the earthquake
  • 74. Conversion of irregular earthquake record to an equivalent series of uniform stress cycle by assuming the following: τ av = τ cyc = 0.65 τ max = 0.65 r d ( σ vo / σ ’ vo )(a max /g) To felicitate liquefaction analysis, define a dimensionless parameter CSR or SSR = τ cyc / σ ’ vo = 0.65 r d ( σ vo / σ ’ vo )(a max /g) CSR = Cyclic stress ratio, SSR = Seismic stress ratio FS = Factor of safety against liquefaction = CRR/CSR CRR= Cyclic resistance ratio Time history of shear stress during earthquake for liquefaction analysis
  • 75. Cyclic resistance ratio Represents liquefaction resistance of soil Data used: EQ ~ 7.5, Line represents dividing line Three lines contain- 35, 15 or ≤ 5 % fine Data to the left of each line indicate field liquefaction Data to the right of each line indicate no liquefaction FS = CRR/CSR FS = Factor of safety against liquefaction
  • 76. Evaluation of liquefaction potential CSR = Cyclic stress ratio, CRR= Cyclic resistance ratio FS = Factor of safety against liquefaction = CRR/CSR= CSR L /CSR = τ cyc,L / τ cyc
  • 77. Liquefaction Analysis: Niigata 1964 EQ A site in Japan had the measured SPT resistance as given in the table. The SPT procedure used in Japan delivered about 72% of the theoretical free fall energy of the sampler. Assuming that the sands have an average void ratio of 0.44 and that the water table is at a depth of 1.5m, determine the extent to which the liquefaction would have been expected in 1964 Niigata EQ (M=7.5) if the peak horizontal acceleration in the ground surface was 0.16g. D (m) N m D N m D N m D N m D N m 1.2 7 5.2 5 9.2 14 13.2 11 17.2 5 2.2 4 6.2 9 10.2 9 14.2 11 18.2 6 3.2 3 7.2 12 11.2 23 15.2 24 19.2 4 4.2 3 8.2 12 12.2 13 16.2 27 20.2 38
  • 78. Standard penetration test (SPT) (N 1 ) 60 = (N m C N )(E m /0.60E ff ) (N 1 ) 60 = Corrected standard penetration resistance (N):To normalize the N value to an overburden pressure of 100kPa and to correct it to an energy ratio of 60% Energy ratio is the average ratio of the actual energy delivered by safety hammer to the theoretical free fall energy N m = Measured penetration resistance C N = Overburden correction factor E m = Actual hammer energy E ff = Theoretical free fall hammer energy
  • 79. Void ratio = 0.44, Gs = 2.7, Dry and submerged densities 1.874 Mg/m 3 1.180 Mg/m 3 σ vo ’ = Vertical Effective stress at 6.2 m depth = [(1.5m)(1.874 Mg/m 3 )+(4.7m)(1.180Mg/m 3 )](9.81 m/sec 2 ) = 82kPa σ vo = Total Vertical stress at 6.2 m depth = [(1.5m)(1.874 Mg/m 3 )+(4.7m)(2.180Mg/m 3 )](9.81 m/sec 2 ) = 128.1kPa C N = {1/(82kPa)[(0.01044 ton/ft 2 )/kPa]} 0.5 = 1.08 (N 1 ) 60 = N m C N (E m /0.60 E ff ) = (9)(1.08)(0.72 E ff /0.60 E ff )= 11.7 at 6.2 m depth
  • 80. SPT overburden correction factor & values of (N 1 ) 60
  • 81. τ av = τ cyc = 0.65 τ max = 0.65 r d ( σ vo / σ ’ vo )(a max /g) r d = Stress reduction factor = 0.960 at 6.2m depth=C D
  • 82. Cyclic Shear Stress τ cyc = 0.65 r d ( σ vo )(a max /g) (6.2m depth) =0.65(0.960)(128.1)(0.16g/g) = 12.8 kPa cyclic shear stress required to initiate liquefaction depends on liquefaction resistance of the soil = Liquefaction resistance characterized by (N 1 ) 60 CSR M=7.5 = 0.130 when (N 1 ) 60 = 11.7 at 6.2m depth
  • 83. Magnitude Correction Factor for Cyclic Stress approach: CSR M /CSR M=7.5 Magnitude of Niigata EQ = 7.5 CSR M /CSR M=7.5 =1 CSR = τ cyc / σ ’ vo = 0.65 r d ( σ vo / σ ’ vo )(a max /g) Cyclic stress ratio required for liquefaction τ cyc,L = CSR L ( σ ’ vo ) = (0.130)(82.0)=10.7 kPa [CSR L = (CSR M=7.5 )(1.0)= 0.130(1.0)= 0.130] FS = Factor of safety against liquefaction = CSR L /CSR = τ cyc,L / τ cyc = 10.7/12.8= 0.84 [At a depth of 6.2 m]
  • 85. Extensive liquefaction observed for upper 8-10m & at greater depth Peak horizontal acceleration at Niigata 0.2g to 0.3g (> 0.16g ) Extensive liquefaction predicted in this problem is consistent with actual observation in 1964 Niigata earthquake
  • 86. Modified Chinese Criteria for liquefaction Assessment Criteria for Soil to liquefy: Clay Fraction < 15 %, Liquid Limit < 35 %, Moisture Content > 0.9 LL
  • 87. SAFETY AGAINST LIQUEFACTION Zone Depth below ground level ‘ N’ value III, II Up to 5 m 15 III, II Up to 10 m 25 II (For important structure) Up to 5 m 10 II (For important structure) Up to 10 m 20
  • 88. Liquefaction Potential Damage Range of SPT N corrected Potential Damage 0-20 High 20-30 Medium > 30 No Significant Damage
  • 89. What are the options for liquefaction mitigations? Strengthen structures to resist predicted ground movements (if small) Select appropriate foundation type and depth including foundation modification of existing structure Stabilize soil to eliminate the potential for liquefaction or to control its effects
  • 90. Counter measures against Liquefaction Densification Vibro-floatation Blasting Stabilization of soils Filtration (drainage) Lowering of Ground water Table Application of dead weight Mitigation of lateral flow by providing baffle walls Reinforced Earth
  • 91. Uttarkashi Earthquake, 1991 Site: National Highway (NH-58)at Byasi (30 km from Rishkesh towards Badrinath in Garhwal Himalaya): Agency: BRO Geo-synthetic Retaining Wall (Height-11m, Length- 19.5 m) Location of Existing Retaining Wall of the area
  • 93. Field Performance of wall 4 O.P. Fixed in the Wall: To monitor the lateral movement of wall top away from backfill using Electronic Distance Meter for a period of 36 months
  • 94. Average Lateral Deflection of wall with time Stable equilibrium: 700 days Major part of total lateral movement (60~70%) : Short span of 45 days Active earth pressure exerted on wall due to ground shaking by Uttarkashi earth quake 1991 Cost: 79% of the cost of retaining wall with conventional earth fill
  • 95. Hyogoken Nambu Earthquake 1995 Height of wall – 4 to 8 m Conventional Retaining Wall – suffered maximum damage Geo-synthetic reinforced soil retaining wall –Performed very well (due to relatively high ductility of the wall)
  • 96. Preloading for oil tanks Site:500 km from the sea shore on a coastal alluvial Plain, 5 km south west of THESSALONIKI in Northern Greece, area moderately seismic active Pre-loading-Aug. 1979 to June, 1980 Table: Change in the Variation caused by Pre Loading B- Before Preloading, A – After Preloading Depth Range (Metre) SPT Resistance (Bloe/0.3m) B A 0 - 5.5 6 22 5.5 - 8.0 22 34 8.0 - 26.0 10 39
  • 97. Preloading for Grain Silos at city THESSALONIKI in north Greece The continuity of settlement time curve was not upset , atleast not appreciably earthquake in 1978 The time rate of settlement versus time curves does not show however a kink
  • 98. Rokko & Port (Kobe) Ground improvement : Pre loading /Vertical drain/Sand compaction pile Untreated ground: N - 8 to 15 Subsidence: 30 to 100 cm. (Avg. 50) Treated ground: N - 25 or more Subsidence: less than 5 cm.
  • 99. Foundation of modern building that survived earthquake Concrete slab without piles (b) The same at deeper depth (c ) Concrete foundation grillage on wood built up piles The same but with concrete piles Foundation grillage suspended by bolts on concrete piles 1 – Street Level; 2 – Level of compacted soil
  • 100. Can Liquefaction be predicted? Occurrence of liquefaction can’t be predicted Possible to identify areas giving detailed information that have the potential for liquefaction Mapping of liquefaction potential on a regional scale Maps exists for many regions in USA and Japan Liquefaction potential map : complied by superimposing a liquefaction susceptibility map with liquefaction opportunity map liquefaction susceptibility: capacity of soil to resist liquefaction (Controlling factor: soil type, density and water table) liquefaction opportunity: A function of the intensity of seismic shaking or demand placed on the soil (factor affecting opportunity: Frequency of earthquake occurrence, intensity of seismic ground shaking)
  • 101. Criteria for liquefaction potential map Area known to have experienced liquefaction during historic earthquakes Area containing liquefaction susceptible material that are saturated , nearly saturated or expected to become saturated Area having sufficient existing geotechnical data indicating the soil are potentially liquefiable Area underlain with saturated geologically young sediments (< 1000 to 15000 year old)
  • 102. Is it possible to prepare for liquefaction ? Possible to identify areas potentially subject to liquefaction with hazard zone map Emphasis in terms of developing appropriate public policy or selecting mitigation technique in area of major concern Use of hazard map by public and private owners the seriousness of expected damage and most vulnerable structure Using this map local government could designate liquefaction potential areas, and require by ordinance, site investigation and possible mitigation techniques for properties in these area particularly underground pipes and critical transportation routes
  • 103. Acknowledgements The author wishes to acknowledge all the various sources used and especially Principle of Soil Dynamics (by Das and Ramana, CENGAGE Learning), and paper published by Seed et al. in various Journal/Book at different times during the preparation of this presentation which aided and enhanced the quality either in the form of information, data, figure, photo, graph or table. Thanks for your attention