

![D6 = 20, k = .15, and g = r x ROE = .8 x .15 = .12?
C.
If P5 = your result from part B, and assuming no dividends are
paid until D6, what would be P0? P1? P2?
D.
Again, assuming the facts from part B, what is the relationship
between P2 and P1 (i.e., P2/P1)? Explain why this is the result.
E.
If k = ROE, we can show that the price P0 doesn’t depend on r.
To see this, let
g = r x ROE, and ROE = Yn / En-1, and
since r = (Yn – Dn) / Yn , then D1 = (1 – r) x Y1 and
P0
=
D1 / (k – g)
P0
=
[(1 – r) x Y1] / (k – g)
P0
=
[(1 – r) x Y1] / (k – g), but, since k = ROE = Y1 / E0](https://image.slidesharecdn.com/assignment3assignment3isdueafteryoucompletelessons9t-221031070246-8373bb63/85/Assignment-3Assignment-3-is-due-after-you-complete-Lessons-9-t-docx-3-320.jpg)
![P0
=
[(1 – r) x Y1] / (ROE – r x ROE)
P0
=
[(1 – r) x Y1] / (Y1 / E0 – r x Y1 / E0)
P0
=
[(1 – r) x Y1] / (1 – r) x Y1 / E0), and cancelling (1 – r)
P0
=
Y1 / (Y1/E0) = Y1 x (E0 / Y1) = E0
So, you see that r is not in the final expression for P0,
indicating that r (i.e., retention ration or, equivalently, dividend
policy) doesn’t matter if k = ROE.
Check that changing r from .8 to .6 does not change your answer
in part A of this question by re-calculating your result using r =
.6.
(10 marks)
9.3
You are considering an investment in the shares of Kirk's
Information Inc. The company is still in its growth phase, so it
won’t pay dividends for the next few years. Kirk’s accountant
has determined that their first year's earnings per share (EPS) is
expected to be $20. The company expects a return on equity
(ROE) of 25% in each of the next 5 years but in the sixth year
they expect to earn 20%. In the seventh year and forever into
the future, they expect to earn 15%. Also, at the end of the sixth
year and every year after that, they expect to pay dividends at a](https://image.slidesharecdn.com/assignment3assignment3isdueafteryoucompletelessons9t-221031070246-8373bb63/85/Assignment-3Assignment-3-is-due-after-you-complete-Lessons-9-t-docx-4-320.jpg)


![C.
For each security, would a return of 14% fall into the 68%
confidence interval range? If not, what confidence interval
range would it fall into, or would it be outside all three
confidence intervals?
[This is the same as asking whether a return of 14% has less
than a 68% probability of occuring by chance for that security.
If it’s not inside the 68% confidence interval, it’s unlikely to
occur, since it will only occur by chance 32% of the time. Of
course, the 99% confidence interval is much more likely to
include the observed return, simply by chance. Only 1% of the
time will it fall outside the 99% CI. Pretty rare.]
(14 marks)
10.2
Some Internet research may be required to answer this question,
although it’s not absolutely necessary.
What could you do to protect your bond portfolio against the
following kinds of risk?
A.
Risk of an increasing interest rate
B.
Risk of inflation increasing
C.
Risk of volatility in the markets
(6 marks)
10.3
You are starting a new business, and you want to open an office](https://image.slidesharecdn.com/assignment3assignment3isdueafteryoucompletelessons9t-221031070246-8373bb63/85/Assignment-3Assignment-3-is-due-after-you-complete-Lessons-9-t-docx-10-320.jpg)


Assignment 3Assignment 3 is due after you complete Lessons 9 t.docx
- 1. Assignment 3 Assignment 3 is due after you complete Lessons 9 to 11. It is worth 20% of your final grade. Prepare your responses to these assignment problems in a word processing file; put financial data in a spreadsheet file. As you complete the assignment problems for each lesson, add your responses to these files. Do not submit your answers for grading until you have completed all parts of Assignment 3. Note: In assignments, show all calculations to 4 decimal places. Lesson 9: Assignment Problems 9.1 The Constant-Growth-Rate Discounted Dividend Model, as described equation 9.5 on page 247, says that: P0 = D1 / (k – g) A. rearrange the terms to solve for: i. g; and ii. D1. As an example, to solve for k, we would do the following: 1. Multiply both sides by (k – g) to get: P0 (k – g) = D1
- 2. 2. Divide both sides by P0 by to get: (k – g) = D1 / P0 3. Add g to both sides: k = D1 / P0 + g (8 marks) 9.2 Notation: Let Pn = Price at time n Dn = Dividend at time n Yn = Earnings in period n r = retention ratio = (Yn– Dn) / Yn = 1 – Dn/ Yn = 1 - dividend payout ratio En = Equity at the end of year n k = discount rate g = dividend growth rate = r x ROE ROE = Yn / En-1 for all n>0. We will further assume that k and ROE are constant, and that r and g are constant after the first dividend is paid. A. Using the Discounted Dividend Model, calculate the price P0 if D1 = 20, k = .15, g = r x ROE = .8 x .15 = .12, and Y1 = 100 per share B. What, then, will P5 be if:
- 3. D6 = 20, k = .15, and g = r x ROE = .8 x .15 = .12? C. If P5 = your result from part B, and assuming no dividends are paid until D6, what would be P0? P1? P2? D. Again, assuming the facts from part B, what is the relationship between P2 and P1 (i.e., P2/P1)? Explain why this is the result. E. If k = ROE, we can show that the price P0 doesn’t depend on r. To see this, let g = r x ROE, and ROE = Yn / En-1, and since r = (Yn – Dn) / Yn , then D1 = (1 – r) x Y1 and P0 = D1 / (k – g) P0 = [(1 – r) x Y1] / (k – g) P0 = [(1 – r) x Y1] / (k – g), but, since k = ROE = Y1 / E0
- 4. P0 = [(1 – r) x Y1] / (ROE – r x ROE) P0 = [(1 – r) x Y1] / (Y1 / E0 – r x Y1 / E0) P0 = [(1 – r) x Y1] / (1 – r) x Y1 / E0), and cancelling (1 – r) P0 = Y1 / (Y1/E0) = Y1 x (E0 / Y1) = E0 So, you see that r is not in the final expression for P0, indicating that r (i.e., retention ration or, equivalently, dividend policy) doesn’t matter if k = ROE. Check that changing r from .8 to .6 does not change your answer in part A of this question by re-calculating your result using r = .6. (10 marks) 9.3 You are considering an investment in the shares of Kirk's Information Inc. The company is still in its growth phase, so it won’t pay dividends for the next few years. Kirk’s accountant has determined that their first year's earnings per share (EPS) is expected to be $20. The company expects a return on equity (ROE) of 25% in each of the next 5 years but in the sixth year they expect to earn 20%. In the seventh year and forever into the future, they expect to earn 15%. Also, at the end of the sixth year and every year after that, they expect to pay dividends at a
- 5. rate of 70% of earnings, retaining the other 30% in the company. Kirk's uses a discount rate of 15%. A. Fill in the missing items in the following table: Year EPS ROE Expected Dividend (end of year) Present Value Of Dividend (at time 0) 0 n/a n/a n/a n/a 1 20 25% 0 0 2 25 = 1.25 x 20 25% 0 0 3 ? 25% 0 0 4 ?
- 6. 25% 0 0 5 ? 25% 0 0 6 ? 20% ? ? 7 ? 15% ? ? 8 ? 15% ? ? B. What would the dividend be in year 8? C. Calculate the value of all future dividends at the beginning of year 8. (Hint: P7 depends on D8.)
- 7. D. What is the present value of P7 at the beginning of year 1? E. What is the value of the company now, at time 0? (10 marks) 9.4 You own one share in a company called Invest Co. Inc. Examining the balance sheet, you have determined that the firm has $100,000 cash, equipment worth $900,000, and 100,000 shares outstanding. Calculate the price/value of each share in the firm, and explain how your wealth is affected if: A. The firm pays out dividends of $1 per share. B. The firm buys back 10,000 shares for $10 cash each, and you choose to sell your share back to the company. C. The firm buys back 10,000 shares for $10 cash each, and you choose not to sell your share back to the company.
- 8. D. The firm declares a 2-for-1 stock split. E. The firm declares a 10% stock dividend. F. The firm buys new equipment for $100,000, which will be used to earn a return equal to the firm's discount rate. (12 marks) Do not submit these questions for grading until you have completed all parts of Assignment 3, which is due after Lesson 11. Lesson 10: Assignment Problems 10.1 A. Calculate the mean and standard deviation of the following securities’ returns: Year Computroids Inc. Blazers Inc. 1 10% 5% 2
- 9. 5% 6% 3 –3% 7% 4 12% 8% 5 10% 9% B. Assuming these observations are drawn from a normally distributed probability space, we know that about 68% of values drawn from a normal distribution are within one standard deviation away from the mean or expected return; about 95% of the values are within two standard deviations; and about 99.7% lie within three standard deviations. Using your calculations from part A, calculate the 68%, 95%, and 99% confidence intervals for the two stocks. To calculate the 68%, you would calculate the top of the confidence interval range by adding one standard deviation to the expected return, and calculate the bottom of the confidence interval by subtracting one standard deviation from the expected return. For 95%, use two standard deviations, and for 99%, use three. Your answer should show three ranges from the bottom of the confidence interval to the top of the confidence interval.
- 10. C. For each security, would a return of 14% fall into the 68% confidence interval range? If not, what confidence interval range would it fall into, or would it be outside all three confidence intervals? [This is the same as asking whether a return of 14% has less than a 68% probability of occuring by chance for that security. If it’s not inside the 68% confidence interval, it’s unlikely to occur, since it will only occur by chance 32% of the time. Of course, the 99% confidence interval is much more likely to include the observed return, simply by chance. Only 1% of the time will it fall outside the 99% CI. Pretty rare.] (14 marks) 10.2 Some Internet research may be required to answer this question, although it’s not absolutely necessary. What could you do to protect your bond portfolio against the following kinds of risk? A. Risk of an increasing interest rate B. Risk of inflation increasing C. Risk of volatility in the markets (6 marks) 10.3 You are starting a new business, and you want to open an office
- 11. in a local mall. You have been offered two alternative rental arrangements. You can pay the landlord 10% of your sales revenue, or you can pay a fixed fee of $1,000 per month. Describe the circumstances in which each of these arrangements would be your preferred choice. (10 marks) Do not submit these questions for grading until you have completed all parts of Assignment 3, which is due after Lesson 11. Lesson 11: Assignment Problems 11.1 In the northeast United States and in eastern Canada, many people heat their houses with heating oil. Imagine you are one of these people, and you are expecting a cold winter, so you are planning your heating oil requirements for the season. The current price is $2.25 per US gallon, but you think that in six months, when you'll need the oil, the price could be $3.00, or it could be $1.50. A. If you need 350 gallons to survive the winter, how much difference does the potential price variance make to your heating bills? B. If your friend Tom is running a heating oil business, and selling 100,000 gallons over the winter season, how does the price variance affect Tom?
- 12. C. Which one of you benefits from the price increase? Which of you benefits from price decrease? D. What are two strategies you can use to reduce the risk you face? Could you make an agreement with Tom to mitigate your risk? E. Assuming you are both risk-averse, does such an agreement make you both better off? (10 marks) 11.2 You have just received good news. You have a rich uncle in France who has decided to give you a monthly annuity of €2,000 per month. You are concerned that you will become accustomed to having these funds, but if the currency exchange rate moves against you, you may have to make do with less. A. If you are living in Canada, what does it mean for the currency exchange rate to move against you? B.
- 13. Would moving to France mitigate some of the risk? If so, how? If not, why not? C. If you want to stay in Canada, and your grandparents, who have retired to Provence, receive a Canadian pension of C$1100 each, what could you do to reduce the risk for all of you? (9 marks) 11.3 You have learned about a number of ways of reducing risk, specifically hedging, insuring, and diversifying. In the table below, place an X in the cell for the technique being used to reduce risk. Hedging Insuring Diversifying 1 Placing an advance order with Amazon.ca, which agrees to charge you the lower of the advance price, and the price at the time your order is filled. 2 Purchasing a call option on a stock you think may go up in price. 3 Selling 200 shares of IBM and buying a mutual fund that holds
- 14. the same stocks as the S&P index. 4 Selling a debt owed to you for $.50 per dollar owed. 5 Agreeing to a long-term contract with a supplier at a fixed price. 6 Agreeing to a no-trade clause with the sports team that employs you. 7 Buying a Mac and a PC. 8 Paying a clown to perform for your child's birthday party six months before the birthday. (16 marks) 11.4 Suppose you own 100 shares of Dell Inc. stock. Today it is
- 15. trading at $15 per share, but you're worried Michael Dell might retire again, causing the price to go down. How would you protect yourself against his retirement, assuming you don't want to sell the shares today? (5 marks) When you have completed these questions, check to see that Assignment 3 is complete and submit it for grading. LEA R N IN G O B J E C T IV E S After you have read this chapter you should be able to: 1 Identify the policy instruments used by governments to influence international trade flows.
- 16. 2 Understand why governments sometimes intervene in international trade. 3 Summarize and explain the arguments against strategic trade policy. 4 Describe the development of the world trading system and the current trade issues. 5 Explain the implications for managers of developments in the world trading system. part 3 Cross-Border Trade and Investment hiL37217_ch06_202-239.indd Page 202 15/07/10 4:02 AM user-f501hiL37217_ch06_202-239.indd Page 202 15/07/10 4:02 AM user-f501 /Users/user-f501/Desktop/Tempwork/July 2010/01:07:10/MHBR169:Slavin:VYN/Users/user- f501/Desktop/Tempwork/July 2010/01:07:10/MHBR169:Slavin:VY opening case O ver the past 25 years two facts have characterized international trade. First, the volume of world trade has grown every single year, creating an increasingly interdependent global economy, and second, barriers to international trade have been progressively reduced. Between 1990 and 2007, international trade grew by 6 percent per annum compounded, while import tariffs on goods fell from an average of 26 percent in1986 to 8.8 percent in 2007. In the wake of the global financial crisis that started in the United States in 2008 and quickly spread around the world, this has now changed. As global demand slumped and financing for international trade dried up in the wake of tight credit
- 17. conditions, so did the volume of international trade. The volume of world trade fell by 2 percent in 2008, the first decline since 1982, and a further 9 percent in 2009. This contraction is alarming because, in the past, sharp declines in trade have been fol- lowed by calls for greater protectionism from foreign competition as governments try to pro- tect jobs at home in the wake of declining demand. This occurred in the 1930s, when shrinking trade was followed quickly by increases in trade barriers, mostly in the form of higher tar- iffs. This actually made the situation far worse and led to the Great Depression. Much has changed since the 1930s. Treaties now limit the ability of national govern- ments to raise trade barriers. Most notably, World Trade Organization rules in theory constrain the ability of countries to implement significant increases in trade barriers. But WTO rules are not perfect, and evidence shows that countries are raising bar- riers to international trade. Many developing countries have latitude under WTO rules to raise some tariffs, and, according to the World Bank, in 2008 and 2009 they were doing just that. For example, Ecuador raised duties on 600 goods, Russia increased import tariffs on used cars, while India placed them on some steel imports. The Global Financial Crisis and Protectionism The Political Economy of International Trade
- 18. 6 c h a p t e r hiL37217_ch06_202-239.indd Page 203 15/07/10 4:02 AM user-f501hiL37217_ch06_202-239.indd Page 203 15/07/10 4:02 AM user-f501 /Users/user-f501/Desktop/Tempwork/July 2010/01:07:10/MHBR169:Slavin:VYN/Users/user- f501/Desktop/Tempwork/July 2010/01:07:10/MHBR169:Slavin:VY 204 Part Three Cross-Border Trade and Investment According to the World Bank, however, two-thirds of the protectionist mea- sures taken in 2008 and 2009 are various kinds of “nontariff” barriers that are designed to get around WTO rules. Indonesia, for example, specified that cer- tain kinds of goods, including clothes, shoes, and toys, can be imported only through five ports. Since these ports have limited capacity, this constrains the ability of foreign companies to sell into the Indonesian market. Argentina has imposed discretionary licensing requirements on a range of goods including car parts, textiles, and televisions. If you can’t get a license, you can’t sell into Argentina. China has stopped a wide range of imports of food and drink products from Europe, citing safety rules and environmental concerns, while India has banned imports of toys from China for safety reasons. Developed nations have in general not taken similar actions,
- 19. but they have sharply increased subsidies to troubled domestic producers, which gives them an advantage against unsubsidized international competitors, and therefore distorts trade. The key example of this in 2008 and 2009 was the automobile industry. To protect national producers, hold on to jobs, and stave of bankruptcies, rich countries including the United States, Great Britain, Canada, France, Germany, Italy, and Sweden gave over $45 billion in subsidies to car companies between mid-2008 and mid-2009. Such subsidies could cause production to switch from more-efficient plants to less-efficient plants that have an advantage due to state support. Although the WTO has rules against trade-distorting subsidies, its enforcement mechanisms are weaker than in the case of tariffs, and so far countries that have been increasing subsidies have not been challenged. • Source: “The Nuts and Bolts Come Apart,” The Economist, March 28, 2009, pp. 79–81; “Barriers to Entry,” The Economist, December 20, 2008, p. 121; and “Beyond Doha,” The Economist, October 11, 2008, pp. 30–33. Introduction Our review of the classical trade theories of Smith, Ricardo, and Heckscher-Ohlin in Chapter 5 showed us that in a world without trade barriers, trade patterns are determined by the relative productivity of different factors of production in different
- 20. countries. Countries will specialize in products that they can make most efficiently, while importing products that they can produce less efficiently. Chapter 5 also laid out the intellectual case for free trade. Remember, free trade refers to a situation in which a government does not attempt to restrict what its citizens can buy from or sell to another country. As we saw in Chapter 5, the theories of Smith, Ricardo, and Heckscher-Ohlin predict that the consequences of free trade include both static economic gains (because free trade supports a higher level of domestic consumption and more efficient utilization of resources) and dynamic economic gains (because free trade stimulates economic growth and the creation of wealth). Free Trade The absence of government barriers to the free flow of goods and services between countries. hiL37217_ch06_202-239.indd Page 204 15/07/10 4:02 AM user-f501hiL37217_ch06_202-239.indd Page 204 15/07/10 4:02 AM user-f501 /Users/user-f501/Desktop/Tempwork/July 2010/01:07:10/MHBR169:Slavin:VYN/Users/user- f501/Desktop/Tempwork/July 2010/01:07:10/MHBR169:Slavin:VY
- 21. Chapter Six The Political Economy of International Trade 205 In this chapter, we look at the political reality of international trade. Although many nations are nominally committed to free trade, they tend to intervene in international trade to protect the interests of politically important groups or promote the interests of key domestic producers. The opening case illustrates the nature of such political realities. In the wake of the global economic slowdown that followed the financial crisis of 2008–2009, a wide range of countries have been increasing tariffs and non- tariff barriers to international trade in an attempt to protect domestic producers, and hold onto jobs. While such actions are under- standable from a political perspective, interna- tional trade theory teaches us that they are self-defeating. Ultimately, protecting inefficient producers raises the price of goods and services, and results in lower economic growth. In this chapter, we explore the political and economic reasons that governments have for intervening in international trade. When governments intervene, they of- ten do so by restricting imports of goods and services into their nation, while adopting policies that promote domestic production and exports. As in 2008 and 2009, normally their motives are to protect domestic producers. In recent years, social issues have intruded into the decision-making calculus. In the United States, for example, a movement is growing to ban imports of goods from countries that do not abide by the same labor, health, and environmental
- 22. regulations as the United States. We start this chapter by describing the range of policy instruments that govern- ments use to intervene in international trade. This is followed by a detailed review of the various political and economic motives that governments have for interven- tion. In the third section of this chapter, we consider how the case for free trade stands up in view of the various justifications given for government intervention in international trade. Then we look at the emergence of the modern international trading system, which is based on the General Agreement on Tariffs and Trade and its successor, the WTO. The GATT and WTO are the creations of a series of mul- tinational treaties. The most recent was completed in 1995, involved more than 120 countries, and resulted in the creation of the WTO. The purpose of these treaties has been to lower barriers to the free flow of goods and services between nations. Like the GATT before it, the WTO promotes free trade by limiting the ability of national governments to adopt policies that restrict imports into their nations. In the final section of this chapter, we discuss the implications of this material for management practice. Instruments of Trade Policy Trade policy uses seven main instruments: tariffs, subsidies, import quotas, voluntary export restraints, local content requirements, administrative
- 23. policies, and antidumping duties. Tariffs are the oldest and simplest instrument of trade policy. As we shall see later in this chapter, they are also the instrument that the GATT and WTO have Another Per spect i ve Rankings of the World Economic Forum (WEF) The World Economic Forum (WEF) is an independent economic organization whose mission is to improve the state of the world. Based in Geneva, Switzerland, it hosts meetings that serve as a forum for the collaboration of international leaders. The WEF also conducts global economic research and annually publishes country competi- tive rankings. In the latest report (2009–2010), the top coun- tries in competitiveness were Switzerland, the United States, and Singapore, followed by Sweden, Denmark, Finland, and Germany. If you review the report’s complete list of rankings, you’ll note a strong correlation between a country’s ranking and its political system. Visit www.weforum.org. LEARNING OBJECTIVE 1 Identify the policy instruments used by governments to influence international trade flows. hiL37217_ch06_202-239.indd Page 205 15/07/10 4:02 AM user-f501hiL37217_ch06_202-239.indd Page 205 15/07/10 4:02 AM user-f501 /Users/user-f501/Desktop/Tempwork/July 2010/01:07:10/MHBR169:Slavin:VYN/Users/user- f501/Desktop/Tempwork/July 2010/01:07:10/MHBR169:Slavin:VY
- 24. 206 Part Three Cross-Border Trade and Investment been most successful in limiting. A fall in tariff barriers in recent decades has been accompanied by a rise in nontariff barriers, such as subsidies, quotas, voluntary export restraints, and antidumping duties. TARIFFS A tariff is a tax levied on imports (or exports). Tariffs fall into two categories. Specific tariffs are levied as a fixed charge for each unit of a good imported (for example, $3 per barrel of oil). Ad valorem tariffs are levied as a pro- portion of the value of the imported good. In most cases, tariffs are placed on imports to protect domestic producers from foreign competition by raising the price of imported goods. However, tariffs also produce revenue for the government. Until the income tax was introduced, for example, the U.S. government received most of its revenues from tariffs. The important thing to understand about an import tariff is who suffers and who gains. The government gains, because the tariff increases government revenues. Domestic producers gain, because the tariff affords them some protection against foreign competitors by increasing the cost of imported foreign goods. Consumers lose because they must pay more for certain imports. For example, in 2002 the U.S. government placed an ad valorem tariff of 8 percent to 30
- 25. percent on imports of foreign steel. The idea was to protect domestic steel producers from cheap imports of foreign steel. The effect, however, was to raise the price of steel products in the United States between 30 and 50 percent. A number of U.S. steel consumers, rang- ing from appliance makers to automobile companies, objected that the steel tariffs would raise their costs of production and make it more difficult for them to compete in the global marketplace. Whether the gains to the government and domestic pro- ducers exceed the loss to consumers depends on various factors such as the amount of the tariff, the importance of the imported good to domestic consumers, the num- ber of jobs saved in the protected industry, and so on. In the steel case, many argued that the losses to steel consumers apparently outweighed the gains to steel produc- ers. In November 2003, the World Trade Organization declared that the tariffs represented a violation of the WTO treaty, and the United States removed them in December of that year. In general, two conclusions can be derived from economic analysis of the effect of import tariffs. 1 First, tariffs are pro-producer and anti- consumer. While they protect producers from foreign competitors, this restriction of supply also raises domestic prices. For example, a study by Japanese economists calculated that tariffs on imports of foodstuffs, cosmetics, and chemi-
- 26. cals into Japan cost the average Japanese con- sumer about $890 per year in the form of higher prices. 2 Almost all studies find that import tariffs impose significant costs on domestic consumers in the form of higher prices. 3 Second, import tariffs reduce the overall effi- ciency of the world economy. They reduce efficiency because a protective tariff encourages domestic firms to produce products at home that, in theory, could be produced more efficiently abroad. The consequence is an inefficient utiliza- tion of resources. For example, tariffs on the im- portation of rice into South Korea have led to an increase in rice production in that country; how- ever, rice farming is an unproductive use of land in South Korea. It would make more sense for the Tariff A tax levied on imports. Another Per spect i ve U.S. Tariff Rates Because the United States takes a free trade public posi- tion, many people assume the U.S. government has few tariffs. Information about U.S. trade is readily available online. For example, you can review the U.S. government’s current tariffs at the U.S. Office of Tariff Affairs and Trade Agreements site (www.usitc.gov/tata/index.htm). However, with many schedules and fine distinctions made within product groups, this site can be a challenge to browse. For interesting statistics on imports and exports of the United States, as well of as other nations, check out the World Trade Organization Web site at www.wto.org.
- 27. Specific Tariff A tariff levied as a fixed charge for each unit of good imported. Ad Valorem Tariff A tariff levied as a proportion of the value of an imported good. hiL37217_ch06_202-239.indd Page 206 15/07/10 4:02 AM user-f501hiL37217_ch06_202-239.indd Page 206 15/07/10 4:02 AM user-f501 /Users/user-f501/Desktop/Tempwork/July 2010/01:07:10/MHBR169:Slavin:VYN/Users/user- f501/Desktop/Tempwork/July 2010/01:07:10/MHBR169:Slavin:VY Chapter Six The Political Economy of International Trade 207 South Koreans to purchase their rice from lower-cost foreign producers and to uti- lize the land now employed in rice production in some other way, such as growing foodstuffs that cannot be produced more efficiently elsewhere or for residential and industrial purposes. Sometimes tariffs are levied on exports of a product from a country. Export tariffs are far less common than import tariffs. In general, export tariffs have two objectives: first, to raise revenue for the government, and second, to reduce
- 28. exports from a sector, often for political reasons. For example, in 2004 China imposed a tariff on textile ex- ports. The primary objective was to moderate the growth in exports of textiles from China, thereby alleviating tensions with other trading partners. SUBSIDIES A subsidy is a government payment to a domestic producer. Subsi- dies take many forms, including cash grants, low-interest loans, tax breaks, and gov- ernment equity participation in domestic firms. By lowering production costs, subsidies help domestic producers in two ways: (1) competing against foreign imports and (2) gaining export markets. According to the World Trade Organization, in the mid-2000s countries spent some $300 billion on subsidies, $250 billion of which was spent by 21 developed nations. 4 As noted in the opening case, between mid-2008 and mid-2009 some developed nations gave $45 billion in subsidies to their automobile makers. While the purpose of the subsidies was to help them survive a very difficult economic climate, one of the consequences was to give subsidized companies an unfair competitive advantage in the global auto industry. Agriculture tends to be one of the largest beneficiaries of subsidies in most coun- tries. In the mid-2000s, the European Union was paying about €44 billion annually ($55 billion) in farm subsidies. Not to be outdone, in May 2002 President George W. Bush signed into law a bill that contained subsidies of more than $180 billion
- 29. for U.S. farmers spread out over 10 years. This was followed in 2007 by a farm bill that contained $286 billion in subsidies for the next 10 years. The Japanese also have a long history of supporting inefficient domestic producers with farm subsi- dies. The accompanying Country Focus looks at subsidies to wheat producers in Japan. Nonagricultural subsidies are much lower, but they are still significant. For example, subsidies historically were given to Boeing and Airbus to help them lower the cost of developing new commercial jet aircraft. In Boeing’s case, subsides came in the form of tax credits for R&D spending or Pentagon money that was used to develop military technology, which then was transferred to civil aviation projects. In the case of Airbus, subsidies took the form of government loans at below-market interest rates. The main gains from subsidies accrue to domestic producers, whose international competitiveness is increased as a result. Advocates of strategic trade policy (which, as you will recall from Chapter 5, is an outgrowth of the new trade theory) favor subsi- dies to help domestic firms achieve a dominant position in those industries in which economies of scale are important and the world market is not large enough to profit- ably support more than a few firms (aerospace and semiconductors are two such in- dustries). According to this argument, subsidies can help a firm achieve a first-mover
- 30. advantage in an emerging industry (just as U.S. government subsidies, in the form of substantial R&D grants, allegedly helped Boeing). If this is achieved, further gains to the domestic economy arise from the employment and tax revenues that a major global company can generate. However, government subsidies must be paid for, typi- cally by taxing individuals and corporations. Whether subsidies generate national benefits that exceed their national costs is debatable. In practice, many subsidies are not that successful at increasing the Subsidy Government financial assistance to a domestic producer. hiL37217_ch06_202-239.indd Page 207 15/07/10 4:02 AM user-f501hiL37217_ch06_202-239.indd Page 207 15/07/10 4:02 AM user-f501 /Users/user-f501/Desktop/Tempwork/July 2010/01:07:10/MHBR169:Slavin:VYN/Users/user- f501/Desktop/Tempwork/July 2010/01:07:10/MHBR169:Slavin:VY 208 Part Three Cross-Border Trade and Investment international competitiveness of domestic producers. Rather, they tend to protect the inefficient and promote excess production. One study estimated that if advanced countries abandoned subsidies to farmers, global trade in agricultural products would
- 31. be 50 percent higher and the world as a whole would be better off by $160 billion. 5 Another study estimated that removing all barriers to trade in agriculture (both subsi- dies and tariffs) would raise world income by $182 billion. 6 This increase in wealth arises from the more efficient use of agricultural land. For a specific example, see the Country Focus on wheat subsidies in Japan. IMPORT QUOTAS AND VOLUNTARY EXPORT RESTRAINTS An import quota is a direct restriction on the quantity of some good that may be imported into a country. The restriction is usually enforced by issuing import licenses to a group of individuals or firms. For example, the United States has a quota on cheese imports. The only firms allowed to import cheese are certain trading companies, each of which is allocated the right to import a maximum number of Subsidized Wheat Production in Japan Japan is not a particularly good environment for growing wheat. Wheat produced on large fields in the dry climates of North America, Australia, and Argentina is far cheaper and of much higher quality than anything produced in Japan, which imports some 80 percent of its wheat from foreign producers. Yet tens of thousands of farmers in Japan still grow wheat, usually on small fields where yields are low and costs high, and production is rising. They do this because government subsidies keep inefficient Japanese wheat producers in business. In the mid-2000s, Japanese farmers were selling their output at market
- 32. prices, which were running at $9 per bushel, but they received an average of at least $35 per bushel for their production! The difference—$26 a bushel—was govern- ment subsidies paid to producers. The estimated costs of these subsidies were more than $700 million a year. To finance its production subsidy, Japan operates a tariff rate quota on wheat imports in which a higher tariff rate is imposed once wheat imports exceed the quota level. The in-quota rate tariff is zero, while the over-quota tariff rate for wheat is $500 a ton. The tariff raises the cost so much that it deters over-quota imports, essentially restricting supply and raising the price for wheat inside Japan. The Japanese Ministry of Agriculture, Forestry and Fisheries (MAFF) has the sole right to purchase wheat imports within the quota (and since there are very few over-quota imports, the MAFF is a monopoly buyer on wheat imports into Japan). The MAFF buys wheat at world prices then resells it to millers in Japan at the artificially high prices that arise due to the restriction on supply engineered by the tariff rate quota. Estimates suggest that in 2004, the world mar- ket price for wheat was $5.96 per bushel, but within Japan the average price for imported wheat was $10.23 a bushel. The markup of $4.27 a bushel yielded the MAFF in excess of $450 million in profit. This “profit” was then used to help cover the $700 million cost of subsidies to inefficient wheat farmers, with the rest of the funds coming from general government tax revenues. Thanks to these policies, the price of wheat in Japan can be anything from 80 to 120 percent higher than the world price, and Japanese wheat production, which exceeded 850,000 tons in 2004, is significantly greater than it would be if a free market were allowed to operate. Indeed, under free market conditions, there would be virtually no wheat production in Japan since the costs of production are sim- ply too high. The beneficiaries of this policy are the thou-
- 33. sands of small farmers in Japan who grow wheat. The losers include Japanese consumers, who must pay more for products containing wheat and who must finance wheat subsidies through taxes, and foreign producers, who are denied access to a chunk of the Japanese market by the over-quota tariff rate. Why then does the Japanese government continue to pursue this policy? It continues because small farmers are an important constituency and Japanese politicians want their votes. Sources: J. Dyck and H. Fukuda, “Taxes on Imports Subsidize Wheat Production in Japan,” Amber Waves, February 2005, p. 2; and H. Fukuda, J. Dyck, and J. Stout, “Wheat and Barley Policies in Japan,” U.S. Department of Agriculture research report, WHS-04i-01, November 2004. 3 Country FOCUS Import Quota A direct restriction on the quantity of some good that may be imported into a country. hiL37217_ch06_202-239.indd Page 208 15/07/10 4:02 AM user-f501hiL37217_ch06_202-239.indd Page 208 15/07/10 4:02 AM user-f501 /Users/user-f501/Desktop/Tempwork/July 2010/01:07:10/MHBR169:Slavin:VYN/Users/user- f501/Desktop/Tempwork/July 2010/01:07:10/MHBR169:Slavin:VY
- 34. Chapter Six The Political Economy of International Trade 209 pounds of cheese each year. In some cases, the right to sell is given directly to the governments of exporting countries. Historically this is the case for sugar and textile imports in the United States. However, the international agreement governing the imposition of import quotas on textiles, the Multi-Fiber Agreement, expired in December 2004. A common hybrid of a quota and a tariff is known as a tariff rate quota. Under a tariff rate quota, a lower tariff rate is applied to imports within the quota than those over the quota. For example, as illustrated in Figure 6.1, an ad valorem tariff rate of 10 percent might be levied on rice imports into South Korea of 1 million tons, after which an out-of-quota rate of 80 percent might be applied. Thus, South Korea might import 2 million tons of rice, 1 million at a 10 percent tariff rate and another 1 million at an 80 percent tariff. Tariff rate quotas are common in agriculture, where their goal is to limit imports over quota. For an example, see the Country Focus that looks at how Japan uses the combination of a tariff rate quota and subsidies to protect ineffi- cient Japanese wheat farmers from foreign competition. A variant on the import quota is the voluntary export restraint. A voluntary export restraint (VER) is a quota on trade imposed by the exporting country, typically at the request of the importing country’s government. One of the most
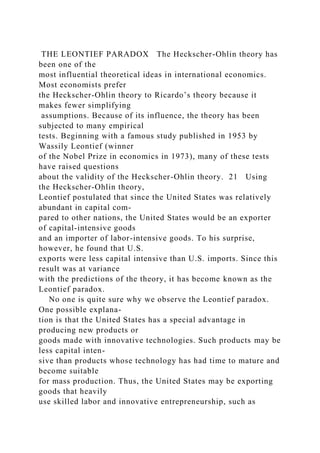
- 35. famous historical examples is the limitation on auto exports to the United States enforced by Japanese automobile producers in 1981. A response to direct pressure from the U.S. govern- ment, this VER limited Japanese imports to no more than 1.68 million vehicles per year. The agreement was revised in 1984 to allow 1.85 million Japanese vehicles per year. The agreement was allowed to lapse in 1985, but the Japanese government indi- cated its intentions at that time to continue to restrict exports to the United States to 1.85 million vehicles per year. 7 Foreign producers agree to VERs because they fear more damaging punitive tariffs or import quotas might follow if they do not. Agreeing to a VER is seen as a way to make the best of a bad situation by appeasing protection- ist pressures in a country. As with tariffs and subsidies, both import quotas and VERs benefit domestic pro- ducers by limiting import competition. As with all restrictions on trade, quotas do not 0 0 80 9010 20 30 40 50 60 70 Quota limit 2 million 1 million Tariff rate (%)
- 36. To ns o f r ic e im po rte d Out of quota In quota 6.1 figure Hypothetical Tariff Rate Quota Voluntary Export Restraint (VER) A quota on trade imposed by the exporting country, typically at the request of the importing country’s government. Tariff Rate Quota The process of applying a lower tariff rate to imports within the quota than those over
- 37. the quota. hiL37217_ch06_202-239.indd Page 209 15/07/10 4:02 AM user-f501hiL37217_ch06_202-239.indd Page 209 15/07/10 4:02 AM user-f501 /Users/user-f501/Desktop/Tempwork/July 2010/01:07:10/MHBR169:Slavin:VYN/Users/user- f501/Desktop/Tempwork/July 2010/01:07:10/MHBR169:Slavin:VY 210 Part Three Cross-Border Trade and Investment benefit consumers. An import quota or VER always raises the domestic price of an imported good. When imports are limited to a low percentage of the market by a quota or VER, the price is bid up for that limited foreign supply. The automobile industry VER mentioned above increased the price of the limited supply of Japanese imports. According to a study by the U.S. Federal Trade Commission, the automobile VER cost U.S. consumers about $1 billion per year between 1981 and 1985. That $1 billion per year went to Japanese producers in the form of higher prices. 8 The extra profit that producers make when supply is artificially limited by an import quota is referred to as a quota rent. If a domestic industry lacks the capacity to meet demand, an import quota can raise prices for both the domestically produced and the imported good. This happened in the U.S. sugar industry, in which a tariff rate quota system has long limited the amount
- 38. foreign producers can sell in the U.S. market. According to one study, import quotas have caused the price of sugar in the United States to be as much as 40 percent greater than the world price. 9 These higher prices have translated into greater profits for U.S. sugar producers, which have lobbied politicians to keep the lucrative agreement. They argue U.S. jobs in the sugar industry will be lost to foreign producers if the quota sys- tem is scrapped. LOCAL CONTENT REQUIREMENTS A local content requirement is a requirement that some specific fraction of a good be produced domestically. The re- quirement can be expressed either in physical terms (e.g., 75 percent of component parts for this product must be produced locally) or in value terms (e.g., 75 percent of the value of this product must be produced locally). Local content regulations have been widely used by developing countries to shift their manufacturing base from the simple assembly of products whose parts are manufactured elsewhere into the local manufacture of component parts. They have also been used in developed countries to try to protect local jobs and industry from foreign competition. For example, a little- known law in the United States, the Buy America Act, specifies that government agen- cies must give preference to American products when putting contracts for equipment out to bid unless the foreign products have a significant price advantage. The law
- 39. specifies a product as “American” if 51 percent of the materials by value are produced domestically. This amounts to a local content requirement. If a foreign company, or an American one for that matter, wishes to win a contract from a U.S. government agency to provide some equipment, it must ensure that at least 51 percent of the product by value is manufactured in the United States. Local content regulations provide protection for a domestic producer of parts in the same way an import quota does: by limiting foreign competition. The aggregate economic effects are also the same; domestic producers benefit, but the restrictions on imports raise the prices of imported components. In turn, higher prices for imported components are passed on to consumers of the final product in the form of higher final prices. So as with all trade policies, local content regulations tend to benefit pro- ducers and not consumers. ADMINISTRATIVE POLICIES In addition to the formal instruments of trade policy, governments of all types sometimes use informal or administrative pol- icies to restrict imports and boost exports. Administrative trade policies are bu- reaucratic rules designed to make it difficult for imports to enter a country. It has been argued that the Japanese are the masters of this trade barrier. In recent decades, Japan’s formal tariff and nontariff barriers have been among the lowest in the world.
- 40. Local Content Requirement A requirement that some specific fraction of a good be produced domestically. Administrative Trade Policies Bureaucratic rules designed to make it difficult for imports to enter a country. Quota Rent The extra profit producers make when supply is artificially limited by an import quota. hiL37217_ch06_202-239.indd Page 210 15/07/10 4:02 AM user-f501hiL37217_ch06_202-239.indd Page 210 15/07/10 4:02 AM user-f501 /Users/user-f501/Desktop/Tempwork/July 2010/01:07:10/MHBR169:Slavin:VYN/Users/user- f501/Desktop/Tempwork/July 2010/01:07:10/MHBR169:Slavin:VY
- 41. Chapter Six The Political Economy of International Trade 211 Dumping selling goods in a foreign market at below their costs of production or below their “fair” market value. Antidumping Policies Policies designed to punish foreign firms that engage in dumping and thus protect domestic producers from unfair foreign competition. Countervailing Duties Antidumping duties. However, critics charge that the country’s informal administrative barriers to im- ports more than compensate for this. For example, at one point the Netherlands exported tulip bulbs to almost every country in the world except Japan. In Japan, customs inspectors insisted on checking every tulip bulb by cutting it vertically down the middle, and even Japanese ingenuity could not put them back together. Federal Express also initially had a tough time expanding its global express shipping services into Japan because Japanese customs inspectors insist on opening a large
- 42. proportion of express packages to check for pornography, a process that delayed an “express” package for days. Japan is not the only country that engages in such poli- cies. France once required that all imported videotape recorders arrive through a small customs entry point that was both remote and poorly staffed. The resulting delays kept Japanese VCRs out of the French market until a VER agreement was negotiated. 10 As with all instruments of trade policy, administrative instruments ben- efit producers and hurt consumers, who are denied access to possibly superior for- eign products. ANTIDUMPING POLICIES In the context of international trade, dumping is variously defined as selling goods in a foreign market at below their costs of production or as selling goods in a foreign market at below their “fair” market value. There is a dif- ference between these two definitions; the fair market value of a good is normally judged to be greater than the costs of producing that good because the former includes a “fair” profit margin. Dumping is viewed as a method by which firms unload excess production in foreign markets. Some dumping may be the result of predatory behavior, with producers using substantial profits from their home markets to subsidize prices in a foreign market with a view to driving indigenous competitors out of that market. Once this has been achieved, so the argument goes, the predatory firm can raise prices
- 43. and earn substantial profits. An alleged example of dumping occurred in 1997, when two South Korean manu- facturers of semiconductors, LG Semicon and Hyundai Electronics, were accused of selling dynamic random access memory chips (DRAMs) in the U.S. market at below their costs of production. This action occurred in the middle of a worldwide glut of chip-making capacity. It was alleged that the firms were trying to unload their excess production in the United States. Antidumping policies are designed to punish foreign firms that engage in dump- ing. The ultimate objective is to protect domestic producers from unfair foreign competition. Although antidumping policies vary somewhat from country to country, the majority are similar to those used in the United States. If a domestic producer believes that a foreign firm is dumping production in the U.S. market, it can file a petition with two government agencies, the Commerce Department and the Interna- tional Trade Commission. In the Korean DRAM case, Micron Technology, a U.S. manufacturer of DRAMs, filed the petition. The government agencies then investi- gate the complaint. If a complaint has merit, the Commerce Department may impose an antidumping duty on the offending foreign imports (antidumping duties are often called countervailing duties). These duties, which represent a special tariff, can be fairly substantial and stay in place for up to five years. For example, after reviewing
- 44. Micron’s complaint, the Commerce Department imposed 9 percent and 4 percent countervailing duties on LG Semicon and Hyundai DRAM chips, respectively. The accompanying Management Focus discusses another example of how a firm, U.S. Magnesium, used antidumping legislation to gain protection from unfair foreign competitors. hiL37217_ch06_202-239.indd Page 211 15/07/10 4:02 AM user-f501hiL37217_ch06_202-239.indd Page 211 15/07/10 4:02 AM user-f501 /Users/user-f501/Desktop/Tempwork/July 2010/01:07:10/MHBR169:Slavin:VYN/Users/user- f501/Desktop/Tempwork/July 2010/01:07:10/MHBR169:Slavin:VY 212 Part Three Cross-Border Trade and Investment The Case for Government Intervention Now that we have reviewed the various instruments of trade policy that governments can use, it is time to look at the case for government intervention in international trade. Arguments for government intervention take two paths: political and economic. Politi- cal arguments for intervention are concerned with protecting the interests of certain groups within a nation (normally producers), often at the expense of other groups (nor- mally consumers), or with achieving some political objective that lies outside the sphere of economic relationships, such as protecting the environment or human rights. Eco-
- 45. nomic arguments for intervention are typically concerned with boosting the overall wealth of a nation (to the benefit of all, both producers and consumers). LEARNING OBJECTIVE 2 Understand why governments sometimes intervene in international trade. Management FOCUS U.S. Magnesium Seeks Protection In February 2004, U.S. Magnesium, the sole surviving U.S. producer of magnesium, a metal that is primarily used in the manufacture of certain automobile parts and aluminum cans, filed a petition with the U.S. International Trade Commission (ITC) contending that a surge in imports had caused material damage to the U.S. industry’s employment, sales, market share, and profitability. According to U.S. Magnesium, Russian and Chinese producers had been selling the metal at prices significantly below market value. During 2002 and 2003, imports of magnesium into the United States rose 70 percent, while prices fell by 40 percent and the market share accounted for by imports jumped to 50 percent from 25 percent. “The United States used to be the largest producer of magnesium in the world,” a U.S. Magnesium spokesman said at the time of the filing. “What’s really sad is that you can be state of the art and have modern technology, and if the Chinese, who pay people less than 90 cents an hour, want to run you out of business, they can do it. And that’s why we are seeking relief.” During a yearlong investigation, the ITC solicited input
- 46. from various sides in the dispute. Foreign producers and consumers of magnesium in the United States argued that falling prices for magnesium during 2002 and 2003 simply reflected an imbalance between supply and demand due to additional capacity coming on stream not from Russia or China but from a new Canadian plant that opened in 2001 and from a planned Australian plant. The Canadian plant shut down in 2003, the Australian plant never came on stream, and prices for magnesium rose again in 2004. Magnesium consumers in the United States also argued to the ITC that imposing antidumping duties on foreign imports of magnesium would raise prices in the United States significantly above world levels. A spokesman for Alcoa, which mixes magnesium with aluminum to make alloys for cans, predicted that if antidumping duties were imposed, high magnesium prices in the United States would force Alcoa to move some production out of the United States. Alcoa also noted that in 2003, U.S. Magnesium was unable to supply all of Alcoa’s needs, forcing the company to turn to imports. Consumers of magnesium in the automo- bile industry asserted that high prices in the United States would drive engineers to design magnesium out of automo- biles, or force manufacturing elsewhere, which would ulti- mately hurt everyone. The six members of the ITC were not convinced by these arguments. In March 2005, the ITC ruled that both China and Russia had been dumping magnesium in the United States. The government decided to impose duties ranging from 50 percent to more than 140 percent on imports of magnesium from China. Russian producers faced duties ranging from 19 percent to 22 percent. The duties were to be levied for five years, after which the ITC will revisit the situation. According to U.S. Magnesium, the favorable ruling would allow the company to reap the benefits of nearly $50 million in investments made in its manufacturing plant and enable
- 47. the company to boost its capacity by 28 percent by the end of 2005. Commenting on the favorable ruling, a U.S. Magne- sium spokesman noted, “Once unfair trade is removed from the marketplace we’ll be able to compete with any- one.” U.S. Magnesium’s customers and competitors, how- ever, did not view the situation in the 2002–2003 period as one of unfair trade. While the imposition of antidumping duties no doubt will help to protect U.S. Magnesium and the 400 people it employs from foreign competition, magnesium consumers in the United States are left wondering if they will be the ultimate losers. Sources: D. Anderton, “U.S. Magnesium Lands Ruling on Unfair Imports,” Deseret News, October 1, 2004, p. D10; “U.S. Magnesium and Its Largest Consumers Debate before U.S. ITC,” Platt’s Metals Week, February 28, 2005, p. 2; and S. Oberbeck, “U.S. Magnesium Plans Big Utah Production Expansion,” Salt Lake Tribune, March 30, 2005. hiL37217_ch06_202-239.indd Page 212 15/07/10 4:02 AM user-f501hiL37217_ch06_202-239.indd Page 212 15/07/10 4:02 AM user-f501 /Users/user-f501/Desktop/Tempwork/July 2010/01:07:10/MHBR169:Slavin:VYN/Users/user- f501/Desktop/Tempwork/July 2010/01:07:10/MHBR169:Slavin:VY Chapter Six The Political Economy of International Trade 213 POLITICAL ARGUMENTS FOR INTERVENTION Political arguments for government intervention cover a range of issues, including
- 48. preserving jobs, pro- tecting industries deemed important for national security, retaliating against unfair foreign competition, protecting consumers from “dangerous” products, furthering the goals of foreign policy, and advancing the human rights of individuals in exporting countries. Protecting Jobs and Industries Perhaps the most common political argument for government intervention is that it is necessary for protecting jobs and industries from unfair foreign competition. The tariffs placed on imports of foreign steel by President George W. Bush in 2002 were designed to do this. (Many steel producers were located in states that Bush needed to win reelection in 2004.) A political motive also underlay establishment of the Common Agricultural Policy (CAP) by the Euro- pean Union. The CAP was designed to protect the jobs of Europe’s politically power- ful farmers by restricting imports and guaranteeing prices. However, the higher prices that resulted from the CAP have cost Europe’s consumers dearly. This is true of many attempts to protect jobs and industries through government intervention. For example, the imposition of steel tariffs in 2002 raised steel prices for American consumers, such as automobile companies, making them less competitive in the global marketplace. National Security Countries sometimes argue that it is
- 49. necessary to protect cer- tain industries because they are important for national security. Defense-related indus- tries often get this kind of attention (e.g., aerospace, advanced electronics, semiconductors, etc.). Although not as common as it used to be, this argument is still made. Those in favor of protecting the U.S. semiconductor industry from foreign competition, for example, argue that semiconductors are now such important compo- nents of defense products that it would be dangerous to rely primarily on foreign producers for them. In 1986, this argument helped persuade the federal government to support Sematech, a consortium of 14 U.S. semiconductor companies that ac- counted for 90 percent of the U.S. industry’s revenues. Sematech’s mission was to conduct joint research into manufacturing techniques that can be parceled out to members. The government saw the venture as so critical that Sematech was specially protected from antitrust laws. Initially, the U.S. government provided Sematech with $100 million per year in subsidies. By the mid-1990s, however, the U.S. semiconduc- tor industry had regained its leading market position, largely through the personal computer boom and demand for microprocessor chips made by Intel. In 1994, the consortium’s board voted to seek an end to federal funding, and since 1996 the consor- tium has been funded entirely by private money. 11 Retaliation Some argue that governments should use the threat
- 50. to intervene in trade policy as a bargaining tool to help open foreign markets and force trading part- ners to “play by the rules of the game.” The U.S. government has used the threat of punitive trade sanctions to try to get the Chinese government to enforce its intellec- tual property laws. Lax enforcement of these laws had given rise to massive copyright infringements in China that had been costing U.S. companies such as Microsoft hun- dreds of millions of dollars per year in lost sales revenues. After the United States threatened to impose 100 percent tariffs on a range of Chinese imports, and after harsh words between officials from the two countries, the Chinese agreed to tighter enforcement of intellectual property regulations. 12 If it works, such a politically motivated rationale for government intervention may liberalize trade and bring with it resulting economic gains. It is a risky strategy, hiL37217_ch06_202-239.indd Page 213 15/07/10 4:02 AM user-f501hiL37217_ch06_202-239.indd Page 213 15/07/10 4:02 AM user-f501 /Users/user-f501/Desktop/Tempwork/July 2010/01:07:10/MHBR169:Slavin:VYN/Users/user- f501/Desktop/Tempwork/July 2010/01:07:10/MHBR169:Slavin:VY 214 Part Three Cross-Border Trade and Investment however. A country that is being pressured may not back down and instead may re-
- 51. spond to the imposition of punitive tariffs by raising trade barriers of its own. This is exactly what the Chinese government threatened to do when pressured by the United States, although it ultimately did back down. If a government does not back down, however, the results could be higher trade barriers all around and an eco- nomic loss to all involved. Protecting Consumers Many governments have long had regulations to protect consumers from unsafe products. The indirect effect of such regulations often is to limit or ban the importation of such products. For example, in 2003 several countries, including Japan and South Korea, decided to ban imports of American beef after a single case of mad cow disease was found in Washington State. The ban was motivated to protect consumers from what was seen to be an unsafe product. Together, Japan and South Korea accounted for about $2 billion of U.S. beef sales, so the ban had a sig- nificant impact on U.S. beef producers. After two years, both countries lifted the ban, although they placed stringent requirements on U.S. beef imports to reduce the risk of importing beef that might be tainted by mad cow disease (for example, Japan required that all beef must come from cattle under 21 months of age). 13 The accompanying Country Focus describes how the European Union banned the sale and importation of hormone-treated beef. The ban was motivated by a de- sire to protect European consumers from the possible health
- 52. consequences of eating meat from animals treated with growth hormones. The conflict over the importa- tion of hormone-treated beef into the EU may prove to be a taste of things to come. In addition to the use of hormones to promote animal growth and meat production, biotechnology has made it possible to genetically alter many crops so that they resist common herbicides, produce proteins that are natural insecticides, grow dramati- cally improved yields, or withstand inclement weather conditions. A new breed of A genetically engineered cotton seed that protects against three common insects has been met with resistance in Europe due to a fear that these genetically altered seeds could potentially be harmful to humans. hiL37217_ch06_202-239.indd Page 214 15/07/10 4:02 AM user-f501hiL37217_ch06_202-239.indd Page 214 15/07/10 4:02 AM user-f501 /Users/user-f501/Desktop/Tempwork/July 2010/01:07:10/MHBR169:Slavin:VYN/Users/user- f501/Desktop/Tempwork/July 2010/01:07:10/MHBR169:Slavin:VY Chapter Six The Political Economy of International Trade 215 genetically modified tomatoes has an antifreeze gene inserted into its genome and can thus be grown in colder climates than hitherto possible. Another example is a genetically engineered cotton seed produced by Monsanto. The seed has been engi-
- 53. neered to express a protein that protects against three common insect pests: the cotton bollworm, tobacco budworm, and pink bollworm. Use of this seed reduces or eliminates the need for traditional pesticide applications for these pests. As enticing as such innovations sound, they have met with intense resistance from consumer groups, particularly in Europe. The fear is that the widespread use of genetically altered seed corn could have unanticipated and harmful effects on human Trade in Hormone-Treated Beef In the 1970s, scientists discovered how to synthesize cer- tain hormones and use them to accelerate the growth rate of livestock animals, reduce the fat content of meat, and increase milk production. Bovine somatotropin (BST), a growth hormone produced by cattle, was first synthesized by the biotechnology firm Genentech. Injections of BST could be used to supplement an animal’s own hormone production and increase its growth rate. These hormones soon became popular among farmers, who found that they could cut costs and help satisfy consumer demands for leaner meat. Although these hormones occurred naturally in animals, consumer groups in several countries soon raised concerns about the practice. They argued that the use of hormone supplements was unnatural and that the health consequences of consuming hormone-treated meat were unknown but might include hormonal irregularities and cancer. The European Union responded to these concerns in 1989 by banning the use of growth-promoting hormones in the production of livestock and the importation of hormone-treated meat. The ban was controversial because
- 54. a reasonable consensus existed among scientists that the hormones posed no health risk. Although the EU banned hormone-treated meat, many other countries did not, including big meat-producing countries such as Australia, Canada, New Zealand, and the United States. The use of hormones soon became widespread in these countries. According to trade officials outside the EU, the European ban constituted an unfair restraint on trade. As a result of this ban, exports of meat to the EU fell. For example, U.S. red meat exports to the EU declined from $231 million in 1988 to $98 million in 1994. The complaints of meat export- ers were bolstered in 1995 when Codex Alimentarius, the international food standards body of the UN’s Food and Ag- riculture Organization and the World Health Organization, approved the use of growth hormones. In making this deci- sion, Codex reviewed the scientific literature and found no evidence of a link between the consumption of hormone- treated meat and human health problems, such as cancer. Fortified by such decisions, in 1995 the United States pressed the EU to drop the import ban on hormone-treated beef. The EU refused, citing “consumer concerns about food safety.” In response, both Canada and the United States in- dependently filed formal complaints with the World Trade Organization. The United States was joined in its complaint by a number of other countries, including Australia and New Zealand. The WTO created a trade panel of three indepen- dent experts. After reviewing evidence and hearing from a range of experts and representatives of both parties, the panel in May 1997 ruled that the EU ban on hormone-treated beef was illegal because it had no scientific justification. The EU immediately indicated it would appeal the finding to the WTO court of appeals. The WTO court heard the appeal in November 1997 and in February 1998 agreed with the find- ings of the trade panel that the EU had not presented any scientific evidence to justify the hormone ban.
- 55. This ruling left the EU in a difficult position. Legally, the EU had to lift the ban or face punitive sanctions, but the ban had wide public support in Europe. The EU feared that lifting the ban could produce a consumer backlash. Instead the EU did nothing, so in February 1999 the United States asked the WTO for permission to impose punitive sanctions on the EU. The WTO responded by allowing the United States to impose punitive tariffs valued at $120 million on EU exports to the United States. The EU decided to accept these tariffs rather than lift the ban on hormone-treated beef, and as of 2010, the ban and punitive tariffs were still in place. Sources: C. Southey, “Hormones Fuel a Meaty EU Row,” Financial Times, September 7, 1995, p. 2; E. L. Andrews, “In Victory for U.S., European Ban on Treated Beef Is Ruled Illegal,” The New York Times, May 9, 1997, p. A1; F. Williams and G. de Jonquieres, “WTO’s Beef Rulings Give Europe Food for Thought,” Financial Times, February 13, 1998, p. 5; R. Baily, “Food and Trade: EU Fearmongers’ Lethal Harvest,” Los Angeles Times, August 18, 2002, p. M3; “The US-EU Dispute over Hormone-Treated Beef,” The Kiplinger Agricultural Letter, January 10, 2003; and Scott Miller, “EU Trade Sanctions Have Duel Edge,” The Wall Street Journal, February 26, 2004, p. A3. 3 Country FOCUS hiL37217_ch06_202-239.indd Page 215 15/07/10 4:02 AM user-f501hiL37217_ch06_202-239.indd Page 215 15/07/10 4:02 AM user-f501 /Users/user-f501/Desktop/Tempwork/July
- 56. 2010/01:07:10/MHBR169:Slavin:VYN/Users/user- f501/Desktop/Tempwork/July 2010/01:07:10/MHBR169:Slavin:VY 216 Part Three Cross-Border Trade and Investment health and may result in “genetic pollution.” (An example of genetic pollution would be when the widespread use of crops that produce natural pesticides stimulates the evolu- tion of “superbugs” that are resistant to those pesticides.) Such concerns have led Austria and Luxembourg to outlaw the importation, sale, or use of genetically altered organ- isms. Sentiment against genetically altered organisms also runs strong in several other European countries, most notably Germany and Switzerland. It seems likely, therefore, that the World Trade Organization will be drawn into the conflict between those that want to expand the global market for genetically altered organisms, such as Monsanto, and those that want to limit it, such as Austria and Luxembourg. 14 Furthering Foreign Policy Objectives Governments sometimes use trade policy to support their foreign policy objectives. 15 A government may grant prefer- ential trade terms to a country with which it wants to build strong relations. Trade policy has also been used several times to pressure or punish “rogue states” that do not abide by international law or norms. Iraq labored under
- 57. extensive trade sanc- tions after the UN coalition defeated the country in the 1991 Gulf War until the 2003 invasion of Iraq by U.S.-led forces. The theory is that such pressure might persuade the rogue state to mend its ways, or it might hasten a change of govern- ment. In the case of Iraq, the sanctions were seen as a way of forcing that country to comply with several UN resolutions. The United States has maintained long- running trade sanctions against Cuba. Their principal function is to impoverish Cuba in the hope that the resulting economic hardship will lead to the downfall of Cuba’s Communist government and its replacement with a more democratically inclined (and pro-U.S.) regime. The United States also has had trade sanctions in place against Libya and Iran, both of which it accuses of supporting terrorist action against U.S. interests and building weapons of mass destruction. In late 2003, the sanctions against Libya seemed to yield some returns when that country announced it would terminate a program to build nuclear weapons, and the U.S. government responded by relaxing those sanctions. Other countries can undermine unilateral trade sanctions. The U.S. sanctions against Cuba, for example, have not stopped other Western countries from trading with Cuba. The U.S. sanctions have done little more than help create a vacuum into which other trading nations, such as Canada and Germany, have stepped. In an attempt
- 58. to halt this and further tighten the screws on Cuba, in 1996 the U.S. Congress passed the Helms-Burton Act. This act allows Americans to sue foreign firms that use prop- erty in Cuba confiscated from them after the 1959 revolution. Later in 1996, Congress passed a similar law, the D’Amato Act, aimed at Libya and Iran. The passage of Helms-Burton elicited protests from America’s trading partners, including the European Union, Canada, and Mexico, all of which claim the law vio- lates their sovereignty and is illegal under World Trade Organization rules. For example, Canadian companies that have been doing business in Cuba for years see no reason they should suddenly be sued in U.S. courts when Canada does not restrict trade with Cuba. They are not violating Canadian law, and they are not U.S. compa- nies, so why should they be subject to U.S. law? Despite such protests, the law is still on the books in the United States, although the U.S. government has not enforced this act—probably because it is unenforceable. Protecting Human Rights Protecting and promoting human rights in other countries is an important element of foreign policy for many democracies. Govern- ments sometimes use trade policy to try to improve the human rights policies of trad- ing partners. For years, the most obvious example of this was the annual debate in the United States over whether to grant most favored nation (MFN) status to China.
- 59. Helms-Burton Act Act passed in 1996 that allowed Americans to sue foreign firms that use Cuban property confiscated from them after the 1959 revolution. D’Amato Act Act passed in 1996, similar to the Helms- Burton Act, aimed at Libya and Iran. hiL37217_ch06_202-239.indd Page 216 15/07/10 4:02 AM user-f501hiL37217_ch06_202-239.indd Page 216 15/07/10 4:02 AM user-f501 /Users/user-f501/Desktop/Tempwork/July 2010/01:07:10/MHBR169:Slavin:VYN/Users/user- f501/Desktop/Tempwork/July 2010/01:07:10/MHBR169:Slavin:VY Chapter Six The Political Economy of International Trade 217 MFN status allows countries to export goods to the United States under favorable terms. Under MFN rules, the average tariff on Chinese goods imported into the United States was 8 percent. If China’s MFN status were rescinded, tariffs could have risen to about 40 percent. Trading partners who are signato-
- 60. ries of the World Trade Organization, as most are, automatically receive MFN status. However, China did not join the WTO until 2001, so historically the decision of whether to grant MFN status to China was a real one. The decision was made more difficult by the perception that China had a poor human rights record. As indications of the country’s disre- gard for human rights, critics of China often point to the 1989 Tiananmen Square massacre, China’s con- tinuing subjugation of Tibet (which China occupied in the 1950s), and the squashing of political dissent in China. 16 These critics argue that it was wrong for the United States to grant MFN status to China, and that instead, the United States should withhold MFN status until China showed measurable improve- ment in its human rights record. The critics argue that trade policy should be used as a political weapon to force China to change its internal policies toward human rights. Others contend that limiting trade with such countries would make matters worse, not better. They argue that the best way to change the internal human rights stance of a country is to engage it through international trade. At its core, the argument is simple: Growing bilateral trade raises the income levels of both countries, and as a state be- comes richer, its people begin to demand, and generally receive, better treatment with regard to their human rights. This is a variant of the argument in Chapter 2 that eco- nomic progress begets political progress (if political progress is measured by the adop- tion of a democratic government that respects human rights). This argument ultimately
- 61. won the day in 1999 when the Clinton administration blessed China’s application to join the WTO and announced that trade and human rights issues should be decoupled. Protecting the Environment Protecting the environment has become an im- portant policy objective of many nations. Increasingly, environmental interest groups such as Friends of the Earth and the Sierra Club have been pressuring governments to regulate international trade in a way the protects the environment. The growing con- cern over global warming has added an important dimension to this debate. One argument frequently made by environmental organizations is that there is a strong relationship between income levels and environmental pollution and degra- dation (i.e., industrial development leads to more pollution). Thus, to the extent that international trade leads to higher income levels, it can also be expected to lead to a decline in environmental quality. Organizations such as the Sierra Club argue that as a consequence, strong environmental safeguards need to be part of any trade agreements, and governments should be allowed to restrict trade if doing so bene- fits the environment. As noted in Chapter 1, the empirical evidence suggests the relationship between income levels and pollution is not a linear one—rather it is an inverted U-shaped rela- tionship (see Figure 1.5). 17 To begin with, as countries start to climb the ladder of
- 62. economic progress, pollution levels do increase, but past some threshold, they start to decline. The reason being that as societies get richer, citizens lobby for environmental protections, and governments tend to respond. We can see this process starting to unfold today in China. China has had an awful reputation for pollution, but in the last Beijing’s Tiananmen Square, a tangible reminder of China’s history of human rights abuses. hiL37217_ch06_202-239.indd Page 217 15/07/10 4:02 AM user-f501hiL37217_ch06_202-239.indd Page 217 15/07/10 4:02 AM user-f501 /Users/user-f501/Desktop/Tempwork/July 2010/01:07:10/MHBR169:Slavin:VYN/Users/user- f501/Desktop/Tempwork/July 2010/01:07:10/MHBR169:Slavin:VY 218 Part Three Cross-Border Trade and Investment few years the Chinese government has been working hard to improve the air quality in its major cities (although the country still has a considerable way to go). In developed nations such as the United States and United Kingdom, the air is much cleaner that it was half a century ago. This data suggests that international trade, and the growth that results from it, may not be damaging to the environment. There is a very important exception to these trends, however, and that is emissions of carbon dioxide. Carbon dioxide emissions do rise with
- 63. income levels. Thus, the country with the highest income per capita, the United States, also produces the great- est carbon dioxide emissions per capita. The reason is that carbon dioxide emissions are a by-product of energy use (i.e., oil, gas, or coal burning). Richer societies are more energy intensive, and to the extent that they use hydrocarbons to produce that energy, this leads to higher carbon dioxide emissions. Carbon dioxide is the greenhouse gas at the center of concerns over global warm- ing. These concerns can be stated simply. 18 First, the burning of fossil fuels to produce energy also releases carbon dioxide into the atmosphere (and atmospheric carbon dioxide concentrations have steadily increased since preindustrial times). Second, car- bon dioxide absorbs heat radiated from the earth, warming the atmosphere. Third, as a consequence, average global temperatures will increase. Indeed, estimates suggest that average global temperatures increased by 0.7 degree centigrade during the past century, and they are forecasted to rise by between 1.1 and 6.4 degrees centigrade this century. 19 Fourth, as global temperatures increase, there will be environmental dislo- cation, ice caps will melt and sea levels will rise, flooding low- lying costal areas; weather patterns will change; the frequency of violent storms will increase; tropical diseases (such as malaria) will move northward; species will go extinct; and so on. Of course, the global climate varies naturally due too, for example, changes in solar
- 64. radiation connected with the well-known sun spot cycle, volcanic activity (which can inject large amounts of sulfur dioxide particles into the atmosphere, temporarily cool- ing it), changes in the circulation of ocean currents, and long- term changes in the orbit of the earth and the tilt of its axis. Human-induced global warming is overlaid on these natural variations. Thus, a natural cooling trend might be moderated by greater atmospheric carbon dioxide concentrations, and a natural warming trend exacerbated by them. Although there is debate over the precise relationship between carbon dioxide con- centrations and the extent of future global warming, the vast majority of climate scien- tists have concluded that unless we take rapid action, we face a rate of warming that in unprecedented during the history of our civilization and may cause major environ- mental dislocation. 20 Given this, they advocate restricting greenhouse gas emissions, particularly carbon dioxide. The first international agreement to limit global warming, the Kyoto Protocol, was signed in 1997, although its impact was reduced by the failure of two of the world’s largest producers of carbon dioxide, the United States and China, to sign. A second international agreement was reached in Copenhagen in 2009, this time with the participation of the United States and China. What does this have to do with international trade? So far, there has been little direct connection between the global warming debate and international trade. How-
- 65. ever, looking forward, adherence to targets regarding carbon emissions might start to factor into trade agreements. Specifically, if countries do not meet their targets for reducing carbon emissions specified in international treaties, they may find them- selves the targets of retaliatory action. The EU, for example, might respond to the failure of the United States to meet its treaty commitments by placing a carbon tariff on the import of certain goods from the United States. Ten years ago this was a re- mote possibility. Ten years from now it may be a significant factor in the international trade environment. hiL37217_ch06_202-239.indd Page 218 15/07/10 4:02 AM user-f501hiL37217_ch06_202-239.indd Page 218 15/07/10 4:02 AM user-f501 /Users/user-f501/Desktop/Tempwork/July 2010/01:07:10/MHBR169:Slavin:VYN/Users/user- f501/Desktop/Tempwork/July 2010/01:07:10/MHBR169:Slavin:VY Chapter Six The Political Economy of International Trade 219 A second argument made with regard to environmental regulations is that, to save money, corporations will move production to countries where environmental regu- lations are lax. Thus, for example, if tight environmental standards in the United States raise costs, a manufacturing firm might move production to a pollution haven such as Mexico where environmental standards are weaker. To
- 66. protect against this possibility, environmental organizations argue that governments should place tariffs or other limitations on goods imported from countries where environmental regula- tions are lax. Economists have studied this issue but have found little evidence that firms do move production in response to changes in pollution regulations. 21 Their findings suggest that pollution abatement costs are a relatively small component of the cost structure of most enterprises, and that other factors, such as labor productivity, access to technological know-how, and transportation costs are far more important in deter- mining location decisions. It is also worth noting that migrating to a pollution haven would violate the ethical principles of many (but not all) organizations (see Chapter 4 for details). In sum, although environmental concerns have not figured significantly in trade treaties to date, there is a good chance that they will do so in the future, particularly with regard to the emission of carbon dioxide and other greenhouse gases. ECONOMIC ARGUMENTS FOR INTERVENTION With the develop- ment of the new trade theory and strategic trade policy (see Chapter 5), the eco- nomic arguments for government intervention have undergone a renaissance in recent years. Until the early 1980s, most economists saw little benefit in government
- 67. intervention and strongly advocated a free trade policy. This position has changed at the margins with the development of strategic trade policy, although as we will see in the next section, there are still strong economic arguments for sticking to a free trade stance. The Infant Industry Argument The infant industry argument is by far the oldest economic argument for government intervention. Alexander Hamilton pro- posed it in 1792. According to this argument, many developing countries have a potential comparative advantage in manufacturing, but new manufacturing industries cannot initially compete with established industries in developed countries. To allow manufacturing to get a toehold, the argument is that governments should temporarily support new industries (with tariffs, import quotas, and subsidies) until they have grown strong enough to meet international competition. This argument has had substantial appeal for the governments of developing nations during the past 50 years, and the GATT has recognized the infant industry argument as a legitimate reason for protectionism. Nevertheless, many economists remain critical of this argument for two main reasons. First, protection of manufactur- ing from foreign competition does no good unless the protection helps make the industry efficient. In case after case, however, protection seems to have done little more than foster the development of inefficient industries that
- 68. have little hope of ever competing in the world market. Brazil, for example, built the world’s tenth-largest auto industry behind tariff barriers and quotas. Once those barriers were removed in the late 1980s, however, foreign imports soared, and the industry was forced to face up to the fact that after 30 years of protection, the Brazilian industry was one of the world’s most inefficient. 22 Second, the infant industry argument relies on an assumption that firms are unable to make efficient long-term investments by borrowing money from the domestic or international capital market. Consequently, governments have been required to Infant Industry Argument New industries in developing countries must be temporarily protected from international competition to help them reach a position where they can compete on world markets with the firms of developed nations. hiL37217_ch06_202-239.indd Page 219 15/07/10 4:02 AM user-f501hiL37217_ch06_202-239.indd Page 219 15/07/10 4:02 AM user-f501 /Users/user-f501/Desktop/Tempwork/July 2010/01:07:10/MHBR169:Slavin:VYN/Users/user- f501/Desktop/Tempwork/July 2010/01:07:10/MHBR169:Slavin:VY
- 69. 220 Part Three Cross-Border Trade and Investment subsidize long-term investments. Given the development of global capital markets over the past 20 years, this assumption no longer looks as valid as it once did. Today, if a developing country has a potential comparative advantage in a manufacturing industry, firms in that country should be able to borrow money from the capital mar- kets to finance the required investments. Given financial support, firms based in countries with a potential comparative advantage have an incentive to endure the necessary initial losses in order to make long-run gains without requiring govern- ment protection. Many Taiwanese and South Korean firms did this in industries such as textiles, semiconductors, machine tools, steel, and shipping. Thus, given efficient global capital markets, the only industries that would require government protection would be those that are not worthwhile. Strategic Trade Policy Some new trade theorists have proposed the strategic trade policy argument. 23 We reviewed the basic argument in Chapter 5 when we con- sidered the new trade theory. The new trade theory argues that in industries in which the existence of substantial economies of scale implies that the world market will prof- itably support only a few firms, countries may predominate in
- 70. the export of certain products simply because they had firms that were able to capture first-mover advan- tages. The long-term dominance of Boeing in the commercial aircraft industry has been attributed to such factors. The strategic trade policy argument has two components. First, it is argued that by appropriate actions, a government can help raise national income if it can some- how ensure that the firm or firms that gain first-mover advantages in an industry are domestic rather than foreign enterprises. Thus, according to the strategic trade pol- icy argument, a government should use subsidies to support promising firms that are active in newly emerging industries. Advocates of this argument point out that the substantial R&D grants that the U.S. government gave Boeing in the 1950s and 1960s probably helped tilt the field of competition in the newly emerging mar- ket for passenger jets in Boeing’s favor. (Boeing’s first commercial jet airliner, the 707, was derived from a military plane.) Similar arguments have been made with regard to Japan’s dominance in the production of liquid crystal display screens (used in laptop computers). Although these screens were invented in the United States, the Japanese government, in cooperation with major electronics companies, tar- geted this industry for research support in the late 1970s and early 1980s. The result was that Japanese firms, not U.S. firms, subsequently captured first-mover advan-
- 71. tages in this market. The second component of the strategic trade policy argument is that it might pay a government to intervene in an industry by helping domestic firms overcome the bar- riers to entry created by foreign firms that have already reaped first-mover advantages. This argument underlies government support of Airbus, Boeing’s major competitor. Formed in 1966 as a consortium of four companies from Great Britain, France, Germany, and Spain, Airbus had less than 5 percent of the world commercial aircraft market when it began production in the mid-1970s. By 2009, it had increased its share to 45 percent, threatening Boeing’s long-term dominance of the market. How did Airbus achieve this? According to the U.S. government, the answer is a $15 billion subsidy from the governments of Great Britain, France, Germany, and Spain. 24 With- out this subsidy, Airbus would never have been able to break into the world market. If these arguments are correct, they support a rationale for government interven- tion in international trade. Governments should target technologies that may be important in the future and use subsidies to support development work aimed at com- mercializing those technologies. Furthermore, government should provide export subsidies until the domestic firms have established first-mover advantages in the world Strategic Trade Policy
- 72. Government policy aimed at improving the competitive position of a domestic industry or domestic firm in the world market. hiL37217_ch06_202-239.indd Page 220 15/07/10 4:02 AM user-f501hiL37217_ch06_202-239.indd Page 220 15/07/10 4:02 AM user-f501 /Users/user-f501/Desktop/Tempwork/July 2010/01:07:10/MHBR169:Slavin:VYN/Users/user- f501/Desktop/Tempwork/July 2010/01:07:10/MHBR169:Slavin:VY Chapter Six The Political Economy of International Trade 221 market. Government support may also be justified if it can help domestic firms over- come the first-mover advantages enjoyed by foreign competitors and emerge as viable competitors in the world market (as in the Airbus and semiconductor examples). In this case, a combination of home-market protection and export- promoting subsidies may be needed. The Revised Case for Free Trade The strategic trade policy arguments of the new trade theorists suggest an economic justification for government intervention in international trade. This justification chal-
- 73. lenges the rationale for unrestricted free trade found in the work of classic trade theorists such as Adam Smith and David Ricardo. In response to this challenge to economic ortho- doxy, a number of economists—including some of those responsible for the development of the new trade theory, such as Paul Krugman—point out that although strategic trade policy looks appealing in theory, in practice it may be unworkable. This response to the strategic trade policy argument constitutes the revised case for free trade. 25 RETALIATION AND TRADE WAR Krugman argues that a strategic trade policy aimed at establishing domestic firms in a dominant position in a global industry is a beggar-thy-neighbor policy that boosts national income at the expense of other countries. A country that attempts to use such policies will probably provoke retalia- tion. In many cases, the resulting trade war between two or more interventionist gov- ernments will leave all countries involved worse off than if a hands-off approach had been adopted in the first place. If the U.S. government were to respond to the Airbus subsidy by increasing its own subsidies to Boeing, for example, the result might be that the subsidies would cancel each other out. In the process, both European and U.S. taxpayers would end up supporting an expensive and pointless trade war, and both Europe and the United States would be worse off. Krugman may be right about the danger of a strategic trade policy leading to a trade
- 74. war. The problem, however, is how to respond when one’s competitors are already being supported by government subsidies; that is, how should Boeing and the United States respond to the subsidization of Airbus? According to Krugman, the answer is pro- bably not to engage in retaliatory action but to help establish rules of the game that minimize the use of trade-distorting subsidies. This is what the World Trade Organiza- tion seeks to do. DOMESTIC POLICIES Governments do not always act in the national interest when they intervene in the economy; politically important interest groups often influ- ence them. The European Union’s support for the Common Agricultural Policy (CAP), which arose because of the political power of French and German farmers, is an example. The CAP benefited inefficient farmers and the politicians who relied on the farm vote, but not consumers in the EU, who end up paying more for their food- stuffs. Thus, a further reason for not embracing strategic trade policy, according to Krugman, is that such a policy is almost certain to be captured by special-interest groups within the economy, who will distort it to their own ends. Krugman concludes that in the United States, To ask the Commerce Department to ignore special-interest politics while for- mulating detailed policy for many industries is not realistic: To establish a blan-
- 75. ket policy of free trade, with exceptions granted only under extreme pressure, may not be the optimal policy according to the theory but may be the best policy that the country is likely to get. 26 LEARNING OBJECTIVE 3 Summarize and explain the arguments against strategic trade policy. hiL37217_ch06_202-239.indd Page 221 15/07/10 4:02 AM user-f501hiL37217_ch06_202-239.indd Page 221 15/07/10 4:02 AM user-f501 /Users/user-f501/Desktop/Tempwork/July 2010/01:07:10/MHBR169:Slavin:VYN/Users/user- f501/Desktop/Tempwork/July 2010/01:07:10/MHBR169:Slavin:VY 222 Part Three Cross-Border Trade and Investment Development of the World Trading System Strong economic arguments support unrestricted free trade. While many govern- ments have recognized the value of these arguments, they have been unwilling to uni- laterally lower their trade barriers for fear that other nations might not follow suit. Consider the problem that two neighboring countries, say, Brazil and Argentina, face when deciding whether to lower trade barriers between them. In principle, the gov- ernment of Brazil might favor lowering trade barriers, but it might be unwilling to do
- 76. so for fear that Argentina will not do the same. Instead, the government might fear that the Argentineans will take advantage of Brazil’s low barriers to enter the Brazilian market, while at the same time continuing to shut Brazilian products out of their mar- ket through high trade barriers. The Argentinean government might believe that it faces the same dilemma. The essence of the problem is a lack of trust. Both govern- ments recognize that their respective nations will benefit from lower trade barriers between them, but neither government is willing to lower barriers for fear that the other might not follow. 27 Such a deadlock can be resolved if both countries negotiate a set of rules to govern cross-border trade and lower trade barriers. But who is to monitor the governments to make sure they are playing by the trade rules? And who is to impose sanctions on a government that cheats? Both governments could set up an independent body to act as a referee. This referee could monitor trade between the countries, make sure that no side cheats, and impose sanctions on a country if it does cheat in the trade game. While it might sound unlikely that any government would compromise its national sovereignty by submitting to such an arrangement, since World War II an international trading framework has evolved that has exactly these features. For its first 50 years, this framework was known as the General Agreement on Tariffs and Trade. Since 1995, it has been known as the World Trade Organization. Here
- 77. we look at the evolu- tion and workings of the GATT and WTO. FROM SMITH TO THE GREAT DEPRESSION As noted in Chapter 5, the theoretical case for free trade dates to the late eighteenth century and the work of Adam Smith and David Ricardo. Free trade as a government policy was first officially embraced by Great Britain in 1846, when the British Parliament repealed the Corn Laws. The Corn Laws placed a high tariff on imports of foreign corn. The objectives of the Corn Laws tariff were to raise government revenues and to protect British corn producers. There had been annual motions in Parliament in favor of free trade since the 1820s when David Ricardo was a member. However, agricultural protection was withdrawn only as a result of a protracted debate when the effects of a harvest failure in Great Britain were compounded by the imminent threat of famine in Ireland. Faced with considerable hardship and suffering among the populace, Parliament narrowly reversed its long-held position. During the next 80 years or so, Great Britain, as one of the world’s dominant trad- ing powers, pushed the case for trade liberalization; but the British government was a voice in the wilderness. Its major trading partners did not reciprocate the British pol- icy of unilateral free trade. The only reason Britain kept this policy for so long was that as the world’s largest exporting nation, it had far more to lose from a trade war
- 78. than did any other country. By the 1930s, the British attempt to stimulate free trade was buried under the eco- nomic rubble of the Great Depression. The Great Depression had roots in the failure of the world economy to mount a sustained economic recovery after the end of World War I in 1918. Things got worse in 1929 with the U.S. stock market collapse and the subsequent run on the U.S. banking system. Economic problems were compounded LEARNING OBJECTIVE 4 Describe the development of the world trading system and the current trade issues. hiL37217_ch06_202-239.indd Page 222 15/07/10 4:02 AM user-f501hiL37217_ch06_202-239.indd Page 222 15/07/10 4:02 AM user-f501 /Users/user-f501/Desktop/Tempwork/July 2010/01:07:10/MHBR169:Slavin:VYN/Users/user- f501/Desktop/Tempwork/July 2010/01:07:10/MHBR169:Slavin:VY Chapter Six The Political Economy of International Trade 223 in 1930 when the U.S. Congress passed the Smoot-Hawley tariff. Aimed at avoiding rising unemployment by protecting domestic industries and diverting consumer de- mand away from foreign products, the Smoot-Hawley Act erected an enormous wall of tariff barriers. Almost every industry was rewarded with its
- 79. “made-to-order” tariff. A particularly odd aspect of the Smoot-Hawley tariff-raising binge was that the United States was running a balance-of-payment surplus at the time and it was the world’s largest creditor nation. The Smoot-Hawley Act had a damaging effect on employment abroad. Other countries reacted to the U.S. action by raising their own tariff barriers. U.S. exports tumbled in response, and the world slid further into the Great Depression. 28 1947–1979: GATT, TRADE LIBERALIZATION, AND ECONOMIC GROWTH Economic damage caused by the beggar-thy- neighbor trade policies that the Smoot-Hawley Act ushered in exerted a profound influence on the economic institutions and ideology of the post–World War II world. The United States emerged from the war both victorious and economically dominant. After the debacle of the Great Depression, opinion in the U.S. Congress had swung strongly in favor of free trade. Under U.S. leadership, the GATT was established in 1947. The GATT was a multilateral agreement whose objective was to liberalize trade by eliminating tariffs, subsidies, import quotas, and the like. From its foundation in 1947 until it was superseded by the WTO, the GATT’s membership grew from 19 to more than 120 nations. The GATT did not attempt to liberalize trade restrictions in one fell swoop; that would have been impossible. Rather, tariff
- 80. reduction was spread over eight rounds. The last, the Uruguay Round, was launched in 1986 and completed in December 1993. In these rounds, mutual tariff reductions were negotiated among all members, who then committed themselves not to raise import tariffs above negotiated rates. GATT regulations were enforced by a mutual monitoring mechanism. If a country believed that one of its trading partners was violating a GATT regulation, it could ask the Geneva-based bureaucracy that administered the GATT to investigate. If GATT investigators found the complaints to be valid, member countries could be asked to pressure the offending party to change its policies. In general, such pressure was sufficient to get an offending country to change its policies. If it were not, the offending country could be expelled from the GATT. In its early years, the GATT was by most measures very successful. For example, the average tariff declined by nearly 92 percent in the United States between the Geneva Round of 1947 and the Tokyo Round of 1973–79. Consistent with the the- oretical arguments first advanced by Ricardo and reviewed in Chapter 5, the move toward free trade under the GATT appeared to stimulate economic growth. From 1953 to 1963, world trade grew at an annual rate of 6.1 percent, and world income grew at an annual rate of 4.3 percent. Performance from 1963 to 1973 was even better; world trade grew at 8.9 percent annually, and world income grew at 5.1 per-
- 81. cent annually. 29 1980–1993: PROTECTIONIST TRENDS During the 1980s and early 1990s, the world trading system erected by the GATT came under strain as pres- sures for greater protectionism increased around the world. Three reasons caused the rise in such pressures during the 1980s. First, the economic success of Japan strained the world trading system. Japan was in ruins when the GATT was created. By the early 1980s, however, it had become the world’s second- largest economy and its largest exporter. Japan’s success in such industries as automobiles and semicon- ductors might have been enough to strain the world trading system. Things were made worse by the widespread perception in the West that despite low tariff rates Smoot-Hawley Act Enacted in 1930 by the U.S. Congress, this tariff erected a wall of barriers against imports into the United States. hiL37217_ch06_202-239.indd Page 223 15/07/10 4:02 AM user-f501hiL37217_ch06_202-239.indd Page 223 15/07/10 4:02 AM user-f501 /Users/user-f501/Desktop/Tempwork/July 2010/01:07:10/MHBR169:Slavin:VYN/Users/user- f501/Desktop/Tempwork/July 2010/01:07:10/MHBR169:Slavin:VY
- 82. 224 Part Three Cross-Border Trade and Investment and subsidies, Japanese markets were closed to imports and foreign investment by administrative trade barriers. Second, the world trading system was strained by the persistent trade deficit in the world’s largest economy, the United States. Although the deficit peaked in 1987 at more than $170 billion, by the end of 1992 the annual rate was still running about $80 billion. From a political perspective, the matter was worsened in 1992 by the $45 billion U.S. trade deficit with Japan, a country perceived as not playing by the rules. The consequences of the U.S. deficit included painful adjustments in indus- tries such as automobiles, machine tools, semiconductors, steel, and textiles, where domestic producers steadily lost market share to foreign competitors. The resulting unemployment gave rise to renewed demands in the U.S. Congress for protection against imports. A third reason for the trend toward greater protectionism was that many countries found ways to get around GATT regulations. Bilateral voluntary export restraints, or VERs, circumvent GATT agreements, because neither the importing country nor the exporting country complain to the GATT bureaucracy in Geneva—and without a com- plaint, the GATT bureaucracy can do nothing. Exporting countries agree to VERs to avoid more damaging punitive tariffs. One of the best-known
- 83. examples is the automo- bile VER between Japan and the United States, under which Japanese producers promised to limit their auto imports into the United States as a way of defusing grow- ing trade tensions. According to a World Bank study, 13 percent of the imports of industrialized countries in 1981 were subjected to nontariff trade barriers such as VERs. By 1986, this figure had increased to 16 percent. The most rapid rise was in the United States, where the value of imports affected by nontariff barriers (primarily VERs) increased by 23 percent between 1981 and 1986. 30 THE URUGUAY ROUND AND THE WORLD TRADE ORGANIZATION Against the background of rising pressures for protectionism, in 1986 GATT mem- bers embarked on their eighth round of negotiations to reduce tariffs, the Uruguay Round (so named because it occurred in Uruguay). This was the most difficult round of negotiations yet, primarily because it was also the most ambitious. Until then, GATT rules had applied only to trade in manufactured goods and commodities. In the Uruguay Round, member countries sought to extend GATT rules to cover trade in services. They also sought to write rules governing the protection of intellectual prop- erty, to reduce agricultural subsidies, and to strengthen the GATT’s monitoring and enforcement mechanisms. The Uruguay Round dragged on for seven years before an agreement was reached
- 84. December 15, 1993. It went into effect July 1, 1995. The Uruguay Round contained the following provisions: 1. Tariffs on industrial goods were to be reduced by more than one-third, and tariffs were to be scrapped on more than 40 percent of manufactured goods. 2. Average tariff rates imposed by developed nations on manufactured goods were to be reduced to less than 4 percent of value, the lowest level in modern history. 3. Agricultural subsidies were to be substantially reduced. 4. GATT fair trade and market access rules were to be extended to cover a wide range of services. 5. GATT rules also were to be extended to provide enhanced protection for patents, copyrights, and trademarks (intellectual property). 6. Barriers on trade in textiles were to be significantly reduced over 10 years. 7. The World Trade Organization was to be created to implement the GATT agreement. hiL37217_ch06_202-239.indd Page 224 15/07/10 4:02 AM user-f501hiL37217_ch06_202-239.indd Page 224 15/07/10 4:02 AM user-f501 /Users/user-f501/Desktop/Tempwork/July 2010/01:07:10/MHBR169:Slavin:VYN/Users/user- f501/Desktop/Tempwork/July 2010/01:07:10/MHBR169:Slavin:VY
- 85. Chapter Six The Political Economy of International Trade 225 Services and Intellectual Property In the long run, the extension of GATT rules to cover services and intellectual property may be particularly significant. Until 1995, GATT rules applied only to industrial goods (i.e., manufactured goods and com- modities). In 2007, world trade in services amounted to $3.260 billion (compared to world trade in goods of $13,570 billion). 31 Ultimately, extension of GATT rules to this important trading arena could significantly increase both the total share of world trade accounted for by services and the overall volume of world trade. The extension of GATT rules to cover intellectual property will make it much easier for high- technology companies to do business in developing nations where intellectual property rules his- torically have been poorly enforced (see Chapter 2 for details). The World Trade Organization The clarification and strengthening of GATT rules and the creation of the World Trade Organization also hold out the promise of more effective policing and enforcement of GATT rules. The WTO acts as an um- brella organization that encompasses the GATT along with two new sister bodies, one on services and the other on intellectual property. The WTO’s General Agreement on Trade in Services (GATS) has taken the lead to extending free
- 86. trade agreements to services. The WTO’s Agreement on Trade-Related Aspects of Intellectual Property Rights (TRIPS) is an attempt to narrow the gaps in the way intellectual property rights are protected around the world and to bring them under common international rules. WTO has taken over responsibility for arbitrating trade disputes and monitor- ing the trade policies of member countries. While the WTO operates on the basis of consensus as the GATT did, in the area of dispute settlement, member countries are no longer able to block adoption of arbitration reports. Arbitration panel reports on trade disputes between member countries are automatically adopted by the WTO un- less there is a consensus to reject them. Countries that have been found by the arbitra- tion panel to violate GATT rules may appeal to a permanent appellate body, but its verdict is binding. If offenders fail to comply with the recommendations of the arbitra- tion panel, trading partners have the right to compensation or, in the last resort, to impose (commensurate) trade sanctions. Every stage of the procedure is subject to strict time limits. Thus, the WTO has something that the GATT never had—teeth. 32 WTO: Experience to Date By 2010, the WTO had 153 members, including China, which joined at the end of 2001, who collectively account for 97 percent of world trade. Another 25 countries, including the Russian Federation, were negotiating
- 87. for membership. Since its formation, the WTO has remained at the forefront of efforts to promote global free trade. Its creators expressed the hope that the enforcement mechanisms granted to the WTO would make it more effective than the GATT had been at policing global trade rules. The great hope was that the WTO might emerge as an effective advocate and facilitator of future trade deals, particularly in areas such as services. The experience so far has been encouraging, although the collapse of WTO talks in Seattle in late 1999, slow progress with the next round of trade talks (the Doha Round), and a shift back toward some limited protectionism in 2008–2009 have raised a number of questions about the future direction of the WTO. WTO as Global Police The first decade in the life of the WTO suggests that its policing and enforcement mechanisms are having a positive effect. 33 Between 1995 and early 2010 more than 400 trade disputes between member countries were brought to the WTO. 34 This record compares with a total of 196 cases handled by the GATT over almost half a century. Of the cases brought to the WTO, three- fourths had been resolved by informal consultations between the disputing countries. Resolving the remainder has involved more formal procedures, but these have been largely successful. hiL37217_ch06_202-239.indd Page 225 15/07/10 4:02 AM user-f501hiL37217_ch06_202-239.indd Page 225 15/07/10 4:02 AM user-f501 /Users/user-f501/Desktop/Tempwork/July
- 88. 2010/01:07:10/MHBR169:Slavin:VYN/Users/user- f501/Desktop/Tempwork/July 2010/01:07:10/MHBR169:Slavin:VY 226 Part Three Cross-Border Trade and Investment In general, countries involved have adopted the WTO’s recommendations. The fact that countries are using the WTO represents an important vote of confidence in the organization’s dispute resolution procedures. Expanding Trade Agreements As explained above, the Uruguay Round of GATT negotiations extended global trading rules to cover trade in services. The WTO was given the role of brokering future agreements to open global trade in ser- vices. The WTO was also encouraged to extend its reach to encompass regulations governing foreign direct investment, something the GATT had never done. Two of the first industries targeted for reform were the global telecommunication and finan- cial services industries. In February 1997, the WTO brokered a deal to get countries to agree to open their telecommunication markets to competition, allowing foreign operators to pur- chase ownership stakes in domestic telecommunication providers and establishing a set of common rules for fair competition. Under the pact, 68 countries accounting for more than 90 percent of world telecommunication revenues
- 89. pledged to start opening their markets to foreign competition and to abide by common rules for fair competi- tion in telecommunications. Most of the world’s biggest markets, including the United States, European Union, and Japan, were fully liberalized by January 1, 1998, when the pact went into effect. All forms of basic telecommunication service are cov- ered, including voice telephony, data and fax transmissions, and satellite and radio communications. Many telecommunication companies responded positively to the deal, pointing out that it would give them a much greater ability to offer their busi- ness customers one-stop shopping—a global, seamless service for all their corporate needs and a single bill. 35 This was followed in December 1997 with an agreement to liberalize cross-border trade in financial services. 36 The deal covers more than 95 percent of the world’s financial services market. Under the agreement, which took effect at the beginning of March 1999, 102 countries pledged to open to varying degrees their banking, securi- ties, and insurance sectors to foreign competition. In common with the telecommuni- cation deal, the accord covers not just cross-border trade but also foreign direct investment. Seventy countries agreed to dramatically lower or eradicate barriers to foreign direct investment in their financial services sector. The United States and the European Union, with minor exceptions, are fully open to inward investment by for-
- 90. eign banks, insurance, and securities companies. As part of the deal, many Asian coun- tries made important concessions that allow significant foreign participation in their financial ser- vices sectors for the first time. The WTO in Seattle: A Watershed? At the end of November 1999, representatives from the WTO’s member states met in Seattle, Washington. The goal of the meeting was to launch a new round of talks—dubbed “the millennium round”—aimed at further reducing barriers to cross-border trade and investment. Prominent on the agenda was an attempt to get the assembled countries to agree to work to- ward the reduction of barriers to cross-border trade in agricultural products and trade and investment in services. These expectations were dashed on the rocks of a hard and unexpected reality. The talks ended WTO protesters gather in front of the Niketown store at Fifth Avenue and Pike Street in downtown Seattle before the opening of the WTO session in 1999. hiL37217_ch06_202-239.indd Page 226 15/07/10 4:02 AM user-f501hiL37217_ch06_202-239.indd Page 226 15/07/10 4:02 AM user-f501 /Users/user-f501/Desktop/Tempwork/July 2010/01:07:10/MHBR169:Slavin:VYN/Users/user- f501/Desktop/Tempwork/July 2010/01:07:10/MHBR169:Slavin:VY
- 91. Chapter Six The Political Economy of International Trade 227 December 3, 1999, without any agreement being reached. Inside the meeting rooms, the problem was an inability to reach consensus on the primary goals for the next round of talks. A major stumbling block was friction between the United States and the European Union over whether to endorse the aim of ultimately eliminating subsi- dies to agricultural exporters. The United States wanted the elimination of such sub- sidies to be a priority. The EU, with its politically powerful farm lobby and long history of farm subsidies, was unwilling to take this step. Another stumbling block was related to efforts by the United States to write “basic labor rights” into the law of the world trading system. The United States wanted the WTO to allow governments to impose tariffs on goods imported from countries that did not abide by what the United States saw as fair labor practices. Representatives from developing nations reacted an- grily to this proposal, suggesting it was simply an attempt by the United States to find a legal way of restricting imports from poorer nations. While the disputes inside the meeting rooms were acrimonious, it was events out- side that captured the attention of the world press. The WTO talks proved to be a lightning rod for a diverse collection of organizations from environmentalists and human rights groups to labor unions. For various reasons, these groups oppose free
- 92. trade. All these organizations argued that the WTO is an undemocratic institution that was usurping the national sovereignty of member states and making decisions of great importance behind closed doors. They took advantage of the Seattle meetings to voice their opposition, which the world press recorded. Environmentalists expressed concern about the impact that free trade in agricul- tural products might have on the rate of global deforestation. They argued that lower tariffs on imports of lumber from developing nations will stimulate demand and accelerate the rate at which virgin forests are logged, particularly in nations such as Malaysia and Indonesia. They also pointed to the adverse impact that some WTO rulings have had on environmental policies. For example, the WTO had blocked a U.S. rule that ordered shrimp nets be equipped with a device that allows endangered sea turtles to escape. The WTO found the rule discriminated against foreign import- ers who lacked such nets. 37 Environmentalists argued that the rule was necessary to protect the turtles from extinction. Human rights activists see WTO rules as outlawing the ability of nations to stop imports from countries where child labor is used or working conditions are hazardous. Similarly, labor unions oppose trade laws that allow imports from low-wage countries and result in a loss of jobs in high-wage countries. They buttress their position by arguing that American workers are losing their jobs to imports from developing
- 93. nations that do not have adequate labor standards. Supporters of the WTO and free trade dismiss these concerns. They have repeat- edly pointed out that the WTO exists to serve the interests of its member states, not subvert them. The WTO lacks the ability to force any member nation to take an action to which it is opposed. The WTO can allow member nations to impose retalia- tory tariffs on countries that do not abide by WTO rules, but that is the limit of its power. Furthermore, supporters argue, it is rich countries that pass strict environmen- tal laws and laws governing labor standards, not poor ones. In their view, free trade, by raising living standards in developing nations, will be followed by the passage of such laws in these nations. Using trade regulations to try to impose such practices on devel- oping nations, they believe, will produce a self-defeating backlash. Many representatives from developing nations, which make up about 70 percent of the WTO’s members, also reject the position taken by environmentalists and advo- cates of human and labor rights. Poor countries, which depend on exports to boost their economic growth rates and work their way out of poverty, fear that rich coun- tries will use environmental concerns, human rights, and labor- related issues to erect hiL37217_ch06_202-239.indd Page 227 15/07/10 4:02 AM user-f501hiL37217_ch06_202-239.indd Page 227 15/07/10 4:02 AM user-f501 /Users/user-f501/Desktop/Tempwork/July 2010/01:07:10/MHBR169:Slavin:VYN/Users/user-
- 94. f501/Desktop/Tempwork/July 2010/01:07:10/MHBR169:Slavin:VY 228 Part Three Cross-Border Trade and Investment barriers to the products of the developing world. They believe that attempts to incor- porate language about the environment or labor standards in future trade agreements will amount to little more than trade barriers by another name. 38 If this were to oc- cur, they argue that the effect would be to trap the developing nations of the world in a grinding cycle of poverty and debt. These pro-trade arguments fell on deaf ears. As the WTO representatives gathered in Seattle, environmentalists, human rights activists, and labor unions marched in the streets. Some of the more radical elements in these organizations, together with groups of anarchists who were philosophically opposed to “global capitalism” and “the rape of the world by multinationals,” succeeded not only in shutting down the opening ceremonies of the WTO but also in sparking violence in the normally peaceful streets of Seattle. A number of demonstrators damaged property and looted; and the police responded with tear gas, rubber bullets, pepper spray, and baton charges. When it was over, 600 demonstrators had been arrested, millions of dollars in property had been damaged in downtown Seattle, and the global news media had their headline: “WTO
- 95. Talks Collapse amid Violent Demonstrations.” What happened in Seattle is notable because it may have been a watershed of sorts. In the past, previous trade talks were pursued in relative obscurity with only interested economists, politicians, and businesspeople paying much attention. Seattle demon- strated that the issues surrounding the global trend toward free trade have moved to center stage in the popular consciousness, and they have remained there since. The debate on the merits of free trade and globalization has become mainstream. Whether further liberalization occurs, therefore, may depend on the importance that popular opinion in countries such as the United States attaches to issues such as human rights and labor standards, job security, environmental policies, and national sovereignty. It will also depend on the ability of advocates of free trade to articulate in a clear and compelling manner the argument that, in the long run, free trade is the best way of promoting adequate labor standards, of providing more jobs, and of protecting the environment. THE FUTURE OF THE WTO: UNRESOLVED ISSUES AND THE DOHA ROUND Much remains to be done on the international trade front. Four issues at the forefront of the current agenda of the WTO are the increase in anti- dumping policies, the high level of protectionism in agriculture, the lack of strong protection for intellectual property rights in many nations, and
- 96. continued high tariff rates on nonagricultural goods and services in many nations. We shall look at each in turn before discussing the latest round of talks between WTO members aimed at reducing trade barriers, the Doha Round, which began in 2001 and were still ongoing as of 2010. Antidumping Actions Antidumping actions proliferated during the 1990s. WTO rules allow countries to impose antidumping duties on foreign goods that are being sold cheaper than at home, or below their cost of production, when domestic produc- ers can show that they are being harmed. Unfortunately, the rather vague definition of what constitutes “dumping” has proved to be a loophole that many countries are ex- ploiting to pursue protectionism. Between 1995 and 2008, WTO members had reported implementation of some 3,427 antidumping actions to the WTO. India initiated the largest number of anti- dumping actions, some 564; the EU initiated 391 over the same period, and the United States 418 (see Figure 6.2). Antidumping actions seem to be concentrated in certain sectors of the economy such as basic metal industries (e.g., aluminum and steel), chemicals, plastics, and machinery and electrical equipment. 39 These sectors account hiL37217_ch06_202-239.indd Page 228 15/07/10 4:02 AM user-f501hiL37217_ch06_202-239.indd Page 228 15/07/10 4:02 AM user-f501 /Users/user-f501/Desktop/Tempwork/July
- 97. 2010/01:07:10/MHBR169:Slavin:VYN/Users/user- f501/Desktop/Tempwork/July 2010/01:07:10/MHBR169:Slavin:VY Chapter Six The Political Economy of International Trade 229 for some 70 percent of all antidumping actions reported to the WTO. These four sec- tors since 1995 have been characterized by periods of intense competition and excess productive capacity, which have led to low prices and profits (or losses) for firms in those industries. It is not unreasonable, therefore, to hypothesize that the high level of antidumping actions in these industries represents an attempt by beleaguered manu- facturers to use the political process in their nations to seek protection from foreign competitors, who they claim are engaging in unfair competition. While some of these claims may have merit, the process can become very politicized as representatives of businesses and their employees lobby government officials to “protect domestic jobs from unfair foreign competition,” and government officials, mindful of the need to get votes in future elections, oblige by pushing for antidumping actions. The WTO is clearly worried by this trend, suggesting that it reflects persistent protectionist ten- dencies and pushing members to strengthen the regulations governing the imposition of antidumping duties. Figure 6.2 suggests that antidumping actions peaked in the
- 98. 1999-2001 time period and declined thereafter. However, the WTO reported a rise in antidumping actions in 2008 and 2009 as the global financial crisis took hold (the 2009 data are not included in Figure 6.2, since at the time of writing the data had not been finalized). Many of these actions seem to have been a direct response to the decline in global demand that followed the financial crisis and suggest that countries were using antidumping actions as a means of protecting domestic producers. The most frequent target of these ac- tions was China. Protectionism in Agriculture Another recent focus of the WTO has been the high level of tariffs and subsidies in the agricultural sector of many economies. Tariff rates on agricultural products are generally much higher than tariff rates on manufac- tured products or services. For example, in the mid-2000s the average tariff rates on nonagricultural products were 4.2 percent for Canada, 3.8 percent for the European Union, 3.9 percent for Japan, and 4.4 percent for the United States. On agricultural products, however, the average tariff rates were 21.2 percent for Canada, 15.9 percent for the European Union, 18.6 percent for Japan, and 10.3 percent for the United 400 50
- 99. 100 150 200 250 300 350 0 1995 1996 1997 1998 1999 2000 2001 2002 2003 2004 20062005 2007 2008 Rest of the WorldUnited StatesIndiaEuropean Community N um be r o f a gr ee m en ts 6.2 figure
- 100. Antidumping Actions, 1995–2008 Source: Constructed by author from WTO data. hiL37217_ch06_202-239.indd Page 229 15/07/10 4:02 AM user-f501hiL37217_ch06_202-239.indd Page 229 15/07/10 4:02 AM user-f501 /Users/user-f501/Desktop/Tempwork/July 2010/01:07:10/MHBR169:Slavin:VYN/Users/user- f501/Desktop/Tempwork/July 2010/01:07:10/MHBR169:Slavin:VY 230 Part Three Cross-Border Trade and Investment States. 40 The implication is that consumers in these countries are paying significantly higher prices than necessary for agricultural products imported from abroad, which leaves them with less money to spend on other goods and services. The historically high tariff rates on agricultural products reflect a desire to protect domestic agri- culture and traditional farming communities from foreign competition. In addition to high tariffs, ag- ricultural producers also benefit from substantial subsidies. According to estimates from the Organi- zation for Economic Cooperation and Develop- ment (OECD), government subsidies on average account for some 17 percent of the cost of agricul- tural production in Canada, 21 percent in the United States, 35 percent in the European Union, and 59 percent in Japan. 41 In total, OECD coun- tries spend more than $300 billion a year in subsi-
- 101. dies to agricultural producers. Not surprising, the combination of high tariff barriers and significant subsidies introduces sig- nificant distortions into the production of agricultural products and international trade of those products. The net effect is to raise prices to consumers, reduce the volume of agricultural trade, and encourage the overproduction of products that are heavily subsidized (with the government typically buying the surplus). Because global trade in agriculture currently amounts to 10.5 percent of total merchandized trade, or about $750 billion per year, the WTO argues that removing tariff barriers and subsidies could significantly boost the overall level of trade, lower prices to consum- ers, and raise global economic growth by freeing consumption and investment re- sources for more productive uses. According to estimates from the International Monetary Fund, removal of tariffs and subsidies on agricultural products would raise global economic welfare by $128 billion annually. 42 Others suggest gains as high as $182 billion. 43 The biggest defenders of the existing system have been the advanced nations of the world, which want to protect their agricultural sectors from competition by low-cost producers in developing nations. In contrast, developing nations have been pushing hard for reforms that would allow their producers greater access to the protected mar-
- 102. kets of the developed nations. Estimates suggest that removing all subsidies on agri- cultural production alone in OECD countries could return to the developing nations of the world three times more than all the foreign aid they currently receive from the OECD nations. 44 In other words, free trade in agriculture could help to jump-start economic growth among the world’s poorer nations and alleviate global poverty. Protecting Intellectual Property Another issue that has become increasingly important to the WTO has been protecting intellectual property. The 1995 Uru- guay agreement that established the WTO also contained an agreement to protect intellectual property (the Trade-Related Aspects of Intellectual Property Rights, or TRIPS, agreement). The TRIPS regulations oblige WTO members to grant and enforce patents lasting at least 20 years and copyrights lasting 50 years. Rich coun- tries had to comply with the rules within a year. Poor countries, in which such pro- tection generally was much weaker, had five years’ grace, and the very poorest had Another Per spect i ve Brazil Wins against U.S. Cotton The United States is known for aggressively protecting its agriculture from overseas competition, but this time it may carry a cost. Claiming for years U.S. subsidies drove down cotton prices worldwide, Brazil recently won its suit against the
- 103. United States before the World Trade Organization (WTO). Not only does the WTO ruling permit Brazil to retaliate against the United States, but it also apparently gives Brazil the right to breach U.S. patents. Accordingly, Brazil said it would impose higher tariffs on U.S. goods totaling nearly $830 million per year, with about $240 million targeting intel- lectual property. That’s likely to hit America where it lives. (“Brazil Takes on Washington,” Forbes, March 26, 2010, www.forbes.com; “Brazil, U.S.: An Intellectual Property Precedent,” Stratfor.com, February 11, 2010, www.stratfor. com; and Steve LeVine, “Brazil Bests U.S. in Cotton Battle,” BusinessWeek, August 31, 2009, www.businessweek.com) hiL37217_ch06_202-239.indd Page 230 15/07/10 4:02 AM user-f501hiL37217_ch06_202-239.indd Page 230 15/07/10 4:02 AM user-f501 /Users/user-f501/Desktop/Tempwork/July 2010/01:07:10/MHBR169:Slavin:VYN/Users/user- f501/Desktop/Tempwork/July 2010/01:07:10/MHBR169:Slavin:VY Chapter Six The Political Economy of International Trade 231 10 years. The basis for this agreement was a strong belief among signatory nations that the protection of intellectual property through patents, trademarks, and copy- rights must be an essential element of the international trading system. Inadequate protections for intellectual property reduce the incentive for innovation. Because innovation is a central engine of economic growth and rising living standards, the argument has been that a multilateral agreement is needed to protect intellectual
- 104. property. Without such an agreement it is feared that producers in a country, let’s say India, might market imitations of patented innovations pioneered in a different country, say the United States. This can affect international trade in two ways. First, it reduces the export opportunities in India for the original innovator in the United States. Second, to the extent that the Indian producer is able to export its pirated imitation to addi- tional countries, it also reduces the export opportunities in those countries for the U.S. inventor. Also, one can argue that because the size of the total world market for the innovator is reduced, its incentive to pursue risky and expensive innovations is also reduced. The net effect would be less innovation in the world economy and less eco- nomic growth. Something very similar to this has been occurring in the pharmaceutical industry, with Indian drug companies making copies of patented drugs discovered elsewhere. In 1970, the Indian government stopped recognizing product patents on drugs, but it elected to continue respecting process patents. This permitted Indian companies to reverse-engineer Western pharmaceuticals without paying licensing fees. As a result, foreigners’ share of the Indian drug market fell from 75 percent in 1970 to 30 percent in 2000. For example, an Indian company sells a version of Bayer’s patented antibiotic Cipro for $0.12 a pill, versus the $5.50 it costs in the United States. Under the WTO
- 105. TRIPS agreement, India agreed to adopt and enforce the international drug patent regime by 2005. 45 As noted in Chapter 2, intellectual property rights violation is also an endemic problem in several other industries, most notably computer software and music. The WTO believes that reducing piracy rates in areas such as drugs, software, and music recordings would have a significant impact on the volume of world trade and increase the incentive for producers to invest in the creation of intellectual property. A world without piracy would have more new drugs, computer software, and music recordings produced every year. In turn, this would boost economic and social welfare, and global economic growth rates. It is thus in the interests of WTO members to make sure that intellectual property rights are respected and enforced. While the 1995 Uruguay agreement that created the WTO did make headway with the TRIPS agree- ment, some believe these requirements do not go far enough and further commit- ments are necessary. Market Access for Nonagricultural Goods and Services Although the WTO and the GATT have made big strides in reducing the tariff rates on nonagricul- tural products, much work remains. Although most developed nations have brought their tariff rates on industrial products down to an average of 3.8 percent of value, exceptions still remain. In particular, while average tariffs are
- 106. low, high tariff rates per- sist on certain imports into developed nations, which limit market access and eco- nomic growth. For example, Australia and South Korea, both OECD countries, still have bound tariff rates of 15.1 percent and 24.6 percent, respectively, on imports of transportation equipment (bound tariff rates are the highest rate that can be charged, which is often, but not always, the rate that is charged). In contrast, the bound tariff rates on imports of transportation equipment into the United States, EU, and Japan hiL37217_ch06_202-239.indd Page 231 15/07/10 4:02 AM user-f501hiL37217_ch06_202-239.indd Page 231 15/07/10 4:02 AM user-f501 /Users/user-f501/Desktop/Tempwork/July 2010/01:07:10/MHBR169:Slavin:VYN/Users/user- f501/Desktop/Tempwork/July 2010/01:07:10/MHBR169:Slavin:VY 232 Part Three Cross-Border Trade and Investment are 2.7 percent, 4.7 percent, and 0 percent, respectively (see Table 6.1). A particular area for concern is high tariff rates on imports of selected goods from developing na- tions into developed nations. In addition, tariffs on services remain higher than on industrial goods. The average tariff on business and financial services imported into United States, for example, is 8.2 percent, into the EU it is 8.5 percent, and into Japan it is 19.7 percent. 46 Given the
- 107. rising value of cross-border trade in services, reducing these figures can be expected to yield substantial gains. The WTO would like to bring down tariff rates still further and reduce the scope for the selective use of high tariff rates. The ultimate aim is to reduce tariff rates to zero. Although this might sound ambitious, 40 nations have already moved to zero tariffs on information technology goods, so a precedent exists. Empirical work sug- gests that further reductions in average tariff rates toward zero would yield substantial gains. One estimate by economists at the World Bank suggests that a broad global trade agreement coming out of the current Doha negotiations could increase world income by $263 billion annually, of which $109 billion would go to poor countries. 47 Another estimate from the OECD suggests a figure closer to $300 billion annually. 48 See the accompanying Country Focus for estimates of the benefits to the American economy from free trade. Looking further out, the WTO would like to bring down tariff rates on imports of nonagricultural goods into developing nations. Many of these nations use the infant industry argument to justify the continued imposition of high tariff rates; however, ultimately these rates need to come down for these nations to reap the full benefits of international trade. For example, the bound tariff rates of 53.9 percent on imports of transportation equipment into India and 33.6 percent on imports into Brazil, by rais-
- 108. ing domestic prices, help to protect inefficient domestic producers and limit economic growth by reducing the real income of consumers who must pay more for transporta- tion equipment and related services. A New Round of Talks: Doha Antidumping actions, trade in agricultural products, better enforcement of intellectual property laws, and expanded market access were four of the issues the WTO wanted to tackle at the 1999 meetings in Seattle, but those meetings were derailed. In late 2001, the WTO tried again to launch a new round of talks between member states aimed at further liberalizing the global trade and investment framework. For this meeting, it picked the remote location of Doha in the Persian Gulf state of Qatar, no doubt with an eye on the Canada 2.8% 6.8% 5.2% United States 1.8 2.7 2.1 Brazil 33.4 33.6 31.9 Mexico 34.7 35.8 34.1 European Union 1.6 4.7 3.3 Australia 4.5 15.1 13.3 Japan 0.9 0.0 0.2 South Korea 7.7 24.6 16.1
- 109. Country Metals Transportation Equipment Electric Machinerytable 6.1 Bound Tariffs on Select Industrial Products (simple averages) Source: WTO. hiL37217_ch06_202-239.indd Page 232 15/07/10 4:02 AM user-f501hiL37217_ch06_202-239.indd Page 232 15/07/10 4:02 AM user-f501 /Users/user-f501/Desktop/Tempwork/July 2010/01:07:10/MHBR169:Slavin:VYN/Users/user- f501/Desktop/Tempwork/July 2010/01:07:10/MHBR169:Slavin:VY Chapter Six The Political Economy of International Trade 233 difficulties that antiglobalization protesters would have in getting there. Unlike the Seattle meetings, at Doha, the member states of the WTO agreed to launch a new round of talks and staked out an agenda. The talks were originally scheduled to last three years, although they have already gone on longer and may not be concluded for a while. The agenda includes cutting tariffs on industrial goods and services, phasing out subsidies to agricultural producers, reducing barriers to cross- border investment, and limiting the use of antidumping laws. Some difficult
- 110. compromises were made to reach agreement on this agenda. The EU and Japan had to give significant ground on the issue of agricultural subsidies, which are used extensively by both entities to support politically powerful farmers. The United States bowed to pres- sure from virtually every other nation to negotiate revisions of antidumping rules, which the United States has used extensively to protect its steel producers from foreign competition. Europe had to scale back its efforts to include environmental policy in the trade talks, primarily because of pressure from developing nations that see environmental protection policies as trade barriers by another name. Excluded from the agenda was any language pertaining to attempts to tie trade to labor stan- dards in a country. Countries with big pharmaceutical sectors acquiesced to demands from African, Asian, and Latin American nations on the issue of drug patents. Specifically, the lan- guage in the agreement declares that WTO regulation on intellectual property “does not and should not prevent members from taking measures to protect public health.” This language was meant to assure the world’s poorer nations that they can make or buy generic equivalents to fight such killers as AIDS and malaria. Estimating the Gains from Trade for America A study published by the Institute for International Eco-
- 111. nomics tried to estimate the gains to the American econ- omy from free trade. According to the study, due to reductions in tariff barriers under the GATT and WTO since 1947, by 2003 the GDP of the United States was 7.3 percent higher than would otherwise be the case. The benefits of that amount to roughly $1 trillion a year, or $9,000 extra income for each American household per year. The same study tried to estimate what would happen if America reached free trade deals with all its trading part- ners, reducing tariff barriers on all goods and services to zero. Using several methods to estimate the impact, the study concluded that additional annual gains of between $450 billion and $1.3 trillion could be realized. This final march to free trade, according to the authors of the study, could safely be expected to raise incomes of the average American household by an additional $4,500 per year. The authors also tried to estimate the scale and cost of employment disruption that would be caused by a move to universal free trade. Jobs would be lost in certain sectors and gained in others if the country abolished all tariff barriers. Using historical data as a guide, they estimated that 226,000 jobs would be lost every year due to expanded trade, although some two-thirds of those losing jobs would find reemployment after a year. Reemployment, however, would be at a wage that was 13 to 14 percent lower. The study concluded that the disruption costs would total some $54 billion annually, primarily in the form of lower lifetime wages to those whose jobs were disrupted as a result of free trade. Offset against this, however, must be the higher economic growth resulting from free trade, which creates many new jobs and raises household incomes, creating another $450 billion to $1.3 trillion annually in net gains to the economy. In other words, the estimated annual gains from trade are far greater than the estimated annual costs associated with job disruption, and more people benefit
- 112. than lose as result of shift to a universal free trade regime. Source: S. C. Bradford, P. L. E. Grieco, and G. C. Hufbauer, “The Payoff to America from Global Integration,” in The United States and the World Economy: Foreign Policy for the Next Decade, ed. C. F. Bergsten (Washington, DC: Institute for International Economics, 2005). 3 Country FOCUS hiL37217_ch06_202-239.indd Page 233 15/07/10 4:02 AM user-f501hiL37217_ch06_202-239.indd Page 233 15/07/10 4:02 AM user-f501 /Users/user-f501/Desktop/Tempwork/July 2010/01:07:10/MHBR169:Slavin:VYN/Users/user- f501/Desktop/Tempwork/July 2010/01:07:10/MHBR169:Slavin:VY 234 Part Three Cross-Border Trade and Investment Focus on Managerial Implications What are the implications of all this for business practice? Why should the interna- tional manager care about the political economy of free trade or about the relative merits of arguments for free trade and protectionism? There are two answers to this question. The first concerns the impact of trade barriers on a firm’s strategy. The second concerns the role that business firms can play in promoting free trade or trade barriers.
- 113. Trade Barriers and Firm Strategy To understand how trade barriers affect a firm’s strategy, consider first the material in Chapter 5. Drawing on the theories of international trade, we discussed how it makes sense for the firm to disperse its various production activities to those countries around the globe where they can be performed most efficiently. Thus, it may make sense for a Clearly, it is one thing to agree to an agenda and quite another to reach a consensus on a new treaty. Nevertheless, if an agreement is reached there are some clear poten- tial winners. These include low-cost agricultural producers in the developing world and developed nations such as Australia and the United States. If the talks are success- ful, agricultural producers in these nations will ultimately see the global markets for their goods expand. Developing nations also gain from the lack of language on labor standards, which many saw as an attempt by rich nations to erect trade barriers. The sick and poor of the world also benefit from guaranteed access to cheaper medicines. There are also clear losers in this agreement, including EU and Japanese farmers, U.S. steelmakers, environmental activists, and pharmaceutical firms in the developed world. These losers can be expected to lobby their governments hard during the ensuing years to make sure that the final agreement is more in their favor. 49 In general, though, if ultimately successful, the Doha Round of negotiations could
- 114. significantly raise global economic welfare. As noted above, estimates suggest that a successful Doha Round would raise global incomes by as much as $300 billion annually, with 60 per- cent of the gain going to the world’s poorer nations, which would help to pull 150 million people out of poverty. 50 The talks are currently ongoing, and as seems normal in these cases, they are characterized by halting progress punctuated by significant setbacks and missed deadlines. A September 2003 meeting in Cancun, Mexico, broke down, primarily because there was no agreement on how to proceed with reducing agricultural sub- sidies and tariffs; the EU, United States, and India, among others, proved less than willing to reduce tariffs and subsidies to their politically important farmers, while countries such as Brazil and certain West African nations wanted free trade as quickly as possible. In 2004, both the United States and the EU made a determined push to start the talks again. However, since then little progress has been made and the talks are in deadlock, primarily because of disagreements over how deep the cuts in subsidies to agricultural produces should be. As of early 2010, the goal was to reduce tariffs for manufactured and agricultural goods by 60 to 70 percent, and to cut subsidies to half of their current level, but getting nations to agree to these goals was proving exceedingly difficult.
- 115. LEARNING OBJECTIVE 5 Explain the implications for managers of developments in the world trading system. hiL37217_ch06_202-239.indd Page 234 15/07/10 4:02 AM user-f501hiL37217_ch06_202-239.indd Page 234 15/07/10 4:02 AM user-f501 /Users/user-f501/Desktop/Tempwork/July 2010/01:07:10/MHBR169:Slavin:VYN/Users/user- f501/Desktop/Tempwork/July 2010/01:07:10/MHBR169:Slavin:VY Chapter Six The Political Economy of International Trade 235 firm to design and engineer its product in one country, to manufacture components in another, to perform final assembly operations in yet another country, and then export the finished product to the rest of the world. Clearly, trade barriers constrain a firm’s ability to disperse its productive activi- ties in such a manner. First and most obvious, tariff barriers raise the costs of ex- porting products to a country (or of exporting partly finished products between countries). This may put the firm at a competitive disadvantage to indigenous com- petitors in that country. In response, the firm may then find it economical to locate production facilities in that country so that it can compete on an even footing. Sec- ond, quotas may limit a firm’s ability to serve a country from locations outside of that country. Again, the response by the firm might be to set up
- 116. production facilities in that country—even though it may result in higher production costs. Such reason- ing was one of the factors behind the rapid expansion of Japanese automaking capacity in the United States during the 1980s and 1990s. This followed the estab- lishment of a VER agreement between the United States and Japan that limited U.S. imports of Japanese automobiles. Third, to conform to local content regulations, a firm may have to locate more production activities in a given market than it would otherwise. Again, from the firm’s perspective, the consequence might be to raise costs above the level that could be achieved if each production activity was dispersed to the optimal location for that activity. And finally, even when trade barriers do not exist, the firm may still want to locate some production activities in a given country to reduce the threat of trade bar- riers being imposed in the future. All these effects are likely to raise the firm’s costs above the level that could be achieved in a world without trade barriers. The higher costs that result need not translate into a significant competitive disadvantage relative to other foreign firms, however, if the countries imposing trade barriers do so to the imported products of all foreign firms, irrespective of their national origin. But when trade barriers are targeted at exports from a particular nation, firms based in that nation are at a com- petitive disadvantage to firms of other nations. The firm may
- 117. deal with such targeted trade barriers by moving production into the country imposing barriers. Another strategy may be to move production to countries whose exports are not targeted by the specific trade barrier. Finally, the threat of antidumping action limits the ability of a firm to use ag- gressive pricing to gain market share in a country. Firms in a country also can make strategic use of antidumping measures to limit aggressive competition from low- cost foreign producers. For example, the U.S. steel industry has been very aggres- sive in bringing antidumping actions against foreign steelmakers, particularly in times of weak global demand for steel and excess capacity. In 1998 and 1999, the United States faced a surge in low-cost steel imports as a severe recession in Asia left producers there with excess capacity. The U.S. producers filed several com- plaints with the International Trade Commission. One argued that Japanese pro- ducers of hot rolled steel were selling it at below cost in the United States. The ITC agreed and levied tariffs ranging from 18 percent to 67 percent on imports of certain steel products from Japan (these tariffs are separate from the steel tariffs discussed earlier).51 Policy Implications As noted in Chapter 5, business firms are major players on the international trade scene. Because of their pivotal role in international trade, firms
- 118. can and do exert a strong influence on government policy toward trade. This influence can encourage protectionism or it can encourage the government to support the WTO and push for hiL37217_ch06_202-239.indd Page 235 15/07/10 4:02 AM user-f501hiL37217_ch06_202-239.indd Page 235 15/07/10 4:02 AM user-f501 /Users/user-f501/Desktop/Tempwork/July 2010/01:07:10/MHBR169:Slavin:VYN/Users/user- f501/Desktop/Tempwork/July 2010/01:07:10/MHBR169:Slavin:VY 236 Part Three Cross-Border Trade and Investment free trade, p. 204 tariff, p. 206 specific tariff, p. 206 ad valorem tariff, p. 206 subsidy, p. 207 import quota, p. 208 tariff rate quota, p. 209 voluntary export restraint (VER) , p. 209 quota rent, p. 210 local content requirement, p. 210 administrative trade policies, p. 210 dumping, p. 211 antidumping policies, p. 211 countervailing duties, p. 211 Helms-Burton Act, p. 216 D’Amato Act, p. 216
- 119. infant industry argument, p. 219 strategic trade policy, p. 220 Smoot-Hawley Act, p. 223 Key Terms open markets and freer trade among all nations. Government policies with regard to international trade can have a direct impact on business. Consistent with strategic trade policy, examples can be found of government in- tervention in the form of tariffs, quotas, antidumping actions, and subsidies helping firms and industries establish a competitive advantage in the world economy. In general, however, the arguments contained in this chapter and in Chapter 5 suggest that government intervention has three drawbacks. Intervention can be self-defeating because it tends to protect the inefficient rather than help firms become efficient global competitors. Intervention is dangerous; it may invite retaliation and trigger a trade war. Finally, intervention is unlikely to be well executed, given the opportunity for such a policy to be captured by special-interest groups. Does this mean that business should simply encourage government to adopt a laissez-faire free trade policy? Most economists would probably argue that the best interests of international busi- ness are served by a free trade stance, but not a laissez-faire stance. It is probably in the best long-run interests of the business community to encourage the government to
- 120. aggressively promote greater free trade by, for example, strengthening the WTO. Business probably has much more to gain from government efforts to open protected markets to imports and foreign direct investment than from government efforts to support certain domestic industries in a manner consistent with the recommendations of strategic trade policy. This conclusion is reinforced by a phenomenon we touched on in Chapter 1—the increasing integration of the world economy and internationalization of produc- tion that has occurred over the past two decades. We live in a world where many firms of all national origins increasingly depend for their competitive advantage on globally dispersed production systems. Such systems are the result of freer trade. Freer trade has brought great advantages to firms that have exploited it and to con- sumers who benefit from the resulting lower prices. Given the danger of retaliatory action, business firms that lobby their governments to engage in protectionism must realize that by doing so they may be denying themselves the opportunity to build a competitive advantage by constructing a globally dispersed production sys- tem. By encouraging their governments to engage in protectionism, their own ac- tivities and sales overseas may be jeopardized if other governments retaliate. This does not mean a firm should never seek protection in the form of antidumping ac- tions and the like, but it should review its options carefully and
- 121. think through the larger consequences. hiL37217_ch06_202-239.indd Page 236 15/07/10 4:02 AM user-f501hiL37217_ch06_202-239.indd Page 236 15/07/10 4:02 AM user-f501 /Users/user-f501/Desktop/Tempwork/July 2010/01:07:10/MHBR169:Slavin:VYN/Users/user- f501/Desktop/Tempwork/July 2010/01:07:10/MHBR169:Slavin:VY Chapter Six The Political Economy of International Trade 237 Summary The goal of this chapter was to describe how the reality of international trade deviates from the theo- retical ideal of unrestricted free trade reviewed in Chapter 5. In this chapter, we have reported the various instruments of trade policy, reviewed the political and economic arguments for government intervention in international trade, reexamined the economic case for free trade in light of the strategic trade policy argument, and looked at the evolution of the world trading framework. While a policy of free trade may not always be the theoretically opti- mal policy (given the arguments of the new trade theorists), in practice it is probably the best policy for a government to pursue. In particular, the long- run interests of business and consumers may be best served by strengthening international institutions such as the WTO. Given the danger that isolated protectionism might escalate into a trade war, busi- ness probably has far more to gain from government efforts to open protected markets to imports and foreign direct investment (through the WTO) than
- 122. from government efforts to protect domestic indus- tries from foreign competition. The chapter made the following points: 1. Trade policies, such as tariffs, subsidies, antidumping regulations, and local content requirements tend to be pro-producer and anti-consumer. Gains accrue to producers (who are protected from foreign competitors), but consumers lose because they must pay more for imports. 2. There are two types of arguments for government intervention in international trade: political and economic. Political arguments for intervention are concerned with protecting the interests of certain groups, often at the expense of other groups, or with promoting goals with regard to foreign policy, human rights, consumer protection, and the like. Economic arguments for intervention are about boosting the overall wealth of a nation. 3. A common political argument for intervention is that it is necessary to protect jobs. However, political intervention often hurts consumers and it can be self-defeating. Countries sometimes argue that it is important to protect certain industries for reasons of national security. Some argue that government should use the threat to intervene in trade policy as a bargaining tool to open foreign markets. This can be a risky policy; if it fails, the result can be higher trade barriers.
- 123. 4. The infant industry argument for government intervention contends that to let manufacturing get a toehold, governments should temporarily support new industries. In practice, however, governments often end up protecting the inefficient. 5. Strategic trade policy suggests that with subsidies, government can help domestic firms gain first-mover advantages in global industries where economies of scale are important. Government subsidies may also help domestic firms overcome barriers to entry into such industries. 6. The problems with strategic trade policy are twofold: (a) such a policy may invite retaliation, in which case all will lose, and (b) strategic trade policy may be captured by special- interest groups, which will distort it to their own ends. 7. The GATT was a product of the postwar free trade movement. The GATT was successful in lowering trade barriers on manufactured goods and commodities. The move toward greater free trade under the GATT appeared to stimulate economic growth. 8. The completion of the Uruguay Round of GATT talks and the establishment of the World Trade Organization have strengthened the world trading system by extending GATT rules to services, increasing protection for intellectual property, reducing agricultural subsidies, and enhancing monitoring and
- 124. enforcement mechanisms. 9. Trade barriers act as a constraint on a firm’s ability to disperse its various production activities to optimal locations around the globe. One response to trade barriers is to establish more production activities in the protected country. 10. Business may have more to gain from government efforts to open protected markets to imports and foreign direct investment than from government efforts to protect domestic industries from foreign competition. hiL37217_ch06_202-239.indd Page 237 15/07/10 4:02 AM user-f501hiL37217_ch06_202-239.indd Page 237 15/07/10 4:02 AM user-f501 /Users/user-f501/Desktop/Tempwork/July 2010/01:07:10/MHBR169:Slavin:VYN/Users/user- f501/Desktop/Tempwork/July 2010/01:07:10/MHBR169:Slavin:VY 238 Part Three Cross-Border Trade and Investment Why Did Global Food Prices Rise? For a quarter of a century, global food prices had been falling, driven by the increased productivity and output of the farm sector worldwide. In 2007, this came to an abrupt end as global food prices soared. By September 2007, the world price of wheat rose to more than $400 a ton—the highest ever recorded and up from $200 a ton in May. The price of corn (maize) surged to $175 a ton, some 60 percent above its average for 2006. An
- 125. index of food prices, which The Economist magazine has kept since 1845 and is adjusted for inflation, hit its highest level ever in December 2007! One explanation for rising food prices has been increased demand. The increased demand has been driven by greater food consumption in rapidly developing nations, most notably China and India. Rising consumption of meat, in particular, closing case Critical Thinking and Discussion Questions 1. Do you think governments should consider human rights when granting preferential trading rights to countries? What are the arguments for and against taking such a position? 2. Whose interests should be the paramount concern of government trade policy—the interests of producers (businesses and their employees) or those of consumers? 3. Given the arguments relating to the new trade theory and strategic trade policy, what kind of trade policy should business be pressuring government to adopt? 4. You are an employee of a U.S. firm that produces personal computers in Thailand and then exports them to the United States and other countries for sale. The personal computers were originally produced in Thailand to take advantage of relatively low labor costs and a
- 126. skilled workforce. Other possible locations considered at the time were Malaysia and Hong Kong. The U.S. government decides to impose punitive 100 percent ad valorem tariffs on imports of computers from Thailand to punish the country for administrative trade barriers that restrict U.S. exports to Thailand. How should your firm respond? What does this tell you about the use of targeted trade barriers? 5. Reread the Management Focus “U.S. Magnesium Seeks Protection.” Who gains most from the antidumping duties levied by the United States on imports of magnesium from China and Russia? Who are the losers? Are these duties in the best national interests of the United States? Use the globalEDGE Resource Desk (http:// globalEDGE.msu.edu/resourcedesk/) to complete the following exercises: 1. Your company is considering exporting its pharmaceutical products to Japan, but management’s current knowledge of the country’s trade policies and barriers for this sector is limited. Conduct the appropriate level of research in a trade barriers database to identify any information on Japan’s current standards and technical requirements for pharmaceutical products. Prepare an executive summary of your findings. 2. You work for a national chain of clothing stores that is considering importing textiles from India
- 127. into the United States. You want to determine whether the goods are subject to import quotas. Using information provided by the U.S. Customs and Border Protections, prepare a report highlighting the elements that determine whether a shipment is subject to this type of trade restriction. Research Task http://globalEDGE.msu.edu hiL37217_ch06_202-239.indd Page 238 15/07/10 4:02 AM user-f501hiL37217_ch06_202-239.indd Page 238 15/07/10 4:02 AM user-f501 /Users/user-f501/Desktop/Tempwork/July 2010/01:07:10/MHBR169:Slavin:VYN/Users/user- f501/Desktop/Tempwork/July 2010/01:07:10/MHBR169:Slavin:VY Chapter Six The Political Economy of International Trade 239 has driven up demand for grains; it takes eight kilograms of cereals to produce one kilogram of beef, so as demand for meat rises, consumption of grains by cattle surges. Farmers now feed 200 million to 250 million more tons of grain to their animals than they did 20 years ago, driving up grain prices. Then there is the issue of biofuel subsidies. Both the United States and the European Union have adopted policies to increase production of ethanol and biodiesel to slow global warming (both products are argued to produce fewer CO2 emis- sions, although how effective they are at doing this is actively debated). In 2000, about 15 million tons of American corn was turned into ethanol; in 2007 the figure reached 85 million tons. To promote increased production, governments have given subsi- dies to farmers. In the United States, subsidies amount to
- 128. between $0.29 and $0.36 per liter of ethanol. In Europe, the sub- sidies are as high as $1 a liter. Not surprisingly, the subsidies have created an incentive for farmers to plant more crops that can be turned into biofuels (primarily corn and soybeans). This has diverted land away from production of corn and soy for food and reduced the supply of land devoted to growing crops that don’t receive biofuel subsidies, such as wheat. This highly sub- sidized source of demand seems to be having a dramatic effect on demand for corn and soybeans. In 2007, for example, the U.S. increase in demand for corn-based ethanol accounted for more than half of the global increase in demand for corn. Complicating the situation are the high tariffs that shut producers of alternative products that can be turned into bio- fuels, most notably sugar cane, out of the American and EU markets. Brazil, the world’s most efficient producer of sugar cane, confronts import tariffs of at least 25 percent by value in the United States and 50 percent in the EU, raising the price of imported sugar cane and making it uncompetitive with subsidized corn and soybeans. This is unfortunate because sugar cane is widely seen as a more environmentally friendly raw material for biofuels than either corn or soy. Sugar cane uses less fertilizer than corn or soy and produces a higher yield per hectare, in terms of its energy content. Ethanol is also produced from what used to be considered a waste product—the fiber removed from the cane during processing. If policy makers have their way, however, the situation may get even worse. Plans in both the United States and EU call for an increase in the production of biofuels, but neither political entity has agreed to reduce tariff barriers on sugar cane, nor remove the trade-distorting subsidies given to those who produce corn and soy for biofuels. Brazil is not sit- ting on the sidelines; in 2007 it asked the World Trade Organi-
- 129. zation to probe U.S. subsidies to corn farmers for ethanol production. Sources: “Cheap No More: Food Prices,” The Economist, December 8, 2007, p. 84; “Brazil Seeks WTO Probe of U.S. Farm Subsidies,” Journal of Commerce, September 13, 2007, p. 1; M. Wolf, “Biofuels: An Everyday Story of Special Interests and Subsidies,” Financial Times, October 31, 2007, p. 11; and J. Von Braun and R. K. Pachauri, The Promises and Challenges of Biofuels for the Poor in Developing Countries: IFPRI 2005–2006 Annual Report Essay (Washington, DC: International Food Policy Research Institute, 2007). Case Discussion Questions 1. Who benefits from government policies to (a) promote production of ethanol and (b) place tariff barriers on imports of sugar cane? Who suffers from these policies? 2. One estimate suggests that if food prices rise by one- third, they will reduce living standards in rich countries by about 3 percent, but in very poor ones by about 20 percent. According to the International Food Policy Research Institute, unless there is a change in policies, cereal prices will rise by 10 to 20 percent by 2015, and the expansion of biofuel production could reduce calorie intake by 2 to 8 percent by 2020 in many of the world’s poorest nations. Should rich countries do anything about this? If so, what?
- 130. 3. The argument for giving subsidies to ethanol producers rests upon the assumption that ethanol results in lower CO2 emissions than gasoline and therefore benefits the environment. If we accept that global warming is a serious problem, should we not be encouraging governments to increase such subsidies? What are the arguments for and against doing so? On balance, what do you think is the best policy? hiL37217_ch06_202-239.indd Page 239 15/07/10 4:02 AM user-f501hiL37217_ch06_202-239.indd Page 239 15/07/10 4:02 AM user-f501 /Users/user-f501/Desktop/Tempwork/July 2010/01:07:10/MHBR169:Slavin:VYN/Users/user- f501/Desktop/Tempwork/July 2010/01:07:10/MHBR169:Slavin:VY part 3 Cross-Border Trade and Investment L E A R N IN G O B J
- 131. E C T IV E S After you have read this chapter you should be able to: 1 Understand why nations trade with each other. 2 Summarize the different theories explaining trade flows between nations. 3 Recognize why many economists believe that unrestricted free trade between nations will raise the economic welfare of countries that participate in a free trade system. 4 Explain the arguments of those who maintain that government can play a proactive role in promoting national competitive advantage in
- 132. certain industries. 5 Understand the important implications that international trade theory holds for business practice. hiL37217_ch05_160-201.indd Page 160 15/07/10 3:41 AM user-f501hiL37217_ch05_160-201.indd Page 160 15/07/10 3:41 AM user-f501 /Users/user-f501/Desktop/Tempwork/July 2010/01:07:10/MHBR169:Slavin:VYN/Users/user- f501/Desktop/Tempwork/July 2010/01:07:10/MHBR169:Slavin:VY opening case B angladesh, one of the world’s poorest countries, has long depended heavily upon exports of textile products to generate income, employment, and economic growth. Most of these exports are low-cost finished garments sold to Western mass- market retailers, such as Walmart. For decades, Bangladesh was able to take advantage of a quota system for textile exports that gave it, and other poor countries, preferential access to rich markets such as the United States and the European Union. On January 1, 2005, however, that system was scrapped in favor of one that was based on free trade principles. From
- 133. that point on, exporters in Bangladesh would have to compete for business against producers from other nations such as China and Indonesia. Many analysts predicted the quick collapse of Bangladesh’s textile industry. They predicted a sharp jump in unemployment, a decline in the country’s balance of payments accounts, and a negative impact upon economic growth. The collapse didn’t happen. On the contrary, Bangladesh’s exports of textiles continued to grow, even as the rest of the world plunged into an economic crisis in 2008. Bangladesh’s exports of garments rose to $10.7 billion in 2008, up from $9.3 billion in 2007 and $8.9 billion in 2006. Apparently, Bangladesh has a comparative advantage in the production of textiles— it is one of the world’s low-cost producers—and this is allowing the country to grow its share of world markets. Indeed, as a deep economic recession took hold in developed nations during 2008–09, big importers such as Walmart increased their purchases of inexpensive garments from Bangladesh to better serve their customers, who were looking for low prices. Obviously this benefits producers in Bangladesh, but it also benefits consumers in developed nations who can use money saved on garment purchases to buy other goods and services. Bangladesh’s advantage is based on a number of factors. First, labor costs are low, in part due to low hourly wage rates, and in part due to textile manufacturers’ investments in productivity-boosting technology during the
- 134. previous decade. Today, wage rates in Bangladesh’s textile industry are Bangladesh’s Textile Trade International Trade Theory 5 c h a p t e r hiL37217_ch05_160-201.indd Page 161 15/07/10 3:41 AM user-f501hiL37217_ch05_160-201.indd Page 161 15/07/10 3:41 AM user-f501 /Users/user-f501/Desktop/Tempwork/July 2010/01:07:10/MHBR169:Slavin:VYN/Users/user- f501/Desktop/Tempwork/July 2010/01:07:10/MHBR169:Slavin:VY 162 Part Three Cross-Border Trade and Investment about $40 to $50 a month, barely half the minimum wage in China. While this pay rate seems dismally low by Western standards, in a country where the gross national income per capita is only $470 a year, the textile industry provides a living wage and a source of employment for some 2.5 million people, 85 percent of whom are women with few alternative employment opportunities. Another source of advantage for Bangladesh is that it has a vibrant network of supporting industries that supply inputs to its garment manufac- turers. Some three-quarters of all inputs are made locally. This
- 135. saves gar- ment manufacturers transport and storage costs, import duties, and the long lead times that come with the imported woven fabrics used to make shirts and trousers. In other words, the local supporting industries help to boost the productivity of Bangladesh’s garment manufacturers, giving them a cost advantage that goes beyond low wage rates. A third advantage for Bangladesh is that it is not China! Many importers in the West have grown cautious about becoming too dependent upon China for imports of specific goods for fear that a disruption, economic or other, would decimate their supply chains unless they had an alternative source. Thus, Bangladesh has benefitted from the trend by Western importers to diversify their supply sources. • Source: K. Bradsher, “Jobs Vanish as Exports Fall in Asia,” The New York Times, January 22, 2009, p. B1; “Knitting Pretty,” The Economist, July 18, 2008, p. 54; and K. Bradsher, “Competition Means Learning to Offer More Than Just Low Wages,” The New York Times, December 14, 2004, p. C1. Introduction The growth of the garment industry in Bangladesh is a striking example of the bene- fits of free trade and globalization. Low barriers to trade have enabled Bangladesh to exploit its comparative advantage in the production of garments and enabled the country to grow its exports, even during a global economic
- 136. downturn. This benefits Bangladesh, one of the world’s poorest nations, whose strong garment exports help support 2.5 million jobs and may help the country to attain sustainable economic growth. It also benefits consumers in developed nations, who can save on their gar- ment purchases and, as a consequence, have more money available for spending on other goods and services, thereby helping to improve their living standards. The losers in this process are higher-cost garment producers in more developed nations, who have lost business to enterprises from Bangladesh. In the world of international trade, there are always winners and losers, but as economists have long argued, the benefits to the winners outweigh the costs born by the losers, resulting in a net gain to society. Economists argue that in the long-run, free trade stimulates economic growth and raises living standards across the board. The economic arguments surrounding the benefits and costs of free trade in goods and services are not abstract academic ones. International trade theory has shaped the hiL37217_ch05_160-201.indd Page 162 15/07/10 3:41 AM user-f501hiL37217_ch05_160-201.indd Page 162 15/07/10 3:41 AM user-f501 /Users/user-f501/Desktop/Tempwork/July 2010/01:07:10/MHBR169:Slavin:VYN/Users/user- f501/Desktop/Tempwork/July 2010/01:07:10/MHBR169:Slavin:VY
- 137. Chapter Five International Trade Theory 163 economic policy of many nations for the past 50 years. It was the driver behind the formation of the World Trade Organization and regional trade blocs such as the European Union and the North American Free Trade Agreement (NAFTA). The 1990s, in particular, saw a global move toward greater free trade. Therefore, it is crucially important to understand these theories and why they have been so successful in shap- ing the economic policy of so many nations and the competitive environment in which international businesses compete. This chapter has two goals that go to the heart of the debate over the benefits and costs of free trade. The first is to review a number of theories that explain why it is beneficial for a country to engage in international trade. The second goal is to explain the pattern of international trade that we observe in the world economy. With regard to the pattern of trade, we will be primarily concerned with explaining the pattern of exports and imports of goods and services between countries. The pattern of foreign direct investment between countries is discussed in Chapter 7. An Overview of Trade Theory We open this chapter with a discussion of mercantilism. Propagated in the sixteenth and seventeenth centuries, mercantilism advocated that countries should simultaneously encourage exports and discourage imports. Although mercantilism is an old and
- 138. largely discredited doctrine, its echoes remain in modern political debate and in the trade policies of many countries. Next, we will look at Adam Smith’s theory of absolute advantage. Proposed in 1776, Smith’s theory was the first to explain why unrestricted free trade is beneficial to a country. Free trade refers to a situation where a govern- ment does not attempt to influence through quotas or duties what its citizens can buy from another country, or what they can produce and sell to another country. Smith argued that the invisible hand of the market mechanism, rather than government pol- icy, should determine what a country imports and what it exports. His arguments im- ply that such a laissez-faire stance toward trade was in the best interests of a country. Building on Smith’s work are two additional theories that we shall review. One is the theory of comparative advantage, advanced by the nineteenth century English econo- mist David Ricardo. This theory is the intellectual basis of the modern argument for unrestricted free trade. In the twentieth century, Ricardo’s work was refined by two Swedish economists, Eli Heckscher and Bertil Ohlin, whose theory is known as the Heckscher-Ohlin theory. THE BENEFITS OF TRADE The great strength of the theories of Smith, Ricardo, and Heckscher-Ohlin is that they identify with precision the specific bene- fits of international trade. Common sense suggests that some international trade
- 139. is beneficial. For example, nobody would suggest that Iceland should grow its own oranges. Iceland can benefit from trade by exchanging some of the products that it can produce at a low cost (fish) for some products that it cannot produce at all (oranges). Thus, by engaging in international trade, Icelanders are able to add oranges to their diet of fish. The theories of Smith, Ricardo, and Heckscher-Ohlin go beyond this common- sense notion, however, to show why it is beneficial for a country to engage in in- ternational trade even for products it is able to produce for itself. This is a difficult concept for people to grasp. For example, many people in the United States be- lieve that American consumers should buy products made in the United States by American companies whenever possible to help save American jobs from foreign competition. The same kind of nationalistic sentiments can be observed in many other countries. LEARNING OBJECTIVE 1 Understand why nations trade with each other. Free Trade The absence of government barriers to the free flow of goods and services between countries.
- 140. hiL37217_ch05_160-201.indd Page 163 15/07/10 3:41 AM user-f501hiL37217_ch05_160-201.indd Page 163 15/07/10 3:41 AM user-f501 /Users/user-f501/Desktop/Tempwork/July 2010/01:07:10/MHBR169:Slavin:VYN/Users/user- f501/Desktop/Tempwork/July 2010/01:07:10/MHBR169:Slavin:VY 164 Part Three Cross-Border Trade and Investment However, the theories of Smith, Ricardo, and Heckscher-Ohlin tell us that a country’s economy may gain if its citizens buy certain products from other nations that could be produced at home. The gains arise because international trade allows a country to specialize in the manufacture and ex- port of products that can be produced most effi- ciently in that country, while importing products that can be produced more efficiently in other countries. Thus, it may make sense for the United States to specialize in the production and export of commercial jet aircraft, since the efficient pro- duction of commercial jet aircraft requires re- sources that are abundant in the United States, such as a highly skilled labor force and cutting- edge technological know-how. On the other hand, it may make sense for the United States to import textiles from China since the efficient production of textiles requires a relatively cheap labor force—and cheap labor is not abundant in the United States. Of course, this economic argument is often difficult for segments of a country’s
- 141. population to accept. With their future threatened by imports, U.S. textile companies and their employees have tried hard to persuade the government to limit the importa- tion of textiles by demanding quotas and tariffs. Although such import controls may benefit particular groups, such as textile businesses and their employees, the theories of Smith, Ricardo, and Heckscher-Ohlin suggest that the economy as a whole is hurt by such action. Limits on imports are often in the interests of domestic producers, but not domestic consumers. THE PATTERN OF INTERNATIONAL TRADE The theories of Smith, Ricardo, and Heckscher-Ohlin help to explain the pattern of international trade that we observe in the world economy. Some aspects of the pattern are easy to understand. Climate and natural resource endowments explain why Ghana exports cocoa, Brazil exports coffee, Saudi Arabia exports oil, and China exports crawfish. However, much of the observed pattern of international trade is more difficult to explain. For exam- ple, why does Japan export automobiles, consumer electronics, and machine tools? Why does Switzerland export chemicals, pharmaceuticals, watches, and jewelry? Why does Bangladesh export garments? David Ricardo’s theory of comparative advantage offers an explanation in terms of international differences in labor productivity. The more sophisticated Heckscher-Ohlin theory emphasizes the interplay between the
- 142. proportions in which the factors of production (such as land, labor, and capital) are avail- able in different countries and the proportions in which they are needed for produc- ing particular goods. This explanation rests on the assumption that countries have varying endowments of the various factors of production. Tests of this theory, how- ever, suggest that it is a less powerful explanation of real-world trade patterns than once thought. One early response to the failure of the Heckscher-Ohlin theory to explain the observed pattern of international trade was the product life- cycle theory. Proposed by Raymond Vernon, this theory suggests that early in their life cycle, most new products are produced in and exported from the country in which they were developed. As a new product becomes widely accepted internationally, however, production starts in A n o t h e r P e r s p e c t i v e Outsourcing: Putting Jobs into Growing Markets Another way of looking at the hollowing out of the Ameri- can knowledge-based economy through outsourcing is to see the process from the perspective of developing na- tions. To them, outsourcing brings with it the benefits of trade. It is one of the positive outcomes of globalization. Multinational corporations doing some business in their markets can locate their production in the very markets into which they are selling. As India, the Philippines, and China develop a knowledge-based labor supply, compa- nies such as Intel and EMC that are selling into these mar- kets may want to locate some of their research and
- 143. development and other knowledge-based activities in these markets as a commitment to a local presence, as a way to learn more about the customer, and as a way to establish sustained and sustaining relationships. Yes, there are cost savings, especially on labor, but long term, such cost savings may be secondary. hiL37217_ch05_160-201.indd Page 164 15/07/10 3:41 AM user-f501hiL37217_ch05_160-201.indd Page 164 15/07/10 3:41 AM user-f501 /Users/user-f501/Desktop/Tempwork/July 2010/01:07:10/MHBR169:Slavin:VYN/Users/user- f501/Desktop/Tempwork/July 2010/01:07:10/MHBR169:Slavin:VY Chapter Five International Trade Theory 165 other countries. As a result, the theory suggests, the product may ultimately be exported back to the country of its original innovation. In a similar vein, during the 1980s economists such as Nobel Prize winner Paul Krugman developed what has come to be known as the new trade theory . New trade theory (for which Krugman won the Nobel Prize in 2008) stresses that in some cases countries specialize in the production and export of particular products not because of underlying differences in factor endowments, but because in certain industries the world market can support only a limited number of firms. (This is argued to be the case for the commercial aircraft industry.) In such industries, firms that enter the market first are able to build a competitive advantage that is
- 144. subsequently difficult to challenge. Thus, the observed pattern of trade between nations may be due in part to the ability of firms within a given nation to capture first-mover advantages. The United States is a major exporter of commercial jet aircraft because American firms such as Boeing were first movers in the world market. Boeing built a competitive advantage that has subsequently been difficult for firms from countries with equally favorable factor endowments to challenge (although Europe’s Airbus Industries has succeeded in doing that). In a work related to the new trade theory, Michael Porter developed a theory, referred to as the theory of national competitive advantage. This attempts to explain why particular nations achieve international success in particular industries. In addition to factor endowments, Porter points out the importance of country factors such as domestic demand and domestic rivalry in explaining a nation’s dominance in the production and export of particular products. TRADE THEORY AND GOVERNMENT POLICY Although all these the- ories agree that international trade is beneficial to a country, they lack agreement in their recommendations for government policy. Mercantilism makes a crude case for government involvement in promoting exports and limiting imports. The theories of Smith, Ricardo, and Heckscher-Ohlin form part of the case for unrestricted free trade. The argument for unrestricted free trade is that both import
- 145. controls and export in- centives (such as subsidies) are self-defeating and result in wasted resources. Both the new trade theory and Porter’s theory of national competitive advantage can be inter- preted as justifying some limited government intervention to support the develop- ment of certain export-oriented industries. We will discuss the pros and cons of this argument, known as strategic trade policy, as well as the pros and cons of the argument for unrestricted free trade, in Chapter 6. Mercantilism The first theory of international trade, mercantilism, emerged in England in the mid- sixteenth century. The principle assertion of mercantilism was that gold and silver were the mainstays of national wealth and essential to vigorous commerce. At that time, gold and silver were the currency of trade between countries; a country could earn gold and silver by exporting goods. Conversely, importing goods from other countries would result in an outflow of gold and silver to those countries. The main tenet of mercantilism was that it was in a country’s best interests to maintain a trade surplus, to export more than it imported. By doing so, a country would accumulate gold and silver and, consequently, increase its national wealth, prestige, and power. As the English mercantilist writer Thomas Mun put it in 1630: The ordinary means therefore to increase our wealth and treasure is by foreign
- 146. trade, wherein we must ever observe this rule: to sell more to strangers yearly than we consume of theirs in value. 1 New Trade Theory Theory that sometimes countries specialize in the production and export of particular products not because of underlying differences in factor endowments, but because in certain industries the world market can support only a limited number of firms. Mercantilism An economic philosophy advocating that countries should simultaneously encourage exports and discourage imports. LEARNING OBJECTIVE 2 Summarize the different theories explaining trade flows between nations. hiL37217_ch05_160-201.indd Page 165 15/07/10 3:41 AM user-f501hiL37217_ch05_160-201.indd Page 165 15/07/10 3:41 AM user-f501 /Users/user-f501/Desktop/Tempwork/July 2010/01:07:10/MHBR169:Slavin:VYN/Users/user- f501/Desktop/Tempwork/July 2010/01:07:10/MHBR169:Slavin:VY
- 147. 166 Part Three Cross-Border Trade and Investment Consistent with this belief, the mercantilist doctrine advocated government interven- tion to achieve a surplus in the balance of trade. The mercantilists saw no virtue in a large volume of trade. Rather, they recommended policies to maximize exports and minimize imports. To achieve this, imports were limited by tariffs and quotas, while exports were subsidized. The classical economist David Hume pointed out an inherent inconsistency in the mercantilist doctrine in 1752. According to Hume, if England had a balance-of-trade surplus with France (it exported more than it imported) the resulting inflow of gold and silver would swell the domestic money supply and generate inflation in England. In France, however, the outflow of gold and silver would have the opposite effect. France’s money supply would contract, and its prices would fall. This change in rela- tive prices between France and England would encourage the French to buy fewer English goods (because they were becoming more expensive) and the English to buy more French goods (because they were becoming cheaper). The result would be a deterioration in the English balance of trade and an improvement in France’s trade balance, until the English surplus was eliminated. Hence, according to Hume, in the
- 148. Is China a Neo-mercantilist Nation? China’s rapid rise in economic power has been built on export-led growth. The country, using its cheap labor, has converted raw material imports into products that it sells to developed nations. For years, the country’s exports have been growing faster than its imports, leading some critics to claim that China is pursuing a neo-mercantilist policy, trying to amass record trade surpluses and foreign currency that will give it economic power over developed nations. This rhetoric reached new heights in 2008 when China’s trade surplus hit a record $280 billion and its foreign exchange reserves exceeded $1.95 trillion, some 70 per- cent of which are held in U.S. dollars. Observers worry that if China ever decides to sell its holdings of U.S. cur- rency, this could depress the value of the dollar against other currencies and increase the price of imports into America. Throughout 2005–2008, China’s exports grew much faster than its imports, leading some to argue that China was limiting imports by pursuing an import substitution policy, encouraging domestic investment in the produc- tion of products such as steel, aluminum, and paper, which it had historically imported from other nations. The trade deficit with the United States has been a particular cause for concern. In 2008, this reached $260 billion, the largest deficit ever recorded with a single country. At the same time, China has long resisted attempts to let its currency float freely against the U.S. dollar. Many claim that China’s currency is too cheap, and that this keeps the prices of China’s goods artificially low, which fuels the country’s exports. So is China a neo-mercantilist nation that is deliberately discouraging imports and encouraging exports in order to
- 149. grow its trade surplus and accumulate foreign exchange reserves, which might give it economic power? The jury is out on this issue. Skeptics suggest that the slowdown in imports to China is temporary and that the country will have no choice but to increase imports of commodities that it lacks, such as oil. They also note that China did start allowing the value of the renminbi (China’s currency) to appreciate against the dollar in July 2005, and between then and January 2010 it appreciated 17 percent in value. More- over, although China’s overall trade surplus was up sharply in 2008, import growth exceeded export growth for 2008, and exports slowed sharply toward the end of the year as the global economic crisis took hold. In 2009, China’s trade surplus contracted somewhat, and its deficit with America appears to have shrunk by some $100 billion, as the global economic crisis of 2008–2009 hit Chinese exporters hard. While this suggests that China’s trade surplus may have peaked for now, it is still significant. Source: A. Browne, “China’s Wild Swings Can Roil the Global Economy,” The Wall Street Journal , October 24, 2005, p. A2; S. H. Hanke, “Stop the Mercantilists,” Forbes , June 20, 2005, p. 164; G. Dyer and A. Balls, “Dollar Threat as China Signals Shift,” Financial Times , January 6, 2006, p. 1; Tim Annett, “Righting the Balance,” The Wall Street Journal , January 10, 2007, p. 15; “China’s Trade Surplus Peaks,” Financial Times , January 12, 2008, p. 1; and W. Chong, “China’s Trade Surplus to U.S. to Narrow,” China Daily , December 7, 2009. 3 C o u n t r y F O C U S
- 150. hiL37217_ch05_160-201.indd Page 166 15/07/10 3:41 AM user-f501hiL37217_ch05_160-201.indd Page 166 15/07/10 3:41 AM user-f501 /Users/user-f501/Desktop/Tempwork/July 2010/01:07:10/MHBR169:Slavin:VYN/Users/user- f501/Desktop/Tempwork/July 2010/01:07:10/MHBR169:Slavin:VY Chapter Five International Trade Theory 167 long run no country could sustain a surplus on the balance of trade and so accumulate gold and silver as the mercantilists had envisaged. The flaw with mercantilism was that it viewed trade as a zero-sum game. (A zero- sum game is one in which a gain by one country results in a loss by another.) It was left to Adam Smith and David Ricardo to show the shortsightedness of this approach and to demonstrate that trade is a positive-sum game, or a situation in which all coun- tries can benefit. Unfortunately, the mercantilist doctrine is by no means dead. Neo- mercantilists equate political power with economic power and economic power with a balance-of-trade surplus. Critics argue that many nations have adopted a neo-mercantilist strategy that is designed to simultaneously boost exports and limit imports. 2 For exam- ple, critics charge that China is pursuing a neo-mercantilist policy, deliberately keeping its currency value low against the U.S. dollar in order to sell more goods to the United States, and thus amass a trade surplus and foreign exchange
- 151. reserves (see the accompa- nying Country Focus). Absolute Advantage In his 1776 landmark book The Wealth of Nations, Adam Smith attacked the mercan- tilist assumption that trade is a zero-sum game. Smith argued that countries differ in their ability to produce goods efficiently. In his time, the English, by virtue of their superior manufacturing processes, were the world’s most efficient textile man- ufacturers. Due to the combination of favorable climate, good soils, and accumu- lated expertise, the French had the world’s most efficient wine industry. The English had an absolute advantage in the production of textiles, while the French had an absolute advantage in the production of wine. Thus, a country has an absolute advantage in the production of a product when it is more efficient than any other country in producing it. According to Smith, countries should specialize in the production of goods for which they have an absolute advantage and then trade these for goods produced by other countries. In Smith’s time, this suggested that the English should specialize in the production of textiles while the French should specialize in the production of wine. England could get all the wine it needed by selling its textiles to France and buying wine in exchange. Similarly, France could get all the textiles it needed by selling wine to England and buying textiles in exchange.
- 152. Smith’s basic argument, therefore, is that a country should never produce goods at home that it can buy at a lower cost from other countries. Smith demonstrates that, by specializing in the production of goods in which each has an absolute advantage, both countries benefit by engaging in trade. Consider the effects of trade between two countries, Ghana and South Korea. The production of any good (output) requires resources (inputs) such as land, labor, and capital. Assume that Ghana and South Korea both have the same amount of resources and that these resources can be used to produce either rice or cocoa. As- sume further that 200 units of resources are available in each country. Imagine that in Ghana it takes 10 resources to produce one ton of cocoa and 20 resources to produce one ton of rice. Thus, Ghana could produce 20 tons of cocoa and no rice, 10 tons of rice and no cocoa, or some combination of rice and cocoa between these two extremes. The different combinations that Ghana could produce are repre- sented by the line GG’ in Figure 5.1. This is referred to as Ghana’s production pos- sibility frontier (PPF). Similarly, imagine that in South Korea it takes 40 resources to produce one ton of cocoa and 10 resources to produce one ton of rice. Thus, South Korea could produce 5 tons of cocoa and no rice, 20 tons of rice and no cocoa, or Zero-Sum Game
- 153. A situation in which an economic gain by one country results in an economic loss by another. Absolute Advantage A country has an absolute advantage in the production of a product when it is more efficient than any other country in producing it. LEARNING OBJECTIVE 2 Summarize the different theories explaining trade flows between nations. hiL37217_ch05_160-201.indd Page 167 15/07/10 3:41 AM user-f501hiL37217_ch05_160-201.indd Page 167 15/07/10 3:41 AM user-f501 /Users/user-f501/Desktop/Tempwork/July 2010/01:07:10/MHBR169:Slavin:VYN/Users/user- f501/Desktop/Tempwork/July 2010/01:07:10/MHBR169:Slavin:VY 168 Part Three Cross-Border Trade and Investment some combination between these two extremes. The different combinations avail- able to South Korea are represented by the line KK’ in Figure 5.1, which is South Korea’s PPF. Clearly, Ghana has an absolute advantage in the
- 154. production of cocoa. (More resources are needed to produce a ton of cocoa in South Korea than in Ghana.) By the same token, South Korea has an absolute advantage in the produc- tion of rice. Now consider a situation in which neither country trades with any other. Each coun- try devotes half of its resources to the production of rice and half to the production of cocoa. Each country must also consume what it produces. Ghana would be able to produce 10 tons of cocoa and 5 tons of rice (point A in Figure 5.1), while South Korea would be able to produce 10 tons of rice and 2.5 tons of cocoa (point B in Figure 5.1). Without trade, the combined production of both countries would be 12.5 tons of cocoa (10 tons in Ghana plus 2.5 tons in South Korea) and 15 tons of rice (5 tons in Ghana and 10 tons in South Korea). If each country were to specialize in producing the good for which it had an absolute advantage and then trade with the other for the good it lacks, Ghana could produce 20 tons of cocoa, and South Korea could produce 20 tons of rice. Thus, by specializing, the production of both goods could be increased. Production of cocoa would increase from 12.5 tons to 20 tons, while production of rice would increase from 15 tons to 20 tons. The increase in production that would result from specialization is therefore 7.5 tons of cocoa and 5 tons of rice. Table 5.1 summarizes these figures. By engaging in trade and swapping one ton of cocoa for one
- 155. ton of rice, producers in both countries could consume more of both cocoa and rice. Imagine that Ghana and South Korea swap cocoa and rice on a one-to-one basis; that is, the price of one ton of cocoa is equal to the price of one ton of rice. If Ghana decided to export 6 tons of cocoa to South Korea and import 6 tons of rice in return, its final consumption after trade would be 14 tons of cocoa and 6 tons of rice. This is 4 tons more cocoa than it could have consumed before specialization and trade and 1 ton more rice. Similarly, South Korea’s final consumption after trade would be 6 tons of cocoa and 14 tons of rice. This is 3.5 tons more cocoa than it could have consumed before specialization and trade and 4 tons more rice. Thus, as a result of specialization and trade, output of both cocoa and rice would be increased, and consumers in both nations would be able to consume more. Thus, we can see that trade is a positive-sum game; it produces net gains for all involved. figure 5.1 The Theory of Absolute Advantage 5 10 15 200 Rice K
- 156. G20 15 10 A G' B K' Co co a 5 2.5 hiL37217_ch05_160-201.indd Page 168 15/07/10 3:41 AM user-f501hiL37217_ch05_160-201.indd Page 168 15/07/10 3:41 AM user-f501 /Users/user-f501/Desktop/Tempwork/July 2010/01:07:10/MHBR169:Slavin:VYN/Users/user- f501/Desktop/Tempwork/July 2010/01:07:10/MHBR169:Slavin:VY Chapter Five International Trade Theory 169 Resources Required to Produce 1 Ton of Cocoa and Rice Cocoa Rice
- 157. Ghana 10 20 South Korea 40 10 Production and Consumption without Trade Cocoa Rice Ghana 10.0 5.0 South Korea 2.5 10.0 Total production 12.5 15.0 Production with Specialization Cocoa Rice Ghana 20.0 0.0 South Korea 0.0 20.0 Total production 20.0 20.0 Consumption after Ghana Trades 6 Tons of Cocoa for 6 Tons of South Korean Rice Cocoa Rice Ghana 14.0 6.0 South Korea 6.0 14.0 Increase in Consumption as a Result of Specialization and Trade
- 158. Cocoa Rice Ghana 4.0 1.0 South Korea 3.5 4.0 Comparative Advantage David Ricardo took Adam Smith’s theory one step further by exploring what might happen when one country has an absolute advantage in the production of all goods. 3 Smith’s theory of absolute advantage suggests that such a country might derive no benefits from international trade. In his 1817 book Principles of Political Economy, Ricardo showed that this was not the case. According to Ricardo’s theory of comparative advantage, it makes sense for a country to specialize in the production of those goods that it produces most efficiently and to buy the goods that it produces less efficiently from other countries, even if this means buying goods from other countries that it could produce more efficiently itself. 4 While this may seem counterintuitive, the logic can be explained with a simple example. LEARNING OBJECTIVE 2 Summarize the different theories explaining trade flows between nations. 5.1 table Absolute Advantage
- 159. and the Gains from Trade hiL37217_ch05_160-201.indd Page 169 15/07/10 3:41 AM user-f501hiL37217_ch05_160-201.indd Page 169 15/07/10 3:41 AM user-f501 /Users/user-f501/Desktop/Tempwork/July 2010/01:07:10/MHBR169:Slavin:VYN/Users/user- f501/Desktop/Tempwork/July 2010/01:07:10/MHBR169:Slavin:VY 170 Part Three Cross-Border Trade and Investment Assume that Ghana is more efficient in the production of both cocoa and rice; that is, Ghana has an absolute advantage in the production of both products. In Ghana it takes 10 resources to produce one ton of cocoa and 131/3 resources to produce one ton of rice. Thus, given its 200 units of resources, Ghana can produce 20 tons of cocoa and no rice, 15 tons of rice and no cocoa, or any combination in between on its PPF (the line GG’ in Figure 5.2). In South Korea it takes 40 re- sources to produce one ton of cocoa and 20 resources to produce one ton of rice. Thus, South Korea can produce 5 tons of cocoa and no rice, 10 tons of rice and no cocoa, or any combination on its PPF (the line KK’ in Figure 5.2). Again assume that without trade, each country uses half of its resources to produce rice and half to pro- duce cocoa. Thus, without trade, Ghana will produce 10 tons of cocoa and 7.5 tons
- 160. of rice (point A in Figure 5.2), while South Korea will produce 2.5 tons of cocoa and 5 tons of rice (point B in Figure 5.2). In light of Ghana’s absolute advantage in the production of both goods, why should it trade with South Korea? Although Ghana has an absolute advantage in the production of both cocoa and rice, it has a comparative advantage only in the production of cocoa: Ghana can produce 4 times as much cocoa as South Korea, but only 1.5 times as much rice. Ghana is comparatively more efficient at producing cocoa than it is at producing rice. Without trade the combined production of cocoa will be 12.5 tons (10 tons in Ghana and 2.5 in South Korea), and the combined production of rice will also be 12.5 tons (7.5 tons in Ghana and 5 tons in South Korea). Without trade each country must consume what it produces. By engaging in trade, the two countries can increase their combined production of rice and cocoa, and consumers in both nations can con- sume more of both goods. THE GAINS FROM TRADE Imagine that Ghana exploits its comparative advantage in the production of cocoa to increase its output from 10 tons to 15 tons. This uses 150 units of resources, leaving the remaining 50 units of resources to use in pro- ducing 3.75 tons of rice (point C in Figure 5.2). Meanwhile, South Korea specializes in the production of rice, producing 10 tons. The combined output of both cocoa and rice has now increased. Before specialization, the combined
- 161. output was 12.5 tons of cocoa and 12.5 tons of rice. Now it is 15 tons of cocoa and 13.75 tons of rice (3.75 tons in Ghana and 10 tons in South Korea). The source of the increase in production is summarized in Table 5.2. figure 5.2 The Theory of Comparative Advantage K G A G' B K' C 5 7.53.75 10 15 200 Rice 20 15 10Co co
- 162. a 5 2.5 hiL37217_ch05_160-201.indd Page 170 15/07/10 3:41 AM user-f501hiL37217_ch05_160-201.indd Page 170 15/07/10 3:41 AM user-f501 /Users/user-f501/Desktop/Tempwork/July 2010/01:07:10/MHBR169:Slavin:VYN/Users/user- f501/Desktop/Tempwork/July 2010/01:07:10/MHBR169:Slavin:VY Chapter Five International Trade Theory 171 Not only is output higher, but both countries also can now benefit from trade. If Ghana and South Korea swap cocoa and rice on a one-to-one basis, with both countries choosing to exchange 4 tons of their export for 4 tons of the import, both countries are able to consume more cocoa and rice than they could before specialization and trade (see Table 5.2). Thus, if Ghana exchanges 4 tons of cocoa with South Korea for 4 tons of rice, it is still left with 11 tons of cocoa, which is 1 ton more than it had before trade. The 4 tons of rice it gets from South Korea in exchange for its 4 tons of cocoa, when added to the 3.75 tons it now produces domestically, leaves it with a total of 7.75 tons of rice, which is .25 of a ton more than it had before specialization. Similarly, after
- 163. swapping 4 tons of rice with Ghana, South Korea still ends up with 6 tons of rice, which is more than it had before specialization. In addition, the 4 tons of cocoa it receives in exchange is 1.5 tons more than it produced before trade. Thus, consumption of cocoa and rice can increase in both countries as a result of specialization and trade. Resources Required to Produce 1 Ton of Cocoa and Rice Cocoa Rice Ghana 10 13.33 South Korea 40 20 Production and Consumption without Trade Cocoa Rice Ghana 10.0 7.5 South Korea 2.5 5.0 Total production 12.5 12.5 Production with Specialization Cocoa Rice Ghana 15.0 3.75 South Korea 0.0 10.0 Total production 15.0 13.75
- 164. Consumption after Ghana Trades 4 Tons of Cocoa for 4 Tons of South Korean Rice Cocoa Rice Ghana 11.0 7.75 South Korea 4.0 6.0 Increase in Consumption as a Result of Specialization and Trade Cocoa Rice Ghana 1.0 0.25 South Korea 1.5 1.0 5.2 table Comparative Advantage and the Gains from Trade hiL37217_ch05_160-201.indd Page 171 15/07/10 3:41 AM user-f501hiL37217_ch05_160-201.indd Page 171 15/07/10 3:41 AM user-f501 /Users/user-f501/Desktop/Tempwork/July 2010/01:07:10/MHBR169:Slavin:VYN/Users/user- f501/Desktop/Tempwork/July 2010/01:07:10/MHBR169:Slavin:VY 172 Part Three Cross-Border Trade and Investment The basic message of the theory of comparative advantage is
- 165. that potential world production is greater with unrestricted free trade than it is with restricted trade. Ricardo’s theory suggests that consumers in all nations can consume more if there are no re- strictions on trade. This occurs even in countries that lack an absolute advantage in the production of any good. In other words, to an even greater degree than the theory of absolute advantage, the theory of comparative advantage suggests that trade is a positive-sum game in which all countries that participate realize economic gains. As such, this theory pro- vides a strong rationale for encouraging free trade. So powerful is Ricardo’s theory that it remains a major intellectual weapon for those who argue for free trade. QUALIFICATIONS AND ASSUMPTIONS The conclusion that free trade is universally beneficial is a rather bold one to draw from such a simple model. Our simple model includes many unrealistic assumptions: 1. We have assumed a simple world in which there are only two countries and two goods. In the real world, there are many countries and many goods. 2. We have assumed away transportation costs between countries. 3. We have assumed away differences in the prices of resources in different countries. We have said nothing about exchange rates, simply assuming that cocoa and rice
- 166. could be swapped on a one-to-one basis. 4. We have assumed that resources can move freely from the production of one good to another within a country. In reality, this is not always the case. 5. We have assumed constant returns to scale; that is, that specialization by Ghana or South Korea has no effect on the amount of resources required to produce one ton of cocoa or rice. In reality, both diminishing and increasing returns to specialization exist. The amount of resources required to produce a good might decrease or increase as a nation specializes in production of that good. 6. We have assumed that each country has a fixed stock of resources and that free trade does not change the efficiency with which a country uses its resources. This static assumption makes no allowances for the dynamic changes in a country’s stock of resources and in the efficiency with which the country uses its resources that might result from free trade. 7. We have assumed away the effects of trade on income distribution within a country. Given these assumptions, can the conclusion that free trade is mutually beneficial be extended to the real world of many countries, many goods, positive transportation
- 167. costs, volatile exchange rates, immobile domestic resources, non-constant returns to specialization, and dynamic changes? Although a detailed extension of the theory of comparative advantage is beyond the scope of this book, economists have shown that the basic result derived from our simple model can be generalized to a world com- posed of many countries producing many different goods. 5 Despite the shortcomings of the Ricardian model, research suggests that the basic proposition that countries will export the goods that they are most efficient at producing is borne out by the data. 6 However, once all the assumptions are dropped, the case for unrestricted free trade, while still positive, has been argued by some economists associated with the “new trade theory” to lose some of its strength. 7 We return to this issue later in this chapter and in the next when we discuss the new trade theory. Moreover, in a recent and widely discussed analysis, the Nobel Prize winning economist Paul Samuelson argued that contrary to the standard interpretation, in certain circumstances the theory of comparative advantage predicts that a rich country might actually be worse off by switching to a free trade regime with a poor nation. 8 We will consider Samuelson’s critique in the next section. LEARNING OBJECTIVE 3 Recognize why many economists believe that unrestricted free trade
- 168. between nations will raise the economic welfare of countries that participate in a free trade system. hiL37217_ch05_160-201.indd Page 172 15/07/10 3:41 AM user-f501hiL37217_ch05_160-201.indd Page 172 15/07/10 3:41 AM user-f501 /Users/user-f501/Desktop/Tempwork/July 2010/01:07:10/MHBR169:Slavin:VYN/Users/user- f501/Desktop/Tempwork/July 2010/01:07:10/MHBR169:Slavin:VY Chapter Five International Trade Theory 173 EXTENSIONS OF THE RICARDIAN MODEL Let us explore the effect of relaxing three of the assumptions identified above in the simple comparative advan- tage model. Below we relax the assumptions that resources move freely from the pro- duction of one good to another within a country, that there are constant returns to scale, and that trade does not change a country’s stock of resources or the efficiency with which those resources are utilized. Immobile Resources In our simple comparative model of Ghana and South Korea, we assumed that producers (farmers) could easily convert land from the pro- duction of cocoa to rice, and vice versa. While this assumption may hold for some agricultural products, resources do not always shift quite so easily from producing
- 169. one good to another. A certain amount of friction is involved. For example, embrac- ing a free trade regime for an advanced economy such as the United States often implies that the country will produce less of some labor- intensive goods, such as tex- tiles, and more of some knowledge-intensive goods, such as computer software or biotechnology products. Although the country as a whole will gain from such a shift, textile producers will lose. A textile worker in South Carolina is probably not quali- fied to write software for Microsoft. Thus, the shift to free trade may mean that she becomes unemployed or has to accept another less attractive job, such as working at a fast-food restaurant. Resources do not always move easily from one economic activity to another. The process creates friction and human suffering too. While the theory predicts that the benefits of free trade outweigh the costs by a significant margin, this is of cold comfort to those who bear the costs. Accordingly, political opposition to the adoption of a free trade regime typically comes from those whose jobs are most at risk. In the United States, for example, textile workers and their unions have long opposed the move toward free trade precisely because this group has much to lose from free trade. Govern- ments often ease the transition toward free trade by helping to retrain those who lose their jobs as a result. The pain caused by the movement toward a free trade regime is a short-term phenomenon, while the gains from trade once the
- 170. transition has been made are both significant and enduring. Diminishing Returns The simple comparative advantage model developed above assumes constant returns to specialization. By constant returns to specialization we mean the units of resources required to produce a good (cocoa or rice) are assumed to remain constant no matter where one is on a country’s production possibility frontier (PPF). Thus, we assumed that it always took Ghana 10 units of resources to produce one ton of cocoa. However, it is more realistic to assume diminishing returns to special- ization. Diminishing returns to specialization occurs when more units of resources are required to produce each additional unit. While 10 units of resources may be sufficient to increase Ghana’s output of cocoa from 12 tons to 13 tons, 11 units of resources may be needed to increase output from 13 to 14 tons, 12 units of resources to increase out- put from 14 tons to 15 tons, and so on. Diminishing returns implies a convex PPF for Ghana (see Figure 5.3), rather than the straight line depicted in Figure 5.2. It is more realistic to assume diminishing returns for two reasons. First, not all resources are of the same quality. As a country tries to increase its output of a certain good, it is increasingly likely to draw on more marginal resources whose productivity is not as great as those initially employed. The result is that it requires ever more resources to produce an equal increase in output. For example,
- 171. some land is more pro- ductive than other land. As Ghana tries to expand its output of cocoa, it might have to utilize increasingly marginal land that is less fertile than the land it originally used. As yields per acre decline, Ghana must use more land to produce one ton of cocoa. Constant Returns to Specialization The units of resources required to produce a good are assumed to remain constant no matter where one is on a country’s production possibility frontier. hiL37217_ch05_160-201.indd Page 173 15/07/10 3:41 AM user-f501hiL37217_ch05_160-201.indd Page 173 15/07/10 3:41 AM user-f501 /Users/user-f501/Desktop/Tempwork/July 2010/01:07:10/MHBR169:Slavin:VYN/Users/user- f501/Desktop/Tempwork/July 2010/01:07:10/MHBR169:Slavin:VY 174 Part Three Cross-Border Trade and Investment A second reason for diminishing returns is that different goods use resources in dif- ferent proportions. For example, imagine that growing cocoa uses more land and less labor than growing rice, and that Ghana tries to transfer resources from rice produc- tion to cocoa production. The rice industry will release
- 172. proportionately too much labor and too little land for efficient cocoa production. To absorb the additional resources of labor and land, the cocoa industry will have to shift toward more labor- intensive methods of production. The effect is that the efficiency with which the cocoa industry uses labor will decline, and returns will diminish. Diminishing returns show that it is not feasible for a country to specialize to the degree suggested by the simple Ricardian model outlined earlier. Diminishing returns to specialization suggest that the gains from specialization are likely to be exhausted before specialization is complete. In reality, most countries do not specialize, but in- stead, produce a range of goods. However, the theory predicts that it is worthwhile to specialize until that point where the resulting gains from trade are outweighed by di- minishing returns. Thus, the basic conclusion that unrestricted free trade is beneficial still holds, although because of diminishing returns, the gains may not be as great as suggested in the constant returns case. Dynamic Effects and Economic Growth The simple comparative advantage model assumed that trade does not change a country’s stock of resources or the effi- ciency with which it utilizes those resources. This static assumption makes no allow- ances for the dynamic changes that might result from trade. If we relax this assumption, it becomes apparent that opening an economy to trade is likely to gener-
- 173. ate dynamic gains of two sorts. 9 First, free trade might increase a country’s stock of resources as increased supplies of labor and capital from abroad become available for use within the country. For example, this has been occurring in Eastern Europe since the early 1990s, with many Western businesses investing significant capital in the former Communist countries. Second, free trade might also increase the efficiency with which a country uses its resources. Gains in the efficiency of resource utilization could arise from a number of fac- tors. For example, economies of large-scale production might become available as trade expands the size of the total market available to domestic firms. Trade might make better technology from abroad available to domestic firms; better technology can increase labor G G' Co co a Rice0 figure 5.3 Ghana’s PPF under Diminishing Returns LEARNING OBJECTIVE 3
- 174. Recognize why many economists believe that unrestricted free trade between nations will raise the economic welfare of countries that participate in a free trade system. hiL37217_ch05_160-201.indd Page 174 15/07/10 3:41 AM user-f501hiL37217_ch05_160-201.indd Page 174 15/07/10 3:41 AM user-f501 /Users/user-f501/Desktop/Tempwork/July 2010/01:07:10/MHBR169:Slavin:VYN/Users/user- f501/Desktop/Tempwork/July 2010/01:07:10/MHBR169:Slavin:VY Chapter Five International Trade Theory 175 productivity or the productivity of land. (The so-called green revolution had this effect on agricultural outputs in developing countries.) Also, opening an economy to foreign competition might stimulate domestic producers to look for ways to increase their effi- ciency. Again, this phenomenon has arguably been occurring in the once-protected mar- kets of Eastern Europe, where many former state monopolies have had to increase the efficiency of their operations to survive in the competitive world market. Dynamic gains in both the stock of a country’s resources and the efficiency with which resources are utilized will cause a country’s PPF to shift outward. This is illustrated in Figure 5.4, where the shift from PPF 1 to PPF 2 results from
- 175. the dynamic gains that arise from free trade. As a consequence of this outward shift, the country in Figure 5.4 can produce more of both goods than it did before introduction of free trade. The theory suggests that opening an economy to free trade not only results in static gains of the type discussed earlier, but also results in dynamic gains that stimulate economic growth. If this is so, then one might think that the case for free trade becomes stronger still, and in gen- eral it does. However, as noted above, in a recent article one of the leading economic theorists of the twentieth century, Paul Samuelson, argued that in some circumstances, dynamic gains can lead to an outcome that is not so beneficial. The Samuelson Critique Paul Samuelson’s critique looks at what happens when a rich country—the United States—enters into a free trade agreement with a poor country—China—that rapidly improves its productivity after the introduction of a free trade regime (i.e., there is a dynamic gain in the efficiency with which resources are used in the poor country). Samuelson’s model suggests that in such cases, the lower prices that U.S. consumers pay for goods imported from China following the intro- duction of a free trade regime may not be enough to produce a net gain to for the U.S. economy if the dynamic effect of free trade is to lower real wage rates in the United States. As he stated in a New York Times interview, “Being able to purchase groceries 20 percent cheaper at Walmart (due to international trade) does
- 176. not necessarily make up for the wage losses (in America).” 10 Samuelson goes on to note that he is particularly concerned about the ability to off- shore service jobs that traditionally were not internationally mobile, such as software debugging, call center jobs, accounting jobs, and even medical diagnosis of MRI scans (see the accompanying Country Focus for details). Recent advances in communications Co co a Rice0 PPF2 PPF1 5.4 figure The Influence of Free Trade on the PPF hiL37217_ch05_160-201.indd Page 175 15/07/10 3:41 AM user-f501hiL37217_ch05_160-201.indd Page 175 15/07/10 3:41 AM user-f501 /Users/user-f501/Desktop/Tempwork/July 2010/01:07:10/MHBR169:Slavin:VYN/Users/user- f501/Desktop/Tempwork/July 2010/01:07:10/MHBR169:Slavin:VY
- 177. 176 Part Three Cross-Border Trade and Investment technology have made this possible, effectively expanding the labor market for these jobs to include educated people in places such as India, the Philippines, and China. When coupled with rapid advances in the productivity of foreign labor due to better education, the effect on middle-class wages in the United States, according to Samuelson, may be similar to mass inward migration into the United States—it will lower the market clear- ing wage rate, perhaps by enough to outweigh the positive benefits of international trade. Having said this, it should be noted that Samuelson concedes that free trade has historically benefited rich counties (as data discussed below seem to confirm). More- over, he notes that introducing protectionist measures (e.g., trade barriers) to guard against the theoretical possibility that free trade may harm the United States in the future may produce a situation that is worse than the disease the measures are trying to prevent. To quote Samuelson: “Free trade may turn out pragmatically to be still best Moving U.S. White-Collar Jobs Offshore Economists have long argued that free trade produces gains for all countries that participate in a free trading sys- tem, but as the next wave of globalization sweeps through the U.S. economy, many people are wondering if this is true, particularly those who stand to lose their jobs because of this wave of globalization. In the popular imagination for much of the past quarter century, free trade was associated
- 178. with the movement of low-skill, blue-collar manufacturing jobs out of rich countries such as the United States and to- ward low-wage countries—textiles to Costa Rica, athletic shoes to the Philippines, steel to Brazil, electronic products to Malaysia, and so on. While many observers bemoaned the “hollowing out” of U.S. manufacturing, economists stated that high-skilled and high-wage white-collar jobs associated with the knowledge-based economy would stay in the United States. Computers might be assembled in Malaysia, so the argument went, but they would continue to be designed in Silicon Valley by high-skilled U.S. engineers. Recent developments have some people questioning this assumption. As the global economy slowed after 2000 and corporate profits fell, many American companies responded by moving white-collar “knowledge-based” jobs to developing nations where they could be performed for a fraction of the cost. During the long economic boom of the 1990s, Bank of America had to compete with other organi- zations for the scarce talents of information technology specialists, driving annual salaries to more than $100,000. However, with business under pressure, the bank cut nearly 5,000 jobs from its 25,000-strong U.S.-based IT work- force. Some of these jobs were transferred to India, where work that costs $100 an hour in the United States can be done for $20 an hour. One beneficiary of Bank of America’s downsizing is Infosys Technologies Ltd., a Bangalore, India, information technology firm where 250 engineers now develop IT applications for the bank. Other Infosys employees are busy processing home loan applications for Greenpoint Mortgage of Novato, California. Nearby in the offices of another Indian firm, Wipro Ltd., five radiologists interpret 30 CT scans a day for Massachusetts General Hospital that are sent over the Internet. At yet another Bangalore business, engineers earn $10,000 a year designing leading-
- 179. edge semiconductor chips for Texas Instruments. Nor is India the only beneficiary of these changes. Accenture, a large U.S. management consulting and information tech- nology firm, moved 5,000 jobs in software development and accounting to the Philippines. Also in the Philippines, Procter & Gamble employs 650 professionals who prepare the company’s global tax returns. The work used to be done in the United States, but now it is done in Manila, with just final submission to local tax authorities in the United States and other countries handled locally. Some architectural work also is being outsourced to lower-cost locations. Fluor Corp., a Texas-based construc- tion company, employs some 1,200 engineers and drafts- men in the Philippines, Poland, and India to turn layouts of industrial facilities into detailed specifications. For a Saudi Arabian chemical plant Fluor is designing, 200 young engi- neers based in the Philippines earning less than $3,000 a year collaborate in real time over the Internet with elite U.S. and British engineers who make up to $90,000 a year. Why does Fluor do this? According to the company, the answer is simple. Doing so reduces the prices of a project by 15 percent, giving the company a cost-based competitive advantage in the global market for construction design. Sources: P. Engardio, A. Bernstein, and M. Kripalani, “Is Your Job Next?” BusinessWeek, February 3, 2003, pp. 50–60; “America’s Pain, India’s Gain,” The Economist, January 11, 2003, p. 57; and M. Schroeder and T. Aeppel, “Skilled Workers Mount Opposition to Free Trade, Swaying Politicians,” The Wall Street Journal , October 10, 2003, pp. A1, A11. 3 C o u n t r y F O C U S
- 180. hiL37217_ch05_160-201.indd Page 176 15/07/10 3:42 AM user-f501hiL37217_ch05_160-201.indd Page 176 15/07/10 3:42 AM user-f501 /Users/user-f501/Desktop/Tempwork/July 2010/01:07:10/MHBR169:Slavin:VYN/Users/user- f501/Desktop/Tempwork/July 2010/01:07:10/MHBR169:Slavin:VY Chapter Five International Trade Theory 177 for each region in comparison to lobbyist-induced tariffs and quotas which involve both a perversion of democracy and non-subtle deadweight distortion losses.” 11 Some economists have been quick to dismiss Samuelson’s fears. 12 While not ques- tioning his analysis, they note that developing nations are unlikely to be able to up- grade the skill level of their workforce rapidly enough to give rise to the situation in Samuelson’s model. In other words, the countries will quickly run into diminishing returns. To quote one such rebuttal: “The notion that India and China will quickly educate 300 million of their citizens to acquire sophisticated and complex skills at stake borders on the ludicrous. The educational sectors in these countries face enor- mous difficulties.” 13 Notwithstanding such rebuttals, however, Samuelson’s stature is such that his work will undoubtedly be debated for some time. Evidence for the Link between Trade and Growth Many economic studies have looked at the relationship between trade and economic
- 181. growth. 14 In general, these studies suggest that, as predicted by the standard theory of comparative advan- tage, countries that adopt a more open stance toward international trade enjoy higher growth rates than those that close their economies to trade (the opening case provides evidence of the link between trade and growth). Jeffrey Sachs and Andrew Warner cre- ated a measure of how “open” to international trade an economy was and then looked at the relationship between “openness” and economic growth for a sample of more than 100 countries from 1970 to 1990. 15 Among other findings, they reported: We find a strong association between openness and growth, both within the group of developing and the group of developed countries. Within the group of developing countries, the open economies grew at 4.49 percent per year, and the closed economies grew at 0.69 percent per year. Within the group of developed economies, the open economies grew at 2.29 percent per year, and the closed economies grew at 0.74 percent per year. 16 A study by Wacziarg and Welch updated the Sachs and Warner data through the late 1990s. They found that from 1950 to 1998, countries that liberalized their trade re- gimes experienced, on average, increases in their annual growth rates of 1.5 percent compared to preliberalization times. 17 The message of these studies seems clear: Adopt an open
- 182. economy and embrace free trade, and your nation will be rewarded with higher economic growth rates. Higher growth will raise income levels and living standards. This last point has been confirmed by a study that looked at the relationship between trade and growth in incomes. The study, undertaken by Jeffrey Frankel and David Romer, found that on average, a one percentage point increase in the ratio of a country’s trade to its gross domestic product increases income per person by at least one- half percent. 18 For every 10 percent increase in the importance of international trade in an economy, average income levels will rise by at least 5 percent. Despite the short- term adjustment costs associated with adopting a free trade regime, trade would seem to produce greater economic growth and higher living standards in the long run, just as the theory of Ricardo would lead us to expect. 19 Heckscher-Ohlin Theory Ricardo’s theory stresses that comparative advantage arises from differences in pro- ductivity. Thus, whether Ghana is more efficient than South Korea in the production of cocoa depends on how productively it uses its resources. Ricardo stressed labor productivity and argued that differences in labor productivity between nations under- lie the notion of comparative advantage. Swedish economists Eli Heckscher (in 1919) LEARNING OBJECTIVE 2
- 183. Summarize the different theories explaining trade flows between nations. LEARNING OBJECTIVE 3 Recognize why many economists believe that unrestricted free trade between nations will raise the economic welfare of countries that participate in a free trade system. hiL37217_ch05_160-201.indd Page 177 15/07/10 3:42 AM user-f501hiL37217_ch05_160-201.indd Page 177 15/07/10 3:42 AM user-f501 /Users/user-f501/Desktop/Tempwork/July 2010/01:07:10/MHBR169:Slavin:VYN/Users/user- f501/Desktop/Tempwork/July 2010/01:07:10/MHBR169:Slavin:VY 178 Part Three Cross-Border Trade and Investment and Bertil Ohlin (in 1933) put forward a different explanation of comparative advan- tage. They argued that comparative advantage arises from differences in national fac- tor endowments. 20 By factor endowments they meant the extent to which a country is endowed with such resources as land, labor, and capital. Nations have varying fac-
- 184. tor endowments, and different factor endowments explain differences in factor costs; specifically, the more abundant a factor, the lower its cost. The Heckscher-Ohlin theory predicts that countries will export those goods that make intensive use of factors that are locally abundant, while importing goods that make intensive use of fac- tors that are locally scarce. Thus, the Heckscher-Ohlin theory attempts to explain the pattern of international trade that we observe in the world economy. Like Ricardo’s theory, the Heckscher-Ohlin theory argues that free trade is beneficial. Unlike Ricardo’s theory, however, the Heckscher-Ohlin theory argues that the pattern of international trade is determined by differences in factor endowments, rather than differences in productivity. The Heckscher-Ohlin theory has commonsense appeal. For example, the United States has long been a substantial exporter of agricultural goods, reflecting in part its unusual abundance of arable land. In contrast, China excels in the export of goods produced in labor-intensive manufacturing industries, such as textiles and footwear. This reflects China’s relative abundance of low-cost labor. The United States, which lacks abundant low-cost labor, has been a primary importer of these goods. Note that it is relative, not absolute, endowments that are important; a country may have larger absolute amounts of land and labor than another country, but be relatively abundant in one of them.
- 185. THE LEONTIEF PARADOX The Heckscher-Ohlin theory has been one of the most influential theoretical ideas in international economics. Most economists prefer the Heckscher-Ohlin theory to Ricardo’s theory because it makes fewer simplifying assumptions. Because of its influence, the theory has been subjected to many empirical tests. Beginning with a famous study published in 1953 by Wassily Leontief (winner of the Nobel Prize in economics in 1973), many of these tests have raised questions about the validity of the Heckscher-Ohlin theory. 21 Using the Heckscher-Ohlin theory, Leontief postulated that since the United States was relatively abundant in capital com- pared to other nations, the United States would be an exporter of capital-intensive goods and an importer of labor-intensive goods. To his surprise, however, he found that U.S. exports were less capital intensive than U.S. imports. Since this result was at variance with the predictions of the theory, it has become known as the Leontief paradox. No one is quite sure why we observe the Leontief paradox. One possible explana- tion is that the United States has a special advantage in producing new products or goods made with innovative technologies. Such products may be less capital inten- sive than products whose technology has had time to mature and become suitable for mass production. Thus, the United States may be exporting goods that heavily use skilled labor and innovative entrepreneurship, such as
- 186. computer software, while importing heavy manufacturing products that use large amounts of capital. Some empirical studies tend to confirm this. 22 Still, tests of the Heckscher-Ohlin theory using data for a large number of countries tend to confirm the existence of the Leontief paradox. 23 This leaves economists with a difficult dilemma. They prefer the Heckscher-Ohlin theory on theoretical grounds, but it is a relatively poor predictor of real-world inter- national trade patterns. On the other hand, the theory they regard as being too lim- ited, Ricardo’s theory of comparative advantage, actually predicts trade patterns with greater accuracy. The best solution to this dilemma may be to return to the Ricardian idea that trade patterns are largely driven by international differences in productivity. Factor Endowments The extent to which a country is endowed with such resources as land, labor, and capital. hiL37217_ch05_160-201.indd Page 178 15/07/10 3:42 AM user-f501hiL37217_ch05_160-201.indd Page 178 15/07/10 3:42 AM user-f501 /Users/user-f501/Desktop/Tempwork/July 2010/01:07:10/MHBR169:Slavin:VYN/Users/user- f501/Desktop/Tempwork/July 2010/01:07:10/MHBR169:Slavin:VY
- 187. Chapter Five International Trade Theory 179 Thus, one might argue that the United States exports commercial aircraft and imports textiles not because its factor endowments are especially suited to aircraft manufacture and not suited to textile manufacture, but because the United States is relatively more efficient at producing aircraft than textiles. A key assumption in the Heckscher-Ohlin theory is that technologies are the same across countries. This may not be the case. Differences in technology may lead to differences in productivity, which in turn, drives international trade patterns. 24 Thus, Japan’s success in exporting automobiles since the 1970s has been not just because of the relative abundance of capital, but also because of its development of innovative manufacturing technology that enabled it to achieve higher productivity levels in automobile production than other countries that also had abundant capital. More recent empirical work suggests that this theoretical explana- tion may be correct. 25 The new research shows that once differences in technology across countries are controlled for, countries do indeed export those goods that make intensive use of factors that are locally abundant, while importing goods that make intensive use of factors that are locally scarce. In other words, once the impact of dif- ferences of technology on productivity is controlled for, the
- 188. Heckscher-Ohlin theory seems to gain predictive power. The Product Life-Cycle Theory Raymond Vernon initially proposed the product life-cycle theory in the mid-1960s. 26 Vernon’s theory was based on the observation that for most of the twentieth century a very large proportion of the world’s new products had been developed by U.S. firms and sold first in the U.S. market (e.g., mass-produced automobiles, televisions, instant cameras, photocopiers, personal computers, and semiconductor chips). To explain this, Vernon argued that the wealth and size of the U.S. market gave U.S. firms a strong incentive to develop new consumer products. In addition, the high cost of U.S. labor gave U.S. firms an incentive to develop cost-saving process innovations. Just because a new product is developed by a U.S. firm and first sold in the U.S. market, it does not follow that the product must be produced in the United States. It could be produced abroad at some low-cost location and then exported back into the United States. However, Vernon argued that most new products were initially pro- duced in America. Apparently, the pioneering firms believed it was better to keep pro- duction facilities close to the market and to the firm’s center of decision making, given the uncertainty and risks inherent in introducing new products. Also, the demand for most new products tends to be based on non-price factors. Consequently, firms can
- 189. charge relatively high prices for new products, which obviates the need to look for low-cost production sites in other countries. Vernon went on to argue that early in the life cycle of a typical new product, while demand is starting to grow rapidly in the United States, demand in other advanced countries is limited to high-income groups. The limited initial demand in other advanced countries does not make it worthwhile for firms in those countries to start producing the new product, but it does necessitate some exports from the United States to those countries. Over time, demand for the new product starts to grow in other advanced countries (e.g., Great Britain, France, Germany, and Japan). As it does, it becomes worthwhile for foreign producers to begin producing for their home markets. In addition, U.S. firms might set up production facilities in those advanced countries where demand is growing. Consequently, production within other advanced countries begins to limit the potential for exports from the United States. As the market in the United States and other advanced nations matures, the prod- uct becomes more standardized, and price becomes the main competitive weapon. As LEARNING OBJECTIVE 2 Summarize the different theories explaining trade flows between nations.
- 190. hiL37217_ch05_160-201.indd Page 179 15/07/10 3:42 AM user-f501hiL37217_ch05_160-201.indd Page 179 15/07/10 3:42 AM user-f501 /Users/user-f501/Desktop/Tempwork/July 2010/01:07:10/MHBR169:Slavin:VYN/Users/user- f501/Desktop/Tempwork/July 2010/01:07:10/MHBR169:Slavin:VY 180 Part Three Cross-Border Trade and Investment this occurs, cost considerations start to play a greater role in the competitive process. Producers based in advanced countries where labor costs are lower than in the United States (e.g., Italy, Spain) might now be able to export to the United States. If cost pressures become intense, the process might not stop there. The cycle by which the United States lost its advantage to other advanced countries might be repeated once more, as developing countries (e.g., Thailand) begin to acquire a production advan- tage over advanced countries. Thus, the locus of global production initially switches from the United States to other advanced nations and then from those nations to developing countries. The consequence of these trends for the pattern of world trade is that over time the United States switches from being an exporter of the product to an importer of the product as production becomes concentrated in lower-cost foreign locations. Figure 5.5 shows the growth of production and consumption over time in the United States, other
- 191. advanced countries, and developing countries. EVALUATING THE PRODUCT LIFE-CYCLE THEORY Historically, the product life-cycle theory seems to be an accurate explanation of international trade patterns. Consider photocopiers; the product was first developed in the early 1960s by Xerox in the United States and sold initially to U.S. users. Originally Xerox exported photocopiers from the United States, primarily to Japan and the advanced countries of Western Europe. As demand began to grow in those countries, Xerox entered into joint ventures to set up production in Japan (Fuji- Xerox) and Great Britain (Rank-Xerox). In addition, once Xerox’s patents on the photocopier process expired, other foreign competitors began to enter the market (e.g., Canon in Japan, Olivetti in Italy). As a consequence, exports from the United States declined, and U.S. users began to buy some of their photocopiers from lower-cost foreign sources, par- ticularly Japan. More recently, Japanese companies have found that manufacturing costs are too high in their own country, so they have begun to switch production to developing countries such as Singapore and Thailand. Thus, initially the United States and now other advanced countries (e.g., Japan and Great Britain) have switched from being exporters of photocopiers to importers. This evolution in the pattern of international trade in photocopiers is consistent with the predictions of the product
- 192. life-cycle theory that mature industries tend to go out of the United States and into low-cost assembly locations. However, the product life-cycle theory is not without weaknesses. Viewed from an Asian or European perspective, Vernon’s argument that most new products are developed and introduced in the United States seems ethnocentric and increasingly dated. Although it may be true that during U.S. dominance of the global economy (from 1945 to 1975), most new products were introduced in the United States, there have always been important exceptions. These exceptions appear to have become more common in recent years. Many new products are now first introduced in Japan (e.g., videogame consoles) or Europe (new wireless phones). Moreover, with the in- creased globalization and integration of the world economy discussed in Chapter 1, a growing number of new products (e.g., laptop computers, compact disks, and digi- tal cameras) are now introduced simultaneously in the United States, Japan, and the advanced European nations. This may be accompanied by globally dispersed pro- duction, with particular components of a new product being produced in those loca- tions around the globe where the mix of factor costs and skills is most favorable (as predicted by the theory of comparative advantage). In sum, although Vernon’s the- ory may be useful for explaining the pattern of international trade during the brief period of American global dominance, its relevance in the
- 193. modern world seems more limited. hiL37217_ch05_160-201.indd Page 180 15/07/10 3:42 AM user-f501hiL37217_ch05_160-201.indd Page 180 15/07/10 3:42 AM user-f501 /Users/user-f501/Desktop/Tempwork/July 2010/01:07:10/MHBR169:Slavin:VYN/Users/user- f501/Desktop/Tempwork/July 2010/01:07:10/MHBR169:Slavin:VY Chapter Five International Trade Theory 181 160 140 120 100 80 60 40 20 0 160 140
- 194. 120 100 80 60 40 20 0 160 140 120 100 80 60 40 20 0 A. United States B. Other advanced countries
- 195. C. Developing countries Exports Production Consumption Production Consumption Production Consumption Maturing product New product Standardized product Stages of product development Exports Imports Expo rts Imp orts
- 196. Imp orts 5.5 figure The Product Life Cycle Theory Source: Adapted from R. Vernon and L. T. Wells, The Economic Environment of International Business. 4th ed., © 1986. Reprinted by permission of Pearson Education, Inc. Upper Saddle River, N.J. hiL37217_ch05_160-201.indd Page 181 15/07/10 3:42 AM user-f501hiL37217_ch05_160-201.indd Page 181 15/07/10 3:42 AM user-f501 /Users/user-f501/Desktop/Tempwork/July 2010/01:07:10/MHBR169:Slavin:VYN/Users/user- f501/Desktop/Tempwork/July 2010/01:07:10/MHBR169:Slavin:VY 182 Part Three Cross-Border Trade and Investment New Trade Theory The new trade theory began to emerge in the 1970s when a number of economists
- 197. pointed out that the ability of firms to attain economies of scale might have impor- tant implications for international trade. 27 Economies of scale are unit cost reduc- tions associated with a large scale of output. Economies of scale have a number of sources, including the ability to spread fixed costs over a large volume, and the abil- ity of large-volume producers to utilize specialized employees and equipment that are more productive than less-specialized employees and equipment. Economies of scale are a major source of cost reductions in many industries, from computer soft- ware to automobiles, and from pharmaceuticals to aerospace. For example, Micro- soft realizes economies of scale by spreading the fixed costs of developing new versions of its Windows operating system, which runs to about $5 billion, over the 250 million or so personal computers upon which each new system is ultimately installed. Similarly, automobile companies realize economies of scale by producing a high volume of automobiles from an assembly line where each employee has a specialized task. New trade theory makes two important points: First, through its impact on econo- mies of scale, trade can increase the variety of goods available to consumers and de- crease the average costs of those goods. Second, in those industries where the output required to attain economies of scale represents a significant proportion of total world demand, the global market may be able to support only a small
- 198. number of enterprises. Thus, world trade in certain products may be dominated by countries whose firms were first movers in their production. INCREASING PRODUCT VARIETY AND REDUCING COSTS Imagine first a world without trade. In industries where economies of scale are important, both the variety of goods that a country can produce and the scale of production are limited by the size of the market. If a national market is small, there may not be enough de- mand to enable producers to realize economies of scale for certain products. Accord- ingly, those products may not be produced, thereby limiting the variety of products available to consumers. Alternatively, they may be produced, but at such low volumes that unit costs and prices are considerably higher than they might be if economies of scale could be realized. Now consider what happens when nations trade with each other. Individual na- tional markets are combined into a larger world market. As the size of the market ex- pands due to trade, individual firms may be able to better attain economies of scale. The implication, according to new trade theory, is that each nation may be able to specialize in producing a narrower range of products than it would in the absence of trade, yet by buying goods that it does not make from other countries, each nation can simultaneously increase the variety of goods available to its consumers and lower the
- 199. costs of those goods—thus trade offers an opportunity for mutual gain even when countries do not differ in their resource endowments or technology. Suppose there are two countries, each with an annual market for 1 million auto- mobiles. By trading with each other, these countries can create a combined market for 2 million cars. In this combined market, due to the ability to better realize econo- mies of scale, more varieties (models) of cars can be produced, and cars can be pro- duced at a lower average cost, than in either market alone. For example, demand for a sports car may be limited to 55,000 units in each national market, while a total out- put of at least 100,000 per year may be required to realize significant scale economies. Similarly, demand for a minivan may be 80,000 units in each national market, and again a total output of at least 100,000 per year may be required to realize significant LEARNING OBJECTIVE 2 Summarize the different theories explaining trade flows between nations. LEARNING OBJECTIVE 3 Recognize why many economists believe that unrestricted free trade between nations will raise the economic welfare of countries that participate in a free trade system.
- 200. Economies of Scale Cost advantages associated with large- scale production. hiL37217_ch05_160-201.indd Page 182 15/07/10 3:42 AM user-f501hiL37217_ch05_160-201.indd Page 182 15/07/10 3:42 AM user-f501 /Users/user-f501/Desktop/Tempwork/July 2010/01:07:10/MHBR169:Slavin:VYN/Users/user- f501/Desktop/Tempwork/July 2010/01:07:10/MHBR169:Slavin:VY Chapter Five International Trade Theory 183 scale economies. Faced with limited domestic market demand, firms in each nation may decide not to produce a sports car, since the costs of doing so at such low volume are too great. Although they may produce minivans, the cost of doing so will be higher, as will prices, than if significant economies of scale had been attained. Once the two countries decide to trade, however, a firm in one nation may specialize in producing sports cars, while a firm in the other nation may produce minivans. The combined demand for 110,000 sports cars and 160,000 minivans allows each firm to realize scale economies. Consumers in this case benefit from having access to a product (sports cars) that was not available before international trade and from the lower price for a
- 201. product (minivans) that could not be produced at the most efficient scale before inter- national trade. Trade is thus mutually beneficial because it allows for the specialization of production, the realization of scale economies, the production of a greater variety of products, and lower prices. ECONOMIES OF SCALE, FIRST MOVER ADVANTAGES AND THE PATTERN OF TRADE A second theme in new trade theory is that the pattern of trade we observe in the world economy may be the result of economies of scale and first-mover advantages. First-mover advantages are the economic and strategic ad- vantages that accrue to early entrants into an industry. 28 The ability to capture scale economies ahead of later entrants, and thus benefit from a lower cost structure, is an important first-mover advantage. New trade theory argues that for those products where economies of scale are significant and represent a substantial proportion of world demand, the first movers in an industry can gain a scale- based cost advantage that later entrants find almost impossible to match. Thus, the pattern of trade that we observe for such products may reflect first-mover advantages. Countries may domi- nate in the export of certain goods because economies of scale are important in their production and because firms located in those countries were the first to capture scale economies, giving them a first-mover advantage. For example, consider the commercial aerospace industry,
- 202. where substantial scale economies come from the ability to spread the fixed costs of developing a new jet aircraft over a large number of sales. It has cost Airbus some $15 billion to develop its new super-jumbo jet, the 550-seat A380. To recoup those costs and break even, Airbus will have to sell at least 250 A380 planes. If Airbus can sell over 350 A380 planes, it will apparently be a profitable venture. Total demand over the next 20 years for this class of aircraft is estimated to be somewhere between 400 and 600 units. Thus, the global market can probably profitably support only one producer of jet aircraft in the super-jumbo category. It follows that the European Union might come to dominate in the export of very large jet aircraft, primarily because a European-based firm, Airbus, was the first to produce a super-jumbo jet and realize scale economies. Other potential producers, such as Boeing, might be shut out of the market because they will lack the scale economies that Airbus will enjoy. By pioneering this market category, Airbus may have captured a first-mover advantage based on scale economies that will be difficult for rivals to match, and that will result in the European Union becoming the leading exporter of very large jet aircraft. (Boeing does not believe the market to be large enough to profitably support even one producer, hence its decision not to build a similar aircraft, and instead focus on its super- efficient 787.)
- 203. IMPLICATIONS OF NEW TRADE THEORY New trade theory has impor- tant implications. The theory suggests that nations may benefit from trade even when they do not differ in resource endowments or technology. Trade allows a nation to spe- cialize in the production of certain products, attaining scale economies and lowering First-Mover Advantages Advantages accruing to the first to enter a market. LEARNING OBJECTIVE 3 Recognize why many economists believe that unrestricted free trade between nations will raise the economic welfare of countries that participate in a free trade system. hiL37217_ch05_160-201.indd Page 183 15/07/10 3:42 AM user-f501hiL37217_ch05_160-201.indd Page 183 15/07/10 3:42 AM user-f501 /Users/user-f501/Desktop/Tempwork/July 2010/01:07:10/MHBR169:Slavin:VYN/Users/user- f501/Desktop/Tempwork/July 2010/01:07:10/MHBR169:Slavin:VY
- 204. 184 Part Three Cross-Border Trade and Investment the costs of producing those products, while buying products that it does not produce from other nations that specialize in the production of those products. By this mecha- nism, the variety of products available to consumers in each nation is increased, while the average costs of those products should fall, as should their price, freeing resources to produce other goods and services. The theory also suggests that a country may predominate in the export of a good simply because it was lucky enough to have one or more firms among the first to pro- duce that good. Because they are able to gain economies of scale, the first movers in an industry may get a lock on the world market that discourages subsequent entry. First movers’ ability to benefit from increasing returns creates a barrier to entry. In the commercial aircraft industry, the fact that Boeing and Airbus are already in the indus- try and have the benefits of economies of scale discourages new entry and reinforces the dominance of America and Europe in the trade of midsized and large jet aircraft. This dominance is further reinforced because global demand may not be sufficient to profitably support another producer of midsized and large jet aircraft in the industry. So although Japanese firms might be able to compete in the market, they have decided not to enter the industry but to ally themselves as major subcontractors with primary
- 205. producers (e.g., Mitsubishi Heavy Industries is a major subcontractor for Boeing on the 777 and 787 programs). New trade theory is at variance with the Heckscher-Ohlin theory, which suggests that a country will predominate in the export of a product when it is particularly well endowed with those factors used intensively in its manufacture. New trade theorists argue that the United States is a major exporter of commercial jet aircraft not because it is better endowed with the factors of production required to manufacture aircraft, but because one of the first movers in the industry, Boeing, was a U.S. firm. The new trade theory is not at variance with the theory of comparative advantage. Economies of scale increase productivity. Thus, the new trade theory identifies an important source of comparative advantage. This theory is quite useful in explaining trade patterns. Empirical studies seem to sup- port the predictions of the theory that trade increases the specialization of production The European Union may come to dominate in the export of super-jumbo jets primarily because Airbus, a European-based firm, was the first to produce a 550-seat aircraft and realize economies of scale. hiL37217_ch05_160-201.indd Page 184 15/07/10 3:42 AM user-f501hiL37217_ch05_160-201.indd Page 184 15/07/10 3:42 AM user-f501 /Users/user-f501/Desktop/Tempwork/July 2010/01:07:10/MHBR169:Slavin:VYN/Users/user- f501/Desktop/Tempwork/July 2010/01:07:10/MHBR169:Slavin:VY
- 206. Chapter Five International Trade Theory 185 within an industry, increases the variety of products available to consumers, and results in lower average prices. 29 With regard to first-mover advantages and international trade, a study by Harvard business historian Alfred Chandler suggests the existence of first-mover advantages is an important factor in explaining the dominance of firms from certain na- tions in specific industries. 30 The number of firms is very limited in many global indus- tries, including the chemical industry, the heavy construction- equipment industry, the heavy truck industry, the tire industry, the consumer electronics industry, the jet engine industry, and the computer software industry. Perhaps the most contentious implication of the new trade theory is the argu- ment that it generates for government intervention and strategic trade policy. 31 New trade theorists stress the role of luck, entrepreneurship, and innovation in giving a firm first-mover advantages. According to this argument, the reason Boeing was the first mover in commercial jet aircraft manufacture—rather than firms such as Great Britain’s DeHavilland and Hawker Siddeley, or Holland’s Fokker, all of which could have been—was that Boeing was both lucky and innovative. One way Boeing was lucky is that DeHavilland’s Comet jet airliner, introduced two years earlier than
- 207. Boeing’s first jet airliner, the 707, was found to be full of serious technological flaws. Had DeHavilland not made serious technological mistakes, Great Britain might have become the world’s leading exporter of commercial jet aircraft. Boeing’s inno- vativeness was demonstrated by its independent development of the technological know-how required to build a commercial jet airliner. Several new trade theorists have pointed out, however, that Boeing’s R&D was largely paid for by the U.S. gov- ernment; the 707 was a spin-off from a government-funded military program (the entry of Airbus into the industry was also supported by significant government sub- sidies). Herein is a rationale for government intervention; by the sophisticated and judicious use of subsidies, could a government increase the chances of its domestic firms becoming first movers in newly emerging industries, as the U.S. government apparently did with Boeing (and the European Union did with Airbus)? If this is possible, and the new trade theory suggests it might be, we have an economic ratio- nale for a proactive trade policy that is at variance with the free trade prescriptions of the trade theories we have reviewed so far. We will consider the policy implica- tions of this issue in Chapter 6. National Competitive Advantage: Porter’s Diamond In 1990 Michael Porter of the Harvard Business School
- 208. published the results of an intensive research effort that attempted to determine why some nations succeed and others fail in international competition. 32 Porter and his team looked at 100 indus- tries in 10 nations. Like the work of the new trade theorists, Porter’s work was driven by a belief that existing theories of international trade told only part of the story. For Porter, the essential task was to explain why a nation achieves international success in a particular industry. Why does Japan do so well in the automobile industry? Why does Switzerland excel in the production and export of precision instruments and pharmaceuticals? Why do Germany and the United States do so well in the chemical industry? These questions cannot be answered easily by the Heckscher-Ohlin theory, and the theory of comparative advantage offers only a partial explanation. The theory of comparative advantage would say that Switzerland excels in the production and export of precision instruments because it uses its resources very productively in these industries. Although this may be correct, this does not explain why Switzerland LEARNING OBJECTIVE 4 Explain the arguments of those who maintain that government can play a proactive role in promoting national competitive
- 209. advantage in certain industries. LEARNING OBJECTIVE 2 Summarize the different theories explaining trade flows between nations. hiL37217_ch05_160-201.indd Page 185 15/07/10 3:42 AM user-f501hiL37217_ch05_160-201.indd Page 185 15/07/10 3:42 AM user-f501 /Users/user-f501/Desktop/Tempwork/July 2010/01:07:10/MHBR169:Slavin:VYN/Users/user- f501/Desktop/Tempwork/July 2010/01:07:10/MHBR169:Slavin:VY 186 Part Three Cross-Border Trade and Investment is more productive in this industry than Great Britain, Germany, or Spain. Porter tries to solve this puzzle. Porter theorizes that four broad attributes of a nation shape the environment in which local firms compete, and these attributes promote or impede the creation of competitive advantage (see Figure 5.6). These attributes are • Factor endowments —a nation’s position in factors of production such as skilled labor or the infrastructure necessary to compete in a given industry. • Demand conditions —the nature of home demand for the
- 210. industry’s product or service. • Relating and supporting industries —the presence or absence of supplier industries and related industries that are internationally competitive. • Firm strategy, structure, and rivalry —the conditions governing how companies are created, organized, and managed and the nature of domestic rivalry. Porter speaks of these four attributes as constituting the diamond. He argues that firms are most likely to succeed in industries or industry segments where the diamond is most favorable. He also argues that the diamond is a mutu- ally reinforcing system. The effect of one attribute is contingent on the state of others. For example, Porter argues favorable demand conditions will not result in competitive advantage unless the state of rivalry is sufficient to cause firms to respond to them. Porter maintains that two additional variables can influence the national diamond in important ways: chance and government. Chance events, such as major innovations, can reshape industry struc- ture and provide the opportunity for one nation’s firms to supplant another’s. Government, by its choice of policies, can detract from or improve na- tional advantage. For example, regulation can alter home demand conditions, antitrust policies can in- fluence the intensity of rivalry within an industry, and government investments in education can change factor endowments.
- 211. Demand conditions Factor endowments Related and supporting industries Firm strategy, structure, and rivalry figure 5.6 Determinants of National Competitive Advantage: Porter’s Diamond Source: Reprinted by permission of the Harvard Business Review . “The Competitive Advantage of Nations” by Michael E. Porter, March–April 1990, p. 77. Copyright © 1990 by The President and Fellows of
- 212. Harvard College; all rights reserved. A n o t h e r P e r s p e c t i v e North Dakota: Oil Capital of the Plains? When you think “North Dakota,” what comes to mind? Per- haps you think endless fields of winter wheat, the Minot Air Force Base, or the Coen brothers’ award-winning film, Fargo . You’re probably unlikely to think oil—but if you did, you’d be right. Thanks to recent technology improvements, oil has become North Dakota’s fastest-growing industry and an important new factor endowment for the state. In 2009, oil production doubled in North Dakota, rendering it the fourth- largest oil producer in the United States. If estimates are accurate, some observers believe North Dakota could out- perform Alaska in oil production by 2019. (Ben Castleman, “Oil Industry Booms—in North Dakota,” The Wall Street Journal, February 26, 2010, http://online.wsj.com) hiL37217_ch05_160-201.indd Page 186 15/07/10 3:42 AM user-f501hiL37217_ch05_160-201.indd Page 186 15/07/10 3:42 AM user-f501 /Users/user-f501/Desktop/Tempwork/July 2010/01:07:10/MHBR169:Slavin:VYN/Users/user- f501/Desktop/Tempwork/July 2010/01:07:10/MHBR169:Slavin:VY Chapter Five International Trade Theory 187 FACTOR E N DOWM E NTS Factor en- dowments lie at the center of the Heckscher- Ohlin theory. While Porter does not propose anything radically new, he does analyze the char- acteristics of factors of production. He recog- nizes hierarchies among factors, distinguishing
- 213. between basic factors (e.g., natural resources, cli- mate, location, and demographics) and advanced factors (e.g., communication infrastructure, so- phisticated and skilled labor, research facilities, and technological know-how). He argues that advanced factors are the most significant for competitive advantage. Unlike the naturally en- dowed basic factors, advanced factors are a prod- uct of investment by individuals, companies, and governments. Thus, government investments in basic and higher education, by improving the general skill and knowledge level of the popula- tion and by stimulating advanced research at higher education institutions, can upgrade a nation’s advanced factors. The relationship between advanced and basic factors is complex. Basic factors can provide an initial advantage that is subsequently reinforced and extended by invest- ment in advanced factors. Conversely, disadvantages in basic factors can create pres- sures to invest in advanced factors. An obvious example of this phenomenon is Japan, a country that lacks arable land and mineral deposits and yet through investment has built a substantial endowment of advanced factors. Porter notes that Japan’s large pool of engineers (reflecting a much higher number of engineering graduates per capita than almost any other nation) has been vital to Japan’s success in many manufacturing industries. DEMAND CONDITIONS Porter emphasizes the role home demand plays in upgrading competitive advantage. Firms are typically most
- 214. sensitive to the needs of their closest customers. Thus, the characteristics of home demand are particularly im- portant in shaping the attributes of domestically made products and in creating pres- sures for innovation and quality. Porter argues that a nation’s firms gain competitive advantage if their domestic consumers are sophisticated and demanding. Such con- sumers pressure local firms to meet high standards of product quality and to produce innovative products. Porter notes that Japan’s sophisticated and knowledgeable buyers of cameras helped stimulate the Japanese camera industry to improve product quality and to introduce innovative models. A similar example can be found in the wireless telephone equipment industry, where sophisticated and demanding local customers in Scandinavia helped push Nokia of Finland and Ericsson of Sweden to invest in cellular phone technology long before demand for cellular phones took off in other developed nations. The case of Nokia is reviewed in more depth in the accompanying Manage- ment Focus. RELATED AND SUPPORTING INDUSTRIES The third broad attribute of national advantage in an industry is the presence of suppliers or related industries that are internationally competitive. The benefits of investments in advanced factors of production by related and supporting industries can spill over into an industry,
- 215. A n o t h e r P e r s p e c t i v e Factor Endowments: A Quiz One of the most significant factor endowments is educa- tion, with important measures being literacy rate and the literacy rate gap between the genders. Which of the fol- lowing countries do you think has the largest literacy gap between males and females? (a) Iraq, (b) Rwanda, (c) Chile, (d) India. The answer may surprise you. It’s not Iraq, although in nearly all countries of the Middle East, men are more likely than women to be literate. With 74 percent literacy overall, Iraq has a nearly 20-point gap between males and females. Nor is it Rwanda, with a 12-point gap and a 70 percent lit- eracy rate overall. And it certainly isn’t Chile, with its 96 percent literacy rate and less than a 1-point gap be- tween the sexes. It is India, with an overall adult literacy rate of 61 percent and a gap of nearly 26 points between males and females. (U.S. Central Intelligence Agency, World Factbook 2010, www.cia.gov) hiL37217_ch05_160-201.indd Page 187 15/07/10 3:42 AM user-f501hiL37217_ch05_160-201.indd Page 187 15/07/10 3:42 AM user-f501 /Users/user-f501/Desktop/Tempwork/July 2010/01:07:10/MHBR169:Slavin:VYN/Users/user- f501/Desktop/Tempwork/July 2010/01:07:10/MHBR169:Slavin:VY 188 Part Three Cross-Border Trade and Investment thereby helping it achieve a strong competitive position internationally. Swedish strength in fabricated steel products (e.g., ball bearings and cutting tools) has drawn
- 216. on strengths in Sweden’s specialty steel industry. Technological leadership in the U.S. semiconductor industry provided the basis for U.S. success in personal computers and several other technically advanced electronic products. Similarly, Switzerland’s success in pharmaceuticals is closely related to its previous international success in the techno- logically related dye industry. M a n a g e m e n t F O C U S The Rise of Finland’s Nokia The wireless phone market is one of the great growth sto- ries of the last decade. Starting from a very low base in 1990, annual global sales of wireless phones surged to reach about 1.2 billion units in 2009. By the end of 2009, the number of wireless subscriber accounts worldwide was around 4.5 billion, up from less than 10 million in 1990. Nokia is one of the dominant players in the world market for mobile phones with a 37 percent share of the market in 2008. Nokia’s roots are in Finland, not normally a country that comes to mind when one talks about leading-edge technology companies. In the 1980s, Nokia was a rambling Finnish conglomerate with activities that embraced tire manufacturing, paper production, consumer electronics, and telecommunications equipment. By the early 2000s it had transformed itself into a focused telecommunications equipment manufacturer with a global reach. How has this former conglomerate emerged to take a global leadership position in wireless telecommunications equipment? Much of the answer lies in the history, geography, and political economy of Finland and its Nordic neighbors. In 1981 the Nordic nations cooperated to create the world’s first international wireless telephone network.
- 217. They had good reason to become pioneers: It cost far too much to lay a traditional wire-line telephone service in those sparsely populated and inhospitably cold countries. The same features made telecommunications all the more valuable: People driving through the Arctic winter and owners of remote northern houses needed a telephone to summon help if things went wrong. As a result, Sweden, Norway, and Finland became the first nations in the world to take wireless telecommunications seriously. They found, for example, that although it cost up to $800 per subscriber to bring a traditional wire-line service to remote locations, the same locations could be linked by wireless cellular for only $500 per person. As a consequence, 12 percent of people in Scandinavia owned cellular phones by 1994, compared with less than 6 percent in the United States, the world’s second most developed market. This lead contin- ued over the next decade. By 2008, 90 percent of the popu- lation in Finland owned a wireless phone, compared with 70 percent in the United States. Nokia, a longtime telecommunications equipment sup- plier, was well positioned to take advantage of this devel- opment from the start, but other forces were also at work to help Nokia develop its competitive edge. Unlike virtually every other developed nation, Finland has never had a national telephone monopoly. Instead, the country’s tele- phone services have long been provided by about 50 autonomous local telephone companies whose elected boards set prices by referendum (which naturally means low prices). This army of independent and cost-conscious telephone service providers prevented Nokia from taking anything for granted in its home country. With typical Finnish pragmatism, its customers were willing to buy from the lowest-cost supplier, whether that was Nokia, Ericsson, Motorola, or some other company. This situation con- trasted sharply with that prevailing in most developed na-
- 218. tions until the late 1980s and early 1990s, where domestic telephone monopolies typically purchased equipment from a dominant local supplier or made it themselves. Nokia re- sponded to this competitive pressure by doing everything possible to drive down its manufacturing costs while stay- ing at the leading edge of wireless technology. The consequences of these forces are clear. Nokia is now a leader in digital wireless technology. Many now re- gard Finland as one of the lead markets for wireless tele- phone services. If you want to see the future of wireless, you don’t go to New York or San Francisco; you go to Helsinki, where Finns use their wireless handsets not just to talk to each other or browse the Web, but also to control house- hold heating and lighting systems, or purchase Coke from a wireless-enabled vending machine. Nokia has gained this lead because Scandinavia started switching to digital technology five years before the rest of the world. Sources: “Lessons from the Frozen North,” The Economist , October 8, 1994, pp. 76–77; “A Finnish Fable,” The Economist , October 14, 2000; D. O’Shea and K. Fitchard, “The First 3 Billion Is Always the Hardest,” Wireless Review 22 (September 2005), pp. 25–31; P. Taylor, “Big Names Dominate in Mobile Phones,” Financial Times , September 29, 2006, p. 26; and Nokia Web site at www.nokia.com. hiL37217_ch05_160-201.indd Page 188 15/07/10 3:42 AM user-f501hiL37217_ch05_160-201.indd Page 188 15/07/10 3:42 AM user-f501 /Users/user-f501/Desktop/Tempwork/July 2010/01:07:10/MHBR169:Slavin:VYN/Users/user- f501/Desktop/Tempwork/July 2010/01:07:10/MHBR169:Slavin:VY
- 219. Chapter Five International Trade Theory 189 One consequence of this process is that successful industries within a country tend to be grouped into clusters of related industries. This was one of the most pervasive findings of Porter’s study. One such cluster Porter identified was in the German textile and apparel sector, which included high-quality cotton, wool, synthetic fibers, sewing machine needles, and a wide range of textile machinery. Such clusters are important because valuable knowledge can flow between the firms within a geographic cluster, benefiting all within that cluster. Knowledge flows occur when employees move be- tween firms within a region and when national industry associations bring employees from different companies together for regular conferences or workshops. 33 FIRM STRATEGY, STRUCTURE, AND RIVALRY The fourth broad attri- bute of national competitive advantage in Porter’s model is the strategy, structure, and rivalry of firms within a nation. Porter makes two important points here. First, differ- ent nations are characterized by different management ideologies, which either help them or do not help them to build national competitive advantage. For example, Porter noted the predominance of engineers in top management at German and
- 220. Japanese firms. He attributed this to these firms’ emphasis on improving manufactur- ing processes and product design. In contrast, Porter noted a predominance of people with finance backgrounds leading many U.S. firms. He linked this to U.S. firms’ lack of attention to improving manufacturing processes and product design. He argued that the dominance of finance led to an overemphasis on maximizing short-term financial returns. According to Porter, one consequence of these different manage- ment ideologies was a relative loss of U.S. competitiveness in those engineering-based industries where manufacturing processes and product design issues are all-important (e.g., the automobile industry). Porter’s second point is that there is a strong association between vigorous do- mestic rivalry and the creation and persistence of competitive advantage in an in- dustry. Vigorous domestic rivalry induces firms to look for ways to improve efficiency, which makes them better international competitors. Domestic rivalry creates pressures to innovate, to improve quality, to reduce costs, and to invest in upgrading advanced factors. All this helps to create world-class competitors. Porter cites the case of Japan: Nowhere is the role of domestic rivalry more evident than in Japan, where it is all-out warfare in which many companies fail to achieve profitability. With goals that stress market share, Japanese companies engage in a
- 221. continuing struggle to outdo each other. Shares fluctuate markedly. The process is prominently covered in the business press. Elaborate rankings measure which companies are most popular with university graduates. The rate of new product and process develop- ment is breathtaking. 34 A similar point about the stimulating effects of strong domestic competition can be made with regard to the rise of Nokia of Finland to global preeminence in the market for cellular telephone equipment. For details, see the Management Focus. EVALUATING PORTER’S THEORY Porter contends that the degree to which a nation is likely to achieve international success in a certain industry is a function of the combined impact of factor endowments, domestic demand condi- tions, related and supporting industries, and domestic rivalry. He argues that the presence of all four components is usually required for this diamond to boost com- petitive performance (although there are exceptions). Porter also contends that gov- ernment can influence each of the four components of the diamond—either LEARNING OBJECTIVE 4 Explain the arguments of those who maintain that government can play a
- 222. proactive role in promoting national competitive advantage in certain industries. hiL37217_ch05_160-201.indd Page 189 15/07/10 3:42 AM user-f501hiL37217_ch05_160-201.indd Page 189 15/07/10 3:42 AM user-f501 /Users/user-f501/Desktop/Tempwork/July 2010/01:07:10/MHBR169:Slavin:VYN/Users/user- f501/Desktop/Tempwork/July 2010/01:07:10/MHBR169:Slavin:VY 190 Part Three Cross-Border Trade and Investment positively or negatively. Factor endowments can be affected by subsidies, policies toward capital markets, policies toward education, and so on. Government can shape domestic demand through local product standards or with regulations that mandate or influence buyer needs. Government policy can influence supporting and related industries through regulation and influence firm rivalry through such devices as capital market regulation, tax policy, and antitrust laws. If Porter is correct, we would expect his model to predict the pattern of interna- tional trade that we observe in the real world. Countries should be exporting products from those industries where all four components of the diamond are favorable, while importing in those areas where the components are not
- 223. favorable. Is he correct? We simply do not know. Porter’s theory has not been subjected to detailed empirical test- ing. Much about the theory rings true, but the same can be said for the new trade theory, the theory of comparative advantage, and the Heckscher- Ohlin theory. It may be that each of these theories, which complement each other, explains something about the pattern of international trade. Focus on Managerial Implications Why does all this matter for business? There are at least three main implications for international businesses of the material discussed in this chapter: location implica- tions, first-mover implications, and policy implications. Location Underlying most of the theories we have discussed is the notion that different coun- tries have particular advantages in different productive activities. Thus, from a profit perspective, it makes sense for a firm to disperse its productive activities to those countries where, according to the theory of international trade, they can be per- formed most efficiently. If design can be performed most efficiently in France, that is where design facilities should be located; if the manufacture of basic components can be performed most efficiently in Singapore, that is where they should be manufac- tured; and if final assembly can be performed most efficiently in China, that is where
- 224. final assembly should be performed. The result is a global web of productive activi- ties, with different activities being performed in different locations around the globe depending on considerations of comparative advantage, factor endowments, and the like. If the firm does not do this, it may find itself at a competitive disadvantage rela- tive to firms that do. Consider the production of a laptop computer, a process with four major stages: (1) basic research and development of the product design, (2) manufacture of standard electronic components (e.g., memory chips), (3) manufacture of advanced components (e.g., flat-top color display screens and microprocessors), and (4) final assembly. Basic R&D requires a pool of highly skilled and educated workers with good backgrounds in microelectronics. The two countries with a comparative advantage in basic micro- electronics R&D and design are Japan and the United States, so most producers of laptop computers locate their R&D facilities in one, or both, of these countries. (Apple, IBM, Motorola, Texas Instruments, Toshiba, and Sony all have major R&D facilities in both Japan and the United States.) LEARNING OBJECTIVE 5 Understand the important implications that international trade theory holds for business practice. hiL37217_ch05_160-201.indd Page 190 15/07/10 3:42 AM
- 225. user-f501hiL37217_ch05_160-201.indd Page 190 15/07/10 3:42 AM user-f501 /Users/user-f501/Desktop/Tempwork/July 2010/01:07:10/MHBR169:Slavin:VYN/Users/user- f501/Desktop/Tempwork/July 2010/01:07:10/MHBR169:Slavin:VY Chapter Five International Trade Theory 191 The manufacture of standard electronic components is a capital-intensive process requiring semiskilled labor, and cost pressures are intense. The best locations for such activities today are places such as Taiwan, Malaysia, and South Korea. These coun- tries have pools of relatively skilled, moderate-cost labor. Thus, many producers of laptop computers have standard components, such as memory chips, produced at these locations. The manufacture of advanced components such as microprocessors is a capital- intensive process requiring skilled labor. Because cost pressures are not so intense at this stage, these components can be—and are—manufactured in countries with high labor costs that also have pools of highly skilled labor (e.g. Japan and the United States). Finally, assembly is a relatively labor-intensive process requiring only low-skilled labor, and cost pressures are intense. As a result, final assembly may be carried out in a country such as Mexico, which has an abundance of low-cost, low-skilled labor. A
- 226. laptop computer produced by a U.S. manufacturer may be designed in California, have its standard components produced in Taiwan and Singapore, its advanced com- ponents produced in Japan and the United States, its final assembly in Mexico, and be sold in the United States or elsewhere in the world. By dispersing production activi- ties to different locations around the globe, the U.S. manufacturer is taking advan- tage of the differences between countries identified by the various theories of international trade. First-Mover Advantages According to the new trade theory, firms that establish a first- mover advantage with regard to the production of a particular new product may subsequently dominate global trade in that product. This is particularly true in industries where the global market can profitably support only a limited number of firms, such as the aerospace market, but early commitments also seem to be important in less concentrated indus- tries such as the market for cellular telephone equipment (see the Management Focus on Nokia). For the individual firm, the clear message is that it pays to invest substan- tial financial resources in trying to build a first-mover, or early- mover, advantage, even if that means several years of losses before a new venture becomes profitable. The idea is to preempt the available demand, gain cost advantages related to volume, build an enduring brand ahead of later competitors, and, consequently,
- 227. establish a long-term sustainable competitive advantage. Although the details of how to achieve this are be- yond the scope of this book, many publications offer strategies for exploiting first- mover advantages, and for avoiding the traps associated with pioneering a market (first-mover disadvantages). 35 Government Policy The theories of international trade also matter to international businesses because firms are major players on the international trade scene. Business firms produce ex- ports, and business firms import the products of other countries. Because of their pivotal role in international trade, businesses can exert a strong influence on govern- ment trade policy, lobbying to promote free trade or trade restrictions. The theories of international trade claim that promoting free trade is generally in the best interests of a country, although it may not always be in the best interest of an individual firm. Many firms recognize this and lobby for open markets. For example, when the U.S. government announced its intention to place a tariff on Japanese imports of liquid-crystal display (LCD) screens in the 1990s, IBM and Apple Computer protested strongly. Both IBM and Apple pointed out that (1) Japan was the lowest-cost source of LCD screens, (2) they used these screens in their own laptop hiL37217_ch05_160-201.indd Page 191 15/07/10 3:42 AM user-f501hiL37217_ch05_160-201.indd Page 191 15/07/10
- 228. 3:42 AM user-f501 /Users/user-f501/Desktop/Tempwork/July 2010/01:07:10/MHBR169:Slavin:VYN/Users/user- f501/Desktop/Tempwork/July 2010/01:07:10/MHBR169:Slavin:VY 192 Part Three Cross-Border Trade and Investment computers, and (3) the proposed tariff, by increasing the cost of LCD screens, would increase the cost of laptop computers produced by IBM and Apple, thus making them less competitive in the world market. In other words, the tariff, designed to protect U.S. firms, would be self-defeating. In response to these pressures, the U.S. govern- ment reversed its posture. Unlike IBM and Apple, however, businesses do not always lobby for free trade. In the United States, for example, restrictions on imports of steel are the result of direct pressure by U.S. firms on the government. In some cases, the government has re- sponded to pressure by getting foreign companies to agree to “voluntary” restrictions on their imports, using the implicit threat of more comprehensive formal trade barri- ers to get them to adhere to these agreements (historically, this has occurred in the automobile industry). In other cases, the government used what are called “antidump- ing” actions to justify tariffs on imports from other nations (these mechanisms will be discussed in detail in the next chapter). As predicted by international trade theory, many of these
- 229. agreements have been self-defeating, such as the voluntary restriction on machine tool imports agreed to in 1985. Due to limited import competition from more efficient foreign suppliers, the prices of machine tools in the United States rose to higher levels than would have prevailed under free trade. Because machine tools are used throughout the manufac- turing industry, the result was to increase the costs of U.S. manufacturing in general, creating a corresponding loss in world market competitiveness. Shielded from interna- tional competition by import barriers, the U.S. machine tool industry had no incentive to increase its efficiency. Consequently, it lost many of its export markets to more ef- ficient foreign competitors. Because of this misguided action, the U.S. machine tool industry shrunk during the period when the agreement was in force. For anyone schooled in international trade theory, this was not surprising. 36 A similar scenario unfolded in the U.S. steel industry, where tariff barriers erected by the government in 2001 raised the cost of steel to important U.S. users, such as automobile companies and appliance makers, making their products more uncompetitive. Finally, Porter’s theory of national competitive advantage also contains policy im- plications. Porter’s theory suggests that it is in the best interest of business for a firm to invest in upgrading advanced factors of production; for example, to invest in bet- ter training for its employees and to increase its commitment to
- 230. research and devel- opment. It is also in the best interests of business to lobby the government to adopt policies that have a favorable impact on each component of the national diamond. Thus, according to Porter, businesses should urge government to increase invest- ment in education, infrastructure, and basic research (since all these enhance ad- vanced factors) and to adopt policies that promote strong competition within domestic markets (since this makes firms stronger international competitors, ac- cording to Porter’s findings). free trade, p. 163 new trade theory, p. 165 mercantilism, p. 165 zero-sum game, p. 167 absolute advantage, p. 167 constant returns to specialization, p. 173 factor endowments, p. 178 economies of scale, p. 182 first-mover advantages, p. 183 Key Terms hiL37217_ch05_160-201.indd Page 192 15/07/10 3:42 AM user-f501hiL37217_ch05_160-201.indd Page 192 15/07/10 3:42 AM user-f501 /Users/user-f501/Desktop/Tempwork/July 2010/01:07:10/MHBR169:Slavin:VYN/Users/user- f501/Desktop/Tempwork/July 2010/01:07:10/MHBR169:Slavin:VY
- 231. Chapter Five International Trade Theory 193 Summary This chapter has reviewed a number of theories that explain why it is beneficial for a country to engage in international trade and has explained the pattern of international trade observed in the world economy. We have seen how the theories of Smith, Ricardo, and Heckscher-Ohlin all make strong cases for un- restricted free trade. In contrast, the mercantilist doctrine and, to a lesser extent, the new trade theory can be interpreted to support government interven- tion to promote exports through subsidies and to limit imports through tariffs and quotas. In explaining the pattern of international trade, the second objective of this chapter, we have seen that with the exception of mercantilism, which is silent on this issue, the different theories offer largely complementary explanations. Although no one the- ory may explain the apparent pattern of international trade, taken together, the theory of comparative advantage, the Heckscher-Ohlin theory, the product life-cycle theory, the new trade theory, and Porter’s theory of national competitive advantage do suggest which factors are important. Comparative advantage tells us that productivity differences are important; Heckscher-Ohlin tells us that factor endowments matter; the product life-cycle theory tells us that where a new product is introduced is important; the new trade theory tells us that increasing returns to specialization and first-mover advantages matter; and Porter tells us that all these factors may be important
- 232. insofar as they impact the four components of the national diamond. The chapter made these major points: 1. Mercantilists argued that it was in a country’s best interests to run a balance-of-trade surplus. They viewed trade as a zero-sum game, in which one country’s gains cause losses for other countries. 2. The theory of absolute advantage suggests that countries differ in their ability to produce goods efficiently. The theory suggests that a country should specialize in producing goods in areas where it has an absolute advantage and import goods in areas where other countries have absolute advantages. 3. The theory of comparative advantage suggests that it makes sense for a country to specialize in producing those goods that it can produce most efficiently, while buying goods that it can produce relatively less efficiently from other countries—even if that means buying goods from other countries that it could produce more efficiently itself. 4. The theory of comparative advantage suggests that unrestricted free trade brings about increased world production; that is, that trade is a positive-sum game. 5. The theory of comparative advantage also suggests that opening a country to free trade stimulates economic growth, which creates
- 233. dynamic gains from trade. The empirical evidence seems to be consistent with this claim. 6. The Heckscher-Ohlin theory argues that the pattern of international trade is determined by differences in factor endowments. It predicts that countries will export those goods that make intensive use of locally abundant factors and will import goods that make intensive use of factors that are locally scarce. 7. The product life-cycle theory suggests that trade patterns are influenced by where a new product is introduced. In an increasingly integrated global economy, the product life- cycle theory seems to be less predictive than it once was. 8. New trade theory states that trade allows a nation to specialize in the production of certain goods, attaining scale economies and lowering the costs of producing those goods, while buying goods that it does not produce from other nations that are similarly specialized. By this mechanism, the variety of goods available to consumers in each nation is increased, while the average costs of those goods should fall. 9. New trade theory also states that in those industries where substantial economies of scale imply that the world market will profitably support only a few firms, countries may predominate in the export of certain products simply because they had a firm that was a first mover in that industry.
- 234. 10. Some new trade theorists have promoted the idea of strategic trade policy. The argument is that government, by the sophisticated and judicious use of subsidies, might be able to increase the chances of domestic firms becoming first movers in newly emerging industries. hiL37217_ch05_160-201.indd Page 193 15/07/10 3:42 AM user-f501hiL37217_ch05_160-201.indd Page 193 15/07/10 3:42 AM user-f501 /Users/user-f501/Desktop/Tempwork/July 2010/01:07:10/MHBR169:Slavin:VYN/Users/user- f501/Desktop/Tempwork/July 2010/01:07:10/MHBR169:Slavin:VY 194 Part Three Cross-Border Trade and Investment 11. Porter’s theory of national competitive advantage suggests that the pattern of trade is influenced by four attributes of a nation: (a) factor endowments, (b) domestic demand conditions, (c) relating and supporting industries, and (d) firm strategy, structure, and rivalry. 12. Theories of international trade are important to an individual business firm primarily because they can help the firm decide where to locate its various production activities. 13. Firms involved in international trade can and do exert a strong influence on government policy toward trade. By lobbying government, business firms can promote free trade or trade restrictions.
- 235. Critical Thinking and Discussion Questions 1. Mercantilism is a bankrupt theory that has no place in the modern world. Discuss. 2. Is free trade fair? Discuss. 3. Unions in developed nations often oppose imports from low-wage countries and advocate trade barriers to protect jobs from what they often characterize as “unfair” import competition. Is such competition “unfair”? Do you think that this argument is in the best interests of ( a ) the unions, ( b ) the people they represent, and/or ( c ) the country as a whole? 4. What are the potential costs of adopting a free trade regime? Do you think governments should do anything to reduce these costs? What? 5. Reread the Country Focus “Is China a Neo- mercantilist Nation?” a. Do you think China is pursing an economic policy that can be characterized as neo- mercantilist? b. What should the United States, and other countries, do about this? 6. Reread the Country Focus “Moving U.S. White- Collar Jobs Offshore.” a. Who benefits from the outsourcing of skilled white-collar jobs to developing nations? Who
- 236. are the losers? b. Will developing nations like the United States suffer from the loss of high-skilled and high- paying jobs? c. Is there a difference between the transference of high-paying white-collar jobs, such as computer programming and accounting, to developing nations and low-paying blue-collar jobs? If so, what is the difference, and should government do anything to stop the flow of white-collar jobs out of the country to countries such as India? 7. Drawing upon the new trade theory and Porter’s theory of national competitive advantage, outline the case for government policies that would build national competitive advantage in biotechnology. What kinds of policies would you recommend that the government adopt? Are these policies at variance with the basic free trade philosophy? 8. The world’s poorest countries are at a competitive disadvantage in every sector of their economies. They have little to export. They have no capital; their land is of poor quality; they often have too many people given available work opportunities; and they are poorly educated. Free trade cannot possibly be in the interests of such nations! Discuss. Use the globalEDGE Resource Desk (http:// globalEDGE.msu.edu/resourcedesk/) to complete the following exercises:
- 237. 1. You work for a telecommunications company and your current project is to determine the five African countries that, in your estimation, should have an advantage in telecommunications infrastructure. Use a resource that tracks statistics on economic factors such as Internet use of each country. Develop a list and brief report on the top five African countries in telecommunications infrastructure. Were you surprised by any countries listed? Why (or, why not)? Research Task http://globalEDGE.msu.edu hiL37217_ch05_160-201.indd Page 194 15/07/10 3:42 AM user-f501hiL37217_ch05_160-201.indd Page 194 15/07/10 3:42 AM user-f501 /Users/user-f501/Desktop/Tempwork/July 2010/01:07:10/MHBR169:Slavin:VYN/Users/user- f501/Desktop/Tempwork/July 2010/01:07:10/MHBR169:Slavin:VY Chapter Five International Trade Theory 195 2. Your coffee firm is seeking new locations to source coffee from to sustain its growth as it internationalizes. Currently, your company only purchases green coffee beans from South America and is hoping to begin purchasing coffee from the Central American countries of Costa Rica, El Salvador, Guatemala, Honduras, and Panama. Applying the most current information from FAOSTAT, a UN agency Web
- 238. site that gathers data on food and agricultural trade flows, determine which three countries have the highest export value of green coffee as well as growth of export value over the most recent year of data available. Logitech Best known as one of the world’s largest producers of com- puter mice, Logitech is in many ways the epitome of the mod- ern global corporation. Founded in 1981 in Apples, Switzerland, by two Italians and a Swiss, the company now generates annual sales of more than $2.2 billion, most from products such as mice, keyboards and low-cost video-cams. Logitech made its name as a technological innovator in the highly competitive business of personal computer peripherals. It was the first company to introduce a mouse that used infrared tracking, rather than a tracking ball, and the first to introduce the wireless mouse and keyboard. Logitech is differentiated from competitors by its continuing innovation, its high brand recognition, and strong retail presence. Less obvious to con- sumers, but equally important, has been the way the company has configured its global value chain to lower production costs while maintaining the value of those assets that lead to differentiation. Logitech still undertakes basic R&D work (primarily soft- ware programming) in Switzerland where it has several hun- dred employees. The company is still legally Swiss, but most of the corporate functions are run out of offices in Fremont, California, close to many of America’s high-technology enter- prises, where it has more than 500 employees. Some R&D work (again, primarily software programming) is also carried out in Fremont. Most significantly though, Fremont is the headquarters for the company’s global marketing, finance, and logistics operations. The ergonomic design of Logitech’s products—their look and feel—is done in Ireland by an out-
- 239. side design firm. Most of Logitech’s products are manufac- tured in Asia. Logitech’s expansion into Asian manufacturing began in the late 1980s when it opened a factory in Taiwan. At the time, most of its mice were produced in the United States. Logitech was trying to win two of the most prestigious OEM customers— Apple Computer and IBM. Both bought their mice from Alps, a large Japanese firm that supplied Microsoft. To attract discerning customers such as Apple, Logitech not only needed the capacity to produce at high volume and low cost, bit it also had to offer a better-designed product. The solution: manufacture in Taiwan. Cost was a factor in the decision, but it was not as significant as might be expected, since direct labor accounted for only 7 percent of the cost of Logitech’s mouse. Taiwan offered a well-developed supply base for parts, qualified people, and a rapidly expanding local com- puter industry. As an inducement to fledgling innovators, Taiwan provided space in its Hsinchu Science and Industrial Park for the modest fee of $200,000. Sizing this up as a deal that was too good to pass up, Logitech signed the lease. Soon afterward, Logitech won the OEM contract with Apple. The Taiwanese factory was soon outproducing Logitech’s U.S. facility. After the Apple contract, Logitech’s other OEM busi- ness started being served from Taiwan; the plant’s total capacity increased to 10 million mice per year. By the late 1990s, Logitech needed more production ca- pacity. This time it turned to China. A wide variety of the com- pany’s retail products are now made there. Take one of Logitech’s biggest sellers, a wireless infrared mouse called Wanda. The mouse itself is assembled in Suzhou, China, in a factory that Logitech owns. The factory employs 4,000 people, mostly young women such as Wang Yan, an 18-year-old em- ployee from the impoverished rural province of Anhui. She is paid $75 a month to sit all day at a conveyer belt plugging three tiny bits of metal into circuit boards. She does this about
- 240. 2,000 times each day. The mouse Wang Yan helps assemble sells to American consumers for about $40. Of this, Logitech takes about $8, which is used to fund R&D, marketing, and corporate overhead. What remains from the $8 is the profit attributable to Logitech’s shareholders. Distributors and re- tailers around the world take a further $15. Another $14 goes to the suppliers that make Wanda’s parts. For example, a Motorola plant in Malaysia makes the mouse’s chips and another American company, Agilent Technologies, supplies closing case hiL37217_ch05_160-201.indd Page 195 15/07/10 3:42 AM user-f501hiL37217_ch05_160-201.indd Page 195 15/07/10 3:42 AM user-f501 /Users/user-f501/Desktop/Tempwork/July 2010/01:07:10/MHBR169:Slavin:VYN/Users/user- f501/Desktop/Tempwork/July 2010/01:07:10/MHBR169:Slavin:VY 196 Part Three Cross-Border Trade and Investment the optical sensors from a plant in the Philippines. That leaves just $3 for the Chinese factory, which is used to cover wages, power, transport, and other overhead costs. Logitech is not alone in exploiting China to manufacture products. According to China’s Ministry of Commerce, foreign companies account for three-quarters of China’s high-tech exports. China’s top 10 exporters include American compa- nies with Chinese operations, such as Motorola and Seagate Technology, a maker of disk drives for computers. Intel now produces some 50 million chips a year in China, the majority of which end up in computers and other goods that are ex- ported to other parts of Asia, or back to the United States. Yet Intel’s plant in Shanghai doesn’t really make chips; it tests
- 241. and assembles chips from silicon wafers made in Intel plants abroad, mostly in the United States. China adds less than 5 percent of the value. The U.S. operations of Intel generate the bulk of the value and profits. Sources: V. K. Jolly and K. A. Bechler, “Logitech: The Mouse that Roared,” Planning Review 20, no. 6 (1992), pp. 20–34; K. Guerrino, “Lord of the Mice,” Chief Executive , July 2003, pp. 42–44; A. Higgins, “As China Surges, It Also Proves a Buttress to American Strength,” The Wall Street Journal , January 30, 2004, pp. A1, A8; J. Fox, “Where Is Your Job Going?” Fortune , November 24, 2003, pp. 84–88; and R. Wray, “Logitech Cuts 500 Jobs and Abandons Targets,” The Guardian , January 7, 2009, p. 28. Case Discussion Questions 1. In a world without trade, what would happen to the costs that American consumers would have to pay for Logitech’s products? 2. Explain how trade lowers the costs of making computer peripherals such as mice and keyboards. 3. Use the theory of comparative advantage to explain the way in which Logitech has configured its global operations. Why does the company manufacture in China and Taiwan, undertake basic R&D in California and Switzerland, design products in Ireland, and coordinate marketing and operations from California?
- 242. 4. Who creates more value for Logitech—the 650 people it employs in California and Switzerland, or the 4,000 employees at its Chinese factory? What are the implications of this observation for the argument that free trade is beneficial? 5. Why do you think the company decided to shift its corporate headquarters from Switzerland to Fremont? 6. To what extent can Porter’s diamond help explain the choice of Taiwan as a major manufacturing site for Logitech? 7. Why do you think China is now a favored location for so much high-technology manufacturing activity? How will China’s increasing involvement in global trade help that country? How will it help the world’s developed economies? What potential problems are associated with moving work to China? hiL37217_ch05_160-201.indd Page 196 15/07/10 3:42 AM user-f501hiL37217_ch05_160-201.indd Page 196 15/07/10 3:42 AM user-f501 /Users/user-f501/Desktop/Tempwork/July 2010/01:07:10/MHBR169:Slavin:VYN/Users/user- f501/Desktop/Tempwork/July 2010/01:07:10/MHBR169:Slavin:VY Aa p p e n d i x Chapter Five International Trade Theory 197 International trade involves the sale of goods and services to residents in other coun- tries (exports) and the purchase of goods and services from
- 243. residents in other countries (imports). A country’s balance-of-payments accounts keep track of the payments to and receipts from other countries for a particular time period. These include payments to foreigners for imports of goods and service, and receipts from foreigners for goods and services exported to them. A summary copy of the U.S. balance-of-payments accounts for 2008 is given in Table A.1. Any transaction resulting in a payment to other countries is entered in the balance-of-payments accounts as a debit and given a negative (2) sign. Any transaction resulting in a receipt from other countries is entered as a credit and given a positive (1) sign. In this appendix we briefly describe the form of the balance-of-payments accounts, and we discuss whether a current account defi- cit, often a cause of much concern in the popular press, is something to worry about. Balance of Payments Accounts Balance-of-payments accounts are divided into three main sections: the current account, the capital account, and the financial account (to confuse matters, what is now called the capital account was until recently part of the current account, and the financial account use to be called the capital account). The current account records transactions that pertain to three categories, all of which can be seen in Table A.1. The first category, goods , refers to the export or import of physical goods (e.g., agricultural foodstuffs, autos, com- puters, chemicals). The second category is the export or import
- 244. of services (e.g., intangi- ble products such as banking and insurance services). The third category, income receipts and payments , refers to income from foreign investments and payments that have to be made to foreigners investing in a country. For example, if a U.S. citizen owns a share of a Finnish company and receives a dividend payment of $5, that payment shows up on the U.S. current account as the receipt of $5 of investment income. Also included in the current account are unilateral current transfers, such as U.S. government grants to foreigners (including foreign aid), and private payments to foreigners (such as when a foreign worker in the United States sends money to his or her home country). International Trade and the Balance of Payments Balance-of- Payments Accounts National accounts that track both payments to and receipts from foreigners. Current Account In the balance of payments, records transactions involving the export or import of goods and services.
- 245. hiL37217_ch05_160-201.indd Page 197 15/07/10 3:42 AM user-f501hiL37217_ch05_160-201.indd Page 197 15/07/10 3:42 AM user-f501 /Users/user-f501/Desktop/Tempwork/July 2010/01:07:10/MHBR169:Slavin:VYN/Users/user- f501/Desktop/Tempwork/July 2010/01:07:10/MHBR169:Slavin:VY 198 Part Three Cross-Border Trade and Investment A current account deficit occurs when a country imports more goods, services, and income than it exports. A current account surplus occurs when a country exports more goods, services, and income than it imports. Table A.1 shows that in 2008 the United States ran a current account deficit of $706 billion. This is often a headline- grabbing figure and is widely reported in the news media. In recent years the U.S. current account deficit has been getting steadily larger, primarily because America imports far more physical goods than it exports (you will notice that America actually runs a surplus on trade in services and is close to balance on income payments). The 2006 current account deficit of $803 billion was the largest on record and was equivalent to about 6.5 percent of the country’s GDP. The deficit shrank a little in 2007 and 2008, and provisional estimates suggested it would fall to about $450 billion in 2009. Many people find these figures disturbing, the common assumption being that high imports of goods displaces domestic production,
- 246. causes unemployment, and reduces the growth of the U.S. economy. For example, The New York Times responded to the record current account deficit in 2006 by stating: A growing trade deficit acts as a drag on overall economic growth. Economists said that they expect that, in light of the new numbers, the government will have to revise its estimate of the nation’s fourth quarter gross domestic product to show slightly slower expansion. 37 CURRENT ACCOUNT $ Millions Exports of Goods, Services, and Income Receipts $ 2,591,233 Goods 1,276,994 Services 549,602 Income Receipts 764,637 Imports of Goods, Services, and Income Payments 23,168,938 Goods 22,117,245 Services 2405,287 Income Payments 2646,406 Unilateral current transfers (net) 2128,363 Current Account Balance 2706,068
- 247. CAPITAL ACCOUNT Capital Account Transactions (net) 953 FINANCIAL ACCOUNT U.S.-Owned Assets Abroad, net 2106 U.S. Official Reserve Assets 24,848 U.S. Government Assets 2529,615 U.S. Private Assets 534,357 Foreign-Owned Assets in the United States 534,071 Foreign Official Assets in the United States 487,021 Other Foreign Assets in the United States 47,050 Statistical Discrepancy 200,055 Current Account Deficit Occurs when a country imports more good, services, and income than it exports. Current Account Surplus Occurs when a country
- 248. exports more goods, services, and income than it imports. table A.1 U.S. Balance of Payments Accounts, 2008 ($ millions) Source: Bureau of Economic Analysis hiL37217_ch05_160-201.indd Page 198 15/07/10 3:42 AM user-f501hiL37217_ch05_160-201.indd Page 198 15/07/10 3:42 AM user-f501 /Users/user-f501/Desktop/Tempwork/July 2010/01:07:10/MHBR169:Slavin:VYN/Users/user- f501/Desktop/Tempwork/July 2010/01:07:10/MHBR169:Slavin:VY Chapter Five International Trade Theory 199 However, the issue is somewhat more complex than implied by statements like this. Fully understanding the implications of a large and persistent deficit requires that we look at the rest of the balance-of-payments accounts. The capital account records onetime changes in the stock of assets. As noted above, until recently this item was included in the current account. The capital ac-
- 249. count includes capital transfers, such as debt forgiveness and migrants’ transfers (the goods and financial assets that accompany migrants as they enter or leave the country). In the big scheme of things, this is a relatively small figure amounting to $953 million in 2008. The financial account (formally the capital account) records transactions that involve the purchase or sale of assets. Thus, when a German firm purchases stock in a U.S. company, or buys a U.S. bond, the transaction enters the U.S. balance of pay- ments as a credit on the capital account. This is because capital is flowing into the country. When capital flows out of the United States, it enters the capital account as a debit. The financial account is comprised of a number of elements. The net change in U.S.-owned assets abroad includes the change in assets owned by the U.S. government (U.S. official reserve assets and U.S. government assets) and the change in assets owned by private individuals and corporations. As can be seen from Table A.1, in 2008 there was a –$106 million reduction in U.S. assets owned abroad, primarily due to a $529 billion fall in the amount of foreign assets owned by the U.S. government. In other words, the government was selling foreign assets, such as foreign bonds and cur- rencies, during 2008. On the other hand, there was a $534 billion increase in the amount of foreign assets owned by private entities, indicating that U.S.-owned enter-
- 250. prises and private individuals were net buyers of foreign assets in 2008, including for- eign stocks, bonds, and real estate. Also included in the financial account are foreign-owned assets in the United States. These are divided into assets owned by foreign governments (foreign official assets) and assets owed by other foreign entities such as corporations and individuals (other foreign assets in the United States). As can be seen, in 2008 foreigners increased their holdings of U.S. assets, including treasury bills, corporate stocks and bonds, and direct investments in the United States, by $534 billion. Some $487 billion of this was due to an increase in the holding of U.S. assets by foreign governments, with the remainder being due to investments by private corporations and individuals in U.S. assets. It is important at this point to understand that a basic principle of balance-of- payments accounting is double-entry bookkeeping. Every international transaction automatically enters the balance of payments twice—once as a credit and once as a debit. Imagine that you purchase a car produced in Japan by Toyota for $20,000. Since your purchase represents a payment to another country for goods, it will enter the balance of payments as a debit on the current account. Toyota now has the $20,000 and must do something with it. If Toyota deposits the money at a U.S. bank, Toyota has pur- chased a U.S. asset—a bank deposit worth $20,000—and the transaction will show up as a $20,000 credit on the financial account. Or Toyota might
- 251. deposit the cash in a Japanese bank in return for Japanese yen. Now the Japanese bank must decide what to do with the $20,000. Any action that it takes will ultimately result in a credit for the U.S. balance of payments. For example, if the bank lends the $20,000 to a Japanese firm that uses it to import personal computers from the United States, then the $20,000 must be credited to the U.S. balance-of-payments current account. Or the Japanese bank might use the $20,000 to purchase U.S. government bonds, in which case it will show up as a credit on the U.S. balance-of-payments financial account. Thus, any international transaction automatically gives rise to two offsetting entries in the balance of payments. Because of this , the sum of the current account balance, the Capital Account Records onetime changes in the stock of assets. Financial Account Records transactions that involve the purchase or sale of assets. hiL37217_ch05_160-201.indd Page 199 15/07/10 3:42 AM user-f501hiL37217_ch05_160-201.indd Page 199 15/07/10 3:42 AM user-f501 /Users/user-f501/Desktop/Tempwork/July 2010/01:07:10/MHBR169:Slavin:VYN/Users/user- f501/Desktop/Tempwork/July 2010/01:07:10/MHBR169:Slavin:VY
- 252. 200 Part Three Cross-Border Trade and Investment capital account, and the financial account balance should always add up to zero . In practice, this does not always occur due to the existence of “statistical discrepancies,” the source of which need not concern us here (in 2008 the statistical discrepancy amounted to $200 billion). Does the Current Account Deficit Matter? As discussed above, there is some concern when a country is running a deficit on the current account of its balance of payments. 38 In recent years a number of rich countries, including most notably the United States, have run persistent and grow- ing current account deficits. When a country runs a current account deficit, the money that flows to other countries can then be used by those countries to pur- chase assets in the deficit country. Thus, when the United States runs a trade deficit with China, the Chinese use the money that they receive from U.S. consumers to purchase U.S. assets such as stocks, bonds, and the like. Put another way, a deficit on the current account is financed by selling assets to other countries; that is, by a surplus on the financial account. Thus, the persistent U.S. current account deficit is being financed by a steady sale of U.S. assets (stocks, bonds, real estate, and whole
- 253. corporations) to other countries. In short, countries that run current account defi- cits become net debtors. For example, as a result of financing its current account deficit through asset sales, the United States must deliver a stream of interest payments to foreign bondholders, rents to foreign landowners, and dividends to foreign stockholders. One might argue that such payments to foreigners drain resources from a country and limit the funds available for investment within the country. Since investment within a country is nec- essary to stimulate economic growth, a persistent current account deficit can choke off a country’s future economic growth. This is the basis of the argument that persistent deficits are bad for an economy. However, things are not this simple. For one thing, in an era of global capital mar- kets money is efficiently directed toward its highest value uses, and over the past quar- ter of a century many of the highest value uses of capital have been in the United States. So even though capital is flowing out of the United States in the form of pay- ments to foreigners, much of that capital finds its way right back into the country to fund productive investments in the United States. In short, it is not clear that the cur- rent account deficit chokes off U.S. economic growth. In fact, notwithstanding the 2008–2009 recession, the U.S. economy has grown at an impressive rate over the past 25 years, despite running a persistent current account deficit, and despite financing
- 254. that deficit by selling U.S. assets to foreigners. This is precisely because foreigners reinvest much of the income earned from U.S. assets, and from exports to the United States, right back into the United States. This revisionist view, which has gained in popularity in recent years, suggests that a persistent current account deficit might not be the drag on economic growth it was once thought to be. 39 Having said this, there is still a nagging fear that at some point the appetite that foreigners have for U.S. assets might decline. If foreigners suddenly reduce their in- vestments in the United States, what would happen? In short, instead of reinvesting the dollars that they earn from exports and investment in the United States back into the country, they would sell those dollars for another currency, European euros, Japanese yen, or Chinese yuan, for example, and invest in euro- , yen- and yuan- denominated assets instead. This would lead to a fall in the value of the dollar on for- eign exchange markets, and that in turn would increase the price of imports, and lower the price of U.S. exports making them more competitive, which should reduce the overall level of the current account deficit. Thus, in the long run the persistent U.S. hiL37217_ch05_160-201.indd Page 200 15/07/10 3:42 AM user-f501hiL37217_ch05_160-201.indd Page 200 15/07/10 3:42 AM user-f501 /Users/user-f501/Desktop/Tempwork/July 2010/01:07:10/MHBR169:Slavin:VYN/Users/user- f501/Desktop/Tempwork/July 2010/01:07:10/MHBR169:Slavin:VY
- 255. Chapter Five International Trade Theory 201 current account deficit could be corrected via a reduction in the value of the U.S. dollar. The concern is that such adjustments may not be smooth. Rather than a controlled decline in the value of the dollar, the dollar might suddenly lose a significant amount of its value in a very short time, precipitating a “dollar crisis.” 40 Since the U.S. dollar is the world’s major reserve currency, and is held by many foreign governments and banks, any dollar crisis could deliver a body blow to the world economy and at the very least trigger a global economic slowdown. That would not be a good thing. balance-of-payments accounts, p. 197 current account, p. 197 current account deficit, p. 198 current account surplus, p. 198 capital account, p. 199 financial account, p. 199 Key Terms hiL37217_ch05_160-201.indd Page 201 15/07/10 3:42 AM user-f501hiL37217_ch05_160-201.indd Page 201 15/07/10 3:42 AM user-f501 /Users/user-f501/Desktop/Tempwork/July 2010/01:07:10/MHBR169:Slavin:VYN/Users/user- f501/Desktop/Tempwork/July
- 256. 2010/01:07:10/MHBR169:Slavin:VY Assignment 2 Assignment 2 is due after you complete Lessons 5 to 8. It is worth 20% of your final grade. Prepare your responses to these assignment problems in a word processing file; put financial data in a spreadsheet file. As you complete the assignment problems for each lesson, add your responses to these files. Do not submit your answers for grading until you have completed all parts of Assignment 2. Note: In assignments, show all calculations to 4 decimal places. Lesson 5: Assignment Problems 5.1 Assume you have $1 million now, and you have just retired from your job. You expect to live for 20 years, and you want to have the same level of consumption (i.e., purchasing power) for each of these 20 years, after adjusting for inflation. You also wish to leave the purchasing power equivalent of $100,000 today to your kids at the end of the 20 years as a bequest (or to pay them to take care of you). You expect inflation to be 3% per year for the next 20 years, and nominal interest rates are expected to stay around 8% per year. A. Calculate the actual amount of consumption, in nominal dollars, using the stated assumptions. i.
- 257. How much do you need for your kids? ii. If you plan to consume $1.03 in year 1, how much will you need to have to keep the same real consumption in year 2? In year 10? In year 20? iii. How much, in nominal dollars, will $1 of retirement funds earn in year 1? Year 2? Year 10? Year 20? iv. In an Excel spreadsheet (or in a manual table), calculate the following: a. annual investment earnings for each year b. total savings after investment earnings for each year c. subtract annual consumption from total savings each year d.
- 258. by trial and error, or with the Goal Seek command, determine the amount of consumption that will give you exactly $100,000, in today's purchasing power, at the end of 20 years Hint: You will need to make your annual consumption column dependent on the inflation rate, your investment earnings will grow at the nominal rate, and the bequest of $100,000 will grow at the inflation rate. B. Do the calculation again using real rates, and setting inflation to equal 0. If you set up your Excel spreadsheet carefully, you should be able to set the inflation rate to equal 0 and enter the real rate of return as the investment earning rate. Feel free to use the spreadsheet below to help you answer this question. 5.1template.xls i. What is the amount of real consumption in year 1? In year 2? In year 10? In year 20? ii. Show that this is consistent with your calculation using nominal rates. iii. How much, in real dollars, does that leave for your kids? iv. Show that your bequest is consistent with the nominal rate
- 259. results above. (30 marks) 5.2 A. Linus is 18 years old now, and is thinking about taking a 5-year university degree. The degree will cost him $25,000 each year. After he's finished, he expects to make $50,000 per year for 10 years, $75,000 per year for another 10 years, and $100,000 per year for the final 10 years of his working career. If Linus lives to be 100, and if real interest rates stay at 5% per year throughout his life, what is the equal annual consumption he could enjoy until that date? B. Linus is also considering another option. If he takes a job at the local grocery store, his starting wage will be $40,000 per year, and he will get a 3% raise, in real terms, each year until he retires at the age of 53. If Linus lives to be 100, what is the equal annual consumption he could enjoy until that date? C. From strictly a financial point of view, is Linus better off choosing option A or B? (10 marks) 5.3 Are you better off playing the lottery or saving the money? Assume you can buy one ticket for $5, draws are made monthly, and a winning ticket correctly matches 6 different numbers of a total of 49 possible numbers. The probabilities: In order to win, you must pick all the numbers correctly. Your number has a 1 in 49 chance of being correct. Your second number, a 1 in 48 chance, and so on. There are exactly 49 x 48 x 47 x 46 x 45 x 44 = 10,068,347,520 ways to pick 6 numbers from 49 options.
- 260. But the order in which you pick them does not matter, so you actually have a few more ways to win. You can pick 6 different numbers in exactly 6 x 5 x 4 x 3 x 2 x 1 = 720 orders of choice. Any one of those orders would still win the lottery. Putting this all together, your ticket has 720/10,068,347,520 = 1/13,983,816 chance of winning. This equates to a .000000071 percentage chance. If you played one ticket every month from age 18 to age 65, you would have 47 x 12 = 564 plays. Your odds of not ever winning would be calculated using a binomial distribution to be .9999599568, meaning your chances of winning would be 1 – .9999599568 = .0000400432. So, if the lottery winnings averaged $10 million over this time period, your expected return would be less than .0000400432 x $10 million = $400.43. (It's less than $400.43 because your 564 plays are spread out over the next 47 years, so the present value of these future plays would be significantly less than if you were able to play all 564 immediately. The $400.43 assumes you play all 564 plays today, which makes it the highest possible expected value.) REQUIRED: A. What would your $400.43 be worth if you invested it at 1% real interest for 47 years? B. If, instead, you wrote down your 6 numbers on a piece of paper, and deposited your $5 in a bank at 1% real interest, how much would you have at the end of the first year?
- 261. C. If you did this every year for 47 years, how much would you have at age 65? D. If you earned 5% real interest on your deposits, how much would you have at age 65? E. Which option would make you better off at age 65? How many times better off? (10 marks) 5.4 Use the Excel spreadsheet named “LeasevsBuyCCA.xls” to answer the following question. You may choose to answer the question without using the spreadsheet, but be very careful to show all work, so your marker can follow your calculation and award part marks as necessary. You want to buy a new car, but you're not sure whether you should lease it or buy it. You can buy it for $50,000, and you expect that it will be worth $20,000 after you use it for 3 years. Alternatively, you could lease it for payments of $650 per month for the 3-year term, with the first payment due immediately. The lease company did not tell you what interest rate they're using to calculate the monthly payments, but you know you could borrow money from your banker at an annual percentage rate (APR) of 8%. A. Calculate the present value of the lease payments, assuming monthly compounding at the given APR of 8%. B. Calculate the present value of the $20,000 salvage value, again
- 262. using monthly compounding and the given APR of 8%. Which option do you prefer, lease or buy? C. Calculate the amount of the salvage value which would make you indifferent between leasing and buying. D. If you were able to use this car 100% for business, rendering the lease payments tax-deductible, or alternatively, allowing you to deduct depreciation using straight-line depreciation (depreciated to expected salvage value) and assuming your tax rate is 40%, would you prefer to buy or lease the car? (10 marks) Do not submit these questions for grading until you have completed all parts of Assignment 2, which is due after Lesson 8. Lesson 6: Assignment Problems You may find it helpful to use the Excel file named "Chapter 6 template.xls" to answer the following questions. You may choose to answer the questions without using the spreadsheet, but be very careful to show all work, so your marker can follow your calculation and award part marks as necessary. In order to ensure that you know how the spreadsheet works, it is recommended that you replicate table 6.5 from page 182 of your textbook before proceeding to answer the following questions. (Note that a completed spreadsheet for Table 6.5 is included with the Excel file as a separate worksheet, so you can check your work.) 6.1
- 263. You and your friends are thinking about starting a motorcycle company named Apple Valley Choppers. Your initial investment would be $500,000 for depreciable equipment, which should last 5 years, and your tax rate would be 40%. You could sell a chopper for $10,000, assuming your average variable cost per chopper is $3000, and assuming fixed costs, such as rent, utilities and salaries, would be $200,000 per year. A. Accounting breakeven: How many choppers would you have to sell to break even, ignoring the costs of financing? B. Financial breakeven: How many choppers would you have to sell to break even, if you required a 15% return? (Hint: Use the 15% as the discount rate and calculate net present value. In Excel, you may want to use the Goal Seek command, or simply use trial and error to find the correct amount.) C. Assuming you could sell 60 choppers per year, what would be your IRR? D. Assuming you could sell 60 choppers per year, what would your selling price have to be to generate a net present value of $150,000 at a 15% discount rate? E. If you could sell 60 choppers in the first year, and your sales volume increased by 5% each year until the end of year 5, what would the net present value be at a 15% discount rate? F. If you need to invest working capital equal to 10% of the next (coming) year‘s sales revenue, what would be the effect on the
- 264. net present value of the project? Do you think that working capital investments always reduce the net present value of projects? (Assume a 15% discount rate, and sales volume increases by 5% each year.) (20 marks) 6.2 Fill in the missing items in the following table. Assume that the real interest rate is 3% per year, and inflation is expected to be constant at 2% per year. Year Nominal cash flow Real cash flow 0 –100,000 –100,000 1 + 12,000 ? 2 +22,000 ? 3 +15,000 ? 4 +10,000 ? Net present value ? ? (10 marks) Do not submit these questions for grading until you have completed all parts of Assignment 2, which is due after Lesson 8.
- 265. Lesson 7: Assignment Problems 7.1 Find a Web site that shows exchange rates for all major international currencies. At the time of writing, XE.com and oanda.com are examples of such sites. A. is the British Pound shown? If not, why not? (You might have to do some investigation online if you're not familiar with the history of European currency.) B. What is the exchange rate between the Canadian dollar and the US dollar? C. XE.com also allows you to see exchange rates for gold ounces (under "more currencies available"). What does XE.com (or a similar site) say 1 ounce of gold is worth in Canadian dollars? In US dollars? What does this imply is the exchange rate between Canadian dollars in US dollars? Is this the same as your answer to part B.? D. If you saw that the US dollar price of gold was one dollar less than the price shown, how could you use that information to make an arbitrage profit? (10 marks) 7.2 A. Fill in the following table using XE.com or a similar foreign- currency quote Web site. In each cell, record the number of units of the currency stated in the first cell of the column that would be required to buy one unit of currency as stated in the row heading.
- 266. For example, if you sold US$1, how many European Euros could you buy? Enter that amount in the third column, second row. Continue until the table is filled completely. sell/buy US $1 European €1 Canadian $1 Japanese ¥1 US $1 1 European €1 1 Canadian $1 1 Japanese ¥1 1 B. Why are the numbers in the Japanese ¥ column so much higher than the numbers in the other rows?
- 267. (10 marks) Do not submit these questions for grading until you have completed all parts of Assignment 2, which is due after Lesson 8. Lesson 8: Assignment Problems 8.1 A. Look up the US Treasury yield curve online. i. What is the promised yield for a 1-month T-bill? ii. For a 6-month T-bill? iii. A 1-year T-bill? iv. A 5-year T-bond? v. A 10-year T-bond? iv. A 20-year T-bond?
- 268. iiv. A 30-year T-bond? iiiv. On what date did you look up these yields? ix. On what Web site did you find these yields? B. Is this yield curve flat, rising, or inverted? C. Many introductory finance textbooks say, at the beginning of bond valuation problems, "Assume the yield curve is flat." Another way of putting this is "Assume the term structure of interest rates is flat." How would this assumption make the questions easier for students of introductory finance to solve? (10 marks) 8.2 Fill in the missing items in the following table, using the Law of One Price. Assume all these bonds have the same risk and any coupon payments are paid annually. Bond # 1 2 3 4 1-year strip bond 2-year strip bond
- 269. 2-year 6% coupon bond 2-year 7% coupon bond Time 0 cash flow (i.e., Purchase Price for the bond) –950 ? ? ? Time 1 cash flow +1000 0 +60 +70 Time 2 cash flow 0 +1000 +1060 +1070 Yield ? ? 5.50% ? (10 marks) 8.3 A. You are considering two investments from the bonds listed in question 8.2. Show that the cash flows from the following two investments would be identical. i. 60 units of Bond #1 + 1060 units of Bond #2, and ii. 1000 units of Bond #3.
- 270. B. How many units of Bond #1 and #2 would you need to replicate the cash flows of 1000 units of Bond #4? C. i. If the yield of Bond #3 is 5.5%, what would it cost to buy 1000 units of Bond #3? ii. What would it cost to buy 60 units of Bond #1? iii. From part A. above, infer the value of 1060 units of Bond #2. iv. What is the value of one unit of Bond #2? Yield of Bond #2? D. What's the value of 1000 units of Bond #4? Yield? E. What have you learned about the Law of One Price from questions 8.2 and 8.3? (10 marks) 8.4 Assume the yield curve on "plain vanilla" default-free bonds is flat at 5%, and you are thinking of buying a default-free bond. Specifically, you're thinking of buying a bond issued by Risklessco, a company considered to be default-free by all major bond rating firms.
- 271. You will select one of the following three bonds, all identical except for the special features listed: Face Value Maturity Coupon Rate (Paid Annually) Yield to Maturity Special Features Price A 1000 20 years 5.5% 5% None ? B 1000 20 years 5.5% 5% Callable Par C 1000 20 years 5.5% 3.5% Callable and Convertible into Risklessco Stock ? A. Why is the yield on bonds A and B 5%? Why is the yield on
- 272. bond C different? B. What would be the price of Bond A? C. If bond C is considered identical to bond B except for the conversion privilege, what is the value of the conversion privilege? Does the conversion privilege benefit the issuer of the bond or the purchaser? Is this consistent with the price you calculated for bond C? D. Who does the callability provision benefit, the issuer or the purchaser? Is this consistent with the price you calculated for bond A? (10 marks) Assignment 1 Assignment 1 is due after you complete Lessons 1 to 4. It is worth 20% of your final grade. Prepare your responses to these assignment problems in a word processing file; put financial data in a spreadsheet file. As you complete the assignment problems for each lesson, add your responses to these files. Do not submit your answers for grading until you have completed all parts of Assignment 1. Note: In assignments, show all calculations to 4 decimal places. Lesson 1: Assignment Problems 1.1 Households make four kinds of economic decisions (textbook,
- 273. pp. 4–5). Suppose you have two households with the same income. Household A has one income earner and Household B has two income earners. How would the four types of economic decisions differ between these two otherwise identical households? (8 marks) 1.2 Three friends have just graduated, each with a B.Mgt. degree. One wants to start a restaurant and another wants to work as a subcontractor in a building trade. The third friend wants to put together a firm with a couple of other graduates to provide several kinds of complementary financial services including insurance, financial planning, and bookkeeping. What form of business organization (textbook, pp. 8–9) would you suggest each of the three friends should use, and why? (12 marks) Do not submit these questions for grading until you have completed all parts of Assignment 1, due after Lesson 4. Lesson 2: Assignment Problems 2.1 Adam Smith is often called the father of economics. His famous book, The Wealth of Nations,talks about an “invisible hand” which automatically allocates goods to the persons most able to put them to good use. The invisible hand operates through the price mechanism for goods and services, so that individuals who trade on the market, while seeking only their own good, are actually efficiently allocating society’s resources. His ideas, if applied to modern capital markets, imply that these markets would efficiently allocate investment capital to the firms that would use the capital most efficiently in producing goods and services for society. But this would happen only if
- 274. markets were left to operate without state intervention. Do you think modern governments should leave capital markets unregulated? Why or why not? (6 marks) 2.2 Consider a business firm, organized as a proprietorship, which has $100,000 invested in assets—a bank loan of $80,000 and $20,000 personal capital invested by the proprietor. If the firm becomes insolvent, who is at risk? Why? (6 marks) 2.3 In each of the following situations, moral hazard or adverse selection may be present. Indicate which you think is present, if any, and explain your choice. (10 marks) a. An insurance company is thinking about issuing health insurance to a firm’s employees. b. An insurance company has issued health insurance to a firm’s employees on the basis of their medical histories. c. An investor is asking for a bank loan to support a new business she wants to operate. She is unwilling to submit to a credit check. d. An investor has purchased shares in a new software company. He is just a shareholder, and is not going to be involved in the daily operations of the firm. e.
- 275. A grandfather has just given his grandson $100 as a birthday present. 2.4 In each of the situations considered in question 2.3, what could be done to overcome the problem? (10 marks) Do not submit these questions for grading until you have completed all parts of Assignment 1, due after Lesson 4. Lesson 3: Assignment Problems 3.1 Use the information in the table below to calculate the following ratios. Use the results to discuss and compare the financial positions of the two firms. (14 marks) Ratios: Total Shareholder Return Return on Sales Return on Assets Return on Equity Asset Turnover Times Interest Earned Debt Ratio (You’ll need to calculate the average debt during the year.) Spaling Preston EBIT (Earnings before Interest and Taxes) 300,000 190,000 Interest Expense 10,000 15,000 Net income
- 276. 200,000 100,000 Dividend payout ratio 35% 40% Retention ratio 65% 60% Sales 3,000,000 2,000,000 Average assets during the year 2,500,000 1,500,000 Average shareholders’ equity during the year 1,800,000 1,000,000 Market price per share Beginning of year 20 18 End of year 15 20 Number of shares outstanding 150,000 50,000 3.2 Assume you have put $1,000 in a savings account at 10% annually compounded interest.
- 277. a. How much could you take out each year and still have the original $1,000 in the account? b. If you left half of the interest earnings in the account, at what rate would the balance grow from year to year? c. If you took out 80% of the interest earnings in the account, at what rate would the balance grow each year? (6 marks) 3.3 Imagine a corporation with $1,000,000 of assets and a debt ratio of 40%. ROE (return on equity) is expected to be 20% for the foreseeable future. Assume the firm keeps the same amount of debt indefinitely (as opposed to keeping the same debt ratio). a. What do you expect the firm’s earnings to be for the next 3 years if the firm doesn’t pay out any dividends or re-purchase any shares? b. If the firm doesn’t pay any dividends or re-purchase any shares, at what rate would the firm grow from year to year? c. If the firm pays 50% of its earnings as dividends, at what rate would the firm grow from year to year? d. If the firm uses 80% of its earnings to re-purchase shares from its shareholders, at what rate would the firm grow from year to year?
- 278. e. If the firm pays 50% of its earnings as dividends, and uses an additional 20% of its earnings to re-purchase shares from its shareholders, at what rate would the firm grow from year to year? f. What does the term “Sustainable Growth Rate” mean? Would the amounts you have calculated in parts b. to d. equal the Sustainable Growth Rate for the firm? (12 marks) Do not submit these questions for grading until you have completed all parts of Assignment 1, due after Lesson 4. Lesson 4: Assignment Problems 4.1 Assume that the correct discount rate for the following cash flows is 8%. What is the present value of the following cash flows? a. $50 at the end of 3 years b. $50 at the end of 100 years c. $50 received at the end of each year for 20 years d. $50 received at the beginning of each year, totaling 20 payments. (8 marks)
- 279. 4.2 Assuming an 8% discount rate, what is the future value of the following cash flows? a. future value in 3 years of $50 received now b. future value in 100 years of $50 received now c. future value at the end of 20 years of $50 received each year at the end of the year d. future value at the end of 20 years of $50 received each year at the beginning of the year, again totaling 20 payments. (8 marks) 4.3 Calculate the following values, assuming a discount rate of 8%: a. present value of a perpetuity (also called a perpetual annuity) of $50 received each year at the end of each year b. present value of an annuity of $50 received at the end of each year for 5 years c. present value of an annuity of $50 received at the end of each year for 10 years, with the first payment to be received at the end of the 6th year d. present value of a perpetuity of $50, with the first payment
- 280. received at the end of the 16th year. (8 marks) 4.4 a. Show (with a time line, for example) that the perpetuity in 4.3a. is exactly the same as the sum of the annuities and perpetuities in 4.3b. to 4.3d. b. Show that their present values add up to the same amount. (6 marks) 4.5 a. Jane is 20 years old today. Jane is going to put $1,000 into her savings account on her 21st birthday and again on every birthday for 20 payments (i.e., till her 40th birthday). She will earn 5%, paid annually. How much money will be in the account after she collects her interest and makes her 20th payment? b. Calculate how much money she could take out each year for the 20 years from her 41stbirthday till her 60th birthday, assuming she still earns 5% and takes out the same amount each year, leaving exactly $0 in the account after removing her 20th payment. (6 marks)