SlideShare a Scribd company logo
Python for Data Analysis
CHINA UNIVERSITY OF PETROLEUM, BEIJING
Zhu, Dandan
College of Information Science and Engineering /
College of Artificial Intelligence
2024 Spring
Chapter 12 Introduction to Modeling
Libraries in Python
• Which library you use for developing models will depend on the
application.
Chapter 12 Introduction to Modeling
Libraries in Python
• Many statistical problems can be solved by simpler techniques like
ordinary least squares regression, while other problems may call for
more advanced machine learning methods.
• Fortunately, Python has become one of the languages of choice for
implementing analytical methods, so there are many tools you can
explore.
Chapter 12 Introduction to Modeling
Libraries in Python
• In this chapter, we will review some features of pandas that may be
helpful when you're crossing back and forth between data wrangling
with pandas and model fitting and scoring.
• I will then give short introductions to two popular modeling toolkits,
statsmodels and scikit-learn. Since each of these projects is large
enough to warrant its own dedicated book, I make no effort to be
comprehensive and instead direct you to both projects' online
documentation on data science, statistics, and machine learning.
12.1 Interfacing Between pandas and Model Code
12.2 Creating Model Descriptions with Patsy
12.3 Introduction to statsmodels
12.4 Introduction to scikit-learn
12.5 Conclusion
Table of contents
Chapter 12 Introduction to Modeling
Libraries in Python
12.1 Interfacing Between pandas and
Model Code
• A common workflow for model development is to use pandas for data loading
and cleaning before switching over to a modeling library to build the model
itself.
• An important part of the model development process is called feature
engineering in machine learning. This can describe any data transformation or
analytics that extract information from a raw dataset that may be useful in a
modeling context. The data aggregation and GroupBy tools we have explored in
this course are used often in a feature engineering context.
• I will show some methods to make switching between data manipulation with
pandas and modeling as painless as possible.
12.1 Interfacing Between pandas and
Model Code
• The point of contact between pandas and other analysis libraries is usually
NumPy arrays.
• To turn a DataFrame into a NumPy array, use the to_numpy method:
12.1 Interfacing Between pandas and
Model Code
• To convert back to a DataFrame, as you may recall from earlier chapters, you
can pass a two-dimensional ndarray with optional column names:
• The to_numpy method is intended to be used when your data is homogeneous—
for example, all numeric types.
12.1 Interfacing Between pandas and
Model Code
• If you have heterogeneous data, the result will be an ndarray of Python
objects:
12.1 Interfacing Between pandas and
Model Code
• For some models, you may wish to use only a subset of the columns. I
recommend using loc indexing with to_numpy:
12.1 Interfacing Between pandas and
Model Code
• Some libraries have native support for pandas and do some of this work for
you automatically: converting to NumPy from DataFrame and attaching model
parameter names to the columns of output tables or Series.
• In other cases, you will have to perform this "metadata management" manually.
12.1 Interfacing Between pandas and
Model Code
• In Ch 7.5: Categorical Data, we looked at pandas's Categorical type and the
pandas.get_dummies function.
• Suppose we had a nonnumeric column in our example dataset:
12.1 Interfacing Between pandas and
Model Code
• If we wanted to replace the 'category' column with dummy variables, we
create dummy variables, drop the 'category' column, and then join the result:
12.2 Creating Model Descriptions with
Patsy
• Patsy is a Python library for describing statistical models (especially linear
models) with a string-based "formula syntax," which is inspired by (but not
exactly the same as) the formula syntax used by the R and S statistical
programming languages. It is installed automatically when you install
statsmodels: conda install statsmodels
• Patsy is well supported for specifying linear models in statsmodels, so I will
focus on some of the main features to help you get up and running. Patsy's
formulas are a special string syntax that looks like:
y ~ x0 + x1
The syntax x0 + x1 does not mean to add x0 to x1, but rather
that these are terms in the design matrix created for the model.
12.2 Creating Model Descriptions with
Patsy
• The patsy.dmatrices function takes a formula string along with a dataset
(which can be a DataFrame or a dictionary of arrays) and produces design
matrices for a linear model:
You might wonder where the Intercept term came from.
This is a convention for linear models like ordinary least
squares (OLS) regression.
12.2 Creating Model Descriptions with
Patsy
• You can suppress the intercept by adding the term + 0 to the model:
12.2 Creating Model Descriptions with
Patsy
• The Patsy objects can be passed directly into algorithms like numpy.linalg.lstsq,
which performs an ordinary least squares regression:
• The model metadata is retained in the design_info attribute, so you can
reattach the model column names to the fitted coefficients to obtain a Series,
for example:
Cut-off ratio for small singular values
12.3 Introduction to statsmodels
• statsmodels is a Python library for fitting many kinds of statistical models, performing
statistical tests, and data exploration and visualization.
• statsmodels contains more "classical" frequentist statistical methods, while Bayesian
methods and machine learning models are found in other libraries.
• Some kinds of models found in statsmodels include:
ØLinear models, generalized linear models, and robust linear models
ØLinear mixed effects models
ØAnalysis of variance (ANOVA) methods
ØTime series processes and state space models
ØGeneralized method of moments
• We will use a few basic tools in statsmodels and explore how to use the modeling
interfaces with Patsy formulas and pandas DataFrame objects.
12.3 Introduction to statsmodels
Estimating Linear Models
• There are several kinds of linear regression models in statsmodels, from the
more basic (e.g., ordinary least squares) to more complex (e.g., iteratively
reweighted least squares).
• Linear models in statsmodels have two different main interfaces: array based
and formula based. These are accessed through these API module imports:
12.3 Introduction to statsmodels
Estimating Linear Models
• To show how to use these, we generate a linear model from some random data.
Run the following code in a Jupyter cell:
Concatenate along columns
Here, we wrote down the "true" model
with known parameters beta.
dnorm is a helper function for generating normally
distributed data with a particular mean and variance.
Random data generator
12.3 Introduction to statsmodels
Estimating Linear Models
• A linear model is generally fitted with an intercept term, as we saw before
with Patsy. The sm.add_constant function can add an intercept column to an
existing matrix:
12.3 Introduction to statsmodels
Estimating Linear Models
• The sm.OLS class can fit an ordinary least squares linear regression:
• The model's fit method returns a regression results object containing
estimated model parameters and other diagnostics:
12.3 Introduction to statsmodels
Estimating Linear Models
• The summary method on
results can print a model
detailing diagnostic output
of the model:
• The parameter names here
have been given the
generic names x1, x2, and
so on.
12.3 Introduction to statsmodels
Estimating Linear Models
• Suppose instead that all of the model parameters are in a DataFrame:
Return the t-statistic for a
given parameter estimate
12.3 Introduction to statsmodels
Estimating Linear Models
• Given new out-of-sample data, you can compute predicted values given the
estimated model parameters:
• There are many additional tools for analysis, diagnostics, and visualization of
linear model results in statsmodels that you can explore. There are also other
kinds of linear models beyond ordinary least squares.
12.3 Introduction to statsmodels
Estimating Time Series Processes
• Another class of models in statsmodels is for time series analysis. Among these are
autoregressive processes, Kalman filtering and other state space models, and
multivariate autoregressive models.
• Let's simulate some time series data with an autoregressive structure and noise. Run
the following in Jupyter:
12.3 Introduction to statsmodels
Estimating Time Series Processes
• This data has an AR(2) structure (two lags) with parameters 0.8 and –0.4. When you
fit an AR model, you may not know the number of lagged terms to include, so you can
fit the model with some larger number of lags:
• The estimated parameters in the results have the intercept first, and the estimates for
the first two lags next:
hyperparameter
12.4 Introduction to scikit-learn
Estimating Time Series Processes
• scikit-learn is one of the most widely used and trusted general-purpose Python
machine learning toolkits. It contains a broad selection of standard supervised and
unsupervised machine learning methods, with tools for model selection and evaluation,
data transformation, data loading, and model persistence. These models can be used for
classification, clustering, prediction, and other common tasks.
• You can install scikit-learn from conda like so:
• There are excellent online and print resources for learning about machine learning and
how to apply libraries like scikit-learn to solve real-world problems. In this section, I
will give a brief flavor of the scikit-learn API style.
conda install scikit-learn
12.4 Introduction to scikit-learn
Estimating Time Series Processes
• As an example for this
chapter, I use a now-classic
dataset from a Kaggle
competition about passenger
survival rates on the Titanic
in 1912. We load the training
and test datasets using
pandas:
12.4 Introduction to scikit-learn
Estimating Time Series Processes
• Libraries like statsmodels and scikit-learn generally cannot be fed missing data,
so we look at the columns to see if there are any that contain missing data:
12.4 Introduction to scikit-learn
Estimating Time Series Processes
• In statistics and machine learning examples like this one, a typical task is to
predict whether a passenger would survive based on features in the data.
• A model is fitted on a training dataset and then evaluated on an out-of-sample
testing dataset.
• I would like to use Age as a predictor, but it has missing data. There are a
number of ways to do missing data imputation, but I will do a simple one and
use the median of the training dataset to fill the nulls in both tables:
12.4 Introduction to scikit-learn
Estimating Time Series Processes
• Now we need to specify our models. I add a column IsFemale as an encoded
version of the 'Sex' column:
• Then we decide on some model variables and create NumPy arrays:
12.4 Introduction to scikit-learn
Estimating Time Series Processes
• I make no claims that this is a good model or that these features are
engineered properly. We use the LogisticRegression model from scikit-learn
and create a model instance:
• We can fit this model to the training data using the model's fit method:
12.4 Introduction to scikit-learn
Estimating Time Series Processes
• Now, we can form predictions for the test dataset using model.predict:
• If you had the true values for the test dataset, you could compute an
accuracy percentage or some other error metric:
12.4 Introduction to scikit-learn
Estimating Time Series Processes
• In practice, there are often many additional layers of complexity in model
training. Many models have parameters that can be tuned, and there are
techniques such as cross-validation that can be used for parameter tuning to
avoid overfitting to the training data. This can often yield better predictive
performance or robustness on new data.
• Cross-validation works by splitting the training data to simulate out-of-sample
prediction. Based on a model accuracy score like mean squared error, you can
perform a grid search on model parameters. Some models, like logistic
regression, have estimator classes with built-in cross-validation.
12.4 Introduction to scikit-learn
Estimating Time Series Processes
• For example, the LogisticRegressionCV class can be used with a parameter
indicating how fine-grained of a grid search to do on the model regularization
parameter C:
12.4 Introduction to scikit-learn
Estimating Time Series Processes
• To do cross-validation by hand, you can use the cross_val_score helper function, which
handles the data splitting process.
• For example, to cross-validate our model with four nonoverlapping splits of the training
data, we can do:
The default scoring metric
is model dependent, but it
is possible to choose an
explicit scoring function.
Cross-validated models
take longer to train but
can often yield better
model performance.
12.5 Conclusion
• While I have only skimmed the surface of some Python modeling libraries,
there are more and more frameworks for various kinds of statistics and
machine learning either implemented in Python or with a Python user
interface.
• It's a good idea to be familiar with the documentation for the various
statistics or machine learning frameworks to stay up to date on the latest
features and API.

More Related Content

PPT
DOCX
employee turnover prediction document.docx
PPTX
UNIT_5_Data Wrangling.pptx
PPTX
housing price prediction ppt in artificial
PPTX
CS301_Detailed_Overview_MATLAB_Mathematica_Python.pptx
PPTX
Meetup Junio Data Analysis with python 2018
PDF
Module 3 - Basics of Data Manipulation in Time Series
PPTX
this includes basics about python modules and packages introduction
employee turnover prediction document.docx
UNIT_5_Data Wrangling.pptx
housing price prediction ppt in artificial
CS301_Detailed_Overview_MATLAB_Mathematica_Python.pptx
Meetup Junio Data Analysis with python 2018
Module 3 - Basics of Data Manipulation in Time Series
this includes basics about python modules and packages introduction

Similar to 12 Introduction to Modeling Libraries in Python.pdf (20)

PPTX
Python short notes on modules and applications
DOCX
Self Study Business Approach to DS_01022022.docx
PPTX
Python for Machine Learning_ A Comprehensive Overview.pptx
PDF
Data Wrangling and Visualization Using Python
PDF
Crossing the Analytics Chasm and Getting the Models You Developed Deployed
PDF
Nose Dive into Apache Spark ML
PDF
Introduction to Machine Learning with SciKit-Learn
PPTX
Data Science With Python | Python For Data Science | Python Data Science Cour...
PPTX
The Impact of Cloud Computing on Predictive Analytics 7-29-09 v5
PDF
Proposal for google summe of code 2016
PPTX
Machine Learning - Simple Linear Regression
PDF
Microservices, containers, and machine learning
PPTX
python-pandas-For-Data-Analysis-Manipulate.pptx
PPTX
Basic of python for data analysis
PPTX
Python ml
PDF
Predictive Analytics Project in Automotive Industry
PPTX
8.unit-1-fds-2022-23.pptx
PPTX
MachineLearning Seminar PPT.pptx
PPTX
Machine Learning with ML.NET and Azure - Andy Cross
PDF
Forecasting Network Capacity for Global Enterprise Backbone Networks using Ma...
Python short notes on modules and applications
Self Study Business Approach to DS_01022022.docx
Python for Machine Learning_ A Comprehensive Overview.pptx
Data Wrangling and Visualization Using Python
Crossing the Analytics Chasm and Getting the Models You Developed Deployed
Nose Dive into Apache Spark ML
Introduction to Machine Learning with SciKit-Learn
Data Science With Python | Python For Data Science | Python Data Science Cour...
The Impact of Cloud Computing on Predictive Analytics 7-29-09 v5
Proposal for google summe of code 2016
Machine Learning - Simple Linear Regression
Microservices, containers, and machine learning
python-pandas-For-Data-Analysis-Manipulate.pptx
Basic of python for data analysis
Python ml
Predictive Analytics Project in Automotive Industry
8.unit-1-fds-2022-23.pptx
MachineLearning Seminar PPT.pptx
Machine Learning with ML.NET and Azure - Andy Cross
Forecasting Network Capacity for Global Enterprise Backbone Networks using Ma...
Ad

Recently uploaded (20)

PPTX
human mycosis Human fungal infections are called human mycosis..pptx
PDF
FourierSeries-QuestionsWithAnswers(Part-A).pdf
PDF
Classroom Observation Tools for Teachers
PPTX
Pharma ospi slides which help in ospi learning
PDF
Microbial disease of the cardiovascular and lymphatic systems
PDF
Module 4: Burden of Disease Tutorial Slides S2 2025
PPTX
Cell Structure & Organelles in detailed.
PDF
The Lost Whites of Pakistan by Jahanzaib Mughal.pdf
PDF
O5-L3 Freight Transport Ops (International) V1.pdf
PPTX
PPH.pptx obstetrics and gynecology in nursing
PPTX
GDM (1) (1).pptx small presentation for students
PDF
VCE English Exam - Section C Student Revision Booklet
PDF
TR - Agricultural Crops Production NC III.pdf
PPTX
Institutional Correction lecture only . . .
PDF
Abdominal Access Techniques with Prof. Dr. R K Mishra
PDF
Complications of Minimal Access Surgery at WLH
PPTX
IMMUNITY IMMUNITY refers to protection against infection, and the immune syst...
PPTX
PPT- ENG7_QUARTER1_LESSON1_WEEK1. IMAGERY -DESCRIPTIONS pptx.pptx
PDF
BÀI TẬP BỔ TRỢ 4 KỸ NĂNG TIẾNG ANH 9 GLOBAL SUCCESS - CẢ NĂM - BÁM SÁT FORM Đ...
PDF
Chapter 2 Heredity, Prenatal Development, and Birth.pdf
human mycosis Human fungal infections are called human mycosis..pptx
FourierSeries-QuestionsWithAnswers(Part-A).pdf
Classroom Observation Tools for Teachers
Pharma ospi slides which help in ospi learning
Microbial disease of the cardiovascular and lymphatic systems
Module 4: Burden of Disease Tutorial Slides S2 2025
Cell Structure & Organelles in detailed.
The Lost Whites of Pakistan by Jahanzaib Mughal.pdf
O5-L3 Freight Transport Ops (International) V1.pdf
PPH.pptx obstetrics and gynecology in nursing
GDM (1) (1).pptx small presentation for students
VCE English Exam - Section C Student Revision Booklet
TR - Agricultural Crops Production NC III.pdf
Institutional Correction lecture only . . .
Abdominal Access Techniques with Prof. Dr. R K Mishra
Complications of Minimal Access Surgery at WLH
IMMUNITY IMMUNITY refers to protection against infection, and the immune syst...
PPT- ENG7_QUARTER1_LESSON1_WEEK1. IMAGERY -DESCRIPTIONS pptx.pptx
BÀI TẬP BỔ TRỢ 4 KỸ NĂNG TIẾNG ANH 9 GLOBAL SUCCESS - CẢ NĂM - BÁM SÁT FORM Đ...
Chapter 2 Heredity, Prenatal Development, and Birth.pdf
Ad

12 Introduction to Modeling Libraries in Python.pdf

  • 1. Python for Data Analysis CHINA UNIVERSITY OF PETROLEUM, BEIJING Zhu, Dandan College of Information Science and Engineering / College of Artificial Intelligence 2024 Spring
  • 2. Chapter 12 Introduction to Modeling Libraries in Python • Which library you use for developing models will depend on the application.
  • 3. Chapter 12 Introduction to Modeling Libraries in Python • Many statistical problems can be solved by simpler techniques like ordinary least squares regression, while other problems may call for more advanced machine learning methods. • Fortunately, Python has become one of the languages of choice for implementing analytical methods, so there are many tools you can explore.
  • 4. Chapter 12 Introduction to Modeling Libraries in Python • In this chapter, we will review some features of pandas that may be helpful when you're crossing back and forth between data wrangling with pandas and model fitting and scoring. • I will then give short introductions to two popular modeling toolkits, statsmodels and scikit-learn. Since each of these projects is large enough to warrant its own dedicated book, I make no effort to be comprehensive and instead direct you to both projects' online documentation on data science, statistics, and machine learning.
  • 5. 12.1 Interfacing Between pandas and Model Code 12.2 Creating Model Descriptions with Patsy 12.3 Introduction to statsmodels 12.4 Introduction to scikit-learn 12.5 Conclusion Table of contents Chapter 12 Introduction to Modeling Libraries in Python
  • 6. 12.1 Interfacing Between pandas and Model Code • A common workflow for model development is to use pandas for data loading and cleaning before switching over to a modeling library to build the model itself. • An important part of the model development process is called feature engineering in machine learning. This can describe any data transformation or analytics that extract information from a raw dataset that may be useful in a modeling context. The data aggregation and GroupBy tools we have explored in this course are used often in a feature engineering context. • I will show some methods to make switching between data manipulation with pandas and modeling as painless as possible.
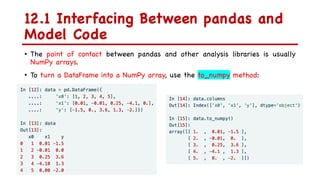
  • 7. 12.1 Interfacing Between pandas and Model Code • The point of contact between pandas and other analysis libraries is usually NumPy arrays. • To turn a DataFrame into a NumPy array, use the to_numpy method:
  • 8. 12.1 Interfacing Between pandas and Model Code • To convert back to a DataFrame, as you may recall from earlier chapters, you can pass a two-dimensional ndarray with optional column names: • The to_numpy method is intended to be used when your data is homogeneous— for example, all numeric types.
  • 9. 12.1 Interfacing Between pandas and Model Code • If you have heterogeneous data, the result will be an ndarray of Python objects:
  • 10. 12.1 Interfacing Between pandas and Model Code • For some models, you may wish to use only a subset of the columns. I recommend using loc indexing with to_numpy:
  • 11. 12.1 Interfacing Between pandas and Model Code • Some libraries have native support for pandas and do some of this work for you automatically: converting to NumPy from DataFrame and attaching model parameter names to the columns of output tables or Series. • In other cases, you will have to perform this "metadata management" manually.
  • 12. 12.1 Interfacing Between pandas and Model Code • In Ch 7.5: Categorical Data, we looked at pandas's Categorical type and the pandas.get_dummies function. • Suppose we had a nonnumeric column in our example dataset:
  • 13. 12.1 Interfacing Between pandas and Model Code • If we wanted to replace the 'category' column with dummy variables, we create dummy variables, drop the 'category' column, and then join the result:
  • 14. 12.2 Creating Model Descriptions with Patsy • Patsy is a Python library for describing statistical models (especially linear models) with a string-based "formula syntax," which is inspired by (but not exactly the same as) the formula syntax used by the R and S statistical programming languages. It is installed automatically when you install statsmodels: conda install statsmodels • Patsy is well supported for specifying linear models in statsmodels, so I will focus on some of the main features to help you get up and running. Patsy's formulas are a special string syntax that looks like: y ~ x0 + x1 The syntax x0 + x1 does not mean to add x0 to x1, but rather that these are terms in the design matrix created for the model.
  • 15. 12.2 Creating Model Descriptions with Patsy • The patsy.dmatrices function takes a formula string along with a dataset (which can be a DataFrame or a dictionary of arrays) and produces design matrices for a linear model: You might wonder where the Intercept term came from. This is a convention for linear models like ordinary least squares (OLS) regression.
  • 16. 12.2 Creating Model Descriptions with Patsy • You can suppress the intercept by adding the term + 0 to the model:
  • 17. 12.2 Creating Model Descriptions with Patsy • The Patsy objects can be passed directly into algorithms like numpy.linalg.lstsq, which performs an ordinary least squares regression: • The model metadata is retained in the design_info attribute, so you can reattach the model column names to the fitted coefficients to obtain a Series, for example: Cut-off ratio for small singular values
  • 18. 12.3 Introduction to statsmodels • statsmodels is a Python library for fitting many kinds of statistical models, performing statistical tests, and data exploration and visualization. • statsmodels contains more "classical" frequentist statistical methods, while Bayesian methods and machine learning models are found in other libraries. • Some kinds of models found in statsmodels include: ØLinear models, generalized linear models, and robust linear models ØLinear mixed effects models ØAnalysis of variance (ANOVA) methods ØTime series processes and state space models ØGeneralized method of moments • We will use a few basic tools in statsmodels and explore how to use the modeling interfaces with Patsy formulas and pandas DataFrame objects.
  • 19. 12.3 Introduction to statsmodels Estimating Linear Models • There are several kinds of linear regression models in statsmodels, from the more basic (e.g., ordinary least squares) to more complex (e.g., iteratively reweighted least squares). • Linear models in statsmodels have two different main interfaces: array based and formula based. These are accessed through these API module imports:
  • 20. 12.3 Introduction to statsmodels Estimating Linear Models • To show how to use these, we generate a linear model from some random data. Run the following code in a Jupyter cell: Concatenate along columns Here, we wrote down the "true" model with known parameters beta. dnorm is a helper function for generating normally distributed data with a particular mean and variance. Random data generator
  • 21. 12.3 Introduction to statsmodels Estimating Linear Models • A linear model is generally fitted with an intercept term, as we saw before with Patsy. The sm.add_constant function can add an intercept column to an existing matrix:
  • 22. 12.3 Introduction to statsmodels Estimating Linear Models • The sm.OLS class can fit an ordinary least squares linear regression: • The model's fit method returns a regression results object containing estimated model parameters and other diagnostics:
  • 23. 12.3 Introduction to statsmodels Estimating Linear Models • The summary method on results can print a model detailing diagnostic output of the model: • The parameter names here have been given the generic names x1, x2, and so on.
  • 24. 12.3 Introduction to statsmodels Estimating Linear Models • Suppose instead that all of the model parameters are in a DataFrame: Return the t-statistic for a given parameter estimate
  • 25. 12.3 Introduction to statsmodels Estimating Linear Models • Given new out-of-sample data, you can compute predicted values given the estimated model parameters: • There are many additional tools for analysis, diagnostics, and visualization of linear model results in statsmodels that you can explore. There are also other kinds of linear models beyond ordinary least squares.
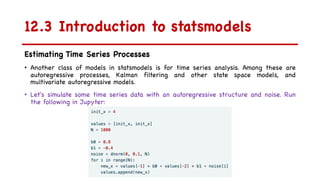
  • 26. 12.3 Introduction to statsmodels Estimating Time Series Processes • Another class of models in statsmodels is for time series analysis. Among these are autoregressive processes, Kalman filtering and other state space models, and multivariate autoregressive models. • Let's simulate some time series data with an autoregressive structure and noise. Run the following in Jupyter:
  • 27. 12.3 Introduction to statsmodels Estimating Time Series Processes • This data has an AR(2) structure (two lags) with parameters 0.8 and –0.4. When you fit an AR model, you may not know the number of lagged terms to include, so you can fit the model with some larger number of lags: • The estimated parameters in the results have the intercept first, and the estimates for the first two lags next: hyperparameter
  • 28. 12.4 Introduction to scikit-learn Estimating Time Series Processes • scikit-learn is one of the most widely used and trusted general-purpose Python machine learning toolkits. It contains a broad selection of standard supervised and unsupervised machine learning methods, with tools for model selection and evaluation, data transformation, data loading, and model persistence. These models can be used for classification, clustering, prediction, and other common tasks. • You can install scikit-learn from conda like so: • There are excellent online and print resources for learning about machine learning and how to apply libraries like scikit-learn to solve real-world problems. In this section, I will give a brief flavor of the scikit-learn API style. conda install scikit-learn
  • 29. 12.4 Introduction to scikit-learn Estimating Time Series Processes • As an example for this chapter, I use a now-classic dataset from a Kaggle competition about passenger survival rates on the Titanic in 1912. We load the training and test datasets using pandas:
  • 30. 12.4 Introduction to scikit-learn Estimating Time Series Processes • Libraries like statsmodels and scikit-learn generally cannot be fed missing data, so we look at the columns to see if there are any that contain missing data:
  • 31. 12.4 Introduction to scikit-learn Estimating Time Series Processes • In statistics and machine learning examples like this one, a typical task is to predict whether a passenger would survive based on features in the data. • A model is fitted on a training dataset and then evaluated on an out-of-sample testing dataset. • I would like to use Age as a predictor, but it has missing data. There are a number of ways to do missing data imputation, but I will do a simple one and use the median of the training dataset to fill the nulls in both tables:
  • 32. 12.4 Introduction to scikit-learn Estimating Time Series Processes • Now we need to specify our models. I add a column IsFemale as an encoded version of the 'Sex' column: • Then we decide on some model variables and create NumPy arrays:
  • 33. 12.4 Introduction to scikit-learn Estimating Time Series Processes • I make no claims that this is a good model or that these features are engineered properly. We use the LogisticRegression model from scikit-learn and create a model instance: • We can fit this model to the training data using the model's fit method:
  • 34. 12.4 Introduction to scikit-learn Estimating Time Series Processes • Now, we can form predictions for the test dataset using model.predict: • If you had the true values for the test dataset, you could compute an accuracy percentage or some other error metric:
  • 35. 12.4 Introduction to scikit-learn Estimating Time Series Processes • In practice, there are often many additional layers of complexity in model training. Many models have parameters that can be tuned, and there are techniques such as cross-validation that can be used for parameter tuning to avoid overfitting to the training data. This can often yield better predictive performance or robustness on new data. • Cross-validation works by splitting the training data to simulate out-of-sample prediction. Based on a model accuracy score like mean squared error, you can perform a grid search on model parameters. Some models, like logistic regression, have estimator classes with built-in cross-validation.
  • 36. 12.4 Introduction to scikit-learn Estimating Time Series Processes • For example, the LogisticRegressionCV class can be used with a parameter indicating how fine-grained of a grid search to do on the model regularization parameter C:
  • 37. 12.4 Introduction to scikit-learn Estimating Time Series Processes • To do cross-validation by hand, you can use the cross_val_score helper function, which handles the data splitting process. • For example, to cross-validate our model with four nonoverlapping splits of the training data, we can do: The default scoring metric is model dependent, but it is possible to choose an explicit scoring function. Cross-validated models take longer to train but can often yield better model performance.
  • 38. 12.5 Conclusion • While I have only skimmed the surface of some Python modeling libraries, there are more and more frameworks for various kinds of statistics and machine learning either implemented in Python or with a Python user interface. • It's a good idea to be familiar with the documentation for the various statistics or machine learning frameworks to stay up to date on the latest features and API.