


13711404.ppt
- 1. Quality Performance Indicators and their values in Patient Safety Dr. Rana Nabulsi .PhD, MSc ,CPHQ , CSSGB, EFQM Head of Quality – Pathology & Genetics Department Dubai Health Authority – Dubai-UAE
- 2. Objectives Define the Quality Performance Indicators. List the most common Quality Performance Indicators used in the clinical laboratory. Discuss how Quality Performance Indicators are related to patient safety. Illustrate why we need Quality Performance Indicators & Benchmarking in our laboratories. Discuss the criteria for selecting the best Quality Performance Indicators.
- 3. What are Quality Performance Indicators? A set of measureable indicators that a Laboratory uses to monitor the performance of operations in terms of meeting the strategic goals of Healthcare System.
- 4. Objectives and Goals of Medical Laboratories Patient Safety Accuracy and Reliability of results Stakeholders Satisfaction Operational Excellence. Growth and professional development. Financial results
- 5. Business Objectives Key Success Factors (KSFs) Quality Performance Indicators Tracked by. Determine. Quality Performance Indicators and Laboratory Objectives
- 7. Remember “Not everything that counts can be measured; not everything that can be measured counts”. Albert Einstein
- 8. Reliable Quality Performance Indicators Play a key role in improving the quality of laboratory services and patient safety.
- 9. Total Testing Process (TTP) Safety Customer Service Data Management
- 10. KPIs and Total Testing Process (TTP) Pre Examination Examination Post Examination
- 11. Quality Metric Quality Performance Indicators for Laboratories Pre- Analyti c Analyti c Post Analytic Anatomic Patholog y Clinical Patholog y Chemistry Hematolog y Micro biolog y Trans fusion Patien t Safety Patient satisfaction, specimen collection ● ● ● ● Patient ID, wristband accuracy ● ● ● ● ● ● ● Test Order entry accuracy ● ● ● ● ● ● Proficiency testing performance ● ● ● ● ● ● Specimen Rejections ● ● ● Specimen ID errors ● ● ● ● ● ● ● ● Blood culture contamination ● ● ● LABMEDICINE Volume 39 Number 2 February 2008
- 12. Quality Metric Quality Performance Indicators for Laboratories Pre- Analytic Analytic Post Analy t Anatomic Patholog y Clinical Patholog y Chemistry Hematolog y Micro biolog y Trans fusion Patient Safety Blood product wastage ● ● ● Completene ss of cancer diagnosis ● ● STAT test turnaround time ● ● ● Corrected results ● ● ● ● ● ● Critical result reporting ● ● ● ● ● Gynecologic cytology- biopsy correlation ● ● Clinician satisfaction with lab services ● ● ● ● ● ● ● LABMEDICINE Volume 39 Number 2 February 2008
- 13. Why Laboratories need Quality and Safety Indicators?
- 14. Trigger is Institute of Medicine (IOM) Report,1999
- 15. Patient Safety Institute of Medicine (IOM)/NAM claimed that as many as 1 million patients per year suffer injuries due to medical errors. The Joint Commission (JC) issued International Patient Safety Guidelines (IPSG).
- 16. Definition :Patient Safety-IOM/NAM “Freedom from accidental injury due to medical care, or medical errors.”
- 17. Quality Performance Indicators As per Institute of Medicine /NAM, Quality Performance Indicators shall have the following dimensions : Patient safety Timeliness Effectiveness Equity Efficiency Patient-centered care
- 18. International Patient Safety Goals IPSG 1: Identify Patient correctly. IPSG 2: Improve Effective Communication. IPSG 3: Improve safety of high alert medication. IPSG 4: Ensure correct site, procedure and patient surgery. IPSG 5: Reduce the risk of Health Care-Associated Infections. IPSG 6 : Reduce patient falls.
- 19. Quality Performance Indicators and Patient Safety
- 20. Quality Performance Indicators Pre Examination Specimen ID &Labeling errors Blood culture Contamination Patient lD errors Accuracy of Test Order Entry Rejection of samples Incidents at Collection
- 22. Specimen ID errors Makary MK ET AL,SURGERY 2004.
- 23. Accuracy of Test Order entry Performance Indicators Rate (%) Accurate Test orders 94,972 99.97% Test(s) Missing 25 0.03 Wrong Test 7 0.01 Total of test order errors: 32 0.04%
- 24. Rejection of samples Biochemia Medica.Aysenur Atay et al. 2014
- 25. Blood Culture Contamination rate Journal of Emergency Nursing.Andrew D& Sausan Bollinger Jan 2013. .
- 26. Total Testing Process (TTP) Data Management Safety Customer Service
- 27. Quality Performance Indicators -Examination Transfusion errors Staff Competency EQAP Failure Correlation Cytology/Biopsy MRSA incident rate
- 28. Transfusion Errors Transfusion Error Surveillance system TESS Report,Lab safety. 2013
- 29. Rate of MRSA Incidence https://www.nuh.com.sg/about-us/clinical-outcomes/mrsa-in-nuh.html
- 30. Correlation Cytology /Histology Acta ortop.bras.vol.22no.3 Sao Paulo 2014.
- 32. % Proficiency Testing failure CDC-1996 Clinical laboratory performance on PT samples-USA. March 08,1996
- 33. Total Testing Process (TTP) •Safety •Customer Service •Data Lab Management
- 34. Quality Performance Indicator -Post Examination Critical Result Reporting STAT test Turn around time Revised/Corrected Reports
- 35. STAT Turn Around Time
- 36. STAT Turn Around Time (example Troponin) Chris Christopher, Lab Quality Confab,2010
- 37. % of Critical Results reported in 45 minutes
- 38. Proportion of Revised /Amended reports
- 39. Link Targets of Quality Indicators with Six Sigma Model
- 40. Quality Indicators and Six Sigma Quality Indicator Sample Size Variance Percent Variance (Variance/Samp le Size x 100) Parts per Million Six Sigma Quality 1,000,000 3.4 0.00034 3.4 Pre Analytic Missing information on requests Tissue samples 2,691 43 1.5979 15,979 Cytology, Papanicolaou smears 6,932 695 10.0259 100,259 Correction of errors on ordered tests 197,195 616 0.3123 3,123 Patients without identification bands 26,400 139 0.5265 5,265 Specimen redraws 26,400 503 1.9053 19,053 Collection of TDM peak/trough specimens at improper time 280 58 20.7140 107,140 Sample label errors 26,400 138 0.5227 5227 Number, source, and nature of unacceptable specimens 332,223 35 0.0105 105 Analytic Laboratory testing error 192,665 140 0.0726 726 Interpretation misjudgments in microbiology 34,734 256 0.7370 7370 Post Analytic Laboratory reporting errors 389,860 208 0.0533 533
- 41. Quality Indicators and Six Sigma Sigma Defects per Million Operations (DPMO) Percent Error Efficiency 1 690,000 69 0.31 2 308,000 30.8 0.69 3 66,800 0.67 0.993 3.5 22,750 0.23 0.998 4 6,210 0.06 0.9994 4.5 1,350 0.01 0.9999 5 233 0.002 0.99997 6 3.4 0.00003 0.999996 41
- 42. Other Quality Performance Indicators Timeliness of responding to clinical advice . Operating Room Blood Delivery Turn Around Time. Completeness of Cancer Reporting. % of cases of Molecular Testing in Anatomic Pathology that adhere to established Clinical guidelines.
- 43. Why Use Quality Indicators? Performance effectiveness. Patient Safety Easier decision making. Measure of laboratory processes and outcomes. Monitor changes. Detect potential problems.
- 44. Criteria for Selection of Quality Indicators Cover Pre-examination, examination & post- examination. Operational units ( Hematology, Microbiology, POCT, AP). Patient Safety. Financial, Human Resources. Customer needs. Accreditation requirements (e.g. JCI,ISO, CAP, CPA, etc..) Regulatory requirements.
- 45. Criteria for Quality Indicators selection Validity :Does the KPI measure what it is supposed to measure? Reliability: Does the KPI provide a consistent measure? Acceptability: Are the KPIs acceptable? Feasibility :Is it possible to collect the required data and is it worth the resources? Explicit evidence base :Is the KPI supported by scientific evidence?
- 46. How to develop Quality Indicators? Definition Name, purpose, scope, authority, domain. Method of data collection and Analysis. -Numerator , Denominator, frequency, calculations. Targets -International bench mark. -organizational performance goal -Evidence base.
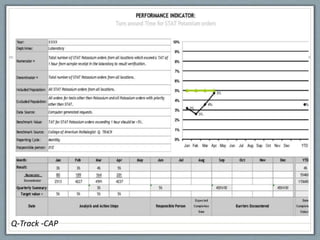
- 47. Q-Track -CAP
- 48. Quality Performance Indicators are not enough
- 50. Benchmarking Simply • "Improving ourselves by learning from others."
- 51. Benchmarking • Is the practice of being humble enough to admit that some organizations are better than you at something and wise enough to try and learn from them their best practice. American Productivity and Quality Center-1988
- 52. Benchmarking • Benchmarking is Making Best Practices Your Daily Practice.
- 53. Why Benchmarking ? Better Awareness of Our Laboratory What we are doing How we are doing it How well we are doing it Better Awareness of the Best laboratories What they are doing How they are doing it How well they are doing it
- 54. Benchmarking and World Class Performance Benchmark Purpose and Quality Maturity I Learning from success VI National leadership II Borrowing ideas III Best-in- firm IV Beating industry standards V Best-in- class Quality Maturity
- 55. Levels Of Benchmarking Internal benchmarking - Within one’s organization. Competitive benchmarking - Analysis the performance and practices of best in class laboratories. Non-competitive benchmarking -Is learning something about a process a laboratory wants to improve by benchmarking. World class benchmarking - Ambitious and looking towards recognized leader.
- 56. Why laboratories need Quality Indicators & Benchmarking Quality Improvement and Patient safety. Satisfying Accreditation Requirements. Satisfying Payer Requirements. Positioning the Laboratory in a Competitive Marketplace. Enforce accountability. Staff Motivation.
- 57. Satisfying Accreditation Requirements CLLIA (The Clinical Laboratory Improvement Amendment ). The Joint Commission . Collage of American Pathology (CAP). ISO 15189 standards for medical laboratories. labmedicine.com February 2008 Volume 39 Number
- 59. Example: Proficiency Testing & Benchmarking Benchmarking accuracy over time is associated with improved performance for Laboratories.
- 61. Sources of Quality Performance Indicators for Laboratories Agency for Healthcare Research and Quality (AHRQ ) National Guideline Clearinghouse (NGC) Web sites. College of American Pathologists (CAP) Web sites . NCQA (National Committee for Quality Assurance ) Accreditation. Centers for Disease Control and Prevention (CDC). PubMed database using various terms Shahram & Snyder. Am J Clin Pathol 2009;131:418 - 431
- 63. Take Home Messages Medical Laboratories need to report the Right test result to the Right patient at the Right time in the Right form. In addition, it should be the Right test choice with the Right interpretation and with the Right advice.
- 64. Take Home Messages Reliable Quality Performance Indicators play a key role in improving the quality of laboratory services and patient Safety.
- 65. Take Home Messages Give Benchmarking a Chance - It’s Worth It.
- 66. References: Quality indicators in laboratory medicine: A fundamental tool for quality and patient safety.Mario Plebani a, Laura Sciacovelli a,Mariela Marinova a, Jessica Marcuccitti a, Maria Laura Chiozza b 2014. Harmonization of laboratory testing — Current achievements and future strategies. 2013.Jillian R Tate a,⁎, Roger Johnson b, Julian Barthc, Mauro Panteghini. Quality indicators to detect pre-analytical errors in laboratory testing. 2014 .M. Plebani a,⁎, L. Sciacovelli a, A. Aita a, A. Padoana, M.L. Chiozza b.
- 67. References: College of American Pathologists.www.cap.org. Reducing Errors in the Practices of Pathology and Laboratory Medicine. David A. Novis, MD, 1,2 and George Konstantakos,Mario Plebani . Clin Chem LabMed 2012. Benchmarking Laboratory Quality.Paul Valenstein, MD, Frank Schneider, MD2. 10-Clinical & Laboratory Standards Institute (CLSI)- GP35 Shahram Shahangian & Susan Snyder, Am J Clinc Pathol 2009; 131: 418 – 431.
- 68. Thank you