SlideShare a Scribd company logo
A Pebble-in-the-Pond Model for Instructional Development M. David Merrill Utah State University
How to recognize effective  e-learning when you see it. M. David Merrill Brigham Young University Hawaii   8 th  Annual Global Chinese Conference  on Computers in Education Hong Kong, China June 3, 2004
If a product does not teach  then it has no value! James L’Allier
Tell & Ask Instruction Present (Tell) information Ask remember-what-you-were-told questions T&A instruction is not effective instruction.
Simon Says Instruction Simon says, “Click on the File menu.” “No! That’s not the File menu.” Simon Says instruction is less effective instruction .
Effective e-learning is based on  First Principles of Instruction Merrill, M. D. (2002).  First principles of instruction.  Educational Technology Research and Development,  50 (3), 43-59.
What is a principle? A principle  is a relationship that is always true  under appropriate conditions  regardless of program or practice.
What is a First Principle  of Instruction? Included in most ID theories and models Supported by research Facilitates Learning Applies to any Delivery System Applies to any Architecture Design Oriented
First Principles of Instruction Problem Activation Demonstration Application Integration
Demonstration  Don’t just tell me, show me! Consistency Learner Guidance Relevant Media
Consistency 5 kinds of learning outcomes Almost all tasks include  these learning outcomes:   Information-about Parts-of Kinds-of  How-to  What-happens  Demonstration
Consistency General vs Specific Information INFORMATION  General Inclusive  Generality refers to many cases or situations PORTRAYAL  Specific Limited Instance refers to one case or a single situation Demonstration
Consistency Don’t just tell me, SHOW ME! USE PORTRAYALS not just information.  Examples and non-examples for kinds of. Demonstrations for how-to . Visualizations for what happens. Demonstration
Guidance Show how information is related to prior knowledge. Show how portrayals are related to information. Show how portrayals are related to each other. Demonstration
Relevant Media Use both graphics and text. Put text next to the graphic it explains. Use audio rather than text to explain. Do not read on screen text. Do not use extraneous audio, video or graphics. Clark, R. C., & Mayer, R. E. (2003).  E-Learning and the Science of Instruction .  San Francisco: Jossey-Bass Pfeiffer. Demonstration
First Principles of Instruction Problem Activation Demonstration Application Integration
Application Let me do it! Consistency Intrinsic or corrective feedback Gradually Diminishing Coaching Varied sequence of whole tasks Application
 Consistency Remember Information LEARNING OUTCOMES information about parts of kind of how to what happens REMEMBER INFORMATION remember facts or associations remember names and description remember definitions remember steps and sequence remember description of process (conditions and consequence) Application
Consistency  Apply to Portrayal LEARNING OUTCOME Information about parts of kinds of how to what happens APPLY TO PORTRAYAL NA locate part classify examples perform task predict consequence or find faulted conditions Application
Corrective Feedback Show what happens. Explain why it happens. Application
Coaching Show how prior knowledge applies. Show how information applies.  Provide prompts or hints. Use more prompting on early problems,  Gradually withdraw prompting. Continue practice until learner is on their own. Application
First Principles of Instruction Problem Activation Demonstration Application Integration
Problem-Centered Let me do the whole task! Show the problem or task Problem components Progression of problems
Instructional components and problem progression Does the instruction teach the components of the problem or task and then help the learner use these components in solving the whole problem or doing the whole task? T T T T T T T components guidance T whole task degree   of   ass essment
First Principles of Instruction Problem Activation Demonstration Application Integration
Activate Knowledge Recall or provide experience Provide Structure
Integrate Knowledge Go Public Reflect Create
First Principles of Instruction ACTIVATION DEMONSTRATION APPLICATION INTEGRATION PROBLEM NAVIGATION
Navigation Let learners see the boundaries of their universe Let learners see how the contents are organized Let learners go forward Let learners back up Let learners correct themselves
Learner Control Use learner control for learners with high prior knowledge or high metacognitive skills Make important instructional events the default condition Add advisement to learner control
Personalization Use conversational style Use on-screen coaches Use an appealing content
First Principles of Instruction ACTIVATION DEMONSTRATION APPLICATION INTEGRATION PROBLEM MOTIVATION NAVIGATION
Motivation Relevant, achievable, and interesting learning environments are motivating. Taking risks and going public is motivating. Formal objectives are not motivating – seeing a real-world task is motivating. Content that is already known is not motivating – individualize the content. Novelty and glitz are not motivating – real-world tasks are motivating.
Motivation Performing decontextualized actions and operations is not motivating – performing whole tasks or problems is motivating. Right/wrong feedback is not motivating – intrinsic feedback is motivating. Immediate feedback decreases motivation – delayed judgment increases motivation.
First Principles of Instruction ACTIVATION DEMONSTRATION APPLICATION INTEGRATION PROBLEM MOTIVATION NAVIGATION COLLABORATION
Collaboration Make assignments that require collaboration among learners. Assign learners to small (2 or 3) heterogeneous groups to optimize interactions. Structure group assignments around products or processes – whole tasks or problems.
First Principles of Instruction ACTIVATION DEMONSTRATION APPLICATION INTEGRATION PROBLEM MOTIVATION NAVIGATION COLLABORATION INTERACTION
Interaction Navigation is not interaction. Interaction is solving real-world problems or doing real-world tasks Interaction requires:  context – a framework for a learning environment a challenge – a real–world problem to be solved or a task to be completed. Learner activity – decisions and actions to solve the problem or complete the task Feedback – consequences of learners decisions and actions.
First Principles of Instruction ACTIVATION DEMONSTRATION APPLICATION INTEGRATION PROBLEM
Pebble in Pond Development production design strategy analysis progression problem
Problem Select audience. Identify problem. Create problem. specific, input, output Solve problem.
Problem
Work the problem Step 1: Create the Gross Sales formulas. 1. Click cell D6. 2. Type =B6*C6. Press Enter. 3. Click D6. 4. Copy the formula using Fill Handle from D6 to D7 through D11. Sample diagnostic procedures for step 1: Problem:  The learner types the formula incorrectly. Solution:  Click cell D6. Type the formula again and press Enter. Step 2: Create the Total Sales formula. 1. Click D12. 2. Click the AutoSum button on the Standard toolbar. 3. Press Enter to accept the formula =SUM(D6:D11).
Problem progression Identify set of problems. Create and solve each problem.  Sequence problems. complexity, difficulty, amount of component information Check sequence for coverage. Does the sequence of problems introduce all the topics that are required? Modify or adjust problems.
Progression of problems? Susan has opened a small restaurant. She has been very successful and wants to expand her business. To finance this project, Susan needs a bank loan. She knows that an accurate and well-designed presentation will help her get the loan. You have agreed to prepare the last month’s sales figures for Susan. Susan has given the Total Lunch Earnings worksheet to Isaac, one of her main suppliers, who has been successful in getting bank loans for his business. He is impressed with your work and offers three improvements. First, include a column that calculates percentage of sales. Second, add some nice borders and shading formats. Finally, set up the page to give the printout a professional appearance. Susan expanded her business. Her restaurant is busier, and she needs more staff. To judge her new staffing requirements accurately, Susan conducted a count of customers before and after the renovations. Each survey was taken over a four-week period. You have agreed to help Susan determine her new staffing levels by calculating statistics from her second survey.
Instructional Component Analysis Identify information components of problem. Identify new components for subsequent problems. Identify, select, create component information and portrayals. Relate components to problems.
Components of a whole Task Almost all tasks include  5 kinds of learning outcomes:   Information-about Parts-of Kinds-of  How-to  What-happens
Components of a Whole Task
Component Analysis MS Excel Skill Builder Reference Table Scenario 2 Skills & Topics Step 1 Creating percentages  Unit 1, Lesson 1, Topic 7: Worksheet: Navigating Unit 1, Lesson 2, Topic 2: Formulas: Entering Unit 1, Lesson 2, Topic 3: The Fill Handle Unit 1, Lesson 2, Topic 4: Formulas: Cell Referencing Unit 1 Lesson 2, Topic 5: Data: Copying Step 2 Formatting percentages  Unit 1, Lesson 3, Topic 2: Cell Range: Moving Unit 1, Lesson 4, Topic 4: Formatting: Textual Data Unit 1, Lesson 4, Topic 5: Formatting: Text Alignment
Instructional Strategy Analysis Determine overall strategy Determine strategy for instructional components Integrate instructional components with problems Provide strategy wrap around  Overview, summary, transition
Instructional components Does the instruction teach the components of the problem or task and then help the learner use these components in solving the whole problem or doing the whole task? T T T T T T T components guidance T whole task degree   of   ass essment
Present Problem
Teach components
Worked example Scenarios 1 and 2 Step 1:  First, you want to create percentage labels and formulas.  Enter your User ID in cell D1.  To begin the procedure, click cell E5, type  % of Sales  in cell E5, and press Enter. To create the percentage of sales figure for the Sandwiches lunch item, type =D6/$D$13  in cell E6 and press Enter. The $ sign in front of the column reference D and the row reference 13 makes $D$13 an absolute cell reference. The cell D6 is a relative cell reference because it does not contain any $ sign. When you copy a cell formula from one row to another with absolute cell references in it, the absolute cell references do not change from one row to the next. In this step, you make the cell reference for the Total Sales, D13, absolute so that its reference will not change when you copy the formula.  Now copy and paste this formula from cell E6 to cells E7 through E13.  Create the percentage of sales figures for each lunch item and Total Sales. Begin by selecting E6 to E13. On the Number tab of the Format Cells dialog box, click Percentage. Under decimal places: select or type 0.  Since there is no lunch item that corresponds with cell E12, use the keyboard to delete this cell.
Gradually diminishing learner guidance   In the previous Scenarios, you were guided step-by-step in the application of the commands to complete the Scenario. In this Scenario, you will not be given this step-by-step guidance. You should first review the modules teaching the commands that you will need to complete this Scenario. Then, you should try to complete each task in the Scenarios on your own. If you need help, there is learner guidance provided at the end of the exercise for each of the tasks. You will learn more if you try to do the task before you look at this guidance material and use this guidance only when you are unable to perform the required commands. After each task, you will be shown an interim spreadsheet that you can use to compare with your own work. In this Scenario, you will design a new worksheet.
Prompted examples Scenarios 3 & 4 Gradually diminishing guidance principle  Step 1 :  Enter your User ID in cell D1.  Create Income formulas in cells B9, C9, and D9  Create Cost formulas in cells B15, C15, and D15  Create Profit/Loss formulas in cells B17, C17, and D17 for the Theater Final worksheet. If you have completed Scenarios 1 and 2, you are familiar with creating formulas since this information was covered.  The detailed guidance for creating formulas in this exercise is provided at the end of the Scenario in a section called Learner Guidance. You should not simply type in the values. You need to apply the appropriate formulas. You have successfully created Income, Cost, and Profit/Loss formulas for the Theater Final worksheet. At this point, your worksheet should contain the following data. If your worksheet does not look like the following worksheet, you may want to try again or go to the Learner Guidance Section.
Unprompted example Gradually diminishing learner guidance  -- Scenario 5 In this exercise, there is no Learner Guidance section. If your screens do not match the sample screens provided, you should return to the Excel course and review the appropriate modules. Step 1:  Enter your User ID in cell D1. Add formulas to compute the totals in column G and generate the expenses (with no decimals) in Row 18. Step 2:  Format the data. Use 12 pt bold for table headings. Add months as column headings.
Authentic tasks Authentic Task 1 In this authentic task, you apply your knowledge of Microsoft Excel 2000 to redesigning a worksheet.Jake has returned from a holiday in France. He had set a budget for the vacation and wants to compare his actual and planned expenses. He is unsure of the correct exchange rate. You have agreed to work this out for Jake in return for a bottle of vintage French Chardonnay. Jake has given you the basic information on the following worksheet named  Holiday .  (worksheet appears here) You must create formulas and redesign the worksheet to make it look like the following example.  (worksheet appears here)
Authentic task Objectives Refer to the target screen on the previous page to ensure the columns and rows in that example and your final screen are identical.  Insert a new row under row 1.  Calculate the value of goods purchased in $ terms.  Calculate the variance of goods purchased in $ terms compared to the budget.  Calculate the totals for each of the four columns of numeric data.  Center and bold the title across the five main data columns and change the font size to 12 point.  Italicize the Items row labels.  Bold the Total row.  Bold all column labels, except for the exchange rate column label.  Right align column labels over numeric data.  Format the numbers, except for the Exchange Rate value, with thousand separators, two decimal places, and red negative.  Create a double line border around all the data, except for the exchange rate data.  Shade the column labels, except for the exchange rate, with dark green background and white font.  Change the exchange rate to 6.685. Is the total variance better or worse?  Save the file with the name Finance Final.
Instructional  Interface  Design Determine delivery vehicles. Script, story board instruction for delivery.  Prepare media specifications. Determine navigation. Determine instructional management. Effective design requires creative use of the media.
Production Content should be specified prior to design. Strategy should be specified prior to design. Don’t confuse development with production. Don’t let graphic artists design your instruction!
Problem Select audience. Identify problem. Create problem. specific, input, output Solve problem.
Problem
Work the problem Step 1: Create the Gross Sales formulas. 1. Click cell D6. 2. Type =B6*C6. Press Enter. 3. Click D6. 4. Copy the formula using Fill Handle from D6 to D7 through D11. Sample diagnostic procedures for step 1: Problem:  The learner types the formula incorrectly. Solution:  Click cell D6. Type the formula again and press Enter. Step 2: Create the Total Sales formula. 1. Click D12. 2. Click the AutoSum button on the Standard toolbar. 3. Press Enter to accept the formula =SUM(D6:D11).
Thompson  Job Impact Study Scenario Based Instruction Stacey L. T. Boyle and M. David Merrill   Does it work?
Content for Study Microsoft Excel Application Course Topics included the same for both groups Both Experimental Groups also had On-line mentor Frequently asked questions
Present Problem
Progression of problems? Susan has opened a small restaurant. She has been very successful and wants to expand her business. To finance this project, Susan needs a bank loan. She knows that an accurate and well-designed presentation will help her get the loan. You have agreed to prepare the last month’s sales figures for Susan. Susan has given the Total Lunch Earnings worksheet to Isaac, one of her main suppliers, who has been successful in getting bank loans for his business. He is impressed with your work and offers three improvements. First, include a column that calculates percentage of sales. Second, add some nice borders and shading formats. Finally, set up the page to give the printout a professional appearance. Susan expanded her business. Her restaurant is busier, and she needs more staff. To judge her new staffing requirements accurately, Susan conducted a count of customers before and after the renovations. Each survey was taken over a four-week period. You have agreed to help Susan determine her new staffing levels by calculating statistics from her second survey.
Teach components
Worked example Scenarios 1 and 2 Step 1:  First, you want to create percentage labels and formulas.  Enter your User ID in cell D1.  To begin the procedure, click cell E5, type  % of Sales  in cell E5, and press Enter. To create the percentage of sales figure for the Sandwiches lunch item, type =D6/$D$13  in cell E6 and press Enter. The $ sign in front of the column reference D and the row reference 13 makes $D$13 an absolute cell reference. The cell D6 is a relative cell reference because it does not contain any $ sign. When you copy a cell formula from one row to another with absolute cell references in it, the absolute cell references do not change from one row to the next. In this step, you make the cell reference for the Total Sales, D13, absolute so that its reference will not change when you copy the formula.  Now copy and paste this formula from cell E6 to cells E7 through E13.  Create the percentage of sales figures for each lunch item and Total Sales. Begin by selecting E6 to E13. On the Number tab of the Format Cells dialog box, click Percentage. Under decimal places: select or type 0.  Since there is no lunch item that corresponds with cell E12, use the keyboard to delete this cell.
Gradually diminishing learner guidance   In the previous Scenarios, you were guided step-by-step in the application of the commands to complete the Scenario. In this Scenario, you will not be given this step-by-step guidance. You should first review the modules teaching the commands that you will need to complete this Scenario. Then, you should try to complete each task in the Scenarios on your own. If you need help, there is learner guidance provided at the end of the exercise for each of the tasks. You will learn more if you try to do the task before you look at this guidance material and use this guidance only when you are unable to perform the required commands. After each task, you will be shown an interim spreadsheet that you can use to compare with your own work. In this Scenario, you will design a new worksheet.
Unprompted example Gradually diminishing learner guidance  -- Scenario 5 In this exercise, there is no Learner Guidance section. If your screens do not match the sample screens provided, you should return to the Excel course and review the appropriate modules. Step 1:  Enter your User ID in cell D1. Add formulas to compute the totals in column G and generate the expenses (with no decimals) in Row 18. Step 2:  Format the data. Use 12 pt bold for table headings. Add months as column headings.
Authentic tasks Authentic Task 1 In this authentic task, you apply your knowledge of Microsoft Excel 2000 to redesigning a worksheet.Jake has returned from a holiday in France. He had set a budget for the vacation and wants to compare his actual and planned expenses. He is unsure of the correct exchange rate. You have agreed to work this out for Jake in return for a bottle of vintage French Chardonnay. Jake has given you the basic information on the following worksheet named  Holiday .  (worksheet appears here) You must create formulas and redesign the worksheet to make it look like the following example.  (worksheet appears here)
Thompson NETg Study Design 3 Groups Scenario Group (N= 49) Straight e-learning (Simon Says) Group (N=49) Control Group (no training) (N=30) Subjects 128 Participants from several companies and  colleges
Effectiveness Results  Differences among groups significant at beyond .001 level. Mean Performance on Authentic Tasks Group 34% Control Group 68% Straight e-learning Group 89% Scenario Group
Efficiency Results Difference between groups is significant beyond the .001 level. Most were unable to complete task no time Control Group 49 minutes Straight e-learning Group 29 minutes Scenario Group Mean time to complete 3 authentic tasks Group
Does it Work? Scenario-based 30% performance gain  and 41% efficiency gain compared with straight e-learning. A progressive scenario-based instructional sequence results in increased efficiency and effectiveness in learning a procedural task.
Thank You ! Merrill, M. D. (2002). A Pebble-in-the-Pond Model for Instructional Development.  Performance Improvement , 41(7), 39-44. See Check List for First Principles Ask Me A Question
Plan to attend The 16th Annual  Utah State University Instructional Technology Institute August 2004 www.itinstitute.usu.edu
Plan to Attend 9 th  Annual Global Chinese Conference on Computers in Education Brigham Young University Hawai’i June 6 – 9, 2005

More Related Content

PPT
Merrill
PDF
Organizational Behavior A Practical Problem Solving Approach 2nd Edition Kini...
PPTX
ICTCM 2013 Presentation -- Dan DuPort
PPTX
Best Practices for Remote Teaching
PPT
Applying the Multimedia & Contiguity Principle
PPTX
PDF
Making Connections In Computer Training Sessions For Display
DOCX
Sem 2 lesson plan
Merrill
Organizational Behavior A Practical Problem Solving Approach 2nd Edition Kini...
ICTCM 2013 Presentation -- Dan DuPort
Best Practices for Remote Teaching
Applying the Multimedia & Contiguity Principle
Making Connections In Computer Training Sessions For Display
Sem 2 lesson plan

What's hot (20)

PPT
Drill and-practice_Gabrielle Brown
PPTX
Using Learning Sciences Research to Improve Computing Teaching: Predictions, ...
PDF
Tan, julius peter ed tech 2 assignment chapter 6 (assess & apply) & c...
DOC
Module 11 problem solving
PPTX
Adult Learning Theory
PPT
Test Your Instructional Design IQ
PPTX
Goldman & Acuna The Rest of the 7 Student-Centered Strategies of Assessment f...
PDF
Alvar Garcia TID42859_Dimensions_Essay_New
PPTX
NCTM 2016- Seeing is Believing- Using Video Reflection Techniques to Strength...
PPTX
Teaching problem solving
PPTX
Determining Relative Advantage
PPTX
Drill & practice
PPT
PPT
Drill and Practice Instructional Software
DOCX
Dll eng8-2 ndq-9th-week edited (1)
PPT
academic effect of technology in math learning
PDF
Designing Developing Evaluating
PPT
Teaching Through Problem Solving[1]
PPTX
Inspire and Cultivate Algebraic Thinking
DOCX
Rnold Serrano (Evaluation tool to evaluate the kiosk)
Drill and-practice_Gabrielle Brown
Using Learning Sciences Research to Improve Computing Teaching: Predictions, ...
Tan, julius peter ed tech 2 assignment chapter 6 (assess & apply) & c...
Module 11 problem solving
Adult Learning Theory
Test Your Instructional Design IQ
Goldman & Acuna The Rest of the 7 Student-Centered Strategies of Assessment f...
Alvar Garcia TID42859_Dimensions_Essay_New
NCTM 2016- Seeing is Believing- Using Video Reflection Techniques to Strength...
Teaching problem solving
Determining Relative Advantage
Drill & practice
Drill and Practice Instructional Software
Dll eng8-2 ndq-9th-week edited (1)
academic effect of technology in math learning
Designing Developing Evaluating
Teaching Through Problem Solving[1]
Inspire and Cultivate Algebraic Thinking
Rnold Serrano (Evaluation tool to evaluate the kiosk)
Ad

Similar to 3merrill (20)

PPT
Merrill 1
PPT
Kemp design model
PPT
Kemp instructional model
KEY
BEYOND STORYTELLING: A New Approach to Story-Learning Design
PPTX
Crash course in instruction
PPTX
AdvaMed Summit
PPTX
Id introduction instructional design for e learning
PPS
First Principles Of Cs Instruction
PDF
Basic Instructional Design Principles - A Primer
PPT
Instructional Design Training.ppt
PPT
Lsc Orlando Task Centered
PPT
Manage Learning Performance With Ict
PPTX
Instructional Design Models in Lesson Planning
PPT
ISD: Addie Presentation
PPT
A guide to instructional practice in teaching & learning
PPTX
a collaborative effort on exploring addie,sam,tpack model
PPTX
MODELS OF TECHNOLOGY-ENHANCED LESSONS.pptx
PPTX
WASEEM AKHTAR MITHA TIWANA.2.pptx
PPTX
Ch. 8 developing an instructional strategy
PPTX
Technology in Teaching & Learning: ICT in Various Content Areas
Merrill 1
Kemp design model
Kemp instructional model
BEYOND STORYTELLING: A New Approach to Story-Learning Design
Crash course in instruction
AdvaMed Summit
Id introduction instructional design for e learning
First Principles Of Cs Instruction
Basic Instructional Design Principles - A Primer
Instructional Design Training.ppt
Lsc Orlando Task Centered
Manage Learning Performance With Ict
Instructional Design Models in Lesson Planning
ISD: Addie Presentation
A guide to instructional practice in teaching & learning
a collaborative effort on exploring addie,sam,tpack model
MODELS OF TECHNOLOGY-ENHANCED LESSONS.pptx
WASEEM AKHTAR MITHA TIWANA.2.pptx
Ch. 8 developing an instructional strategy
Technology in Teaching & Learning: ICT in Various Content Areas
Ad

Recently uploaded (20)

PDF
Hindi spoken digit analysis for native and non-native speakers
PPTX
Tartificialntelligence_presentation.pptx
PDF
Transform Your ITIL® 4 & ITSM Strategy with AI in 2025.pdf
PDF
DP Operators-handbook-extract for the Mautical Institute
PDF
Getting Started with Data Integration: FME Form 101
PDF
A novel scalable deep ensemble learning framework for big data classification...
PDF
From MVP to Full-Scale Product A Startup’s Software Journey.pdf
PPTX
TechTalks-8-2019-Service-Management-ITIL-Refresh-ITIL-4-Framework-Supports-Ou...
PPTX
OMC Textile Division Presentation 2021.pptx
PDF
Profit Center Accounting in SAP S/4HANA, S4F28 Col11
PDF
NewMind AI Weekly Chronicles - August'25-Week II
PDF
ENT215_Completing-a-large-scale-migration-and-modernization-with-AWS.pdf
PDF
WOOl fibre morphology and structure.pdf for textiles
PDF
project resource management chapter-09.pdf
PPTX
TLE Review Electricity (Electricity).pptx
PDF
Zenith AI: Advanced Artificial Intelligence
PDF
Enhancing emotion recognition model for a student engagement use case through...
PDF
August Patch Tuesday
PDF
Accuracy of neural networks in brain wave diagnosis of schizophrenia
PDF
Univ-Connecticut-ChatGPT-Presentaion.pdf
Hindi spoken digit analysis for native and non-native speakers
Tartificialntelligence_presentation.pptx
Transform Your ITIL® 4 & ITSM Strategy with AI in 2025.pdf
DP Operators-handbook-extract for the Mautical Institute
Getting Started with Data Integration: FME Form 101
A novel scalable deep ensemble learning framework for big data classification...
From MVP to Full-Scale Product A Startup’s Software Journey.pdf
TechTalks-8-2019-Service-Management-ITIL-Refresh-ITIL-4-Framework-Supports-Ou...
OMC Textile Division Presentation 2021.pptx
Profit Center Accounting in SAP S/4HANA, S4F28 Col11
NewMind AI Weekly Chronicles - August'25-Week II
ENT215_Completing-a-large-scale-migration-and-modernization-with-AWS.pdf
WOOl fibre morphology and structure.pdf for textiles
project resource management chapter-09.pdf
TLE Review Electricity (Electricity).pptx
Zenith AI: Advanced Artificial Intelligence
Enhancing emotion recognition model for a student engagement use case through...
August Patch Tuesday
Accuracy of neural networks in brain wave diagnosis of schizophrenia
Univ-Connecticut-ChatGPT-Presentaion.pdf

3merrill

  • 1. A Pebble-in-the-Pond Model for Instructional Development M. David Merrill Utah State University
  • 2. How to recognize effective e-learning when you see it. M. David Merrill Brigham Young University Hawaii 8 th Annual Global Chinese Conference on Computers in Education Hong Kong, China June 3, 2004
  • 3. If a product does not teach then it has no value! James L’Allier
  • 4. Tell & Ask Instruction Present (Tell) information Ask remember-what-you-were-told questions T&A instruction is not effective instruction.
  • 5. Simon Says Instruction Simon says, “Click on the File menu.” “No! That’s not the File menu.” Simon Says instruction is less effective instruction .
  • 6. Effective e-learning is based on First Principles of Instruction Merrill, M. D. (2002). First principles of instruction. Educational Technology Research and Development, 50 (3), 43-59.
  • 7. What is a principle? A principle is a relationship that is always true under appropriate conditions regardless of program or practice.
  • 8. What is a First Principle of Instruction? Included in most ID theories and models Supported by research Facilitates Learning Applies to any Delivery System Applies to any Architecture Design Oriented
  • 9. First Principles of Instruction Problem Activation Demonstration Application Integration
  • 10. Demonstration Don’t just tell me, show me! Consistency Learner Guidance Relevant Media
  • 11. Consistency 5 kinds of learning outcomes Almost all tasks include these learning outcomes: Information-about Parts-of Kinds-of How-to What-happens Demonstration
  • 12. Consistency General vs Specific Information INFORMATION General Inclusive Generality refers to many cases or situations PORTRAYAL Specific Limited Instance refers to one case or a single situation Demonstration
  • 13. Consistency Don’t just tell me, SHOW ME! USE PORTRAYALS not just information. Examples and non-examples for kinds of. Demonstrations for how-to . Visualizations for what happens. Demonstration
  • 14. Guidance Show how information is related to prior knowledge. Show how portrayals are related to information. Show how portrayals are related to each other. Demonstration
  • 15. Relevant Media Use both graphics and text. Put text next to the graphic it explains. Use audio rather than text to explain. Do not read on screen text. Do not use extraneous audio, video or graphics. Clark, R. C., & Mayer, R. E. (2003). E-Learning and the Science of Instruction . San Francisco: Jossey-Bass Pfeiffer. Demonstration
  • 16. First Principles of Instruction Problem Activation Demonstration Application Integration
  • 17. Application Let me do it! Consistency Intrinsic or corrective feedback Gradually Diminishing Coaching Varied sequence of whole tasks Application
  • 18. Consistency Remember Information LEARNING OUTCOMES information about parts of kind of how to what happens REMEMBER INFORMATION remember facts or associations remember names and description remember definitions remember steps and sequence remember description of process (conditions and consequence) Application
  • 19. Consistency Apply to Portrayal LEARNING OUTCOME Information about parts of kinds of how to what happens APPLY TO PORTRAYAL NA locate part classify examples perform task predict consequence or find faulted conditions Application
  • 20. Corrective Feedback Show what happens. Explain why it happens. Application
  • 21. Coaching Show how prior knowledge applies. Show how information applies. Provide prompts or hints. Use more prompting on early problems, Gradually withdraw prompting. Continue practice until learner is on their own. Application
  • 22. First Principles of Instruction Problem Activation Demonstration Application Integration
  • 23. Problem-Centered Let me do the whole task! Show the problem or task Problem components Progression of problems
  • 24. Instructional components and problem progression Does the instruction teach the components of the problem or task and then help the learner use these components in solving the whole problem or doing the whole task? T T T T T T T components guidance T whole task degree of ass essment
  • 25. First Principles of Instruction Problem Activation Demonstration Application Integration
  • 26. Activate Knowledge Recall or provide experience Provide Structure
  • 27. Integrate Knowledge Go Public Reflect Create
  • 28. First Principles of Instruction ACTIVATION DEMONSTRATION APPLICATION INTEGRATION PROBLEM NAVIGATION
  • 29. Navigation Let learners see the boundaries of their universe Let learners see how the contents are organized Let learners go forward Let learners back up Let learners correct themselves
  • 30. Learner Control Use learner control for learners with high prior knowledge or high metacognitive skills Make important instructional events the default condition Add advisement to learner control
  • 31. Personalization Use conversational style Use on-screen coaches Use an appealing content
  • 32. First Principles of Instruction ACTIVATION DEMONSTRATION APPLICATION INTEGRATION PROBLEM MOTIVATION NAVIGATION
  • 33. Motivation Relevant, achievable, and interesting learning environments are motivating. Taking risks and going public is motivating. Formal objectives are not motivating – seeing a real-world task is motivating. Content that is already known is not motivating – individualize the content. Novelty and glitz are not motivating – real-world tasks are motivating.
  • 34. Motivation Performing decontextualized actions and operations is not motivating – performing whole tasks or problems is motivating. Right/wrong feedback is not motivating – intrinsic feedback is motivating. Immediate feedback decreases motivation – delayed judgment increases motivation.
  • 35. First Principles of Instruction ACTIVATION DEMONSTRATION APPLICATION INTEGRATION PROBLEM MOTIVATION NAVIGATION COLLABORATION
  • 36. Collaboration Make assignments that require collaboration among learners. Assign learners to small (2 or 3) heterogeneous groups to optimize interactions. Structure group assignments around products or processes – whole tasks or problems.
  • 37. First Principles of Instruction ACTIVATION DEMONSTRATION APPLICATION INTEGRATION PROBLEM MOTIVATION NAVIGATION COLLABORATION INTERACTION
  • 38. Interaction Navigation is not interaction. Interaction is solving real-world problems or doing real-world tasks Interaction requires: context – a framework for a learning environment a challenge – a real–world problem to be solved or a task to be completed. Learner activity – decisions and actions to solve the problem or complete the task Feedback – consequences of learners decisions and actions.
  • 39. First Principles of Instruction ACTIVATION DEMONSTRATION APPLICATION INTEGRATION PROBLEM
  • 40. Pebble in Pond Development production design strategy analysis progression problem
  • 41. Problem Select audience. Identify problem. Create problem. specific, input, output Solve problem.
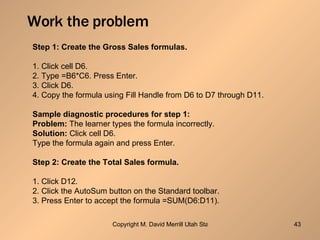
  • 43. Work the problem Step 1: Create the Gross Sales formulas. 1. Click cell D6. 2. Type =B6*C6. Press Enter. 3. Click D6. 4. Copy the formula using Fill Handle from D6 to D7 through D11. Sample diagnostic procedures for step 1: Problem: The learner types the formula incorrectly. Solution: Click cell D6. Type the formula again and press Enter. Step 2: Create the Total Sales formula. 1. Click D12. 2. Click the AutoSum button on the Standard toolbar. 3. Press Enter to accept the formula =SUM(D6:D11).
  • 44. Problem progression Identify set of problems. Create and solve each problem. Sequence problems. complexity, difficulty, amount of component information Check sequence for coverage. Does the sequence of problems introduce all the topics that are required? Modify or adjust problems.
  • 45. Progression of problems? Susan has opened a small restaurant. She has been very successful and wants to expand her business. To finance this project, Susan needs a bank loan. She knows that an accurate and well-designed presentation will help her get the loan. You have agreed to prepare the last month’s sales figures for Susan. Susan has given the Total Lunch Earnings worksheet to Isaac, one of her main suppliers, who has been successful in getting bank loans for his business. He is impressed with your work and offers three improvements. First, include a column that calculates percentage of sales. Second, add some nice borders and shading formats. Finally, set up the page to give the printout a professional appearance. Susan expanded her business. Her restaurant is busier, and she needs more staff. To judge her new staffing requirements accurately, Susan conducted a count of customers before and after the renovations. Each survey was taken over a four-week period. You have agreed to help Susan determine her new staffing levels by calculating statistics from her second survey.
  • 46. Instructional Component Analysis Identify information components of problem. Identify new components for subsequent problems. Identify, select, create component information and portrayals. Relate components to problems.
  • 47. Components of a whole Task Almost all tasks include 5 kinds of learning outcomes: Information-about Parts-of Kinds-of How-to What-happens
  • 48. Components of a Whole Task
  • 49. Component Analysis MS Excel Skill Builder Reference Table Scenario 2 Skills & Topics Step 1 Creating percentages Unit 1, Lesson 1, Topic 7: Worksheet: Navigating Unit 1, Lesson 2, Topic 2: Formulas: Entering Unit 1, Lesson 2, Topic 3: The Fill Handle Unit 1, Lesson 2, Topic 4: Formulas: Cell Referencing Unit 1 Lesson 2, Topic 5: Data: Copying Step 2 Formatting percentages Unit 1, Lesson 3, Topic 2: Cell Range: Moving Unit 1, Lesson 4, Topic 4: Formatting: Textual Data Unit 1, Lesson 4, Topic 5: Formatting: Text Alignment
  • 50. Instructional Strategy Analysis Determine overall strategy Determine strategy for instructional components Integrate instructional components with problems Provide strategy wrap around Overview, summary, transition
  • 51. Instructional components Does the instruction teach the components of the problem or task and then help the learner use these components in solving the whole problem or doing the whole task? T T T T T T T components guidance T whole task degree of ass essment
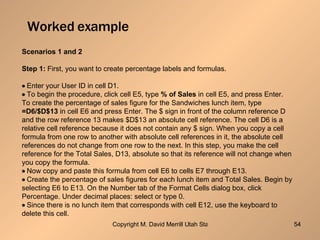
  • 54. Worked example Scenarios 1 and 2 Step 1: First, you want to create percentage labels and formulas.  Enter your User ID in cell D1.  To begin the procedure, click cell E5, type % of Sales in cell E5, and press Enter. To create the percentage of sales figure for the Sandwiches lunch item, type =D6/$D$13 in cell E6 and press Enter. The $ sign in front of the column reference D and the row reference 13 makes $D$13 an absolute cell reference. The cell D6 is a relative cell reference because it does not contain any $ sign. When you copy a cell formula from one row to another with absolute cell references in it, the absolute cell references do not change from one row to the next. In this step, you make the cell reference for the Total Sales, D13, absolute so that its reference will not change when you copy the formula.  Now copy and paste this formula from cell E6 to cells E7 through E13.  Create the percentage of sales figures for each lunch item and Total Sales. Begin by selecting E6 to E13. On the Number tab of the Format Cells dialog box, click Percentage. Under decimal places: select or type 0.  Since there is no lunch item that corresponds with cell E12, use the keyboard to delete this cell.
  • 55. Gradually diminishing learner guidance In the previous Scenarios, you were guided step-by-step in the application of the commands to complete the Scenario. In this Scenario, you will not be given this step-by-step guidance. You should first review the modules teaching the commands that you will need to complete this Scenario. Then, you should try to complete each task in the Scenarios on your own. If you need help, there is learner guidance provided at the end of the exercise for each of the tasks. You will learn more if you try to do the task before you look at this guidance material and use this guidance only when you are unable to perform the required commands. After each task, you will be shown an interim spreadsheet that you can use to compare with your own work. In this Scenario, you will design a new worksheet.
  • 56. Prompted examples Scenarios 3 & 4 Gradually diminishing guidance principle Step 1 :  Enter your User ID in cell D1.  Create Income formulas in cells B9, C9, and D9  Create Cost formulas in cells B15, C15, and D15  Create Profit/Loss formulas in cells B17, C17, and D17 for the Theater Final worksheet. If you have completed Scenarios 1 and 2, you are familiar with creating formulas since this information was covered. The detailed guidance for creating formulas in this exercise is provided at the end of the Scenario in a section called Learner Guidance. You should not simply type in the values. You need to apply the appropriate formulas. You have successfully created Income, Cost, and Profit/Loss formulas for the Theater Final worksheet. At this point, your worksheet should contain the following data. If your worksheet does not look like the following worksheet, you may want to try again or go to the Learner Guidance Section.
  • 57. Unprompted example Gradually diminishing learner guidance -- Scenario 5 In this exercise, there is no Learner Guidance section. If your screens do not match the sample screens provided, you should return to the Excel course and review the appropriate modules. Step 1: Enter your User ID in cell D1. Add formulas to compute the totals in column G and generate the expenses (with no decimals) in Row 18. Step 2: Format the data. Use 12 pt bold for table headings. Add months as column headings.
  • 58. Authentic tasks Authentic Task 1 In this authentic task, you apply your knowledge of Microsoft Excel 2000 to redesigning a worksheet.Jake has returned from a holiday in France. He had set a budget for the vacation and wants to compare his actual and planned expenses. He is unsure of the correct exchange rate. You have agreed to work this out for Jake in return for a bottle of vintage French Chardonnay. Jake has given you the basic information on the following worksheet named Holiday . (worksheet appears here) You must create formulas and redesign the worksheet to make it look like the following example. (worksheet appears here)
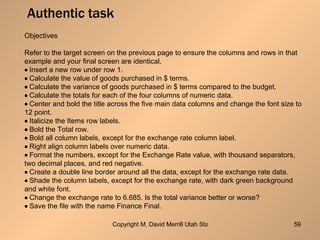
  • 59. Authentic task Objectives Refer to the target screen on the previous page to ensure the columns and rows in that example and your final screen are identical.  Insert a new row under row 1.  Calculate the value of goods purchased in $ terms.  Calculate the variance of goods purchased in $ terms compared to the budget.  Calculate the totals for each of the four columns of numeric data.  Center and bold the title across the five main data columns and change the font size to 12 point.  Italicize the Items row labels.  Bold the Total row.  Bold all column labels, except for the exchange rate column label.  Right align column labels over numeric data.  Format the numbers, except for the Exchange Rate value, with thousand separators, two decimal places, and red negative.  Create a double line border around all the data, except for the exchange rate data.  Shade the column labels, except for the exchange rate, with dark green background and white font.  Change the exchange rate to 6.685. Is the total variance better or worse?  Save the file with the name Finance Final.
  • 60. Instructional Interface Design Determine delivery vehicles. Script, story board instruction for delivery. Prepare media specifications. Determine navigation. Determine instructional management. Effective design requires creative use of the media.
  • 61. Production Content should be specified prior to design. Strategy should be specified prior to design. Don’t confuse development with production. Don’t let graphic artists design your instruction!
  • 62. Problem Select audience. Identify problem. Create problem. specific, input, output Solve problem.
  • 64. Work the problem Step 1: Create the Gross Sales formulas. 1. Click cell D6. 2. Type =B6*C6. Press Enter. 3. Click D6. 4. Copy the formula using Fill Handle from D6 to D7 through D11. Sample diagnostic procedures for step 1: Problem: The learner types the formula incorrectly. Solution: Click cell D6. Type the formula again and press Enter. Step 2: Create the Total Sales formula. 1. Click D12. 2. Click the AutoSum button on the Standard toolbar. 3. Press Enter to accept the formula =SUM(D6:D11).
  • 65. Thompson Job Impact Study Scenario Based Instruction Stacey L. T. Boyle and M. David Merrill Does it work?
  • 66. Content for Study Microsoft Excel Application Course Topics included the same for both groups Both Experimental Groups also had On-line mentor Frequently asked questions
  • 68. Progression of problems? Susan has opened a small restaurant. She has been very successful and wants to expand her business. To finance this project, Susan needs a bank loan. She knows that an accurate and well-designed presentation will help her get the loan. You have agreed to prepare the last month’s sales figures for Susan. Susan has given the Total Lunch Earnings worksheet to Isaac, one of her main suppliers, who has been successful in getting bank loans for his business. He is impressed with your work and offers three improvements. First, include a column that calculates percentage of sales. Second, add some nice borders and shading formats. Finally, set up the page to give the printout a professional appearance. Susan expanded her business. Her restaurant is busier, and she needs more staff. To judge her new staffing requirements accurately, Susan conducted a count of customers before and after the renovations. Each survey was taken over a four-week period. You have agreed to help Susan determine her new staffing levels by calculating statistics from her second survey.
  • 70. Worked example Scenarios 1 and 2 Step 1: First, you want to create percentage labels and formulas.  Enter your User ID in cell D1.  To begin the procedure, click cell E5, type % of Sales in cell E5, and press Enter. To create the percentage of sales figure for the Sandwiches lunch item, type =D6/$D$13 in cell E6 and press Enter. The $ sign in front of the column reference D and the row reference 13 makes $D$13 an absolute cell reference. The cell D6 is a relative cell reference because it does not contain any $ sign. When you copy a cell formula from one row to another with absolute cell references in it, the absolute cell references do not change from one row to the next. In this step, you make the cell reference for the Total Sales, D13, absolute so that its reference will not change when you copy the formula.  Now copy and paste this formula from cell E6 to cells E7 through E13.  Create the percentage of sales figures for each lunch item and Total Sales. Begin by selecting E6 to E13. On the Number tab of the Format Cells dialog box, click Percentage. Under decimal places: select or type 0.  Since there is no lunch item that corresponds with cell E12, use the keyboard to delete this cell.
  • 71. Gradually diminishing learner guidance In the previous Scenarios, you were guided step-by-step in the application of the commands to complete the Scenario. In this Scenario, you will not be given this step-by-step guidance. You should first review the modules teaching the commands that you will need to complete this Scenario. Then, you should try to complete each task in the Scenarios on your own. If you need help, there is learner guidance provided at the end of the exercise for each of the tasks. You will learn more if you try to do the task before you look at this guidance material and use this guidance only when you are unable to perform the required commands. After each task, you will be shown an interim spreadsheet that you can use to compare with your own work. In this Scenario, you will design a new worksheet.
  • 72. Unprompted example Gradually diminishing learner guidance -- Scenario 5 In this exercise, there is no Learner Guidance section. If your screens do not match the sample screens provided, you should return to the Excel course and review the appropriate modules. Step 1: Enter your User ID in cell D1. Add formulas to compute the totals in column G and generate the expenses (with no decimals) in Row 18. Step 2: Format the data. Use 12 pt bold for table headings. Add months as column headings.
  • 73. Authentic tasks Authentic Task 1 In this authentic task, you apply your knowledge of Microsoft Excel 2000 to redesigning a worksheet.Jake has returned from a holiday in France. He had set a budget for the vacation and wants to compare his actual and planned expenses. He is unsure of the correct exchange rate. You have agreed to work this out for Jake in return for a bottle of vintage French Chardonnay. Jake has given you the basic information on the following worksheet named Holiday . (worksheet appears here) You must create formulas and redesign the worksheet to make it look like the following example. (worksheet appears here)
  • 74. Thompson NETg Study Design 3 Groups Scenario Group (N= 49) Straight e-learning (Simon Says) Group (N=49) Control Group (no training) (N=30) Subjects 128 Participants from several companies and colleges
  • 75. Effectiveness Results Differences among groups significant at beyond .001 level. Mean Performance on Authentic Tasks Group 34% Control Group 68% Straight e-learning Group 89% Scenario Group
  • 76. Efficiency Results Difference between groups is significant beyond the .001 level. Most were unable to complete task no time Control Group 49 minutes Straight e-learning Group 29 minutes Scenario Group Mean time to complete 3 authentic tasks Group
  • 77. Does it Work? Scenario-based 30% performance gain and 41% efficiency gain compared with straight e-learning. A progressive scenario-based instructional sequence results in increased efficiency and effectiveness in learning a procedural task.
  • 78. Thank You ! Merrill, M. D. (2002). A Pebble-in-the-Pond Model for Instructional Development. Performance Improvement , 41(7), 39-44. See Check List for First Principles Ask Me A Question
  • 79. Plan to attend The 16th Annual Utah State University Instructional Technology Institute August 2004 www.itinstitute.usu.edu
  • 80. Plan to Attend 9 th Annual Global Chinese Conference on Computers in Education Brigham Young University Hawai’i June 6 – 9, 2005