


4_Tutorial.pdf
- 1. STAT100 – Tutorial for Problem Set 4 1 R is a free open source software environment for statistical computing and graphics. It runs on a variety of UNIX platforms, Windows and Mac operating systems (OS). RStudio is an integrated development environment (IDE) for R. RStudio includes a console, syntax-highlighting editor that supports direct code execution, and tools for plotting, history, debugging and workspace management. RStudio is available in an open source edition and runs on the desktop (Windows, Mac, or Linux). For more information, see the websites for R and RStudio: R: https://www.r-project.org/ RStudio: https://rstudio.com/ STAT100 Problem Sets need to be completed by students in RStudio. This document is a tutorial that students are expected to complete before starting Problem Set 4. In this tutorial, you will learn how to generate two-way tables with percentages, side-by-side boxplots, scatterplots, correlation coefficients and least-squares linear regression equations. After this tutorial, you will be ready to complete Problem Set 4. Before beginning this tutorial, students should have already installed R and RStudio on their devices. On the STAT100 ELMS course home page, there is a PDF file with instructions on installing R and RStudio. You should follow along with the steps and tasks in this tutorial, and be sure to investigate the different R commands, features, and tools on your own. In this tutorial, you will see prompts for you to Try on your own to encourage you to get extra practice in learning how to use R and RStudio for STAT100. The tutorial includes examples with screenshots to illustrate how things look in R and RStudio. Before scrolling down to the next page, open RStudio.
- 2. STAT100 – Tutorial for Problem Set 4 2 Data File for the Tutorial for Problem Set 4 For this tutorial, we will use the same depression.RData data file that was used in the Tutorial for Problem Set 2. As a reminder, the data file can be found in our ELMS Course under Modules -> Tutorials for Problem Sets If you have not already done so, you need to download the file depression.RData and save the file in a directory/folder on your device. See the Tutorial for Problem Set 2 for instructions on indicating a working directory for your analyses and output and as the location for data files that you want to open or access in RStudio. Before advancing to the next page, all students should set their working directory to the location where you saved the file depression.RData. See the Tutorial for Problem Set 2 for instructions on opening a data file RStudio. Before advancing to the next page, all students should open the file depression.RData in RStudio. IMPORTANT NOTE: Although the name of the file for this tutorial is depression.RData (with a lower-case d), the name of the data set is Depression (with a upper-case D). If you use the View command, you need to type “View(Depression)”.
- 3. STAT100 – Tutorial for Problem Set 4 3 As we have learned in STAT100, to examine a potential relationship between two variables, we use different statistical tools (data displays or numeric values) depending on the “role-type classification”. The first step is to determine which of the four cases is represented by the data situation, and then determine what statistical tools should be used. Creating Two-Way Tables with Counts in RStudio The C -> C case involves a categorical explanatory variable and a categorical response variable. To examine a potential relationship between two variables in the C -> C case, we use a two-way table with conditional percentages. Screenshot example 1: This screenshot illustrates how to generate a two-way table for two categorical variables in the same data set. The table() command is used, with the 2 variables separated by a comma. The screenshot below produces a two-way table with only counts for the treatment variable (Treat) and Outcome variable in the Depression data set. The Treat variable is the treatment received by the patient (Lithium, Imipramine, or Placebo) in the depression study, and the Outcome variable is whether or not a recurrence occurred during the patient's treatment. The code used in this example is: table(Depression$Treat, Depression$Outcome) Interpreting this two-way table: This table indicates that 27 of the Imipramine patients did not have a recurrence of depression. It also indicates that 11 of the Imipramine patients did have a recurrence of depression. When we only include counts in a two-way table, it can be difficult to determine differences in the response variable for different categories of the explanatory variable. For this reason, we want to include percentages in two-way tables.
- 4. STAT100 – Tutorial for Problem Set 4 4 Creating Two-Way Tables with Conditional Percentages in RStudio To examine a potential relationship between two variables in the C -> C case, we use a two-way table with conditional percentages and compare the conditional percentages of the different categories of the response variable for each group of the categorical explanatory variable. If there are moderate to large differences between groups, then there is a likely relationship between the two variables. Screenshot example 2: This screenshot illustrates how to generate a two-way table with row percentages for two categorical variables in the same data set. Additional coding in R is necessary after using the table() command. The screenshot below produces a two-way table with row percentages for the treatment variable (Treat) and Outcome variable in the Depression data set. When you create a two-way table in RStudio using the table () command, the explanatory variable should be listed first, followed by the response variable after the comma. The code used in this example is: table1 = table(Depression$Treat, Depression$Outcome) 100*table1/rowSums(table1) Interpreting this two-way table: This table with row percentages indicates that over 71% of Imipramine patients did not have a recurrence of depression, compared to almost 38% of Lithium patients who did not have a recurrence, and about 32% of Placebo patients who did not have a recurrence. By including row percentages, we can see that patients who received Imipramine were much less likely to have a recurrence of depression as compared to the other treatment groups in the depression study. Based on these results, because there are large differences in recurrence rates between the different treatment groups, we conclude that there is a likely relationship between the depression treatment in this study and whether patients have a recurrence of depression.
- 5. STAT100 – Tutorial for Problem Set 4 5 Creating Descriptive Statistics by Groups in RStudio The C -> Q case involves a categorical explanatory variable and a quantitative response variable. To examine a potential relationship between two variables in the C -> Q case, we use side-by-side boxplots supplemented by descriptive statistics. This tutorial will first show how to generate supplemental descriptive statistics for the C -> Q case. Screenshot example 3: To generate descriptive statistics of a quantitative response variable for different groups of a categorical explanatory variable, the tapply() command is used, with the quantitative response variable listed first, then a comma, then the categorical explanatory variable, then “summary”. In this example the treatment variable (Treat) is the explanatory variable and the Time variable is the response variable. The Time variable measures the time in days until the patient’s first recurrence of depression, or if a recurrence did not occur, the length in days of the patient's participation in the study. Note that the descriptive statistics for each treatment group are listed as output in the RStudio Console. The code used in this example is: tapply(Depression$Time,Depression$Treat,summary)
- 6. STAT100 – Tutorial for Problem Set 4 6 Creating Side-by-Side Boxplots in RStudio The C -> Q case involves a categorical explanatory variable and a quantitative response variable. To examine a potential relationship between two variables in the C -> Q case, we use side-by-side boxplots supplemented by descriptive statistics. We compare the distributions of the response variable for each group of the categorical explanatory variable, focusing on center, shape, spread and outliers. If there are moderate to large differences between the distributions for the different groups, then there is likely a relationship between the explanatory variable and the response variable. Screenshot example 4: This screenshot illustrates how to generate side-by-side boxplots for two variables in the same data set. The boxplot() command is used, with the quantitative response variable listed first, then a ~ symbol, then the categorical explanatory variable. The screenshot below produces side-by-side boxplots with default formatting settings. In this example the treatment variable (Treat) is the explanatory variable and the Time variable is the response variable. The Time variable measures the time in days until the patient’s first recurrence of depression, or if a recurrence did not occur, the length in days of the patient's participation in the study. The output for the boxplots is included on the next page. The code used in this example is: boxplot (Depression$Time~Depression$Treat)
- 7. STAT100 – Tutorial for Problem Set 4 7
- 8. STAT100 – Tutorial for Problem Set 4 8 Formatting Side-by-Side Boxplots in RStudio As mentioned previously, the boxplot () command with no other arguments or subcommands creates side-by-side boxplots with default formatting settings. We usually prefer boxplots with more descriptive labels and formatting, and there are different ways to format boxplots in RStudio. The screenshot below illustrates an example of using additional arguments and subcommands to format side-by-side boxplots. Screenshot example 5: This screenshot illustrates how to create formatted side-by-side boxplots in RStudio using additional arguments and subcommands to the boxplot () command. We have used some of these commands in previous tutorials: • The main command assigns a title • the xlab command assigns the label for the x-axis • the ylab command assigns the label for the y-axis • the ylim command defines the minimum and maximum values for the y-axis • the col command can be used to fill the boxplots with a color The output for the boxplots is included on the next page. The code used in this example is: boxplot (Depression$Time~Depression$Treat, main="Distribution of Days Until First Recurrence by Treatment Groups",xlab="Treatment",ylab="Days Until First Recurrence",ylim=c(0,300),col="green")
- 9. STAT100 – Tutorial for Problem Set 4 9
- 10. STAT100 – Tutorial for Problem Set 4 10 Additional Formatting Options for Boxplots in RStudio Rather than producing vertical boxplots in RStudio, you can adjust the command to create horizontal boxplots. Screenshot example 6: The subcommand horizontal = TRUE changes the orientation of the boxplot from vertical to horizontal. Note that when the orientation of the boxplot is horizontal, the labels of the x-axis and y-axis need to be switched, but the ylim () command does NOT need to be changed. The output for the boxplots is included on the next page. The code used in this example is: boxplot (Depression$Time~Depression$Treat, main="Distribution of Days Until First Recurrence by Treatment Groups",ylab="Treatment",xlab="Days Until First Recurrence",ylim=c(0,300),col="green",horizontal = TRUE)
- 11. STAT100 – Tutorial for Problem Set 4 11 Interpreting these side-by-side boxplots: These boxplots show that the median days until first recurrence for patients who received Imipramine is about 70, while the median days until first recurrence for patients who received Lithium or a placebo are much lower, below 25 and about the same as Q1 for the Imipramine patients. You can use the supplemental descriptive statistics generated earlier to identify the exact values of Q1, Q2, Q3, etc. for the different treatment groups. These results show that at least 50% of patients who received Lithium or a placebo had a recurrence of depression less than 23 days after the treatment, but only 25% of the Imipramine patients had a recurrence of depression less than 23 days after the treatment. This indicates that, on average, patients who received Imipramine went longer before recurrence of depression as compared to the other treatment groups. There is also a wider distribution (more spread) of days until first recurrence for Imipramine patients as compared to the other groups. For example, the maximum days until first recurrence for Imipramine patients is over 200, while the maximum days until first recurrence for the patients who received Lithium or a placebo is well below 170. This provides additional evidence that patients who received Imipramine went longer before recurrence of depression when compared to the other treatment groups. Based on these large differences between the distributions of days until first recurrence for the different treatment groups, we conclude that there is likely a relationship between the depression treatment in this study and the time until patients have a recurrence of depression.
- 12. STAT100 – Tutorial for Problem Set 4 12 Generating Scatterplots and Correlation Coefficients in RStudio The Q -> Q case involves a quantitative explanatory variable and a quantitative response variable. To examine a potential relationship between two variables in the Q -> Q case, we use a scatterplot supplemented by the correlation coefficient and the least-squares linear regression equation. Screenshot example 7: This screenshot illustrates how to generate a scatterplot and correlation coefficient for two quantitative variables in the same data set. The plot() command is used for a scatterplot, with the quantitative explanatory variable listed first, then a comma, then the quantitative response variable. The screenshot below produces a scatterplot with default formatting settings. In this example the AcuteT variable is the explanatory variable and the Time variable is the response variable. The AcuteT variable measures the time in days that a patient was depressed prior to the study. To produce a correlation coefficient in RStudio, use the cor() command. The order of the listed variables will not affect the coefficient value produced by the cor() command, but for consistency we will list the quantitative explanatory variable, then a comma, then the quantitative response variable. Note that the value of the correlation coefficient is listed as output in the RStudio Console. In this example the correlation coefficient is r = -0.1269. The output for the scatterplot is included on the next page. The code used in this example is: plot (Depression$AcuteT,Depression$Time) cor (Depression$AcuteT,Depression$Time)
- 13. STAT100 – Tutorial for Problem Set 4 13
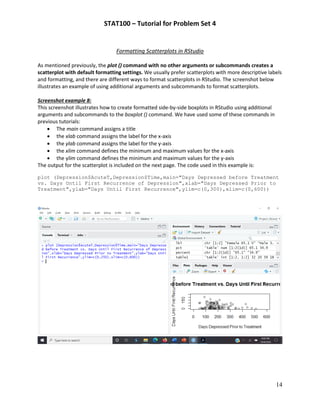
- 14. STAT100 – Tutorial for Problem Set 4 14 Formatting Scatterplots in RStudio As mentioned previously, the plot () command with no other arguments or subcommands creates a scatterplot with default formatting settings. We usually prefer scatterplots with more descriptive labels and formatting, and there are different ways to format scatterplots in RStudio. The screenshot below illustrates an example of using additional arguments and subcommands to format scatterplots. Screenshot example 8: This screenshot illustrates how to create formatted side-by-side boxplots in RStudio using additional arguments and subcommands to the boxplot () command. We have used some of these commands in previous tutorials: • The main command assigns a title • the xlab command assigns the label for the x-axis • the ylab command assigns the label for the y-axis • the xlim command defines the minimum and maximum values for the x-axis • the ylim command defines the minimum and maximum values for the y-axis The output for the scatterplot is included on the next page. The code used in this example is: plot (Depression$AcuteT,Depression$Time,main="Days Depressed before Treatment vs. Days Until First Recurrence of Depression",xlab="Days Depressed Prior to Treatment",ylab="Days Until First Recurrence",ylim=c(0,300),xlim=c(0,600))
- 15. STAT100 – Tutorial for Problem Set 4 15
- 16. STAT100 – Tutorial for Problem Set 4 16 Generating the Least-Squares Linear Regression Equation in RStudio The Q -> Q case involves a quantitative explanatory variable and a quantitative response variable. To examine a potential relationship between two variables in the Q -> Q case, we use a scatterplot supplemented by the correlation coefficient and the least-squares linear regression equation. Screenshot example 9: This screenshot illustrates how to generate the coefficients of a least-squares linear regression equation for two quantitative variables in the same data set, and to include a least-squares linear regression line in a scatterplot. The lm() command is used, with the quantitative response variable listed first, then a ~ symbol, then the quantitative explanatory variable listed second. In this example the AcuteT variable is the explanatory variable and the Time variable is the response variable. Note that the regression coefficients are listed as output in the RStudio Console after using the lm() command. The lm() command calculates various parameters related to linear regression but does not display all of the parameters. The screenshot below shows how to use the abline () command to draws the regression line in the scatterplot. The output for the scatterplot is included on the next page. The code used in this example is: lm (Depression$Time~Depression$AcuteT) L=lm (Depression$Time~Depression$AcuteT) abline(L) The regression equation for this example would be written as: Days Until First Recurrence = 58.5171 – 0.0646(Days Depressed Prior to Treatment)
- 17. STAT100 – Tutorial for Problem Set 4 17 Regression equation: Days Until First Recurrence = 58.5171 – 0.0646(Days Depressed Prior to Treatment) Correlation Coefficient: r = -0.1269 Interpreting the scatterplot, correlation coefficient and least-squares regressions: For the Q -> Q case, we use a scatterplot supplemented by the correlation coefficient and the least-squares linear regression equation. First, it is recommended practice to clearly identify and summarize all three components (scatterplot with regression line, regression equation, and correlation coefficient), as done above. The interpretation of the potential relationship should begin with the scatterplot, then supplemented by the correlation coefficient and regression equation. In this example, the scatterplot appears to indicate a rather weak negative relationship between days depressed prior to treatment and days until first recurrence of depression. This can be seen by noticing how spread out the points in the scatterplot are, without a strong linear shape, although there does appear to be a slight negative relationship. This is confirmed by the value of the correlation coefficient (r = -0.1269), which is interpreted as a weak negative linear relationship. The regression equation further conforms this; the interpretation of the slope of the regression equation is that for every additional one day depressed prior to treatment, we would expect a patient to have 0.0646 fewer days until the first recurrence of depression. The value of the slope is very close to zero (-0.0646), meaning that there is almost no noticeable relationship between days depressed prior to treatment and days until first recurrence of depression. We can also use the regression equation to make predictions, which is shown on the next page.
- 18. STAT100 – Tutorial for Problem Set 4 18 Regression equation: Days Until First Recurrence = 58.5171 – 0.0646(Days Depressed Prior to Treatment) We can use this regression equation to predict the days until first recurrence of depression for a patient with a given number of days depressed prior to treatment. For example, if we want to predict the days until first recurrence of depression for a patient who was depressed 200 days prior to treatment, we substitute 200 for the value of days depressed prior to treatment in the regression equation. Showing work: Days Until First Recurrence = 58.5171 – 0.0646(Days Depressed Prior to Treatment) Days Until First Recurrence = 58.5171 – 0.0646(200) = 45.5971 Thus, we predict that a patient who was depressed 200 days prior to treatment would have 45.60 days until first recurrence of depression. Based on the weak linear relationship as illustrated in the scatterplot, correlation coefficient and regression equation, we conclude that there is likely a very weak relationship between days depressed prior to treatment and days until first recurrence of depression. Try on your own: You should use the Depression data set to examine potential relationships between different pairs of variables. Follow the guidance and instructions in this tutorial to determine which data displays and/or numeric values are needed for the role-type classification for each pair of variables.