The Number Line
The Number Line
Just like assigning address to houses on a street we assign
addresses to points on a line.
The Number Line
Just like assigning address to houses on a street we assign
addresses to points on a line.
We assign 0 to the “center” of the line, and we call it the origin.
0
the origin
The Number Line
Just like assigning address to houses on a street we assign
addresses to points on a line.
We assign 0 to the “center” of the line, and we call it the origin.
We assign the directions with signs, positive numbers to the
right (East)
20 1 3
+
the origin
The Number Line
Just like assigning address to houses on a street we assign
addresses to points on a line.
We assign 0 to the “center” of the line, and we call it the origin.
We assign the directions with signs, positive numbers to the
right (East) and negative numbers to the left (West).
-2 20 1 3
+
-1-3
–
the origin
2½
The Number Line
Just like assigning address to houses on a street we assign
addresses to points on a line.
We assign 0 to the “center” of the line, and we call it the origin.
We assign the directions with signs, positive numbers to the
right (East) and negative numbers to the left (West).
-2 20 1 3
+
-1-3
–
2/3 2½
the origin
The Number Line
Just like assigning address to houses on a street we assign
addresses to points on a line.
We assign 0 to the “center” of the line, and we call it the origin.
We assign the directions with signs, positive numbers to the
right (East) and negative numbers to the left (West).
-2 20 1 3
+
-1-3
–
2/3 2½ π  3.14..–π  –3.14..
the origin
The Number Line
Just like assigning address to houses on a street we assign
addresses to points on a line.
We assign 0 to the “center” of the line, and we call it the origin.
We assign the directions with signs, positive numbers to the
right (East) and negative numbers to the left (West).
-2 20 1 3
+
-1-3
–
2/3 2½ π  3.14..
This line with each position addressed by a number is called
the number line.
–π  –3.14..
the origin
The Number Line
Just like assigning address to houses on a street we assign
addresses to points on a line.
We assign 0 to the “center” of the line, and we call it the origin.
We assign the directions with signs, positive numbers to the
right (East) and negative numbers to the left (West).
-2 20 1 3
+
-1-3
–
2/3 2½ π  3.14..
This line with each position addressed by a number is called
the number line. Given two numbers and their positions on the
number line, we define the number R to the right to be greater
than the number L to the left and we write that “L < R”.
–π  –3.14..
the origin
+– L R
The Number Line
Just like assigning address to houses on a street we assign
addresses to points on a line.
We assign 0 to the “center” of the line, and we call it the origin.
We assign the directions with signs, positive numbers to the
right (East) and negative numbers to the left (West).
-2 20 1 3
+
-1-3
–
2/3 2½ π  3.14..
This line with each position addressed by a number is called
the number line. Given two numbers and their positions on the
number line, we define the number R to the right to be greater
than the number L to the left and we write that “L < R”.
–π  –3.14..
the origin
+– L R<
The Number Line
Just like assigning address to houses on a street we assign
addresses to points on a line.
We assign 0 to the “center” of the line, and we call it the origin.
We assign the directions with signs, positive numbers to the
right (East) and negative numbers to the left (West).
-2 20 1 3
+
-1-3
–
2/3 2½ π  3.14..
This line with each position addressed by a number is called
the number line. Given two numbers and their positions on the
number line, we define the number R to the right to be greater
than the number L to the left and we write that “L < R”.
–π  –3.14..
the origin
+– –1–2
<For example,
–2 is to the left of –1,
so written in the natural–form “–2 < –1”.
0
L R<
The Number Line
Just like assigning address to houses on a street we assign
addresses to points on a line.
We assign 0 to the “center” of the line, and we call it the origin.
We assign the directions with signs, positive numbers to the
right (East) and negative numbers to the left (West).
-2 20 1 3
+
-1-3
–
2/3 2½ π  3.14..
This line with each position addressed by a number is called
the number line. Given two numbers and their positions on the
number line, we define the number R to the right to be greater
than the number L to the left and we write that “L < R”.
–π  –3.14..
the origin
+– –1–2
<For example,
–2 is to the left of –1,
so written in the natural–form “–2 < –1”. This may be written
less preferably in the reversed direction as –1 > –2.
0
L R<
Example A. 2 < 4, –3< –2, 0 > –1 are true statements
The Number Line
Example A. 2 < 4, –3< –2, 0 > –1 are true statements
and –2 < –5 , 5 < 3 are false statements.
The Number Line
Example A. 2 < 4, –3< –2, 0 > –1 are true statements
and –2 < –5 , 5 < 3 are false statements.
If we want all the numbers greater than 5, we may denote them
as "all number x where 5 < x".
The Number Line
Example A. 2 < 4, –3< –2, 0 > –1 are true statements
and –2 < –5 , 5 < 3 are false statements.
If we want all the numbers greater than 5, we may denote them
as "all number x where 5 < x". We write "a < x" for all the
numbers x greater than a, but not including a.
The Number Line
Example A. 2 < 4, –3< –2, 0 > –1 are true statements
and –2 < –5 , 5 < 3 are false statements.
If we want all the numbers greater than 5, we may denote them
as "all number x where 5 < x". We write "a < x" for all the
numbers x greater than a, but not including a. In picture,
+–
a
open dot
a < x
The Number Line
Example A. 2 < 4, –3< –2, 0 > –1 are true statements
and –2 < –5 , 5 < 3 are false statements.
If we want all the numbers greater than 5, we may denote them
as "all number x where 5 < x". We write "a < x" for all the
numbers x greater than a, but not including a. In picture,
+–
a
open dot
If we want all the numbers x greater than or equal to a
(including a), we write it as a < x.
a < x
The Number Line
Example A. 2 < 4, –3< –2, 0 > –1 are true statements
and –2 < –5 , 5 < 3 are false statements.
If we want all the numbers greater than 5, we may denote them
as "all number x where 5 < x". We write "a < x" for all the
numbers x greater than a, but not including a. In picture,
+–
a
open dot
If we want all the numbers x greater than or equal to a
(including a), we write it as a < x. In picture
+–
a
solid dot
a < x
a < x
The numbers x fit the description a < x < b where a < b are all
the numbers x between a and b.
+–
a b
The Number Line
Example A. 2 < 4, –3< –2, 0 > –1 are true statements
and –2 < –5 , 5 < 3 are false statements.
If we want all the numbers greater than 5, we may denote them
as "all number x where 5 < x". We write "a < x" for all the
numbers x greater than a, but not including a. In picture,
+–
a
open dot
If we want all the numbers x greater than or equal to a
(including a), we write it as a < x. In picture
+–
a
solid dot
a < x
a < x
The numbers x fit the description a < x < b where a < b are all
the numbers x between a and b.
+–
a a < x < b b
The Number Line
Example A. 2 < 4, –3< –2, 0 > –1 are true statements
and –2 < –5 , 5 < 3 are false statements.
If we want all the numbers greater than 5, we may denote them
as "all number x where 5 < x". We write "a < x" for all the
numbers x greater than a, but not including a. In picture,
+–
a
open dot
If we want all the numbers x greater than or equal to a
(including a), we write it as a < x. In picture
+–
a
solid dot
a < x
a < x
The numbers x fit the description a < x < b where a < b are all
the numbers x between a and b. A line segment as such is
called an interval.
+–
a a < x < b b
The Number Line
Example B.
a. Draw –1 < x < 3.
The Number Line
Example B.
a. Draw –1 < x < 3.
It’s in the natural form.
The Number Line
Example B.
a. Draw –1 < x < 3.
It’s in the natural form. Mark the numbers and x on the line
in order accordingly.
The Number Line
Example B.
a. Draw –1 < x < 3.
0 3
+
-1
–
It’s in the natural form. Mark the numbers and x on the line
in order accordingly.
The Number Line
x
Example B.
a. Draw –1 < x < 3.
0 3
+
-1
–
It’s in the natural form. Mark the numbers and x on the line
in order accordingly.
The Number Line
–1 ≤ x < 3
Example B.
a. Draw –1 < x < 3.
0 3
+
-1
–
b. Draw 0 > x > –3
It’s in the natural form. Mark the numbers and x on the line
in order accordingly.
Put it in the natural form –3 < x < 0.
The Number Line
–1 ≤ x < 3
Example B.
a. Draw –1 < x < 3.
0 3
+
-1
–
b. Draw 0 > x > –3
It’s in the natural form. Mark the numbers and x on the line
in order accordingly.
Put it in the natural form –3 < x < 0.
Then mark the numbers and x in order accordingly.
The Number Line
–1 ≤ x < 3
Example B.
a. Draw –1 < x < 3.
0 3
+
-1
–
b. Draw 0 > x > –3
0
+
-3
–
It’s in the natural form. Mark the numbers and x on the line
in order accordingly.
Put it in the natural form –3 < x < 0.
Then mark the numbers and x in order accordingly.
The Number Line
–1 ≤ x < 3
Example B.
a. Draw –1 < x < 3.
0 3
+
-1
–
b. Draw 0 > x > –3
0
+
-3
–
Put it in the natural form –3 < x < 0.
Then mark the numbers and x in order accordingly.
The Number Line
–1 ≤ x < 3
It’s in the natural form. Mark the numbers and x on the line
in order accordingly.
–3 < x < 0
Example B.
a. Draw –1 < x < 3.
0 3
+
-1
–
b. Draw 0 > x > –3
0
+
-3
–
Expressions such as 2 < x > 3 or 2 < x < –3 do not have any
solution meaning that there isn’t any number that would fit the
description hence there is nothing to draw.
Put it in the natural form –3 < x < 0.
Then mark the numbers and x in order accordingly.
The Number Line
–1 ≤ x < 3
It’s in the natural form. Mark the numbers and x on the line
in order accordingly.
–3 < x < 0
The number line converts numbers to picture and in order for
the pictures to be helpful, certain accuracy is required when
they are drawn by hand.
Following are two skills for drawing and scaling a line segment.
The Number Line
Following are two skills for drawing and scaling a line segment.
* Find the midpoint that cuts the segment in two equal pieces.
The Number Line
Following are two skills for drawing and scaling a line segment.
* Find the midpoint that cuts the segment in two equal pieces.
The Number Line
Following are two skills for drawing and scaling a line segment.
* Find the midpoint that cuts the segment in two equal pieces.
* Find the two points that cut the segment in three equal pieces.
The Number Line
Following are two skills for drawing and scaling a line segment.
* Find the midpoint that cuts the segment in two equal pieces.
* Find the two points that cut the segment in three equal pieces.
The Number Line
Following are two skills for drawing and scaling a line segment.
* Find the midpoint that cuts the segment in two equal pieces.
* Find the two points that cut the segment in three equal pieces.
The Number Line
To cut a line segment into 4 pieces, cut it in half, then cut each
half into two.
Following are two skills for drawing and scaling a line segment.
* Find the midpoint that cuts the segment in two equal pieces.
* Find the two points that cut the segment in three equal pieces.
The Number Line
To cut a line segment into 4 pieces, cut it in half, then cut each
half into two.
Following are two skills for drawing and scaling a line segment.
* Find the midpoint that cuts the segment in two equal pieces.
* Find the two points that cut the segment in three equal pieces.
The Number Line
To cut a line segment into 4 pieces, cut it in half, then cut each
half into two.
Following are two skills for drawing and scaling a line segment.
* Find the midpoint that cuts the segment in two equal pieces.
* Find the two points that cut the segment in three equal pieces.
The Number Line
To cut a line segment into 4 pieces, cut it in half, then cut each
half into two. Each small segment is 1/4 of the original.
To cut a line segment K into 6 pieces, cut K in half, then cut
each half into 3 pieces.
K
Following are two skills for drawing and scaling a line segment.
* Find the midpoint that cuts the segment in two equal pieces.
* Find the two points that cut the segment in three equal pieces.
The Number Line
To cut a line segment into 4 pieces, cut it in half, then cut each
half into two. Each small segment is 1/4 of the original.
To cut a line segment K into 6 pieces, cut K in half, then cut
each half into 3 pieces. Each smaller segment is 1/6 of K.
K
If we divide each segment into two again, we would have
12 segments which may represent a ruler of one foot divided
into 12 inches.
The Number Line
To plot a list of numbers on a number line, first select a suitable
scale based on the numbers.
The Number Line
Example C. We record the following temperatures
during the year: 35o, –40o, 27o, –25o, 16o, 21o.
Draw a vertical scale with appropriate spacing
representing temperature then plot these numbers.
To plot a list of numbers on a number line, first select a suitable
scale based on the numbers.
The Number Line
To plot a list of numbers on a number line, first select a suitable
scale based on the numbers. For example, based on the list,
we may set the size between two markers on the line
to be 5, or 10, or 50, or 100, etc.. for easier plotting,
Example C. We record the following temperatures
during the year: 35o, –40o, 27o, –25o, 16o, 21o.
Draw a vertical scale with appropriate spacing
representing temperature then plot these numbers.
Order the numbers first:
The Number Line
To plot a list of numbers on a number line, first select a suitable
scale based on the numbers. For example, based on the list,
we may set the size between two markers on the line
to be 5, or 10, or 50, or 100, etc.. for easier plotting,
Example C. We record the following temperatures
during the year: 35o, –40o, 27o, –25o, 16o, 21o.
Draw a vertical scale with appropriate spacing
representing temperature then plot these numbers.
Order the numbers first: –40, –25, 16, 21, 27, and 35.
The furthest we need to plot from the origin is –40
hence using 10 as the spacing between the markers is
reasonable.
The Number Line
To plot a list of numbers on a number line, first select a suitable
scale based on the numbers. For example, based on the list,
we may set the size between two markers on the line
to be 5, or 10, or 50, or 100, etc.. for easier plotting,
Example C. We record the following temperatures
during the year: 35o, –40o, 27o, –25o, 16o, 21o.
Draw a vertical scale with appropriate spacing
representing temperature then plot these numbers.
Order the numbers first: –40, –25, 16, 21, 27, and 35.
The furthest we need to plot from the origin is –40
hence using 10 as the spacing between the markers is
reasonable. Draw a line and label its center as 0.
0o
The Number Line
To plot a list of numbers on a number line, first select a suitable
scale based on the numbers. For example, based on the list,
we may set the size between two markers on the line
to be 5, or 10, or 50, or 100, etc.. for easier plotting,
Example C. We record the following temperatures
during the year: 35o, –40o, 27o, –25o, 16o, 21o.
Draw a vertical scale with appropriate spacing
representing temperature then plot these numbers.
Order the numbers first: –40, –25, 16, 21, 27, and 35.
The furthest we need to plot from the origin is –40
hence using 10 as the spacing between the markers is
reasonable. Draw a line and label its center as 0.
Draw two markers close to the two ends and label them
as ±40.
0o
40o
–40o
The Number Line
To plot a list of numbers on a number line, first select a suitable
scale based on the numbers. For example, based on the list,
we may set the size between two markers on the line
to be 5, or 10, or 50, or 100, etc.. for easier plotting,
Example C. We record the following temperatures
during the year: 35o, –40o, 27o, –25o, 16o, 21o.
Draw a vertical scale with appropriate spacing
representing temperature then plot these numbers.
Order the numbers first: –40, –25, 16, 21, 27, and 35.
The furthest we need to plot from the origin is –40
hence using 10 as the spacing between the markers is
reasonable. Draw a line and label its center as 0.
Draw two markers close to the two ends and label them
as ±40. Divide each segment into fourths for ±10,
±20, and ±30.
0o
40o
–40o
20o
–20o
10o
30o
–10o
–30o
The Number Line
To plot a list of numbers on a number line, first select a suitable
scale based on the numbers. For example, based on the list,
we may set the size between two markers on the line
to be 5, or 10, or 50, or 100, etc.. for easier plotting,
Example C. We record the following temperatures
during the year: 35o, –40o, 27o, –25o, 16o, 21o.
Draw a vertical scale with appropriate spacing
representing temperature then plot these numbers.
Order the numbers first: –40, –25, 16, 21, 27, and 35.
The furthest we need to plot from the origin is –40
hence using 10 as the spacing between the markers is
reasonable. Draw a line and label its center as 0.
Draw two markers close to the two ends and label them
as ±40. Divide each segment into fourths for ±10,
±20, and ±30. Use this scale to plot the numbers to
obtain a reasonable picture as shown.
0o
40o
–40o
20o
–20o
10o
30o
–10o
–30o
–40o
–25o
The Number Line
To plot a list of numbers on a number line, first select a suitable
scale based on the numbers. For example, based on the list,
we may set the size between two markers on the line
to be 5, or 10, or 50, or 100, etc.. for easier plotting,
Example C. We record the following temperatures
during the year: 35o, –40o, 27o, –25o, 16o, 21o.
Draw a vertical scale with appropriate spacing
representing temperature then plot these numbers.
Order the numbers first: –40, –25, 16, 21, 27, and 35.
The furthest we need to plot from the origin is –40
hence using 10 as the spacing between the markers is
reasonable. Draw a line and label its center as 0.
Draw two markers close to the two ends and label them
as ±40. Divide each segment into fourths for ±10,
±20, and ±30. Use this scale to plot the numbers to
obtain a reasonable picture as shown.
0o
40o
–40o
20o
–20o
10o
30o
–10o
–30o
35o
–40o
–25o
16o
21o
27o
The Number Line
Here are two important formulas about the number line.
The Number Line
Here are two important formulas about the number line.
Using a ruler we compute the length of a stick S by subtraction.
S
The Number Line
Ruler
Here are two important formulas about the number line.
Using a ruler we compute the length of a stick S by subtraction.
3
S
44
The Number Line
Ruler
Here are two important formulas about the number line.
Using a ruler we compute the length of a stick S by subtraction.
For example, the length of S
shown here is 44 – 3 = 41
which is the also distance from one end to the other.
3
S
44
The Number Line
Ruler
Here are two important formulas about the number line.
Using a ruler we compute the length of a stick S by subtraction.
For example, the length of S
shown here is 44 – 3 = 41
which is the also distance from one end to the other.
3
S
I. The Distance Formula.
The distance between two positions on the number line is
R – L where R is number to the right and L is number to the left.
44
The Number Line
Ruler
Here are two important formulas about the number line.
Example D.
a. Town A and town B are as shown on a map. What is the
distance between them?
Using a ruler we compute the length of a stick S by subtraction.
For example, the length of S
shown here is 44 – 3 = 41
which is the also distance from one end to the other.
3
S
I. The Distance Formula.
The distance between two positions on the number line is
R – L where R is number to the right and L is number to the left.
35 mi 97 mA B
44
0
The distance between them is 97 – 35 = 62 miles.
b. What is the distance between the points u = –3 and v = 25?
u v
–3 25
0
The Number Line
Ruler
Here are two important formulas about the number line.
Example D.
a. Town A and town B are as shown on a map. What is the
distance between them?
Using a ruler we compute the length of a stick S by subtraction.
For example, the length of S
shown here is 44 – 3 = 41
which is the also distance from one end to the other.
3
S
I. The Distance Formula.
The distance between two positions on the number line is
R – L where R is number to the right and L is number to the left.
35 mi 97 mA B
44
0
The distance between them is 97 – 35 = 62 miles.
b. What is the distance between the points u = –3 and v = 25?
The point v = 25 is to the right of u = –3,
so the distance is the 25 – (–3) = 28.
u v
–3 25
0
The Number Line
Ruler
Here are two important formulas about the number line.
Example D.
a. Town A and town B are as shown on a map. What is the
distance between them?
Using a ruler we compute the length of a stick S by subtraction.
For example, the length of S
shown here is 44 – 3 = 41
which is the also distance from one end to the other.
3
S
I. The Distance Formula.
The distance between two positions on the number line is
R – L where R is number to the right and L is number to the left.
35 mi 97 mA B
44
0
The distance between them is 97 – 35 = 62 miles.
b. What is the distance between the points u = –3 and v = 25?
The point v = 25 is to the right of u = –3,
so the distance is the 25 – (–3) = 28. R – L = 28
u v
–3 25
0
The Number Line
II. The Midpoint Formula.
The midpoint between two points a and b is (a + b)/2,
The Number Line
a
II. The Midpoint Formula.
The midpoint between two points a and b is (a + b)/2,
b
The Number Line
a a + b
II. The Midpoint Formula.
The midpoint between two points a and b is (a + b)/2,
b
2
the midpoint
The Number Line
a a + b b
2
the midpoint
II. The Midpoint Formula.
The midpoint between two points a and b is (a + b)/2,
this is also the average of a and b.
The Number Line
Example D.
a. Joe obtained 4 points on the 1st quiz and 7 points on the 2nd
quiz, what is the average of the two quizzes? Draw.
a a + b b
2
the midpoint
II. The Midpoint Formula.
The midpoint between two points a and b is (a + b)/2,
this is also the average of a and b.
The Number Line
Example D.
a. Joe obtained 4 points on the 1st quiz and 7 points on the 2nd
quiz, what is the average of the two quizzes? Draw.
a a + b b
The average of the two quizzes is
(4 + 7)/2 = 11/ 2 = 5.5
which is the midpoint of 4 and 7.
2
the midpoint
II. The Midpoint Formula.
The midpoint between two points a and b is (a + b)/2,
this is also the average of a and b.
The Number Line
Example D.
a. Joe obtained 4 points on the 1st quiz and 7 points on the 2nd
quiz, what is the average of the two quizzes? Draw.
a a + b
4
b
The average of the two quizzes is
(4 + 7)/2 = 11/ 2 = 5.5
which is the midpoint of 4 and 7.
2
the midpoint
7
II. The Midpoint Formula.
The midpoint between two points a and b is (a + b)/2,
this is also the average of a and b.
The Number Line
Example D.
a. Joe obtained 4 points on the 1st quiz and 7 points on the 2nd
quiz, what is the average of the two quizzes? Draw.
a a + b
4
b
the midpointThe average of the two quizzes is
(4 + 7)/2 = 11/ 2 = 5.5
which is the midpoint of 4 and 7.
2
the midpoint
7
5.5
II. The Midpoint Formula.
The midpoint between two points a and b is (a + b)/2,
this is also the average of a and b.
The Number Line
Example D.
a. Joe obtained 4 points on the 1st quiz and 7 points on the 2nd
quiz, what is the average of the two quizzes? Draw.
a a + b
4
b
the midpointThe average of the two quizzes is
(4 + 7)/2 = 11/ 2 = 5.5
which is the midpoint of 4 and 7.
b. Find the midpoints between u = –3 and v = 25?
2
the midpoint
7
5.5
–3 0 25
the midpoint
II. The Midpoint Formula.
The midpoint between two points a and b is (a + b)/2,
this is also the average of a and b.
The Number Line
Example D.
a. Joe obtained 4 points on the 1st quiz and 7 points on the 2nd
quiz, what is the average of the two quizzes? Draw.
a a + b
4
b
the midpointThe average of the two quizzes is
(4 + 7)/2 = 11/ 2 = 5.5
which is the midpoint of 4 and 7.
b. Find the midpoints between u = –3 and v = 25?
Their midpoint is (25 + (–3))/2 = 22/2 = 11.
2
the midpoint
7
5.5
–3 0 25
11
the midpoint
II. The Midpoint Formula.
The midpoint between two points a and b is (a + b)/2,
this is also the average of a and b.
Exercise. A. Draw the following Inequalities. Indicate clearly
whether the end points are included or not.
1. x < 3 2. –5 ≤ x 3. x < –8 4. x ≤ 12
B. Write in the natural form then draw them.
5. x ≥ 3 6. –5 > x 7. x ≥ –8 8. x > 12
C. Draw the following intervals, state so if it is impossible.
9. 6 > x ≥ 3 10. –5 < x ≤ 2 11. 1 > x ≥ –8 12. 4 < x ≤ 2
13. 6 > x ≥ 8 14. –5 > x ≤ 2 15. –7 ≤ x ≤ –3 16. –7 ≤ x ≤ –9
D. Solve the following Inequalities and draw the solution.
17. x + 5 < 3 18. –5 ≤ 2x + 3 19. 3x + 1 < –8
20. 2x + 3 ≤ 12 – x 21. –3x + 5 ≥ 1 – 4x
22. 2(x + 2) ≥ 5 – (x – 1) 23. 3(x – 1) + 2 ≤ – 2x – 9
24. –2(x – 3) > 2(–x – 1) + 3x 25. –(x + 4) – 2 ≤ 4(x – 1)
26. x + 2(x – 3) < 2(x – 1) – 2
27. –2(x – 3) + 3 ≥ 2(x – 1) + 3x + 13

More Related Content

PPTX
PPTX
Lesson 1 addition and subtraction of radicals
PPT
Tangents of circle
PPTX
Circles
PPTX
Similarity on right triangle
PPTX
Circles PPT
PPTX
4 2 rules of radicals
PPT
Simplifying Radicals
Lesson 1 addition and subtraction of radicals
Tangents of circle
Circles
Similarity on right triangle
Circles PPT
4 2 rules of radicals
Simplifying Radicals

What's hot (20)

PPT
Similar figures and_proportions
PPTX
12.4 probability of compound events
PPT
7.3 proving triangles similar
PPT
The Properties Of A Rhombus
PPTX
Surface area and volume of a cylinder
PPTX
Finding the slope of a line
PPT
area related to circle
PDF
Properties of Parallelogram
PPT
Simplifying Rational Expression
PPTX
theorems on tangents, Secants and segments of a circles 1.pptx
PPT
Congruent triangles
PPT
Complex Numbers
PDF
Lesson plan pdf
PDF
5.4 Solving Right Triangles
PPT
Area of sectors & segment ananya
PPTX
45 45-90 triangles
PPT
PPT
Standard-Position-of-an-Angle-FULL.ppt
PPTX
Probability class 10
PPTX
Similar figures and_proportions
12.4 probability of compound events
7.3 proving triangles similar
The Properties Of A Rhombus
Surface area and volume of a cylinder
Finding the slope of a line
area related to circle
Properties of Parallelogram
Simplifying Rational Expression
theorems on tangents, Secants and segments of a circles 1.pptx
Congruent triangles
Complex Numbers
Lesson plan pdf
5.4 Solving Right Triangles
Area of sectors & segment ananya
45 45-90 triangles
Standard-Position-of-an-Angle-FULL.ppt
Probability class 10
Ad

Similar to 54 the number line (20)

PPTX
53 the real line
PPTX
2 linear inequalities x
PPTX
2 6 inequalities
PPTX
55 inequalities and comparative statements
PPTX
2 the real line, inequalities and comparative phrases
PPTX
3 1 the real line and linear inequalities-x
PPTX
41 interval notation and review on inequalities
PPTX
Integers ppt
PPTX
2. Real numbers
PPTX
Class 3 LET US REVISE
PPT
MATHH LEARNING WITH AAAchapterP_Sec3.ppt
PPTX
5 1 complex numbers-x
PPTX
PPT
Real numbers
PPT
นำเสนอจำนวนจริงเพิ่มเติม
PPTX
5 1 complex numbers
PPTX
Integers
PPT
2.1 graphing integers on a number line lesson
PPT
2.1 graphing integers on a number line lesson
53 the real line
2 linear inequalities x
2 6 inequalities
55 inequalities and comparative statements
2 the real line, inequalities and comparative phrases
3 1 the real line and linear inequalities-x
41 interval notation and review on inequalities
Integers ppt
2. Real numbers
Class 3 LET US REVISE
MATHH LEARNING WITH AAAchapterP_Sec3.ppt
5 1 complex numbers-x
Real numbers
นำเสนอจำนวนจริงเพิ่มเติม
5 1 complex numbers
Integers
2.1 graphing integers on a number line lesson
Ad

More from alg1testreview (20)

PPTX
56 system of linear equations
PPTX
55 addition and subtraction of rational expressions
PPTX
54 the least common multiple
PPTX
53 multiplication and division of rational expressions
PPTX
52 rational expressions
PPTX
51 basic shapes and formulas
PPTX
41 expressions
PPTX
59 constructing linea equations of lines
PPTX
57 graphing lines from linear equations
PPTX
58 slopes of lines
PPTX
56 the rectangular coordinate system
PPTX
53 pythagorean theorem and square roots
PPTX
52 about triangles
PPTX
50 solving equations by factoring
PPTX
51 ratio-proportion
PPTX
49 factoring trinomials the ac method and making lists
PPTX
48 factoring out the gcf and the grouping method
PPTX
47 operations of 2nd degree expressions and formulas
PPTX
45scientific notation
PPTX
46polynomial expressions
56 system of linear equations
55 addition and subtraction of rational expressions
54 the least common multiple
53 multiplication and division of rational expressions
52 rational expressions
51 basic shapes and formulas
41 expressions
59 constructing linea equations of lines
57 graphing lines from linear equations
58 slopes of lines
56 the rectangular coordinate system
53 pythagorean theorem and square roots
52 about triangles
50 solving equations by factoring
51 ratio-proportion
49 factoring trinomials the ac method and making lists
48 factoring out the gcf and the grouping method
47 operations of 2nd degree expressions and formulas
45scientific notation
46polynomial expressions

Recently uploaded (20)

PDF
FOISHS ANNUAL IMPLEMENTATION PLAN 2025.pdf
PDF
Vision Prelims GS PYQ Analysis 2011-2022 www.upscpdf.com.pdf
PPTX
Core Concepts of Personalized Learning and Virtual Learning Environments
PDF
Skin Care and Cosmetic Ingredients Dictionary ( PDFDrive ).pdf
PPTX
Introduction to pro and eukaryotes and differences.pptx
PDF
Mucosal Drug Delivery system_NDDS_BPHARMACY__SEM VII_PCI.pdf
PDF
LIFE & LIVING TRILOGY - PART - (2) THE PURPOSE OF LIFE.pdf
PDF
International_Financial_Reporting_Standa.pdf
PDF
advance database management system book.pdf
PDF
BP 704 T. NOVEL DRUG DELIVERY SYSTEMS (UNIT 1)
PDF
MICROENCAPSULATION_NDDS_BPHARMACY__SEM VII_PCI .pdf
PDF
1.3 FINAL REVISED K-10 PE and Health CG 2023 Grades 4-10 (1).pdf
PPTX
Unit 4 Computer Architecture Multicore Processor.pptx
DOCX
Cambridge-Practice-Tests-for-IELTS-12.docx
PPTX
Education and Perspectives of Education.pptx
PDF
medical_surgical_nursing_10th_edition_ignatavicius_TEST_BANK_pdf.pdf
PDF
Journal of Dental Science - UDMY (2021).pdf
PDF
BP 704 T. NOVEL DRUG DELIVERY SYSTEMS (UNIT 2).pdf
PDF
Empowerment Technology for Senior High School Guide
PPTX
What’s under the hood: Parsing standardized learning content for AI
FOISHS ANNUAL IMPLEMENTATION PLAN 2025.pdf
Vision Prelims GS PYQ Analysis 2011-2022 www.upscpdf.com.pdf
Core Concepts of Personalized Learning and Virtual Learning Environments
Skin Care and Cosmetic Ingredients Dictionary ( PDFDrive ).pdf
Introduction to pro and eukaryotes and differences.pptx
Mucosal Drug Delivery system_NDDS_BPHARMACY__SEM VII_PCI.pdf
LIFE & LIVING TRILOGY - PART - (2) THE PURPOSE OF LIFE.pdf
International_Financial_Reporting_Standa.pdf
advance database management system book.pdf
BP 704 T. NOVEL DRUG DELIVERY SYSTEMS (UNIT 1)
MICROENCAPSULATION_NDDS_BPHARMACY__SEM VII_PCI .pdf
1.3 FINAL REVISED K-10 PE and Health CG 2023 Grades 4-10 (1).pdf
Unit 4 Computer Architecture Multicore Processor.pptx
Cambridge-Practice-Tests-for-IELTS-12.docx
Education and Perspectives of Education.pptx
medical_surgical_nursing_10th_edition_ignatavicius_TEST_BANK_pdf.pdf
Journal of Dental Science - UDMY (2021).pdf
BP 704 T. NOVEL DRUG DELIVERY SYSTEMS (UNIT 2).pdf
Empowerment Technology for Senior High School Guide
What’s under the hood: Parsing standardized learning content for AI

54 the number line

  • 2. The Number Line Just like assigning address to houses on a street we assign addresses to points on a line.
  • 3. The Number Line Just like assigning address to houses on a street we assign addresses to points on a line. We assign 0 to the “center” of the line, and we call it the origin. 0 the origin
  • 4. The Number Line Just like assigning address to houses on a street we assign addresses to points on a line. We assign 0 to the “center” of the line, and we call it the origin. We assign the directions with signs, positive numbers to the right (East) 20 1 3 + the origin
  • 5. The Number Line Just like assigning address to houses on a street we assign addresses to points on a line. We assign 0 to the “center” of the line, and we call it the origin. We assign the directions with signs, positive numbers to the right (East) and negative numbers to the left (West). -2 20 1 3 + -1-3 – the origin
  • 6. The Number Line Just like assigning address to houses on a street we assign addresses to points on a line. We assign 0 to the “center” of the line, and we call it the origin. We assign the directions with signs, positive numbers to the right (East) and negative numbers to the left (West). -2 20 1 3 + -1-3 – the origin 2½
  • 7. The Number Line Just like assigning address to houses on a street we assign addresses to points on a line. We assign 0 to the “center” of the line, and we call it the origin. We assign the directions with signs, positive numbers to the right (East) and negative numbers to the left (West). -2 20 1 3 + -1-3 – 2/3 2½ the origin
  • 8. The Number Line Just like assigning address to houses on a street we assign addresses to points on a line. We assign 0 to the “center” of the line, and we call it the origin. We assign the directions with signs, positive numbers to the right (East) and negative numbers to the left (West). -2 20 1 3 + -1-3 – 2/3 2½ π  3.14..–π  –3.14.. the origin
  • 9. The Number Line Just like assigning address to houses on a street we assign addresses to points on a line. We assign 0 to the “center” of the line, and we call it the origin. We assign the directions with signs, positive numbers to the right (East) and negative numbers to the left (West). -2 20 1 3 + -1-3 – 2/3 2½ π  3.14.. This line with each position addressed by a number is called the number line. –π  –3.14.. the origin
  • 10. The Number Line Just like assigning address to houses on a street we assign addresses to points on a line. We assign 0 to the “center” of the line, and we call it the origin. We assign the directions with signs, positive numbers to the right (East) and negative numbers to the left (West). -2 20 1 3 + -1-3 – 2/3 2½ π  3.14.. This line with each position addressed by a number is called the number line. Given two numbers and their positions on the number line, we define the number R to the right to be greater than the number L to the left and we write that “L < R”. –π  –3.14.. the origin +– L R
  • 11. The Number Line Just like assigning address to houses on a street we assign addresses to points on a line. We assign 0 to the “center” of the line, and we call it the origin. We assign the directions with signs, positive numbers to the right (East) and negative numbers to the left (West). -2 20 1 3 + -1-3 – 2/3 2½ π  3.14.. This line with each position addressed by a number is called the number line. Given two numbers and their positions on the number line, we define the number R to the right to be greater than the number L to the left and we write that “L < R”. –π  –3.14.. the origin +– L R<
  • 12. The Number Line Just like assigning address to houses on a street we assign addresses to points on a line. We assign 0 to the “center” of the line, and we call it the origin. We assign the directions with signs, positive numbers to the right (East) and negative numbers to the left (West). -2 20 1 3 + -1-3 – 2/3 2½ π  3.14.. This line with each position addressed by a number is called the number line. Given two numbers and their positions on the number line, we define the number R to the right to be greater than the number L to the left and we write that “L < R”. –π  –3.14.. the origin +– –1–2 <For example, –2 is to the left of –1, so written in the natural–form “–2 < –1”. 0 L R<
  • 13. The Number Line Just like assigning address to houses on a street we assign addresses to points on a line. We assign 0 to the “center” of the line, and we call it the origin. We assign the directions with signs, positive numbers to the right (East) and negative numbers to the left (West). -2 20 1 3 + -1-3 – 2/3 2½ π  3.14.. This line with each position addressed by a number is called the number line. Given two numbers and their positions on the number line, we define the number R to the right to be greater than the number L to the left and we write that “L < R”. –π  –3.14.. the origin +– –1–2 <For example, –2 is to the left of –1, so written in the natural–form “–2 < –1”. This may be written less preferably in the reversed direction as –1 > –2. 0 L R<
  • 14. Example A. 2 < 4, –3< –2, 0 > –1 are true statements The Number Line
  • 15. Example A. 2 < 4, –3< –2, 0 > –1 are true statements and –2 < –5 , 5 < 3 are false statements. The Number Line
  • 16. Example A. 2 < 4, –3< –2, 0 > –1 are true statements and –2 < –5 , 5 < 3 are false statements. If we want all the numbers greater than 5, we may denote them as "all number x where 5 < x". The Number Line
  • 17. Example A. 2 < 4, –3< –2, 0 > –1 are true statements and –2 < –5 , 5 < 3 are false statements. If we want all the numbers greater than 5, we may denote them as "all number x where 5 < x". We write "a < x" for all the numbers x greater than a, but not including a. The Number Line
  • 18. Example A. 2 < 4, –3< –2, 0 > –1 are true statements and –2 < –5 , 5 < 3 are false statements. If we want all the numbers greater than 5, we may denote them as "all number x where 5 < x". We write "a < x" for all the numbers x greater than a, but not including a. In picture, +– a open dot The Number Line
  • 19. Example A. 2 < 4, –3< –2, 0 > –1 are true statements and –2 < –5 , 5 < 3 are false statements. If we want all the numbers greater than 5, we may denote them as "all number x where 5 < x". We write "a < x" for all the numbers x greater than a, but not including a. In picture, +– a open dot a < x The Number Line
  • 20. Example A. 2 < 4, –3< –2, 0 > –1 are true statements and –2 < –5 , 5 < 3 are false statements. If we want all the numbers greater than 5, we may denote them as "all number x where 5 < x". We write "a < x" for all the numbers x greater than a, but not including a. In picture, +– a open dot If we want all the numbers x greater than or equal to a (including a), we write it as a < x. a < x The Number Line
  • 21. Example A. 2 < 4, –3< –2, 0 > –1 are true statements and –2 < –5 , 5 < 3 are false statements. If we want all the numbers greater than 5, we may denote them as "all number x where 5 < x". We write "a < x" for all the numbers x greater than a, but not including a. In picture, +– a open dot If we want all the numbers x greater than or equal to a (including a), we write it as a < x. In picture +– a solid dot a < x a < x The Number Line
  • 22. Example A. 2 < 4, –3< –2, 0 > –1 are true statements and –2 < –5 , 5 < 3 are false statements. If we want all the numbers greater than 5, we may denote them as "all number x where 5 < x". We write "a < x" for all the numbers x greater than a, but not including a. In picture, +– a open dot If we want all the numbers x greater than or equal to a (including a), we write it as a < x. In picture +– a solid dot a < x a < x The numbers x fit the description a < x < b where a < b are all the numbers x between a and b. The Number Line
  • 23. Example A. 2 < 4, –3< –2, 0 > –1 are true statements and –2 < –5 , 5 < 3 are false statements. If we want all the numbers greater than 5, we may denote them as "all number x where 5 < x". We write "a < x" for all the numbers x greater than a, but not including a. In picture, +– a open dot If we want all the numbers x greater than or equal to a (including a), we write it as a < x. In picture +– a solid dot a < x a < x The numbers x fit the description a < x < b where a < b are all the numbers x between a and b. +– a b The Number Line
  • 24. Example A. 2 < 4, –3< –2, 0 > –1 are true statements and –2 < –5 , 5 < 3 are false statements. If we want all the numbers greater than 5, we may denote them as "all number x where 5 < x". We write "a < x" for all the numbers x greater than a, but not including a. In picture, +– a open dot If we want all the numbers x greater than or equal to a (including a), we write it as a < x. In picture +– a solid dot a < x a < x The numbers x fit the description a < x < b where a < b are all the numbers x between a and b. +– a a < x < b b The Number Line
  • 25. Example A. 2 < 4, –3< –2, 0 > –1 are true statements and –2 < –5 , 5 < 3 are false statements. If we want all the numbers greater than 5, we may denote them as "all number x where 5 < x". We write "a < x" for all the numbers x greater than a, but not including a. In picture, +– a open dot If we want all the numbers x greater than or equal to a (including a), we write it as a < x. In picture +– a solid dot a < x a < x The numbers x fit the description a < x < b where a < b are all the numbers x between a and b. A line segment as such is called an interval. +– a a < x < b b The Number Line
  • 26. Example B. a. Draw –1 < x < 3. The Number Line
  • 27. Example B. a. Draw –1 < x < 3. It’s in the natural form. The Number Line
  • 28. Example B. a. Draw –1 < x < 3. It’s in the natural form. Mark the numbers and x on the line in order accordingly. The Number Line
  • 29. Example B. a. Draw –1 < x < 3. 0 3 + -1 – It’s in the natural form. Mark the numbers and x on the line in order accordingly. The Number Line x
  • 30. Example B. a. Draw –1 < x < 3. 0 3 + -1 – It’s in the natural form. Mark the numbers and x on the line in order accordingly. The Number Line –1 ≤ x < 3
  • 31. Example B. a. Draw –1 < x < 3. 0 3 + -1 – b. Draw 0 > x > –3 It’s in the natural form. Mark the numbers and x on the line in order accordingly. Put it in the natural form –3 < x < 0. The Number Line –1 ≤ x < 3
  • 32. Example B. a. Draw –1 < x < 3. 0 3 + -1 – b. Draw 0 > x > –3 It’s in the natural form. Mark the numbers and x on the line in order accordingly. Put it in the natural form –3 < x < 0. Then mark the numbers and x in order accordingly. The Number Line –1 ≤ x < 3
  • 33. Example B. a. Draw –1 < x < 3. 0 3 + -1 – b. Draw 0 > x > –3 0 + -3 – It’s in the natural form. Mark the numbers and x on the line in order accordingly. Put it in the natural form –3 < x < 0. Then mark the numbers and x in order accordingly. The Number Line –1 ≤ x < 3
  • 34. Example B. a. Draw –1 < x < 3. 0 3 + -1 – b. Draw 0 > x > –3 0 + -3 – Put it in the natural form –3 < x < 0. Then mark the numbers and x in order accordingly. The Number Line –1 ≤ x < 3 It’s in the natural form. Mark the numbers and x on the line in order accordingly. –3 < x < 0
  • 35. Example B. a. Draw –1 < x < 3. 0 3 + -1 – b. Draw 0 > x > –3 0 + -3 – Expressions such as 2 < x > 3 or 2 < x < –3 do not have any solution meaning that there isn’t any number that would fit the description hence there is nothing to draw. Put it in the natural form –3 < x < 0. Then mark the numbers and x in order accordingly. The Number Line –1 ≤ x < 3 It’s in the natural form. Mark the numbers and x on the line in order accordingly. –3 < x < 0
  • 36. Example B. a. Draw –1 < x < 3. 0 3 + -1 – b. Draw 0 > x > –3 0 + -3 – Expressions such as 2 < x > 3 or 2 < x < –3 do not have any solution meaning that there isn’t any number that would fit the description hence there is nothing to draw. Put it in the natural form –3 < x < 0. Then mark the numbers and x in order accordingly. The Number Line –1 ≤ x < 3 It’s in the natural form. Mark the numbers and x on the line in order accordingly. –3 < x < 0 The number line converts numbers to picture and in order for the pictures to be helpful, certain accuracy is required when they are drawn by hand.
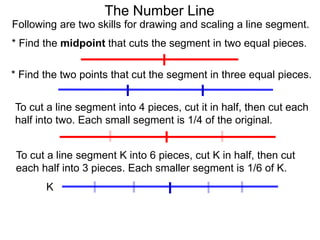
  • 37. Following are two skills for drawing and scaling a line segment. The Number Line
  • 38. Following are two skills for drawing and scaling a line segment. * Find the midpoint that cuts the segment in two equal pieces. The Number Line
  • 39. Following are two skills for drawing and scaling a line segment. * Find the midpoint that cuts the segment in two equal pieces. The Number Line
  • 40. Following are two skills for drawing and scaling a line segment. * Find the midpoint that cuts the segment in two equal pieces. * Find the two points that cut the segment in three equal pieces. The Number Line
  • 41. Following are two skills for drawing and scaling a line segment. * Find the midpoint that cuts the segment in two equal pieces. * Find the two points that cut the segment in three equal pieces. The Number Line
  • 42. Following are two skills for drawing and scaling a line segment. * Find the midpoint that cuts the segment in two equal pieces. * Find the two points that cut the segment in three equal pieces. The Number Line To cut a line segment into 4 pieces, cut it in half, then cut each half into two.
  • 43. Following are two skills for drawing and scaling a line segment. * Find the midpoint that cuts the segment in two equal pieces. * Find the two points that cut the segment in three equal pieces. The Number Line To cut a line segment into 4 pieces, cut it in half, then cut each half into two.
  • 44. Following are two skills for drawing and scaling a line segment. * Find the midpoint that cuts the segment in two equal pieces. * Find the two points that cut the segment in three equal pieces. The Number Line To cut a line segment into 4 pieces, cut it in half, then cut each half into two.
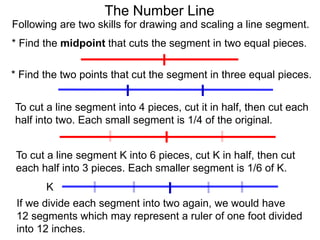
  • 45. Following are two skills for drawing and scaling a line segment. * Find the midpoint that cuts the segment in two equal pieces. * Find the two points that cut the segment in three equal pieces. The Number Line To cut a line segment into 4 pieces, cut it in half, then cut each half into two. Each small segment is 1/4 of the original.
  • 46. Following are two skills for drawing and scaling a line segment. * Find the midpoint that cuts the segment in two equal pieces. * Find the two points that cut the segment in three equal pieces. The Number Line To cut a line segment into 4 pieces, cut it in half, then cut each half into two. Each small segment is 1/4 of the original. To cut a line segment K into 6 pieces, cut K in half, then cut each half into 3 pieces. K
  • 47. Following are two skills for drawing and scaling a line segment. * Find the midpoint that cuts the segment in two equal pieces. * Find the two points that cut the segment in three equal pieces. The Number Line To cut a line segment into 4 pieces, cut it in half, then cut each half into two. Each small segment is 1/4 of the original. To cut a line segment K into 6 pieces, cut K in half, then cut each half into 3 pieces. K
  • 48. Following are two skills for drawing and scaling a line segment. * Find the midpoint that cuts the segment in two equal pieces. * Find the two points that cut the segment in three equal pieces. The Number Line To cut a line segment into 4 pieces, cut it in half, then cut each half into two. Each small segment is 1/4 of the original. To cut a line segment K into 6 pieces, cut K in half, then cut each half into 3 pieces. K
  • 49. Following are two skills for drawing and scaling a line segment. * Find the midpoint that cuts the segment in two equal pieces. * Find the two points that cut the segment in three equal pieces. The Number Line To cut a line segment into 4 pieces, cut it in half, then cut each half into two. Each small segment is 1/4 of the original. To cut a line segment K into 6 pieces, cut K in half, then cut each half into 3 pieces. Each smaller segment is 1/6 of K. K
  • 50. Following are two skills for drawing and scaling a line segment. * Find the midpoint that cuts the segment in two equal pieces. * Find the two points that cut the segment in three equal pieces. The Number Line To cut a line segment into 4 pieces, cut it in half, then cut each half into two. Each small segment is 1/4 of the original. To cut a line segment K into 6 pieces, cut K in half, then cut each half into 3 pieces. Each smaller segment is 1/6 of K. K If we divide each segment into two again, we would have 12 segments which may represent a ruler of one foot divided into 12 inches.
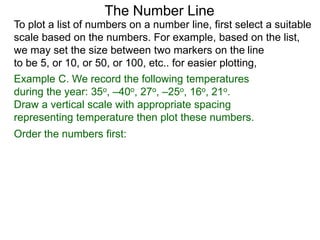
  • 51. The Number Line To plot a list of numbers on a number line, first select a suitable scale based on the numbers.
  • 52. The Number Line Example C. We record the following temperatures during the year: 35o, –40o, 27o, –25o, 16o, 21o. Draw a vertical scale with appropriate spacing representing temperature then plot these numbers. To plot a list of numbers on a number line, first select a suitable scale based on the numbers.
  • 53. The Number Line To plot a list of numbers on a number line, first select a suitable scale based on the numbers. For example, based on the list, we may set the size between two markers on the line to be 5, or 10, or 50, or 100, etc.. for easier plotting, Example C. We record the following temperatures during the year: 35o, –40o, 27o, –25o, 16o, 21o. Draw a vertical scale with appropriate spacing representing temperature then plot these numbers.
  • 54. The Number Line To plot a list of numbers on a number line, first select a suitable scale based on the numbers. For example, based on the list, we may set the size between two markers on the line to be 5, or 10, or 50, or 100, etc.. for easier plotting, Example C. We record the following temperatures during the year: 35o, –40o, 27o, –25o, 16o, 21o. Draw a vertical scale with appropriate spacing representing temperature then plot these numbers. Order the numbers first:
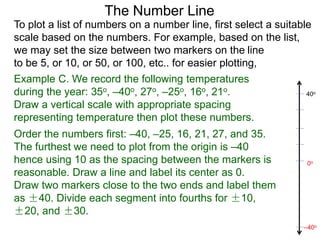
  • 55. The Number Line To plot a list of numbers on a number line, first select a suitable scale based on the numbers. For example, based on the list, we may set the size between two markers on the line to be 5, or 10, or 50, or 100, etc.. for easier plotting, Example C. We record the following temperatures during the year: 35o, –40o, 27o, –25o, 16o, 21o. Draw a vertical scale with appropriate spacing representing temperature then plot these numbers. Order the numbers first: –40, –25, 16, 21, 27, and 35.
  • 56. The Number Line To plot a list of numbers on a number line, first select a suitable scale based on the numbers. For example, based on the list, we may set the size between two markers on the line to be 5, or 10, or 50, or 100, etc.. for easier plotting, Example C. We record the following temperatures during the year: 35o, –40o, 27o, –25o, 16o, 21o. Draw a vertical scale with appropriate spacing representing temperature then plot these numbers. Order the numbers first: –40, –25, 16, 21, 27, and 35. The furthest we need to plot from the origin is –40 hence using 10 as the spacing between the markers is reasonable.
  • 57. The Number Line To plot a list of numbers on a number line, first select a suitable scale based on the numbers. For example, based on the list, we may set the size between two markers on the line to be 5, or 10, or 50, or 100, etc.. for easier plotting, Example C. We record the following temperatures during the year: 35o, –40o, 27o, –25o, 16o, 21o. Draw a vertical scale with appropriate spacing representing temperature then plot these numbers. Order the numbers first: –40, –25, 16, 21, 27, and 35. The furthest we need to plot from the origin is –40 hence using 10 as the spacing between the markers is reasonable. Draw a line and label its center as 0. 0o
  • 58. The Number Line To plot a list of numbers on a number line, first select a suitable scale based on the numbers. For example, based on the list, we may set the size between two markers on the line to be 5, or 10, or 50, or 100, etc.. for easier plotting, Example C. We record the following temperatures during the year: 35o, –40o, 27o, –25o, 16o, 21o. Draw a vertical scale with appropriate spacing representing temperature then plot these numbers. Order the numbers first: –40, –25, 16, 21, 27, and 35. The furthest we need to plot from the origin is –40 hence using 10 as the spacing between the markers is reasonable. Draw a line and label its center as 0. Draw two markers close to the two ends and label them as ±40. 0o 40o –40o
  • 59. The Number Line To plot a list of numbers on a number line, first select a suitable scale based on the numbers. For example, based on the list, we may set the size between two markers on the line to be 5, or 10, or 50, or 100, etc.. for easier plotting, Example C. We record the following temperatures during the year: 35o, –40o, 27o, –25o, 16o, 21o. Draw a vertical scale with appropriate spacing representing temperature then plot these numbers. Order the numbers first: –40, –25, 16, 21, 27, and 35. The furthest we need to plot from the origin is –40 hence using 10 as the spacing between the markers is reasonable. Draw a line and label its center as 0. Draw two markers close to the two ends and label them as ±40. Divide each segment into fourths for ±10, ±20, and ±30. 0o 40o –40o
  • 60. The Number Line To plot a list of numbers on a number line, first select a suitable scale based on the numbers. For example, based on the list, we may set the size between two markers on the line to be 5, or 10, or 50, or 100, etc.. for easier plotting, Example C. We record the following temperatures during the year: 35o, –40o, 27o, –25o, 16o, 21o. Draw a vertical scale with appropriate spacing representing temperature then plot these numbers. Order the numbers first: –40, –25, 16, 21, 27, and 35. The furthest we need to plot from the origin is –40 hence using 10 as the spacing between the markers is reasonable. Draw a line and label its center as 0. Draw two markers close to the two ends and label them as ±40. Divide each segment into fourths for ±10, ±20, and ±30. 0o 40o –40o
  • 61. The Number Line To plot a list of numbers on a number line, first select a suitable scale based on the numbers. For example, based on the list, we may set the size between two markers on the line to be 5, or 10, or 50, or 100, etc.. for easier plotting, Example C. We record the following temperatures during the year: 35o, –40o, 27o, –25o, 16o, 21o. Draw a vertical scale with appropriate spacing representing temperature then plot these numbers. Order the numbers first: –40, –25, 16, 21, 27, and 35. The furthest we need to plot from the origin is –40 hence using 10 as the spacing between the markers is reasonable. Draw a line and label its center as 0. Draw two markers close to the two ends and label them as ±40. Divide each segment into fourths for ±10, ±20, and ±30. 0o 40o –40o
  • 62. The Number Line To plot a list of numbers on a number line, first select a suitable scale based on the numbers. For example, based on the list, we may set the size between two markers on the line to be 5, or 10, or 50, or 100, etc.. for easier plotting, Example C. We record the following temperatures during the year: 35o, –40o, 27o, –25o, 16o, 21o. Draw a vertical scale with appropriate spacing representing temperature then plot these numbers. Order the numbers first: –40, –25, 16, 21, 27, and 35. The furthest we need to plot from the origin is –40 hence using 10 as the spacing between the markers is reasonable. Draw a line and label its center as 0. Draw two markers close to the two ends and label them as ±40. Divide each segment into fourths for ±10, ±20, and ±30. 0o 40o –40o 20o –20o 10o 30o –10o –30o
  • 63. The Number Line To plot a list of numbers on a number line, first select a suitable scale based on the numbers. For example, based on the list, we may set the size between two markers on the line to be 5, or 10, or 50, or 100, etc.. for easier plotting, Example C. We record the following temperatures during the year: 35o, –40o, 27o, –25o, 16o, 21o. Draw a vertical scale with appropriate spacing representing temperature then plot these numbers. Order the numbers first: –40, –25, 16, 21, 27, and 35. The furthest we need to plot from the origin is –40 hence using 10 as the spacing between the markers is reasonable. Draw a line and label its center as 0. Draw two markers close to the two ends and label them as ±40. Divide each segment into fourths for ±10, ±20, and ±30. Use this scale to plot the numbers to obtain a reasonable picture as shown. 0o 40o –40o 20o –20o 10o 30o –10o –30o –40o
  • 64. The Number Line To plot a list of numbers on a number line, first select a suitable scale based on the numbers. For example, based on the list, we may set the size between two markers on the line to be 5, or 10, or 50, or 100, etc.. for easier plotting, Example C. We record the following temperatures during the year: 35o, –40o, 27o, –25o, 16o, 21o. Draw a vertical scale with appropriate spacing representing temperature then plot these numbers. Order the numbers first: –40, –25, 16, 21, 27, and 35. The furthest we need to plot from the origin is –40 hence using 10 as the spacing between the markers is reasonable. Draw a line and label its center as 0. Draw two markers close to the two ends and label them as ±40. Divide each segment into fourths for ±10, ±20, and ±30. Use this scale to plot the numbers to obtain a reasonable picture as shown. 0o 40o –40o 20o –20o 10o 30o –10o –30o –40o –25o
  • 65. The Number Line To plot a list of numbers on a number line, first select a suitable scale based on the numbers. For example, based on the list, we may set the size between two markers on the line to be 5, or 10, or 50, or 100, etc.. for easier plotting, Example C. We record the following temperatures during the year: 35o, –40o, 27o, –25o, 16o, 21o. Draw a vertical scale with appropriate spacing representing temperature then plot these numbers. Order the numbers first: –40, –25, 16, 21, 27, and 35. The furthest we need to plot from the origin is –40 hence using 10 as the spacing between the markers is reasonable. Draw a line and label its center as 0. Draw two markers close to the two ends and label them as ±40. Divide each segment into fourths for ±10, ±20, and ±30. Use this scale to plot the numbers to obtain a reasonable picture as shown. 0o 40o –40o 20o –20o 10o 30o –10o –30o 35o –40o –25o 16o 21o 27o
  • 66. The Number Line Here are two important formulas about the number line.
  • 67. The Number Line Here are two important formulas about the number line. Using a ruler we compute the length of a stick S by subtraction. S
  • 68. The Number Line Ruler Here are two important formulas about the number line. Using a ruler we compute the length of a stick S by subtraction. 3 S 44
  • 69. The Number Line Ruler Here are two important formulas about the number line. Using a ruler we compute the length of a stick S by subtraction. For example, the length of S shown here is 44 – 3 = 41 which is the also distance from one end to the other. 3 S 44
  • 70. The Number Line Ruler Here are two important formulas about the number line. Using a ruler we compute the length of a stick S by subtraction. For example, the length of S shown here is 44 – 3 = 41 which is the also distance from one end to the other. 3 S I. The Distance Formula. The distance between two positions on the number line is R – L where R is number to the right and L is number to the left. 44
  • 71. The Number Line Ruler Here are two important formulas about the number line. Example D. a. Town A and town B are as shown on a map. What is the distance between them? Using a ruler we compute the length of a stick S by subtraction. For example, the length of S shown here is 44 – 3 = 41 which is the also distance from one end to the other. 3 S I. The Distance Formula. The distance between two positions on the number line is R – L where R is number to the right and L is number to the left. 35 mi 97 mA B 44 0
  • 72. The Number Line Ruler Here are two important formulas about the number line. Example D. a. Town A and town B are as shown on a map. What is the distance between them? Using a ruler we compute the length of a stick S by subtraction. For example, the length of S shown here is 44 – 3 = 41 which is the also distance from one end to the other. 3 S I. The Distance Formula. The distance between two positions on the number line is R – L where R is number to the right and L is number to the left. 35 mi 97 mA B 44 0 The distance between them is 97 – 35 = 62 miles.
  • 73. The Number Line Ruler Here are two important formulas about the number line. Example D. a. Town A and town B are as shown on a map. What is the distance between them? Using a ruler we compute the length of a stick S by subtraction. For example, the length of S shown here is 44 – 3 = 41 which is the also distance from one end to the other. 3 S I. The Distance Formula. The distance between two positions on the number line is R – L where R is number to the right and L is number to the left. 35 mi 97 mA B 44 0 The distance between them is 97 – 35 = 62 miles. b. What is the distance between the points u = –3 and v = 25? u v –3 25 0
  • 74. The Number Line Ruler Here are two important formulas about the number line. Example D. a. Town A and town B are as shown on a map. What is the distance between them? Using a ruler we compute the length of a stick S by subtraction. For example, the length of S shown here is 44 – 3 = 41 which is the also distance from one end to the other. 3 S I. The Distance Formula. The distance between two positions on the number line is R – L where R is number to the right and L is number to the left. 35 mi 97 mA B 44 0 The distance between them is 97 – 35 = 62 miles. b. What is the distance between the points u = –3 and v = 25? The point v = 25 is to the right of u = –3, so the distance is the 25 – (–3) = 28. u v –3 25 0
  • 75. The Number Line Ruler Here are two important formulas about the number line. Example D. a. Town A and town B are as shown on a map. What is the distance between them? Using a ruler we compute the length of a stick S by subtraction. For example, the length of S shown here is 44 – 3 = 41 which is the also distance from one end to the other. 3 S I. The Distance Formula. The distance between two positions on the number line is R – L where R is number to the right and L is number to the left. 35 mi 97 mA B 44 0 The distance between them is 97 – 35 = 62 miles. b. What is the distance between the points u = –3 and v = 25? The point v = 25 is to the right of u = –3, so the distance is the 25 – (–3) = 28. R – L = 28 u v –3 25 0
  • 76. The Number Line II. The Midpoint Formula. The midpoint between two points a and b is (a + b)/2,
  • 77. The Number Line a II. The Midpoint Formula. The midpoint between two points a and b is (a + b)/2, b
  • 78. The Number Line a a + b II. The Midpoint Formula. The midpoint between two points a and b is (a + b)/2, b 2 the midpoint
  • 79. The Number Line a a + b b 2 the midpoint II. The Midpoint Formula. The midpoint between two points a and b is (a + b)/2, this is also the average of a and b.
  • 80. The Number Line Example D. a. Joe obtained 4 points on the 1st quiz and 7 points on the 2nd quiz, what is the average of the two quizzes? Draw. a a + b b 2 the midpoint II. The Midpoint Formula. The midpoint between two points a and b is (a + b)/2, this is also the average of a and b.
  • 81. The Number Line Example D. a. Joe obtained 4 points on the 1st quiz and 7 points on the 2nd quiz, what is the average of the two quizzes? Draw. a a + b b The average of the two quizzes is (4 + 7)/2 = 11/ 2 = 5.5 which is the midpoint of 4 and 7. 2 the midpoint II. The Midpoint Formula. The midpoint between two points a and b is (a + b)/2, this is also the average of a and b.
  • 82. The Number Line Example D. a. Joe obtained 4 points on the 1st quiz and 7 points on the 2nd quiz, what is the average of the two quizzes? Draw. a a + b 4 b The average of the two quizzes is (4 + 7)/2 = 11/ 2 = 5.5 which is the midpoint of 4 and 7. 2 the midpoint 7 II. The Midpoint Formula. The midpoint between two points a and b is (a + b)/2, this is also the average of a and b.
  • 83. The Number Line Example D. a. Joe obtained 4 points on the 1st quiz and 7 points on the 2nd quiz, what is the average of the two quizzes? Draw. a a + b 4 b the midpointThe average of the two quizzes is (4 + 7)/2 = 11/ 2 = 5.5 which is the midpoint of 4 and 7. 2 the midpoint 7 5.5 II. The Midpoint Formula. The midpoint between two points a and b is (a + b)/2, this is also the average of a and b.
  • 84. The Number Line Example D. a. Joe obtained 4 points on the 1st quiz and 7 points on the 2nd quiz, what is the average of the two quizzes? Draw. a a + b 4 b the midpointThe average of the two quizzes is (4 + 7)/2 = 11/ 2 = 5.5 which is the midpoint of 4 and 7. b. Find the midpoints between u = –3 and v = 25? 2 the midpoint 7 5.5 –3 0 25 the midpoint II. The Midpoint Formula. The midpoint between two points a and b is (a + b)/2, this is also the average of a and b.
  • 85. The Number Line Example D. a. Joe obtained 4 points on the 1st quiz and 7 points on the 2nd quiz, what is the average of the two quizzes? Draw. a a + b 4 b the midpointThe average of the two quizzes is (4 + 7)/2 = 11/ 2 = 5.5 which is the midpoint of 4 and 7. b. Find the midpoints between u = –3 and v = 25? Their midpoint is (25 + (–3))/2 = 22/2 = 11. 2 the midpoint 7 5.5 –3 0 25 11 the midpoint II. The Midpoint Formula. The midpoint between two points a and b is (a + b)/2, this is also the average of a and b.
  • 86. Exercise. A. Draw the following Inequalities. Indicate clearly whether the end points are included or not. 1. x < 3 2. –5 ≤ x 3. x < –8 4. x ≤ 12 B. Write in the natural form then draw them. 5. x ≥ 3 6. –5 > x 7. x ≥ –8 8. x > 12 C. Draw the following intervals, state so if it is impossible. 9. 6 > x ≥ 3 10. –5 < x ≤ 2 11. 1 > x ≥ –8 12. 4 < x ≤ 2 13. 6 > x ≥ 8 14. –5 > x ≤ 2 15. –7 ≤ x ≤ –3 16. –7 ≤ x ≤ –9 D. Solve the following Inequalities and draw the solution. 17. x + 5 < 3 18. –5 ≤ 2x + 3 19. 3x + 1 < –8 20. 2x + 3 ≤ 12 – x 21. –3x + 5 ≥ 1 – 4x 22. 2(x + 2) ≥ 5 – (x – 1) 23. 3(x – 1) + 2 ≤ – 2x – 9 24. –2(x – 3) > 2(–x – 1) + 3x 25. –(x + 4) – 2 ≤ 4(x – 1) 26. x + 2(x – 3) < 2(x – 1) – 2 27. –2(x – 3) + 3 ≥ 2(x – 1) + 3x + 13