SlideShare a Scribd company logo
REACTOR DESIGN AND PHYSIOLOGY
TRANSPORT / Mass transfer, aeration and agitation:
OVERVIEW :
1. Concepts of mass transfer through different phases using oxygen
as an example.
2. Oxygen demand and respiration
3. Factors influencing mass transfer through gasliquid interfaces
4. Kla - measurement, factors influencing.
5. Agitation, mixing patterns
6. Impeller design, fluid dynamics
7. Relationship of viscosity and agitation
8. Power input
9. Scale-up
5. Reactor design and physiology
5.1. Mass transfer and phases:
5.1.1 different phases present -introduction
5.1.2. Mass transfer and respiration
5.1.3. Factors affecting oxygen demand
5.1.4. Factors influencing oxygen supply
5.1.4. (a) process factors
5.1.4. (b) transfer through an interface (kla)
5.1.4. (c) determination of kla;
5.1.4. (d) factors affecting bubble size
5.1.4. (e) gas hold-up :
5.1.4. (f) economics of oxygen transfer
Lecture Overview
Introduction
• The oxygen demand of an industrial process is generally
satisfied by aeration and agitation
• Productivity is limited by oxygen availability and therefore it
is important to the factors that affect a fermenters efficiency
in supplying O2
• This lecture considers the O2 requirement, quantification of
O2 transfer and factors influencing the transfer of O2 into
solution
5.1. MASS TRANSFER and PHASES
5.1.1 Different phases present -Introduction
Fundamental concept in fermentation technology is transfer of materials (e.g
nutrients, products, gases etc.) through different phases (e.g gas into a
liquid).
Major problem associated with provision of oxygen to the cell - is a rate
limiting step and thus serves as a model system to understand mass transfer.
The rate of oxygen transfer = driving force / resistance. E.g resistance to
mass transfer from medium to mo`s are complex and may arise from;
 Diffusion from bulk gas to gas/liquid interface
 Solution of gas in liquid interface
 Diffusion of dissolved gas to bulk of liquid
 Transport of dissolved gas to regions of cell
 Diffusion through stagnant region of liquid surrounding the cell
 Diffusion into cell
 Consumption by organism (depends on growth/respiration kinetics)
The following diagram serves to illustrate the different phases and
material that are relevant in general transport processes associated
with fermentation technology;
Dispersed gases Dissolved
nutrients
Solid and
Immiscible
liquid
nutrients
Floc
Cells
Products in
water
MASS TRANSFER
Phases present in bioreaction/bioreactor
Non aqueous phase Aqueous phase Solid phase
(Reactants / products) Dissolved reactants /
products
Reaction
Gas (O2, CO2, CH4 etc) Cells
Liquids (e.g oils) Sugars Organelles
Solid (e.g particles of
substrate)
Minerals
Enzymes
Enzymes
......... 1 
 2 ..........
1 = reactant supply and utilisation
2 = product removal and formation
• One of the most critical factors in the operation of a
fermenter is the provision of adequate gas exchange.
•The majority of fermentation processes are aerobic
• Oxygen is the most important gaseous substrate for
microbial metabolism, and carbon dioxide is the most
important gaseous metabolic product.
• For oxygen to be transferred from a air bubble to an
individual microbe, several independent partial resistance’s
must be overcome
Mass Transfer
1) The bulk gas phase in the bubble
2) The gas-liquid interphase
3) The liquid film around the bubble
4) The bulk liquid culture medium
5) The liquid film around the microbial cells
6) The cell-liquid interphase
7) The intracellular oxygen transfer resistance
1
2
3
4
5
6
7
Gas bubble
Liquid film
Microbial cell
Oxygen Mass Transfer Steps
The Oxygen requirements of
industrial fermentations
• Oxygen demand dependant on convertion of Carbon (C)
to biomass
• Stoichiometry of conversion of oxygen, carbon and
nitrogen into biomass has been elucidated
• Use these relationships to predict the oxygen demand for
a fermentation
• Darlington (1964) expressed composition of 100g of dry
yeast C 3.92 H 6.5 O 1.94
O2 Requirements
6.67CH2O + 2.1O2 = C 3.92 H 6.5 O 1.94 + 2.75CO2 + 3.42H2O
7.14CH2 + 6.135O2 = C 3.92 H 6.5 O 1.94 + 3.22CO2 + 3.89H2O
where CH2 = hydrocarbon
CH2O = carbohydrate
From the above equations to produce 100g of yeast from
hydrocarbon requires three times the amount of oxygen
than from carbohydrate
(b) OXYGEN CONC. vs RESPIRATION RATE (growth rate)
• The effect of dissolved oxygen on the specific uptake rate (i.e
respiration or growth) is described by;
• Michaelis Menton or Monod type relationship
Respiration rate (QO2) = QO2 max . O2 conc / ( Ks + O2 conc)
or
 = max. C/ (Ks + C) where C = oxygen conc.
QO2 = mmoles of oxygen consumed per gram of dry weight
Dissolved Oxygen Concentration
QO2
Ccritical
Effect of dissolved O2 concentration on the QO2 of a microorganism
Specific O2 uptake increases with increase in dissolved
O2 levels to a certain point Ccrit
Critical dissolved oxygen levels for a
range of microorganisms
Organism Temperature Critical dissolved
oC Oxygen concentration
(mmoles dm -3)
Azotobacter sp. 30 0.018
E. coli 37 0.008
Saccharomyces sp. 30 0.004
Penicillium chrysogenum 24 0.022
Azotobacter vinelandii is a large, obligately aerobic soil bacterium which has one
of the highest respiratory rates known among living organisms
Critical dissolved oxygen levels
• To maximise biomass production you must satisfy the
organisms specific oxygen demand by maintaining the
dissolved O2 levels above Ccrit
• Cells become metabolically disturbed if the level drops below
Ccrit
• In some cases metabolic disturbance may be advantageous
• Or high dissolved O2 levels may promote product formation
• Amino acid biosynthesis by Brevibacterium flavum
• Cephalosporium synthesis by Cephalosporium sp.
5.1.3. FACTORS AFFECTING OXYGEN DEMAND
 Rate of cell respiration
 Type of respiration (aerobic vs anaerobic)
 Type of substrate (glucose vs methane)
 Type of environment (e.g pH, temp etc.)
 Surface area/ volume ratio
large vs small cells (bacteria v mammalian cells)
hyphae, clumps, flocs, pellets etc.
 Nature of surface area (type of capsule etc)
Diffusivity ofgas
BULKLIQUID
?
?
?
?
?
?
CELLS
O2
Size of sparger
gas bubble
Gas composition, volume & velocity
Design of Impeller
size, no. of blades
rotational speed Baffles
width, number
5.1.4. FACTORS INFLUENCING OXYGEN SUPPLY
Foam/antifoam
Temperature
Type of liquid
Height/width ratio
‘’Hold up’’
5.1.4 (a) Process factors
5.1.4(b) Transfer through an interface (Kla)
Ci = O2 conc at interface
CL = O2 conc in liquid
Pg = Partial pressure of gas
Pi = Partial pressure at interface
Bubble Gas Liquid
of Gas film film
Pg Pi (1/k2)
Ci
(1/k4)
(1/k1) (1/k3) CL
Bulk Liquid
Overall mass transfer is (Whitman theory)
dC/dt = kg (Pg - Pi) = KL (Ci - CL)
(Driving force) (Resistance)
Note kg = 1/k1 + 1/k2, KL = 1/k3 + 1/k4
Use conc rather than partial pressure (measure?)
 dC/dt = KL (Csat - CL) ......assume that Csat substitutes for
Ci (measure?)
This is per unit interface!
Overall then dC/dt = KLa( Csat - CL)
5.1.4. (c) Determination of KLa
• Determination of KLa in a fermenter is important in to
establish its aeration efficiency and quantify effects of
operating variables on oxygen supply
• Used to compare fermenters before scale up or scale
down
• A number of different methods are available
5.1.4.(c) Determination of KLa
(1) The Sulphite oxidation technique
Measures the rate of conversion of a 0.5m solution of sodium
sulphite to sodium sulphate in the presence of a copper or
cobalt catalyst
Na2SO3 + 1/2 O2 Na2SO4
Oxidation of sulphite is equivalent to the oxygen-transfer rate
Disadvantages i) slow,
ii) effected by surface active agents
iii) Rheology of soln not like media
Cu++ or Co++
5.1.4.(c) Determination of KLa
(2) Gassing out techniques
• Estimation of KLa by gassing out involves measuring the
increase in dissolved O2 of a solution during aeration and
agitation
• The OTR will decrease with the period of aeration as CL
approaches CSAT due to resultant decrease in driving force
(CSAT - CL)
• The OTR at any one time will be equal to the slope of the
tangent to the curve of dissolved O2 conc against time of
aeration
The increase in dissolved O2 conc of a soln
over a period of agitation
X
Y
Time
Dissolved
oxygen
concentration
The OTR at Time X is equal to the slope of the tangent drawn at point Y
5.1.4.(c) Determination of KLa;
(2) Gassing out techniques
involve initially lowering the oxygen value to a low level
(i) Static Method
• O2 concentration of the solution is lowered by gassing out with liquid N2
• The deoxygenated liquid is then aerated, agitated and increase in dissolved
O2 is monitored with oxygen probe
• Rapid method 15 mins
• May utilise fermentation medium and dead cells
• Require membrane -type electrode which doesn’t have response time
required for true changes in oxygenation rate
• Main disadvantage on industrial scale are quantities of liquid N2 required
and single point measurements not representative of the bulk liquid
5.1.4.(c) Determination of KLa
(ii) Dynamic Method;
• Involves measuring oxygen levels in growing culture in the
fementer
• Utilises the growing culture to reduce O2 levels
• Correction factors must be used
• Slope of AB is a measure of the respiration rate
• BC is observed increase in dissolved oxygen is the
difference between transfer of oxygen into solution and
uptake by the culture
X
B
A C
Time
Dissolved
oxygen
concentration
Dynamic gassing out for the determination of Kla values.
Aeration terminated at point A and recommenced at point B
Slope AB gives RX
(Respiration rate)
Slope BC gives dC/dt
Dynamic Method
Expressed as the equation
dC/dt = Kla (Csat - CL) - RX
R = respiration rate (mmoles of O2 g-1 biomass h-1),
X = concentration of biomass
Turn off air supply, monitor dissolved O2
dC/dt = - RX ... thus the slope of the trace gives RX
Resume aeration and monitor,
Supply term can be calculated (from slope + substitute calculated value of RX)
dC/dt = KLa (Csat - CL) - RX
(slope BC) (solve) (Literature) (Observe) (slope AB)
Dynamic Method
Advantages
• Can determine KLa during an actual fermentation
• Rapid technique
• Can use a dissolved oxygen probe of the membrane type
Limitations
• Limited range of dissolved oxygen levels can be studied
• Must not allow oxygen levels to fall below Ccrit
• Difficult to apply technique during a fermentation with a high
oxygen demand
• Relies on measurements taken at one point
5.1.4.(d) FACTORS AFFECTING BUBBLE SIZE
(a) Influence of gas velocity on bubble formation:
..
..
::
:::
..
...
::
::
..
.
.
low medium
high
Very little backmixing
backmixing
slug flow
slow medium fast
• b) Influence of liquid properties on bubbles;
Two types of liquid
A
B bubbles coalesce
A B
Therefore given same aeration equipment
B will give a greater range of bubble size
Liquid can change from A  B when salts are added. Implication
for mass transfer in different media. Will this property of liquids
influence Kla - why?
5.1.4.(e) GAS HOLD-UP
Represents air volume retained in the liquid
Vh = V - V0
Where Vh = hold-up volume, V = vol. of gassed liquid, V0 = vol
of ungassed liquid.
No air
Air
Difference in volume represents hold-up volume
That is the amount of gas retained in the liquid
Correlations exist that relate hold-up to power input , for
example,
(P/V)0.4 . Vb
0.5
P/V = power input per unit vol ungassed liquid, V
b
= linear velocity of air bubble
(ascending velocity).
Ascending velocity of bubble (Vb):
V
b
= FH
l
/H
0
V
Where H0 = hold-up of bubble, F = aeration rate, Hl = liquid
depth, V = liquid volume.
How does height (h) of a reactor vary with radius (r)
when volume (v) is kept constant?
volume of a cylinder is v = r 2 h
Let us fix the volume as 1 then
h = 1/  r 2
If r = 1 then h = 1/
r = 2 then h = 1/4
r = 3 then h = 1/9
Therefore as the radius increases the height (or path
length) decreases as the square of the radius
5.1.4.(f) ECONOMICS OF OXYGEN
TRANSFER
Fermentation e.g Penicillin - high KLa
Waste treatment - economy
Kla . Csat = maximum rate at which oxygen can be
dissolved
Economy and capacity related through power input
per unit volume (P/V)
ECONOMY = KLa. Csat / (P/V)
The balance between OXYGEN DEMAND and
SUPPLY
Must consider how processes may be designed such that O2
uptake rate of the culture does not exceed the oxygen transfer rate
of the fermentor.
Uptake rate = QO2.X
QO2 = O2 uptake rate, X = Biomass
dC/dt = KLa(Csat - CL ) = supply rate
Dissolved O2 conc. should not fall below the critical dissolved O2
conc. (Ccrit)
A fermentation will have a max Kla dictated by operating conditions
thus it is the demand that often has to be adjusted.
Achieved by
Control of biomass conc.
Control of specific O2 uptake rate
Combination of both

More Related Content

PPTX
Batch ,continous and synchronus culture.pptx
PPTX
Growth curve and growth kinetics
PDF
Continuous stirred tank reactor (CSTR )
PPTX
Types of fermentation and Inoculam build up
PPTX
MIC150 - Chap 5 Gene Transfer
PPTX
Trickle bed reactor
PPTX
Organization macromolecule complex
PPTX
Bioprocess engineering
Batch ,continous and synchronus culture.pptx
Growth curve and growth kinetics
Continuous stirred tank reactor (CSTR )
Types of fermentation and Inoculam build up
MIC150 - Chap 5 Gene Transfer
Trickle bed reactor
Organization macromolecule complex
Bioprocess engineering

What's hot (20)

PPT
Cell bank maintenence
PPTX
Application of computer in fermentation
PPT
Lecture 7 - 10.12.09 - DNA Recombination.ppt
PPTX
SCALE-UP OF BIOREACTOR.pptx
PPTX
Cellular Growth Modelling and Classification
PPTX
Competent cells formation
PPTX
Recombinant vaccines-Peptide Vaccines
PPTX
Production of Chitinase
PPTX
Tower Fermernter
PPTX
Encode Project
PPTX
Translational proofreading
PPTX
Air and media sterilisation
PPTX
Scale up process or Bioreactor scale up or Upstream process
PPTX
Primary and established cell line culture
PPTX
Preservation of industrial cell culture
DOCX
Bacterial-Toxigenesis.docx
PPTX
Adenovirus as an animal vector
PPTX
4.1
PDF
Lecture on Antigen processing and presentation pathways
PPT
Transcription terrmination by kk sahu
Cell bank maintenence
Application of computer in fermentation
Lecture 7 - 10.12.09 - DNA Recombination.ppt
SCALE-UP OF BIOREACTOR.pptx
Cellular Growth Modelling and Classification
Competent cells formation
Recombinant vaccines-Peptide Vaccines
Production of Chitinase
Tower Fermernter
Encode Project
Translational proofreading
Air and media sterilisation
Scale up process or Bioreactor scale up or Upstream process
Primary and established cell line culture
Preservation of industrial cell culture
Bacterial-Toxigenesis.docx
Adenovirus as an animal vector
4.1
Lecture on Antigen processing and presentation pathways
Transcription terrmination by kk sahu
Ad

Similar to 5758.ppt (20)

PDF
Measurement of mass transfer coefficient (k la)
PPTX
Aeration and agitation
PPTX
Aeration & agitation ppt
PPTX
4.2.pptx
PPT
Bioreactor Basis
PPT
Fermentation Technology - Oxygen transfer, Antifoam Agents, Agitation, Aeration
PPTX
Aeration & agitation in fermentation
PPTX
Aeration & agitation
DOCX
Bioreactor Technical Memorandum Report
PDF
Areation & stirring process during fermentation
PPT
Fermentation ppt
PPT
Fermentation ppt
PPT
Fermentation ppt
PDF
Oxygen Transfer and Industrial Production Processes.pdf
PPTX
Bioreactors.pptx
PDF
Bioreactor_Control.pdf
PPTX
Process variables & product recovery in Fermentation
PPTX
Factors affecting fermentation
PPT
Fermentation technology-chapter-viiviii-ix-x
PPT
Fermentation_technology_chapter_viiviii.ppt
Measurement of mass transfer coefficient (k la)
Aeration and agitation
Aeration & agitation ppt
4.2.pptx
Bioreactor Basis
Fermentation Technology - Oxygen transfer, Antifoam Agents, Agitation, Aeration
Aeration & agitation in fermentation
Aeration & agitation
Bioreactor Technical Memorandum Report
Areation & stirring process during fermentation
Fermentation ppt
Fermentation ppt
Fermentation ppt
Oxygen Transfer and Industrial Production Processes.pdf
Bioreactors.pptx
Bioreactor_Control.pdf
Process variables & product recovery in Fermentation
Factors affecting fermentation
Fermentation technology-chapter-viiviii-ix-x
Fermentation_technology_chapter_viiviii.ppt
Ad

Recently uploaded (20)

PPTX
PavBhaji_Indianfoodpreperationforbeginners.pptx
PPTX
SEAFOOD IRRADIATION – TECHNOLOGY AND APPLICATION.pptx
PDF
PREPARE SALAD & SALD DRESSING cookery 1.
PPTX
HEALTHY EATING HABITS A BRIEF PRESENTATION
PDF
Ecosure Passing Score with eAuditor Audits & Inspections
PDF
Custom Gifts in Charlotte NC: How to Choose BBQ Date Gifts
PPTX
SOYBEAN PRODUCTION TECHNOLOGIES In the Philippines.pptx
PDF
Agricultural_Census_Main_Findings_Report.pdf
PDF
Larkfield Indian Restaurant and Takeaway Menu in Aylesford ME20 6QJ. Located...
PDF
plating appetizers and hors d'oeuvres...
PPT
PRODUCTION PRACTICES FOR ANNUAL CROPS.ppt
PPTX
Beverage Beer making and processes involved in Beer making
PDF
MODELING ALGORITHM OF ESTIMATION OF RENAL FUNCTION BY THE COCKCROFT AND MDRD ...
PPTX
water supply and waste disposal in food industry pptx
PPTX
FST-401 lecture # 10 food chemistry.pptx
PDF
Chapter 13 - Urinary System -dcsd Copy.pdf
PPTX
Osmosis and Diffusion processes and differences
PPTX
Agrisphere ai powered presision farming marketplace
PPTX
COMPONENTS OF FOOD jgjtgjjgjgjgjgjgjgjg
PDF
Discovering the Health Benefits and Global Appeal of Dragonfruit
PavBhaji_Indianfoodpreperationforbeginners.pptx
SEAFOOD IRRADIATION – TECHNOLOGY AND APPLICATION.pptx
PREPARE SALAD & SALD DRESSING cookery 1.
HEALTHY EATING HABITS A BRIEF PRESENTATION
Ecosure Passing Score with eAuditor Audits & Inspections
Custom Gifts in Charlotte NC: How to Choose BBQ Date Gifts
SOYBEAN PRODUCTION TECHNOLOGIES In the Philippines.pptx
Agricultural_Census_Main_Findings_Report.pdf
Larkfield Indian Restaurant and Takeaway Menu in Aylesford ME20 6QJ. Located...
plating appetizers and hors d'oeuvres...
PRODUCTION PRACTICES FOR ANNUAL CROPS.ppt
Beverage Beer making and processes involved in Beer making
MODELING ALGORITHM OF ESTIMATION OF RENAL FUNCTION BY THE COCKCROFT AND MDRD ...
water supply and waste disposal in food industry pptx
FST-401 lecture # 10 food chemistry.pptx
Chapter 13 - Urinary System -dcsd Copy.pdf
Osmosis and Diffusion processes and differences
Agrisphere ai powered presision farming marketplace
COMPONENTS OF FOOD jgjtgjjgjgjgjgjgjgjg
Discovering the Health Benefits and Global Appeal of Dragonfruit

5758.ppt

  • 1. REACTOR DESIGN AND PHYSIOLOGY TRANSPORT / Mass transfer, aeration and agitation: OVERVIEW : 1. Concepts of mass transfer through different phases using oxygen as an example. 2. Oxygen demand and respiration 3. Factors influencing mass transfer through gasliquid interfaces 4. Kla - measurement, factors influencing. 5. Agitation, mixing patterns 6. Impeller design, fluid dynamics 7. Relationship of viscosity and agitation 8. Power input 9. Scale-up
  • 2. 5. Reactor design and physiology 5.1. Mass transfer and phases: 5.1.1 different phases present -introduction 5.1.2. Mass transfer and respiration 5.1.3. Factors affecting oxygen demand 5.1.4. Factors influencing oxygen supply 5.1.4. (a) process factors 5.1.4. (b) transfer through an interface (kla) 5.1.4. (c) determination of kla; 5.1.4. (d) factors affecting bubble size 5.1.4. (e) gas hold-up : 5.1.4. (f) economics of oxygen transfer Lecture Overview
  • 3. Introduction • The oxygen demand of an industrial process is generally satisfied by aeration and agitation • Productivity is limited by oxygen availability and therefore it is important to the factors that affect a fermenters efficiency in supplying O2 • This lecture considers the O2 requirement, quantification of O2 transfer and factors influencing the transfer of O2 into solution
  • 4. 5.1. MASS TRANSFER and PHASES 5.1.1 Different phases present -Introduction Fundamental concept in fermentation technology is transfer of materials (e.g nutrients, products, gases etc.) through different phases (e.g gas into a liquid). Major problem associated with provision of oxygen to the cell - is a rate limiting step and thus serves as a model system to understand mass transfer. The rate of oxygen transfer = driving force / resistance. E.g resistance to mass transfer from medium to mo`s are complex and may arise from;  Diffusion from bulk gas to gas/liquid interface  Solution of gas in liquid interface  Diffusion of dissolved gas to bulk of liquid  Transport of dissolved gas to regions of cell  Diffusion through stagnant region of liquid surrounding the cell  Diffusion into cell  Consumption by organism (depends on growth/respiration kinetics)
  • 5. The following diagram serves to illustrate the different phases and material that are relevant in general transport processes associated with fermentation technology; Dispersed gases Dissolved nutrients Solid and Immiscible liquid nutrients Floc Cells Products in water MASS TRANSFER
  • 6. Phases present in bioreaction/bioreactor Non aqueous phase Aqueous phase Solid phase (Reactants / products) Dissolved reactants / products Reaction Gas (O2, CO2, CH4 etc) Cells Liquids (e.g oils) Sugars Organelles Solid (e.g particles of substrate) Minerals Enzymes Enzymes ......... 1   2 .......... 1 = reactant supply and utilisation 2 = product removal and formation
  • 7. • One of the most critical factors in the operation of a fermenter is the provision of adequate gas exchange. •The majority of fermentation processes are aerobic • Oxygen is the most important gaseous substrate for microbial metabolism, and carbon dioxide is the most important gaseous metabolic product. • For oxygen to be transferred from a air bubble to an individual microbe, several independent partial resistance’s must be overcome Mass Transfer
  • 8. 1) The bulk gas phase in the bubble 2) The gas-liquid interphase 3) The liquid film around the bubble 4) The bulk liquid culture medium 5) The liquid film around the microbial cells 6) The cell-liquid interphase 7) The intracellular oxygen transfer resistance 1 2 3 4 5 6 7 Gas bubble Liquid film Microbial cell Oxygen Mass Transfer Steps
  • 9. The Oxygen requirements of industrial fermentations • Oxygen demand dependant on convertion of Carbon (C) to biomass • Stoichiometry of conversion of oxygen, carbon and nitrogen into biomass has been elucidated • Use these relationships to predict the oxygen demand for a fermentation • Darlington (1964) expressed composition of 100g of dry yeast C 3.92 H 6.5 O 1.94
  • 10. O2 Requirements 6.67CH2O + 2.1O2 = C 3.92 H 6.5 O 1.94 + 2.75CO2 + 3.42H2O 7.14CH2 + 6.135O2 = C 3.92 H 6.5 O 1.94 + 3.22CO2 + 3.89H2O where CH2 = hydrocarbon CH2O = carbohydrate From the above equations to produce 100g of yeast from hydrocarbon requires three times the amount of oxygen than from carbohydrate
  • 11. (b) OXYGEN CONC. vs RESPIRATION RATE (growth rate) • The effect of dissolved oxygen on the specific uptake rate (i.e respiration or growth) is described by; • Michaelis Menton or Monod type relationship Respiration rate (QO2) = QO2 max . O2 conc / ( Ks + O2 conc) or  = max. C/ (Ks + C) where C = oxygen conc. QO2 = mmoles of oxygen consumed per gram of dry weight
  • 12. Dissolved Oxygen Concentration QO2 Ccritical Effect of dissolved O2 concentration on the QO2 of a microorganism Specific O2 uptake increases with increase in dissolved O2 levels to a certain point Ccrit
  • 13. Critical dissolved oxygen levels for a range of microorganisms Organism Temperature Critical dissolved oC Oxygen concentration (mmoles dm -3) Azotobacter sp. 30 0.018 E. coli 37 0.008 Saccharomyces sp. 30 0.004 Penicillium chrysogenum 24 0.022 Azotobacter vinelandii is a large, obligately aerobic soil bacterium which has one of the highest respiratory rates known among living organisms
  • 14. Critical dissolved oxygen levels • To maximise biomass production you must satisfy the organisms specific oxygen demand by maintaining the dissolved O2 levels above Ccrit • Cells become metabolically disturbed if the level drops below Ccrit • In some cases metabolic disturbance may be advantageous • Or high dissolved O2 levels may promote product formation • Amino acid biosynthesis by Brevibacterium flavum • Cephalosporium synthesis by Cephalosporium sp.
  • 15. 5.1.3. FACTORS AFFECTING OXYGEN DEMAND  Rate of cell respiration  Type of respiration (aerobic vs anaerobic)  Type of substrate (glucose vs methane)  Type of environment (e.g pH, temp etc.)  Surface area/ volume ratio large vs small cells (bacteria v mammalian cells) hyphae, clumps, flocs, pellets etc.  Nature of surface area (type of capsule etc)
  • 17. Size of sparger gas bubble Gas composition, volume & velocity Design of Impeller size, no. of blades rotational speed Baffles width, number 5.1.4. FACTORS INFLUENCING OXYGEN SUPPLY Foam/antifoam Temperature Type of liquid Height/width ratio ‘’Hold up’’ 5.1.4 (a) Process factors
  • 18. 5.1.4(b) Transfer through an interface (Kla) Ci = O2 conc at interface CL = O2 conc in liquid Pg = Partial pressure of gas Pi = Partial pressure at interface Bubble Gas Liquid of Gas film film Pg Pi (1/k2) Ci (1/k4) (1/k1) (1/k3) CL Bulk Liquid
  • 19. Overall mass transfer is (Whitman theory) dC/dt = kg (Pg - Pi) = KL (Ci - CL) (Driving force) (Resistance) Note kg = 1/k1 + 1/k2, KL = 1/k3 + 1/k4 Use conc rather than partial pressure (measure?)  dC/dt = KL (Csat - CL) ......assume that Csat substitutes for Ci (measure?) This is per unit interface! Overall then dC/dt = KLa( Csat - CL)
  • 20. 5.1.4. (c) Determination of KLa • Determination of KLa in a fermenter is important in to establish its aeration efficiency and quantify effects of operating variables on oxygen supply • Used to compare fermenters before scale up or scale down • A number of different methods are available
  • 21. 5.1.4.(c) Determination of KLa (1) The Sulphite oxidation technique Measures the rate of conversion of a 0.5m solution of sodium sulphite to sodium sulphate in the presence of a copper or cobalt catalyst Na2SO3 + 1/2 O2 Na2SO4 Oxidation of sulphite is equivalent to the oxygen-transfer rate Disadvantages i) slow, ii) effected by surface active agents iii) Rheology of soln not like media Cu++ or Co++
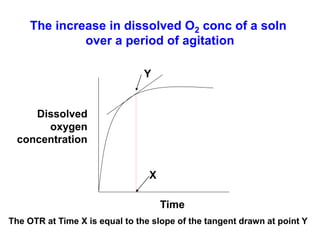
  • 22. 5.1.4.(c) Determination of KLa (2) Gassing out techniques • Estimation of KLa by gassing out involves measuring the increase in dissolved O2 of a solution during aeration and agitation • The OTR will decrease with the period of aeration as CL approaches CSAT due to resultant decrease in driving force (CSAT - CL) • The OTR at any one time will be equal to the slope of the tangent to the curve of dissolved O2 conc against time of aeration
  • 23. The increase in dissolved O2 conc of a soln over a period of agitation X Y Time Dissolved oxygen concentration The OTR at Time X is equal to the slope of the tangent drawn at point Y
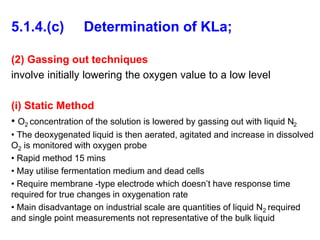
  • 24. 5.1.4.(c) Determination of KLa; (2) Gassing out techniques involve initially lowering the oxygen value to a low level (i) Static Method • O2 concentration of the solution is lowered by gassing out with liquid N2 • The deoxygenated liquid is then aerated, agitated and increase in dissolved O2 is monitored with oxygen probe • Rapid method 15 mins • May utilise fermentation medium and dead cells • Require membrane -type electrode which doesn’t have response time required for true changes in oxygenation rate • Main disadvantage on industrial scale are quantities of liquid N2 required and single point measurements not representative of the bulk liquid
  • 25. 5.1.4.(c) Determination of KLa (ii) Dynamic Method; • Involves measuring oxygen levels in growing culture in the fementer • Utilises the growing culture to reduce O2 levels • Correction factors must be used • Slope of AB is a measure of the respiration rate • BC is observed increase in dissolved oxygen is the difference between transfer of oxygen into solution and uptake by the culture
  • 26. X B A C Time Dissolved oxygen concentration Dynamic gassing out for the determination of Kla values. Aeration terminated at point A and recommenced at point B Slope AB gives RX (Respiration rate) Slope BC gives dC/dt
  • 27. Dynamic Method Expressed as the equation dC/dt = Kla (Csat - CL) - RX R = respiration rate (mmoles of O2 g-1 biomass h-1), X = concentration of biomass Turn off air supply, monitor dissolved O2 dC/dt = - RX ... thus the slope of the trace gives RX Resume aeration and monitor, Supply term can be calculated (from slope + substitute calculated value of RX) dC/dt = KLa (Csat - CL) - RX (slope BC) (solve) (Literature) (Observe) (slope AB)
  • 28. Dynamic Method Advantages • Can determine KLa during an actual fermentation • Rapid technique • Can use a dissolved oxygen probe of the membrane type Limitations • Limited range of dissolved oxygen levels can be studied • Must not allow oxygen levels to fall below Ccrit • Difficult to apply technique during a fermentation with a high oxygen demand • Relies on measurements taken at one point
  • 29. 5.1.4.(d) FACTORS AFFECTING BUBBLE SIZE (a) Influence of gas velocity on bubble formation: .. .. :: ::: .. ... :: :: .. . . low medium high Very little backmixing backmixing slug flow slow medium fast
  • 30. • b) Influence of liquid properties on bubbles; Two types of liquid A B bubbles coalesce A B Therefore given same aeration equipment B will give a greater range of bubble size Liquid can change from A  B when salts are added. Implication for mass transfer in different media. Will this property of liquids influence Kla - why?
  • 31. 5.1.4.(e) GAS HOLD-UP Represents air volume retained in the liquid Vh = V - V0 Where Vh = hold-up volume, V = vol. of gassed liquid, V0 = vol of ungassed liquid. No air Air Difference in volume represents hold-up volume That is the amount of gas retained in the liquid
  • 32. Correlations exist that relate hold-up to power input , for example, (P/V)0.4 . Vb 0.5 P/V = power input per unit vol ungassed liquid, V b = linear velocity of air bubble (ascending velocity). Ascending velocity of bubble (Vb): V b = FH l /H 0 V Where H0 = hold-up of bubble, F = aeration rate, Hl = liquid depth, V = liquid volume.
  • 33. How does height (h) of a reactor vary with radius (r) when volume (v) is kept constant? volume of a cylinder is v = r 2 h Let us fix the volume as 1 then h = 1/  r 2 If r = 1 then h = 1/ r = 2 then h = 1/4 r = 3 then h = 1/9 Therefore as the radius increases the height (or path length) decreases as the square of the radius
  • 34. 5.1.4.(f) ECONOMICS OF OXYGEN TRANSFER Fermentation e.g Penicillin - high KLa Waste treatment - economy Kla . Csat = maximum rate at which oxygen can be dissolved Economy and capacity related through power input per unit volume (P/V) ECONOMY = KLa. Csat / (P/V)
  • 35. The balance between OXYGEN DEMAND and SUPPLY Must consider how processes may be designed such that O2 uptake rate of the culture does not exceed the oxygen transfer rate of the fermentor. Uptake rate = QO2.X QO2 = O2 uptake rate, X = Biomass dC/dt = KLa(Csat - CL ) = supply rate Dissolved O2 conc. should not fall below the critical dissolved O2 conc. (Ccrit) A fermentation will have a max Kla dictated by operating conditions thus it is the demand that often has to be adjusted. Achieved by Control of biomass conc. Control of specific O2 uptake rate Combination of both