SlideShare a Scribd company logo
Evaluation of Diagnostic Test
Dr. A.P. Kulkarni
MD, DPH, PhD, FIAPSM
drapkulkarni@gmail.com
Lesson objectives
At the end of the session the participants would
be able to
A.Enlist the indicators for evaluation of a
diagnostic test
B.Describe and calculate sensitivity, specificity &
predictive power
C.Describe the utility of ROC curve
D.Describe the utility of Kappa Statistics
Indicators
• Validity
• Reproducibility
• Acceptability
• Feasibility :
Validity
 Sensitivity
 Specificity
 Predictive Power
Positive Test
Negative Test
Gold standard
• Universally accepted test
• Validity indicators calculated with reference to
gold standard
Test Result Disease
(As diagnosed by golden test)
Yes No
Positive True + ve False + ve
Negative False - ve True - ve
Test
Result
Disease Total
Yes No
Positive a b a + b
Negative c d c + d
Total a + c b+ d n
Test Disease Total
Yes No
+ ve 90 10 100
-Ve 20 180 200
Total 110 190 300
Example
Test
Result
Disease Tot
Yes No
Positive a b a + b
Negative c d c + d
Total a + c b+ d n
Sensitivity
Ability of test to
detect disease
in those who
actually have it
= a / (a+ c)
= True + ve / Having
Disease
A test that yields
minimum
False Negatives is
most seNsitive
Test Disease Total
Yes No
+ ve 90 10 100
-ve 20 180 200
Total 110 190 300
Example
Sensitivity
= 90 / 110
= 0.8182
=81.82 %
Test
Result
Disease Tot
Yes No
Positive a b a + b
Negative c d c + d
Total a + c b+ d n
Specificity
Ability of test to
detect absence of
disease
in those who
actually do not
have it
= d / (b + d)
= True – ve / Not
having disease
A test that yields
minimum
False Positives is
most sPecific test
Test Disease Total
Yes No
+ ve 90 10 100
-ve 20 180 200
Total 110 190 300
Example
Specificity
= 180 / 190
= 0.9473
= 94.73 %
Test
Result
Disease Tot
Yes No
Positive a b a + b
Negative c d c + d
Total a + c b+ d n
Predictive Power of
Positive Test
Probability that a
person will have
disease if test is
positive
= a / ( a + b )
= True + ve / Test + ve
Test Disease Total
Yes No
+ ve 90 10 100
-ve 20 180 200
Total 110 190 300
Example
Pr. Power
(+ve Test)
= 90 / 100
= 0.9000
= 90.00 %
Test
Result
Disease Tot
Yes No
Positive a b a + b
Negative c d c + d
Total a + c b+ d n
Predictive Power of
Negative Test Probability that a
person will NOT have
disease if test is
negative
= d/ ( c + d )
= True -ve / Test - ve
Predictive power also
depends on prevalence of
disease
7. evaluation of diagnostic test
Test Disease Total
Yes No
+ ve 90 10 100
-ve 20 180 200
Total 110 190 300
Example
Pr. Power
(-ve Test)
= 180 / 200
= 0.9000
= 90.00 %
Reproducibility
• Ability of test to give consistent results when
repeated under similar conditions.
Observer errors
Errors in instrument / procedures
Biological variation
Improvement in reproducibility
 Training of personnel
 Standardization of procedures & instruments
 Multiple testing and averaging
Points To Remember
• New test is always compared with established
test (Golden Standard)
• All measures are relative to that golden
standard and would change if golden standard
is changed
• If different cut-offs are set, sensitivity /
specificity changes ( if in one increases, the
other decreases)
• Observed indicators are subject to sampling
variation
Points to remember
1. Validity( Syn.= accuracy): ability of measurement
to be correct on an average.
2. Reproducibility( Syn.= precision, repeatability,
reliability): ability of measurement to give same
or similar result with repeated measurement
3. Economicity( Syn.= efficiency): extent to which
the expenditures on the test in clinical and public
health practice commensurate with the results
4. Acceptability, cost, ease of administration, technical
ease.
Points to remember
• Accuracy: How close the estimates of new test
are to the truth. Truth is what GOLD
STANDARD says. So, for accuracy, Gold
standard is a must.
• Reproducibility: How close are the repeated
estimates of the new test to each other. So,
for reproducibility, we must repeat the test in
similar circumstances. Gold standard is NOT
required here.
Accuracy & Precision
ROC Curve
• Receiver Operating
Characteristic Curves
Uses
1. Deciding cut-off points
2. Comparing two tests
Example
• If fasting blood sugar
(FBS) after 2 hrs is taken
as a NEW test and its
sensitivity / specificity is
compared against GTT
( the golden test)
• The sensitivity /
specificity would differ
at different cut-offs of
FBS levels
ROC Curve-
Example
• Y axis : Sensitivity
• X axis : (1- Specificity )
• Maximizing sensitivity
corresponds to some
large value on y-axis
• Maximizing specificity
corresponds to some
small value on x-axis
• Good first choice will be
the one corresponding
to upper left corner
ROC Curve- Area
Under Curve (AUC)
• An important measure
of accuracy of the test
• If AUC = 1, then curve
consists of two lines
Vertical: 0,0 to 0,1 and
horizontal : 0,1 to 1,1
(Indicated by bold blue
line) : The best, ideal
• If AUC =0.5: A diagonal
line results (0,0 to 1,1
Indicates a test that
cannot discriminate
between normal &
abnormal
ROC Curve- Area
Under Curve (AUC)
• Softwares can calculate
area under curve in a
given case
• Two or more tests can
be compared
statistically
• May consist of
measurements on same
individuals (Paired Test)
or on different
individuals (Un-paired
Test)
• Test with higher AUC
will be preferred .
Which Test Would You Select ?
AreaUC = 0.918
95 % CI: 0.878, 0.958
AreaUC = 0.803
95% CI: 0.737, 0.870
What Cut Off Point Would You Select?
+ve if => Sensitivity 1 - Specificity
64.0 1.0000 1.0000
67.5 1.0000 0.8837
72.5 1.0000 0.7791
77.5 1.0000 0.6628
82.5 0.9903 0.5581
87.5 0.9806 0.4535
92.5 0.9709 0.3488
97.5 0.9417 0.2674
102.5 0.8932 0.2093
107.5 0.8350 0.1628
+ve if => Sensitivity 1 - Specificity
112.5 0.7670 0.1279
117.5 0.6990 0.0930
122.5 0.6214 0.0698
127.5 0.5437 0.0465
135.0 0.4660 0.0233
142.5 0.3786 0.0116
147.5 0.2816 0.0116
152.5 0.1845 0.0116
157.5 0.0874 0.0116
161.0 0.0000 0.0000
Row +ve if => Sensitivity 1 -
Specificity
Specificity Sensitivity +
Specificity
1 64.0 1.0000 1.0000 0 1.0000
2 67.5 1.0000 0.8837 0.1163 1.1163
3 72.5 1.0000 0.7791 0.2209 1.2209
4 77.5 1.0000 0.6628 0.3372 1.3372
5 82.5 0.9903 0.5581 0.4419 1.4322
6 87.5 0.9806 0.4535 0.5465 1.5271
7 92.5 0.9709 0.3488 0.6512 1.6220
8 97.5 0.9417 0.2674 0.7326 1.6743
9 102.5 0.8932 0.2093 0.7907 1.6839
10 107.5 0.8350 0.1628 0.8372 1.6722
11 112.5 0.7670 0.1279 0.8721 1.6391
12 117.5 0.6990 0.0930 0.907 1.6060
13 122.5 0.6214 0.0698 0.9302 1.5516
14 127.5 0.5437 0.0465 0.9535 1.4972
Identify the row where total of sensitivity and specificity is highest
Kappa Statistics
• Is the agreement between two or test a
chance occurrence or otherwise
• “Significant agreement” means that element
is ruled out
O=Observed frequency of agreement = a+d = 90
E1=Expected agreement (a) = (a+b)x((a+c)/N=12.24
E2=Expected agreement(d) =(c+d)x(b+d)/N= 42.64
E= E1+E2=54.88
New Test
Gold Standard Total
Disease
Present
Disease
Absent
Disease Present a (30) b (6) a+b (36)
Disease Absent c (4) d (60) c+d (64)
Total a+c (34) b+d (66) N (100)
New Test
Gold Standard Total
Disease Present Disease
Absent
Disease Present a (30) b (6) a+b (36)
Disease Absent c (4) d (60) c+d (64)
Total a+c (34) b+d (66) N (100)
Kappa = [Obsv Agree – Exp Agree] / [Total-Exp Agree]
= [O-E ] / [N-E]
= [90-54.88] / [100-54.88] = 35.12 / 45.12
= 0.780
Interpretation of Kappa values
K Interpretation
< 0 No agreement
0 – 0.19 Negligible
0.20 – 0.39 Minimal agreement
0.40 – 0.59 Fair agreement
0.60 – 0.79 Good agreement
0.80 – 1.00 Excellent agreement
0.7783
7. evaluation of diagnostic test
Further Evaluation
1. Likelihood Ratio
2. Post Test Odds and
Post Test
Probability
3. ROC Curves
• Predictive power of test is
affected by prevalence of
the disease
• Can be used for
combination of tests
• Can be used for several
levels of test
Further Evaluation
• Pre Test Probability: Prevalence rate :
Probability that a person will have the target
disorder before the test is carried out
• Pre Test Odds: The odds that the patient has
the target disorder before the test is carried
out (pre-test probability/ [1 - pre-test
probability]).
Further Evaluation
• Pre Test Probability:
Prevalence rate :
Probability that a
person will have the
target disorder before
the test is carried out
• Pre Test Odds: The odds
that the patient has the
target disorder before
the test is carried out
• Post Test Probability:
The proportion of
patients with that
particular test result
who have the target
disorder
• Post Test Odds: The
odds that the patient is
declared to have the
target disorder after the
test is carried out
Further Evaluation
• Pre Test Probability:
(PrTP) Prevalence rate :
Persons with disorder ÷
Persons without
disorder
[Range: 0-1]
• Pre Test Odds: (PrTO)
= PrTP / (1- PrTP)
[Range 0 to Infinity]
• Post Test Probability:
(PoTP)
• Post Test Odds: (PoTO)
Requires calculation of
Likelihood Ratio
Further Evaluation
• Likelihood Ratio Positive Test (LRP)
LRP = Sensitivity / (1- Specificity)
• Likelihood Ratio Negative Test (LRN)
LRN = (1- Sensitivity) / Specificity
• Post Test Probability Positive Test (PoTPP)
(Probability that test +ve will have target disease)
PoTPP = PrTP x LRP
• Post Test Probability Negative Test (PoTPN)
Probability that a test –ve will have target disease
PoTPN = PrTP x LRN
Likelihood Ratio & Post Test
Probability
Test Disease Tota
l
Yes No
+ ve 90 10 100
-ve 20 180 200
Tota
l
110 190 300
Likelihood Ratio (+ve test)
= Sensitivity / (1-Specificity)
= 0.8182 / (1- 0.9493)
= 16.13
Post Test Probability + test
= LHR+ / (1+LHR+)
= 16.17 / (1+16.17)
=0.9417 ( = 94.17 %)
Probability that test positive
will have disease is @ 94%
Pre Test Probability (Prevalence)
= 110 / 300 = 0.3666 ( 36.66%)
Pretest Odds
= 0.3666 / (1- 0.3666)
= 0.5789
Likelihood Ratio & Post Test
Probability
Test Disease Tota
l
Yes No
+ ve 90 10 100
-ve 20 180 200
Tota
l
110 190 300
Likelihood Ratio (-ve test)
= (1-Sensitivity )/ Specificity
= (1-0.8182) / (0.9493)
= 0.1915
Post Test Probability -ve test
= LHR v-ve / (1+LHR-ve)
= 0.1915 / (1+0.1915)
= 0.1607 (= 16.07%)
Probability that test –ve will
have disease is @ 16%
( Ideally this should be =0.0 %
Pre Test Probability (Prevalence)
= 110 / 300 = 0.3666 ( 36.66%)
Pretest Odds
= 0.3666 / (1- 0.3666)
= 0.5789

More Related Content

PPTX
Roc curves
PDF
Sensitivity, specificity and likelihood ratios
PPTX
Tests of diagnostic accuracy
PDF
Dimensionality Reduction
PPTX
Menstrual hygiene in adolescent girls
PPTX
History and Trends in nursing education
PPTX
Ethics in research
PPTX
Chapter 2.2 screening test
Roc curves
Sensitivity, specificity and likelihood ratios
Tests of diagnostic accuracy
Dimensionality Reduction
Menstrual hygiene in adolescent girls
History and Trends in nursing education
Ethics in research
Chapter 2.2 screening test

What's hot (20)

PPT
Evaluating a diagnostic test presentation www.eyenirvaan.com - part 1
PPTX
Sensitivity, specificity, positive and negative predictive
PPTX
Diagnotic and screening tests
PPTX
Measuring Diagnostic Accuracy
PDF
General Introduction to ROC Curves
PPTX
ROC CURVE AND ANALYSIS.pptx
PPTX
Case control study
PPTX
randomised controlled trial
PPTX
How to read a receiver operating characteritic (ROC) curve
PPTX
Cohort study - basics
PPTX
5. cohort studies
PPTX
Odds ratio
PPTX
PPTX
Screening and diagnostic tests
PPT
Predictive value and likelihood ratio
PPT
Meta analysis
PPT
Measures Of Association
PPT
Research Methodology - Study Designs
PPTX
PPTX
Screening test (basic concepts)
Evaluating a diagnostic test presentation www.eyenirvaan.com - part 1
Sensitivity, specificity, positive and negative predictive
Diagnotic and screening tests
Measuring Diagnostic Accuracy
General Introduction to ROC Curves
ROC CURVE AND ANALYSIS.pptx
Case control study
randomised controlled trial
How to read a receiver operating characteritic (ROC) curve
Cohort study - basics
5. cohort studies
Odds ratio
Screening and diagnostic tests
Predictive value and likelihood ratio
Meta analysis
Measures Of Association
Research Methodology - Study Designs
Screening test (basic concepts)
Ad

Similar to 7. evaluation of diagnostic test (20)

PPTX
5 EPIDIMIOLOGY GROUP 5-1.pptx Assessinging
PPTX
Dr Amit Diagnostic Tests.pptx
PDF
John Billings: Developing a new predictive risk model
PDF
Data analysis ( Bio-statistic )
PPTX
Diagnostic Tests for PGs
PPT
Cairo 02 Stat Inference
PDF
Basic QC Statistics - Improving Laboratory Performance Through Quality Contro...
PPTX
screening for diseases.pptx . ...
PDF
Implementing decision rule made simple
PPTX
SCREENING-1.pptx including sensitivity .
PPT
screening and diagnostic testing
PDF
Analytical Method Validation basics by Dr. A. Amsavel
PPTX
Diagnostic test
PPTX
Epidemiological method to determine utility of a diagnostic test
PPT
Validity of a screening test
PPT
Validity andreliability
PDF
How to Measure Uncertainty
PDF
screening-140217071714-phpapp02.pdf
PDF
[Workshop] Implementation of screening (Oct10)
PPTX
Validation of qualitative lab test methods
5 EPIDIMIOLOGY GROUP 5-1.pptx Assessinging
Dr Amit Diagnostic Tests.pptx
John Billings: Developing a new predictive risk model
Data analysis ( Bio-statistic )
Diagnostic Tests for PGs
Cairo 02 Stat Inference
Basic QC Statistics - Improving Laboratory Performance Through Quality Contro...
screening for diseases.pptx . ...
Implementing decision rule made simple
SCREENING-1.pptx including sensitivity .
screening and diagnostic testing
Analytical Method Validation basics by Dr. A. Amsavel
Diagnostic test
Epidemiological method to determine utility of a diagnostic test
Validity of a screening test
Validity andreliability
How to Measure Uncertainty
screening-140217071714-phpapp02.pdf
[Workshop] Implementation of screening (Oct10)
Validation of qualitative lab test methods
Ad

More from Ashok Kulkarni (17)

PPT
Dissertation writing
PPTX
Statistics in medical research
PPTX
Inferential statistics
PPTX
15. descriptive statistics
PPT
Scientific paper writing
PPT
13. qualitative research
PPTX
12. ethics in medical research
PPT
11. data management
PPT
10. searching references
PPT
Appraisal of research v3
PPT
Sampling methods
PPT
6. sample size v3
PPTX
5. experimental studies
PPT
4. case control study
PPT
3. descriptive studies
PPT
2. overview of study designs
PPTX
1. introduction-v2
Dissertation writing
Statistics in medical research
Inferential statistics
15. descriptive statistics
Scientific paper writing
13. qualitative research
12. ethics in medical research
11. data management
10. searching references
Appraisal of research v3
Sampling methods
6. sample size v3
5. experimental studies
4. case control study
3. descriptive studies
2. overview of study designs
1. introduction-v2

Recently uploaded (20)

PPTX
History and examination of abdomen, & pelvis .pptx
PPTX
Chapter-1-The-Human-Body-Orientation-Edited-55-slides.pptx
PPT
genitourinary-cancers_1.ppt Nursing care of clients with GU cancer
PPTX
NEET PG 2025 Pharmacology Recall | Real Exam Questions from 3rd August with D...
PDF
Khadir.pdf Acacia catechu drug Ayurvedic medicine
PDF
Medical Evidence in the Criminal Justice Delivery System in.pdf
PPTX
Fundamentals of human energy transfer .pptx
PPTX
Important Obstetric Emergency that must be recognised
PPTX
DENTAL CARIES FOR DENTISTRY STUDENT.pptx
PPTX
Note on Abortion.pptx for the student note
PPTX
ca esophagus molecula biology detailaed molecular biology of tumors of esophagus
PDF
Therapeutic Potential of Citrus Flavonoids in Metabolic Inflammation and Ins...
PPTX
Uterus anatomy embryology, and clinical aspects
PPTX
POLYCYSTIC OVARIAN SYNDROME.pptx by Dr( med) Charles Amoateng
PPTX
post stroke aphasia rehabilitation physician
PDF
NEET PG 2025 | 200 High-Yield Recall Topics Across All Subjects
PPTX
ACID BASE management, base deficit correction
PDF
CT Anatomy for Radiotherapy.pdf eryuioooop
PPTX
Gastroschisis- Clinical Overview 18112311
DOCX
NEET PG 2025 | Pharmacology Recall: 20 High-Yield Questions Simplified
History and examination of abdomen, & pelvis .pptx
Chapter-1-The-Human-Body-Orientation-Edited-55-slides.pptx
genitourinary-cancers_1.ppt Nursing care of clients with GU cancer
NEET PG 2025 Pharmacology Recall | Real Exam Questions from 3rd August with D...
Khadir.pdf Acacia catechu drug Ayurvedic medicine
Medical Evidence in the Criminal Justice Delivery System in.pdf
Fundamentals of human energy transfer .pptx
Important Obstetric Emergency that must be recognised
DENTAL CARIES FOR DENTISTRY STUDENT.pptx
Note on Abortion.pptx for the student note
ca esophagus molecula biology detailaed molecular biology of tumors of esophagus
Therapeutic Potential of Citrus Flavonoids in Metabolic Inflammation and Ins...
Uterus anatomy embryology, and clinical aspects
POLYCYSTIC OVARIAN SYNDROME.pptx by Dr( med) Charles Amoateng
post stroke aphasia rehabilitation physician
NEET PG 2025 | 200 High-Yield Recall Topics Across All Subjects
ACID BASE management, base deficit correction
CT Anatomy for Radiotherapy.pdf eryuioooop
Gastroschisis- Clinical Overview 18112311
NEET PG 2025 | Pharmacology Recall: 20 High-Yield Questions Simplified

7. evaluation of diagnostic test

  • 1. Evaluation of Diagnostic Test Dr. A.P. Kulkarni MD, DPH, PhD, FIAPSM drapkulkarni@gmail.com
  • 2. Lesson objectives At the end of the session the participants would be able to A.Enlist the indicators for evaluation of a diagnostic test B.Describe and calculate sensitivity, specificity & predictive power C.Describe the utility of ROC curve D.Describe the utility of Kappa Statistics
  • 3. Indicators • Validity • Reproducibility • Acceptability • Feasibility : Validity  Sensitivity  Specificity  Predictive Power Positive Test Negative Test
  • 4. Gold standard • Universally accepted test • Validity indicators calculated with reference to gold standard
  • 5. Test Result Disease (As diagnosed by golden test) Yes No Positive True + ve False + ve Negative False - ve True - ve
  • 6. Test Result Disease Total Yes No Positive a b a + b Negative c d c + d Total a + c b+ d n
  • 7. Test Disease Total Yes No + ve 90 10 100 -Ve 20 180 200 Total 110 190 300 Example
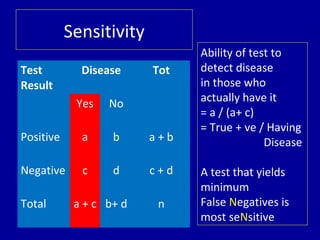
  • 8. Test Result Disease Tot Yes No Positive a b a + b Negative c d c + d Total a + c b+ d n Sensitivity Ability of test to detect disease in those who actually have it = a / (a+ c) = True + ve / Having Disease A test that yields minimum False Negatives is most seNsitive
  • 9. Test Disease Total Yes No + ve 90 10 100 -ve 20 180 200 Total 110 190 300 Example Sensitivity = 90 / 110 = 0.8182 =81.82 %
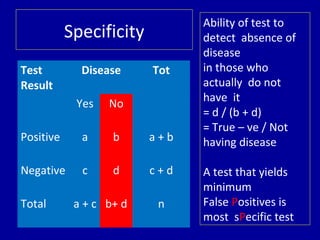
  • 10. Test Result Disease Tot Yes No Positive a b a + b Negative c d c + d Total a + c b+ d n Specificity Ability of test to detect absence of disease in those who actually do not have it = d / (b + d) = True – ve / Not having disease A test that yields minimum False Positives is most sPecific test
  • 11. Test Disease Total Yes No + ve 90 10 100 -ve 20 180 200 Total 110 190 300 Example Specificity = 180 / 190 = 0.9473 = 94.73 %
  • 12. Test Result Disease Tot Yes No Positive a b a + b Negative c d c + d Total a + c b+ d n Predictive Power of Positive Test Probability that a person will have disease if test is positive = a / ( a + b ) = True + ve / Test + ve
  • 13. Test Disease Total Yes No + ve 90 10 100 -ve 20 180 200 Total 110 190 300 Example Pr. Power (+ve Test) = 90 / 100 = 0.9000 = 90.00 %
  • 14. Test Result Disease Tot Yes No Positive a b a + b Negative c d c + d Total a + c b+ d n Predictive Power of Negative Test Probability that a person will NOT have disease if test is negative = d/ ( c + d ) = True -ve / Test - ve Predictive power also depends on prevalence of disease
  • 16. Test Disease Total Yes No + ve 90 10 100 -ve 20 180 200 Total 110 190 300 Example Pr. Power (-ve Test) = 180 / 200 = 0.9000 = 90.00 %
  • 17. Reproducibility • Ability of test to give consistent results when repeated under similar conditions. Observer errors Errors in instrument / procedures Biological variation Improvement in reproducibility  Training of personnel  Standardization of procedures & instruments  Multiple testing and averaging
  • 18. Points To Remember • New test is always compared with established test (Golden Standard) • All measures are relative to that golden standard and would change if golden standard is changed • If different cut-offs are set, sensitivity / specificity changes ( if in one increases, the other decreases) • Observed indicators are subject to sampling variation
  • 19. Points to remember 1. Validity( Syn.= accuracy): ability of measurement to be correct on an average. 2. Reproducibility( Syn.= precision, repeatability, reliability): ability of measurement to give same or similar result with repeated measurement 3. Economicity( Syn.= efficiency): extent to which the expenditures on the test in clinical and public health practice commensurate with the results 4. Acceptability, cost, ease of administration, technical ease.
  • 20. Points to remember • Accuracy: How close the estimates of new test are to the truth. Truth is what GOLD STANDARD says. So, for accuracy, Gold standard is a must. • Reproducibility: How close are the repeated estimates of the new test to each other. So, for reproducibility, we must repeat the test in similar circumstances. Gold standard is NOT required here.
  • 22. ROC Curve • Receiver Operating Characteristic Curves Uses 1. Deciding cut-off points 2. Comparing two tests Example • If fasting blood sugar (FBS) after 2 hrs is taken as a NEW test and its sensitivity / specificity is compared against GTT ( the golden test) • The sensitivity / specificity would differ at different cut-offs of FBS levels
  • 23. ROC Curve- Example • Y axis : Sensitivity • X axis : (1- Specificity ) • Maximizing sensitivity corresponds to some large value on y-axis • Maximizing specificity corresponds to some small value on x-axis • Good first choice will be the one corresponding to upper left corner
  • 24. ROC Curve- Area Under Curve (AUC) • An important measure of accuracy of the test • If AUC = 1, then curve consists of two lines Vertical: 0,0 to 0,1 and horizontal : 0,1 to 1,1 (Indicated by bold blue line) : The best, ideal • If AUC =0.5: A diagonal line results (0,0 to 1,1 Indicates a test that cannot discriminate between normal & abnormal
  • 25. ROC Curve- Area Under Curve (AUC) • Softwares can calculate area under curve in a given case • Two or more tests can be compared statistically • May consist of measurements on same individuals (Paired Test) or on different individuals (Un-paired Test) • Test with higher AUC will be preferred .
  • 26. Which Test Would You Select ? AreaUC = 0.918 95 % CI: 0.878, 0.958 AreaUC = 0.803 95% CI: 0.737, 0.870
  • 27. What Cut Off Point Would You Select? +ve if => Sensitivity 1 - Specificity 64.0 1.0000 1.0000 67.5 1.0000 0.8837 72.5 1.0000 0.7791 77.5 1.0000 0.6628 82.5 0.9903 0.5581 87.5 0.9806 0.4535 92.5 0.9709 0.3488 97.5 0.9417 0.2674 102.5 0.8932 0.2093 107.5 0.8350 0.1628 +ve if => Sensitivity 1 - Specificity 112.5 0.7670 0.1279 117.5 0.6990 0.0930 122.5 0.6214 0.0698 127.5 0.5437 0.0465 135.0 0.4660 0.0233 142.5 0.3786 0.0116 147.5 0.2816 0.0116 152.5 0.1845 0.0116 157.5 0.0874 0.0116 161.0 0.0000 0.0000
  • 28. Row +ve if => Sensitivity 1 - Specificity Specificity Sensitivity + Specificity 1 64.0 1.0000 1.0000 0 1.0000 2 67.5 1.0000 0.8837 0.1163 1.1163 3 72.5 1.0000 0.7791 0.2209 1.2209 4 77.5 1.0000 0.6628 0.3372 1.3372 5 82.5 0.9903 0.5581 0.4419 1.4322 6 87.5 0.9806 0.4535 0.5465 1.5271 7 92.5 0.9709 0.3488 0.6512 1.6220 8 97.5 0.9417 0.2674 0.7326 1.6743 9 102.5 0.8932 0.2093 0.7907 1.6839 10 107.5 0.8350 0.1628 0.8372 1.6722 11 112.5 0.7670 0.1279 0.8721 1.6391 12 117.5 0.6990 0.0930 0.907 1.6060 13 122.5 0.6214 0.0698 0.9302 1.5516 14 127.5 0.5437 0.0465 0.9535 1.4972 Identify the row where total of sensitivity and specificity is highest
  • 29. Row +ve if => Sensitivity 1 - Specificity Specificity Sensitivity + Specificity 1 64.0 1.0000 1.0000 0 1.0000 2 67.5 1.0000 0.8837 0.1163 1.1163 3 72.5 1.0000 0.7791 0.2209 1.2209 4 77.5 1.0000 0.6628 0.3372 1.3372 5 82.5 0.9903 0.5581 0.4419 1.4322 6 87.5 0.9806 0.4535 0.5465 1.5271 7 92.5 0.9709 0.3488 0.6512 1.6220 8 97.5 0.9417 0.2674 0.7326 1.6743 9 102.5 0.8932 0.2093 0.7907 1.6839 10 107.5 0.8350 0.1628 0.8372 1.6722 11 112.5 0.7670 0.1279 0.8721 1.6391 12 117.5 0.6990 0.0930 0.907 1.6060 13 122.5 0.6214 0.0698 0.9302 1.5516 14 127.5 0.5437 0.0465 0.9535 1.4972 Identify the row where total of sensitivity and specificity is highest
  • 30. Kappa Statistics • Is the agreement between two or test a chance occurrence or otherwise • “Significant agreement” means that element is ruled out
  • 31. O=Observed frequency of agreement = a+d = 90 E1=Expected agreement (a) = (a+b)x((a+c)/N=12.24 E2=Expected agreement(d) =(c+d)x(b+d)/N= 42.64 E= E1+E2=54.88 New Test Gold Standard Total Disease Present Disease Absent Disease Present a (30) b (6) a+b (36) Disease Absent c (4) d (60) c+d (64) Total a+c (34) b+d (66) N (100)
  • 32. New Test Gold Standard Total Disease Present Disease Absent Disease Present a (30) b (6) a+b (36) Disease Absent c (4) d (60) c+d (64) Total a+c (34) b+d (66) N (100) Kappa = [Obsv Agree – Exp Agree] / [Total-Exp Agree] = [O-E ] / [N-E] = [90-54.88] / [100-54.88] = 35.12 / 45.12 = 0.780
  • 33. Interpretation of Kappa values K Interpretation < 0 No agreement 0 – 0.19 Negligible 0.20 – 0.39 Minimal agreement 0.40 – 0.59 Fair agreement 0.60 – 0.79 Good agreement 0.80 – 1.00 Excellent agreement 0.7783
  • 35. Further Evaluation 1. Likelihood Ratio 2. Post Test Odds and Post Test Probability 3. ROC Curves • Predictive power of test is affected by prevalence of the disease • Can be used for combination of tests • Can be used for several levels of test
  • 36. Further Evaluation • Pre Test Probability: Prevalence rate : Probability that a person will have the target disorder before the test is carried out • Pre Test Odds: The odds that the patient has the target disorder before the test is carried out (pre-test probability/ [1 - pre-test probability]).
  • 37. Further Evaluation • Pre Test Probability: Prevalence rate : Probability that a person will have the target disorder before the test is carried out • Pre Test Odds: The odds that the patient has the target disorder before the test is carried out • Post Test Probability: The proportion of patients with that particular test result who have the target disorder • Post Test Odds: The odds that the patient is declared to have the target disorder after the test is carried out
  • 38. Further Evaluation • Pre Test Probability: (PrTP) Prevalence rate : Persons with disorder ÷ Persons without disorder [Range: 0-1] • Pre Test Odds: (PrTO) = PrTP / (1- PrTP) [Range 0 to Infinity] • Post Test Probability: (PoTP) • Post Test Odds: (PoTO) Requires calculation of Likelihood Ratio
  • 39. Further Evaluation • Likelihood Ratio Positive Test (LRP) LRP = Sensitivity / (1- Specificity) • Likelihood Ratio Negative Test (LRN) LRN = (1- Sensitivity) / Specificity • Post Test Probability Positive Test (PoTPP) (Probability that test +ve will have target disease) PoTPP = PrTP x LRP • Post Test Probability Negative Test (PoTPN) Probability that a test –ve will have target disease PoTPN = PrTP x LRN
  • 40. Likelihood Ratio & Post Test Probability Test Disease Tota l Yes No + ve 90 10 100 -ve 20 180 200 Tota l 110 190 300 Likelihood Ratio (+ve test) = Sensitivity / (1-Specificity) = 0.8182 / (1- 0.9493) = 16.13 Post Test Probability + test = LHR+ / (1+LHR+) = 16.17 / (1+16.17) =0.9417 ( = 94.17 %) Probability that test positive will have disease is @ 94% Pre Test Probability (Prevalence) = 110 / 300 = 0.3666 ( 36.66%) Pretest Odds = 0.3666 / (1- 0.3666) = 0.5789
  • 41. Likelihood Ratio & Post Test Probability Test Disease Tota l Yes No + ve 90 10 100 -ve 20 180 200 Tota l 110 190 300 Likelihood Ratio (-ve test) = (1-Sensitivity )/ Specificity = (1-0.8182) / (0.9493) = 0.1915 Post Test Probability -ve test = LHR v-ve / (1+LHR-ve) = 0.1915 / (1+0.1915) = 0.1607 (= 16.07%) Probability that test –ve will have disease is @ 16% ( Ideally this should be =0.0 % Pre Test Probability (Prevalence) = 110 / 300 = 0.3666 ( 36.66%) Pretest Odds = 0.3666 / (1- 0.3666) = 0.5789