SlideShare a Scribd company logo
HBase Metrics: What they mean to you

             David S. Wang
           dsw@cloudera.com
               5/22/12

                     HBaseCon 2012. 5/22/12
          Copyright 2012 Cloudera Inc. All rights reserved
Agenda

•   Motivation
•   Where to get metrics
•   Collection methods
•   Metrics:
    •   HBase Operations
    •   Memory-related
    •   Latency-related
    •   Host-level
• Takeaways

                                 HBaseCon 2012. 5/22/12                  2
                      Copyright 2012 Cloudera Inc. All rights reserved
Motivation

• To understand the steady-state
  behavior of your HBase cluster
• To debug when something bad
  happens
• To help evaluate changes
• To figure out when you need
  to buy more hardware


                             HBaseCon 2012. 5/22/12                  3
                  Copyright 2012 Cloudera Inc. All rights reserved
Where to get metrics
       JVM                                                JVM
            Region server
                                                                  Master
               Region
                Region

                                                         JVM

                                                                 HDFS
    Metrics can be obtained                                    DataNode
    from all of these areas

     Host
                CPUs          Memory                   Disks                Network


                                    HBaseCon 2012. 5/22/12                            4
                         Copyright 2012 Cloudera Inc. All rights reserved
Collection methods

                                          •     Dump to file
                                          •     web UI /jmx
                                          •     jconsole
                                          •     Ganglia
                                          •     Cloudera Manager
                                          •     Many other tools out
                                                there – suggestions
                                                welcome


                         HBaseCon 2012. 5/22/12                        5
              Copyright 2012 Cloudera Inc. All rights reserved
HBase Operations: compactions


  • hbase.regionserver.compactionQueueSize – size of queue of compactions
    waiting to be processed
  • h.r.compactionSize_avg_time – average bytes processed per compaction
  • h.r.compactionTime_avg_time – average time per compaction in
    milliseconds
  • h.r.compactionSize_num_ops, h.r.compactionTime_num_ops – total
    number of compactions so far
  • TIP: Spikes in h.r.compactionQueueSize could mean all of your regions
    are growing at the same rate and need to split/compact at around the
    same time – time to presplit your regions or turn off auto-compactions
                                 HBaseCon 2012. 5/22/12                  6
                      Copyright 2012 Cloudera Inc. All rights reserved
HBase Operations: flushes


  • h.r.flushQueueSize – size of queue of flushes waiting to be
    processed
  • h.r.flushSize_avg_time – average bytes processed per flush
  • h.r.flushTime_avg_time – average time per flush in milliseconds
  • h.r.flushSize_num_ops, h.r.flushTime_num_ops – total number of
    flushes so far
  • TIP: Small h.r.flushSize_avg_time and large flushQueueSize mean
    premature flushes: may indicate that you need more RAM, or you
    are ingesting and flushing faster than your disks can handle
                               HBaseCon 2012. 5/22/12                  7
                    Copyright 2012 Cloudera Inc. All rights reserved
HBase Operations: region splits


  • h.r.regionSplitFailureCount – number of unsuccessful splits
  • h.r.regionSplitSuccessCount – number of successful splits
  • TIP: Spikes in h.r.regionSplitSuccessCount may mean that you are
    spending too much time splitting – think about pre-splitting your
    regions
  • TIP: Sustained high rates of h.r.regionSplitSuccessCount may mean
    that you are ingesting fast enough to exceed your region size
    configuration – change the configuration and/or presplit/disable
    automatic splits
                                HBaseCon 2012. 5/22/12                  8
                     Copyright 2012 Cloudera Inc. All rights reserved
HBase Operations: stores and storefiles


  • h.r.stores – total number of stores
  • h.r.storefiles – total number of storefiles
  • TIP: Large ratio between number of h.r.stores and
    h.r.storefiles may indicate it’s time to compact more
    frequently – otherwise read performance can suffer


                                HBaseCon 2012. 5/22/12                  9
                     Copyright 2012 Cloudera Inc. All rights reserved
Memory: memstores


  • h.r.memstoreSizeMB – sum of all the memstore sizes in megabytes
  • h.r.numPutsWithoutWAL – number of puts with
    setWriteToWAL(false)
  • h.r.mbInMemoryWithoutWAL – amount of data from puts with
    setWriteToWAL(false) in megabytes
  • TIP: Anytime you have non-zero values in h.r.numPutsWithoutWAL
    and h.r.mbInMemoryWithoutWAL, you risk data loss if the RS
    crashes, until the next flush when they go back down to zero.
    Useful to detect applications that setWriteToWAL(false).

                               HBaseCon 2012. 5/22/12                  10
                    Copyright 2012 Cloudera Inc. All rights reserved
Memory: block cache


  • h.r.blockCacheCount - number of blocks in block cache
  • h.r.blockCacheEvictedCount – number of blocks evicted in the last period
  • h.r.blockCacheFree, h.r.blockCacheSize – free/occupied space in block
    cache in bytes
  • TIP: High sustained levels of h.r.blockCacheEvictedCount mean your block
    cache is turning over due to heap size constraints – possibly more GCs
      • Get more memory
      • Repartition heap amongst the various processes on the host – more for RS


                                    HBaseCon 2012. 5/22/12                         11
                         Copyright 2012 Cloudera Inc. All rights reserved
Memory: block cache


  • h.r.blockCacheHitCount, h.r.blockCacheMissCount – number of cache
    hits/misses
  • h.r.blockCacheHitRatio/h.r.blockCacheHitRatioPastNPeriods – hit ratio (cache
    hits/total requests) for past period, past N periods
  • h.r.blockCacheHitCachingRatio/h.r.blockCacheHitCachingRatioPastNPeriods
    – hit caching ratio (cache hits from requests set to use block cache/total
    requests set to use block cache) for past period, past N periods
  • TIP: With sustained traffic, in general you want your block cache to be fully
    utilized for maximum performance – high h.r.blockCacheHitRatio and
    h.r.blockCacheHitCachingRatio

                                   HBaseCon 2012. 5/22/12                      12
                        Copyright 2012 Cloudera Inc. All rights reserved
Memory: JVM-specific metrics


  • GC
     • TIP: Correlate with “concurrent mode failure” or “promotion failed” in the
        GC logs for GC pauses
  • Heap usage
     • TIP: Do not want this to max out – add more memory or assign more heap
        to your RS
  • Number of logs categorized by level
     • TIP: Be careful of any WARN or ERROR logs – helpful first indicator to look
        more deeply in logs
  • Threads blocked/running

                                   HBaseCon 2012. 5/22/12                        13
                        Copyright 2012 Cloudera Inc. All rights reserved
Latency: FS read


  • h.r.fsReadLatency_avg_time – average time per sequential read in ms
  • h.r.fsReadLatency_num_ops – number of sequential reads
  • h.r.fsPreadLatency_avg_time – average time per positional read in ms
  • h.r.fsPreadLatency_num_ops – number of positional reads
  • Various histograms based on this – 75th, 95th percentile, mean, standard
    deviation, etc., in nanoseconds
  • TIP: Spikes in h.r.fsReadLatency_avg_time/h.r.fsPreadLatency_avg_time
    can indicate HDFS/disk/network problems
                                  HBaseCon 2012. 5/22/12                       14
                       Copyright 2012 Cloudera Inc. All rights reserved
Latency: FS write/sync
  • h.r.fsWriteLatency_avg_time – average time per HLog edit write in ms
  • h.r.fsWriteSize_avg_time – average size per HLog edit write in bytes
  • h.r.fsWriteLatency_num_ops, h.r.fsWriteSize_num_ops – number of HLog
    edit writes
  • h.r.fsSyncLatency_avg_time – average time to sync HLogs to the filesystem
    in ms
  • h.r.fsSyncLatency_num_ops – number of HLog syncs
  • h.r.slowHLogAppendCount – number of HLog edits that took longer than 1
    second
      TIP: Search for a WARN-level log message with the text “appending an edit to hlog”;
      use that time to spelunk through logs to see what else is going on
  • Various histograms based on this – 75th, 95th percentile, mean, standard
    deviation, etc., in nanoseconds
  • TIP: Spikes in write or sync latencies can also be due to HDFS/bad
    disks/bad network

                                     HBaseCon 2012. 5/22/12                             15
                          Copyright 2012 Cloudera Inc. All rights reserved
Latency, region: per-operation-type, per-region
  • From regionserver metrics: h.r.*RequestLatency - latency histograms for
    various client operations in nanoseconds
  • Also general RPC metrics for all requests from clients
      • rpc.metrics.RPCQueueTime is time it takes from receipt of the RPC until it starts
        being processed
      • rpc.metrics.RPCProcessingTime is time it takes from start to end of processing
      • TIP: These are some of the first places to look if your client seems to be running
        slow
  • h.r.readRequestsCount – requests for gets, scanners. Not # of rows.
  • h.r.writeRequestsCount – requests for puts, deletes, etc. Not # of rows.
  • hbase.RegionServerDynamicStatistics.* contains some metrics on a per-
    region and per-column-family basis
      • Subset of block cache, compaction, flush, store/storefile sizes, etc.
  • TIP: These metrics can be used to answer the questions:
      • Is the problem only in one region or in all regions?
      • Is the problem only with one operation type or all operations?


                                      HBaseCon 2012. 5/22/12                                 16
                           Copyright 2012 Cloudera Inc. All rights reserved
Host-level metrics
  • CPU:
     •   Load averages
     •   % idle/system/user/wio (waiting for block I/O)
     •   Running/total processes
     •   Correlate with “top”, “sar”, “mpstat” to figure out which process is
         doing what.
           • TIP: If a process is eating a lot of CPU, that is a clue to look at its logs
  • Memory:
     • swap_free/swap_total
     • cached/free/shared
     • TIP: Compare with logs, other metrics to help determine causes of
         OOMs


                                      HBaseCon 2012. 5/22/12                                17
                           Copyright 2012 Cloudera Inc. All rights reserved
Host-level metrics
  • Network:
     • Bytes/packets sent/received
     • TIP: Correlate with ZK timeouts from logs if RSes are going down
     • TIP: Also look at Ethernet frame errors from ifconfig if you are
       experiencing unexpected dips in network traffic
  • Disk I/O:
     • Read/write latencies
         • Slow disks make HBase performance very bad, especially on .META.
         • TIP: Check dmesg for SCSI errors
     • disk space available
     • swap usage
         • TIP: Should be 0 – otherwise you will have timeouts and RSes going
            down. Add RAM and/or buy more boxes.
                                  HBaseCon 2012. 5/22/12                        18
                       Copyright 2012 Cloudera Inc. All rights reserved
Takeaways

• Know what you are looking for
   • Know what metrics are available, what they mean
   • Collect a lot of different metrics, but don’t drown in them
• Metrics are not all you need
   • Correlate metrics with logs, workload
   • Metrics are another tool in your toolbox. You still have to do
     the work to monitor/debug/tune.


                                HBaseCon 2012. 5/22/12                  19
                     Copyright 2012 Cloudera Inc. All rights reserved
Takeaways
                                        • Take a baseline of your
                                          system in steady-state
                                                • For later comparison if things
                                                  go bad
                                                • Try to make this as apples-to-
                                                  apples as possible, e.g. same
                                                  hardware/workload/config
                                        • Spikes or dips from
                                          baseline can indicate
                                          problems
                                                • But also depends on which
                                                  metric and if you can explain
                                                  it (e.g. increased workload)

                       HBaseCon 2012. 5/22/12                                     20
            Copyright 2012 Cloudera Inc. All rights reserved
Thank you
 (Especially to Jon Hsieh and Todd Lipcon
for their helpful reviews and suggestions)


         Cloudera is hiring
     E-mail me: dsw@cloudera.com


                   HBaseCon 2012. 5/22/12                  21
        Copyright 2012 Cloudera Inc. All rights reserved

More Related Content

PPTX
Apache HBase Performance Tuning
PDF
HBaseCon 2012 | HBase Schema Design - Ian Varley, Salesforce
PPTX
Materialized Views and Secondary Indexes in Scylla: They Are finally here!
PPTX
How to understand and analyze Apache Hive query execution plan for performanc...
PDF
Etsy Activity Feeds Architecture
PDF
HBase HUG Presentation: Avoiding Full GCs with MemStore-Local Allocation Buffers
PPTX
Hadoop World 2011: Advanced HBase Schema Design - Lars George, Cloudera
PDF
Improvements to Apache HBase and Its Applications in Alibaba Search
Apache HBase Performance Tuning
HBaseCon 2012 | HBase Schema Design - Ian Varley, Salesforce
Materialized Views and Secondary Indexes in Scylla: They Are finally here!
How to understand and analyze Apache Hive query execution plan for performanc...
Etsy Activity Feeds Architecture
HBase HUG Presentation: Avoiding Full GCs with MemStore-Local Allocation Buffers
Hadoop World 2011: Advanced HBase Schema Design - Lars George, Cloudera
Improvements to Apache HBase and Its Applications in Alibaba Search

What's hot (20)

PDF
Cassandra serving netflix @ scale
PPTX
Apache HBase at Airbnb
PPTX
HBaseCon 2013: Apache HBase and HDFS - Understanding Filesystem Usage in HBase
PPTX
Off-heaping the Apache HBase Read Path
PDF
Apache HBase Improvements and Practices at Xiaomi
PPT
Hadoop hive presentation
PPTX
Apache Ignite vs Alluxio: Memory Speed Big Data Analytics
PDF
Scaling Apache Spark at Facebook
PPT
Hadoop Security Architecture
PPTX
Hive + Tez: A Performance Deep Dive
PDF
Cassandra Introduction & Features
PPTX
Application Timeline Server - Past, Present and Future
PPTX
Introduction to HiveQL
PDF
HDFS Architecture
PDF
Deploying Flink on Kubernetes - David Anderson
PPTX
HBase and HDFS: Understanding FileSystem Usage in HBase
PPTX
Microservices and docker
PDF
톰캣 운영 노하우
PDF
Amazon S3 Best Practice and Tuning for Hadoop/Spark in the Cloud
PDF
Simplify CDC Pipeline with Spark Streaming SQL and Delta Lake
Cassandra serving netflix @ scale
Apache HBase at Airbnb
HBaseCon 2013: Apache HBase and HDFS - Understanding Filesystem Usage in HBase
Off-heaping the Apache HBase Read Path
Apache HBase Improvements and Practices at Xiaomi
Hadoop hive presentation
Apache Ignite vs Alluxio: Memory Speed Big Data Analytics
Scaling Apache Spark at Facebook
Hadoop Security Architecture
Hive + Tez: A Performance Deep Dive
Cassandra Introduction & Features
Application Timeline Server - Past, Present and Future
Introduction to HiveQL
HDFS Architecture
Deploying Flink on Kubernetes - David Anderson
HBase and HDFS: Understanding FileSystem Usage in HBase
Microservices and docker
톰캣 운영 노하우
Amazon S3 Best Practice and Tuning for Hadoop/Spark in the Cloud
Simplify CDC Pipeline with Spark Streaming SQL and Delta Lake
Ad

Viewers also liked (20)

PDF
HBaseCon 2015: Running ML Infrastructure on HBase
PPTX
HBaseCon 2012 | Leveraging HBase for the World’s Largest Curated Genomic Data...
PDF
Tales from the Cloudera Field
PPTX
HBaseCon 2015: DeathStar - Easy, Dynamic, Multi-tenant HBase via YARN
PPTX
HBaseCon 2013: Being Smarter Than the Smart Meter
PDF
HBase Read High Availability Using Timeline-Consistent Region Replicas
PDF
HBaseCon 2013: Apache HBase, Meet Ops. Ops, Meet Apache HBase.
PPTX
HBaseCon 2015: Trafodion - Integrating Operational SQL into HBase
PPTX
HBaseCon 2013: 1500 JIRAs in 20 Minutes
PPTX
Cross-Site BigTable using HBase
PPTX
HBaseCon 2013: Rebuilding for Scale on Apache HBase
PPTX
HBaseCon 2013: Evolving a First-Generation Apache HBase Deployment to Second...
PPT
HBaseCon 2013: Apache Hadoop and Apache HBase for Real-Time Video Analytics
PPTX
HBaseCon 2012 | Relaxed Transactions for HBase - Francis Liu, Yahoo!
PPT
HBaseCon 2012 | Building Mobile Infrastructure with HBase
PDF
HBaseCon 2012 | Content Addressable Storages for Fun and Profit - Berk Demir,...
PPTX
HBaseCon 2012 | HBase for the Worlds Libraries - OCLC
PPTX
HBaseCon 2012 | Living Data: Applying Adaptable Schemas to HBase - Aaron Kimb...
PPTX
HBaseCon 2012 | Scaling GIS In Three Acts
PPTX
HBaseCon 2013: Apache HBase on Flash
HBaseCon 2015: Running ML Infrastructure on HBase
HBaseCon 2012 | Leveraging HBase for the World’s Largest Curated Genomic Data...
Tales from the Cloudera Field
HBaseCon 2015: DeathStar - Easy, Dynamic, Multi-tenant HBase via YARN
HBaseCon 2013: Being Smarter Than the Smart Meter
HBase Read High Availability Using Timeline-Consistent Region Replicas
HBaseCon 2013: Apache HBase, Meet Ops. Ops, Meet Apache HBase.
HBaseCon 2015: Trafodion - Integrating Operational SQL into HBase
HBaseCon 2013: 1500 JIRAs in 20 Minutes
Cross-Site BigTable using HBase
HBaseCon 2013: Rebuilding for Scale on Apache HBase
HBaseCon 2013: Evolving a First-Generation Apache HBase Deployment to Second...
HBaseCon 2013: Apache Hadoop and Apache HBase for Real-Time Video Analytics
HBaseCon 2012 | Relaxed Transactions for HBase - Francis Liu, Yahoo!
HBaseCon 2012 | Building Mobile Infrastructure with HBase
HBaseCon 2012 | Content Addressable Storages for Fun and Profit - Berk Demir,...
HBaseCon 2012 | HBase for the Worlds Libraries - OCLC
HBaseCon 2012 | Living Data: Applying Adaptable Schemas to HBase - Aaron Kimb...
HBaseCon 2012 | Scaling GIS In Three Acts
HBaseCon 2013: Apache HBase on Flash
Ad

Similar to HBaseCon 2012 | Base Metrics: What They Mean to You - Cloudera (20)

PPTX
Supporting Apache HBase : Troubleshooting and Supportability Improvements
PPTX
Supporting Apache HBase : Troubleshooting and Supportability Improvements
PDF
HBase tales from the trenches
PDF
Apache hbase for the enterprise (Strata+Hadoop World 2012)
PDF
HBase Tales From the Trenches - Short stories about most common HBase operati...
PPTX
Strata + Hadoop World 2012: Apache HBase Features for the Enterprise
PPTX
HBase with MapR
PPTX
Hadoop Operations
KEY
TriHUG - Beyond Batch
PPTX
Hadoop Backup and Disaster Recovery
PPTX
HBase Low Latency, StrataNYC 2014
PPTX
Strata London 2019 Scaling Impala.pptx
PDF
Strata London 2019 Scaling Impala
PPTX
Inside MapR's M7
PPTX
Inside MapR's M7
PPTX
Big Data and Hadoop - History, Technical Deep Dive, and Industry Trends
PPTX
Big Data and Hadoop - History, Technical Deep Dive, and Industry Trends
PPTX
HDFS- What is New and Future
PPTX
HBase: Where Online Meets Low Latency
PDF
Flume and HBase
Supporting Apache HBase : Troubleshooting and Supportability Improvements
HBase tales from the trenches
Apache hbase for the enterprise (Strata+Hadoop World 2012)
HBase Tales From the Trenches - Short stories about most common HBase operati...
Strata + Hadoop World 2012: Apache HBase Features for the Enterprise
HBase with MapR
Hadoop Operations
TriHUG - Beyond Batch
Hadoop Backup and Disaster Recovery
HBase Low Latency, StrataNYC 2014
Strata London 2019 Scaling Impala.pptx
Strata London 2019 Scaling Impala
Inside MapR's M7
Inside MapR's M7
Big Data and Hadoop - History, Technical Deep Dive, and Industry Trends
HDFS- What is New and Future
HBase: Where Online Meets Low Latency
Flume and HBase

More from Cloudera, Inc. (20)

PPTX
Partner Briefing_January 25 (FINAL).pptx
PPTX
Cloudera Data Impact Awards 2021 - Finalists
PPTX
2020 Cloudera Data Impact Awards Finalists
PPTX
Edc event vienna presentation 1 oct 2019
PPTX
Machine Learning with Limited Labeled Data 4/3/19
PPTX
Data Driven With the Cloudera Modern Data Warehouse 3.19.19
PPTX
Introducing Cloudera DataFlow (CDF) 2.13.19
PPTX
Introducing Cloudera Data Science Workbench for HDP 2.12.19
PPTX
Shortening the Sales Cycle with a Modern Data Warehouse 1.30.19
PPTX
Leveraging the cloud for analytics and machine learning 1.29.19
PPTX
Modernizing the Legacy Data Warehouse – What, Why, and How 1.23.19
PPTX
Leveraging the Cloud for Big Data Analytics 12.11.18
PPTX
Modern Data Warehouse Fundamentals Part 3
PPTX
Modern Data Warehouse Fundamentals Part 2
PPTX
Modern Data Warehouse Fundamentals Part 1
PPTX
Extending Cloudera SDX beyond the Platform
PPTX
Federated Learning: ML with Privacy on the Edge 11.15.18
PPTX
Analyst Webinar: Doing a 180 on Customer 360
PPTX
Build a modern platform for anti-money laundering 9.19.18
PPTX
Introducing the data science sandbox as a service 8.30.18
Partner Briefing_January 25 (FINAL).pptx
Cloudera Data Impact Awards 2021 - Finalists
2020 Cloudera Data Impact Awards Finalists
Edc event vienna presentation 1 oct 2019
Machine Learning with Limited Labeled Data 4/3/19
Data Driven With the Cloudera Modern Data Warehouse 3.19.19
Introducing Cloudera DataFlow (CDF) 2.13.19
Introducing Cloudera Data Science Workbench for HDP 2.12.19
Shortening the Sales Cycle with a Modern Data Warehouse 1.30.19
Leveraging the cloud for analytics and machine learning 1.29.19
Modernizing the Legacy Data Warehouse – What, Why, and How 1.23.19
Leveraging the Cloud for Big Data Analytics 12.11.18
Modern Data Warehouse Fundamentals Part 3
Modern Data Warehouse Fundamentals Part 2
Modern Data Warehouse Fundamentals Part 1
Extending Cloudera SDX beyond the Platform
Federated Learning: ML with Privacy on the Edge 11.15.18
Analyst Webinar: Doing a 180 on Customer 360
Build a modern platform for anti-money laundering 9.19.18
Introducing the data science sandbox as a service 8.30.18

Recently uploaded (20)

PPTX
KOM of Painting work and Equipment Insulation REV00 update 25-dec.pptx
PDF
Shreyas Phanse Resume: Experienced Backend Engineer | Java • Spring Boot • Ka...
PDF
Machine learning based COVID-19 study performance prediction
PPTX
Cloud computing and distributed systems.
PDF
TokAI - TikTok AI Agent : The First AI Application That Analyzes 10,000+ Vira...
PDF
NewMind AI Monthly Chronicles - July 2025
PPTX
Digital-Transformation-Roadmap-for-Companies.pptx
PDF
Dropbox Q2 2025 Financial Results & Investor Presentation
PDF
Mobile App Security Testing_ A Comprehensive Guide.pdf
PDF
Chapter 3 Spatial Domain Image Processing.pdf
PPTX
Understanding_Digital_Forensics_Presentation.pptx
PDF
KodekX | Application Modernization Development
PPT
“AI and Expert System Decision Support & Business Intelligence Systems”
PPTX
20250228 LYD VKU AI Blended-Learning.pptx
PDF
Electronic commerce courselecture one. Pdf
PDF
Reach Out and Touch Someone: Haptics and Empathic Computing
PDF
NewMind AI Weekly Chronicles - August'25 Week I
PPTX
Effective Security Operations Center (SOC) A Modern, Strategic, and Threat-In...
PDF
Diabetes mellitus diagnosis method based random forest with bat algorithm
PDF
Unlocking AI with Model Context Protocol (MCP)
KOM of Painting work and Equipment Insulation REV00 update 25-dec.pptx
Shreyas Phanse Resume: Experienced Backend Engineer | Java • Spring Boot • Ka...
Machine learning based COVID-19 study performance prediction
Cloud computing and distributed systems.
TokAI - TikTok AI Agent : The First AI Application That Analyzes 10,000+ Vira...
NewMind AI Monthly Chronicles - July 2025
Digital-Transformation-Roadmap-for-Companies.pptx
Dropbox Q2 2025 Financial Results & Investor Presentation
Mobile App Security Testing_ A Comprehensive Guide.pdf
Chapter 3 Spatial Domain Image Processing.pdf
Understanding_Digital_Forensics_Presentation.pptx
KodekX | Application Modernization Development
“AI and Expert System Decision Support & Business Intelligence Systems”
20250228 LYD VKU AI Blended-Learning.pptx
Electronic commerce courselecture one. Pdf
Reach Out and Touch Someone: Haptics and Empathic Computing
NewMind AI Weekly Chronicles - August'25 Week I
Effective Security Operations Center (SOC) A Modern, Strategic, and Threat-In...
Diabetes mellitus diagnosis method based random forest with bat algorithm
Unlocking AI with Model Context Protocol (MCP)

HBaseCon 2012 | Base Metrics: What They Mean to You - Cloudera

  • 1. HBase Metrics: What they mean to you David S. Wang dsw@cloudera.com 5/22/12 HBaseCon 2012. 5/22/12 Copyright 2012 Cloudera Inc. All rights reserved
  • 2. Agenda • Motivation • Where to get metrics • Collection methods • Metrics: • HBase Operations • Memory-related • Latency-related • Host-level • Takeaways HBaseCon 2012. 5/22/12 2 Copyright 2012 Cloudera Inc. All rights reserved
  • 3. Motivation • To understand the steady-state behavior of your HBase cluster • To debug when something bad happens • To help evaluate changes • To figure out when you need to buy more hardware HBaseCon 2012. 5/22/12 3 Copyright 2012 Cloudera Inc. All rights reserved
  • 4. Where to get metrics JVM JVM Region server Master Region Region JVM HDFS Metrics can be obtained DataNode from all of these areas Host CPUs Memory Disks Network HBaseCon 2012. 5/22/12 4 Copyright 2012 Cloudera Inc. All rights reserved
  • 5. Collection methods • Dump to file • web UI /jmx • jconsole • Ganglia • Cloudera Manager • Many other tools out there – suggestions welcome HBaseCon 2012. 5/22/12 5 Copyright 2012 Cloudera Inc. All rights reserved
  • 6. HBase Operations: compactions • hbase.regionserver.compactionQueueSize – size of queue of compactions waiting to be processed • h.r.compactionSize_avg_time – average bytes processed per compaction • h.r.compactionTime_avg_time – average time per compaction in milliseconds • h.r.compactionSize_num_ops, h.r.compactionTime_num_ops – total number of compactions so far • TIP: Spikes in h.r.compactionQueueSize could mean all of your regions are growing at the same rate and need to split/compact at around the same time – time to presplit your regions or turn off auto-compactions HBaseCon 2012. 5/22/12 6 Copyright 2012 Cloudera Inc. All rights reserved
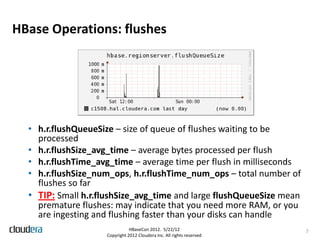
  • 7. HBase Operations: flushes • h.r.flushQueueSize – size of queue of flushes waiting to be processed • h.r.flushSize_avg_time – average bytes processed per flush • h.r.flushTime_avg_time – average time per flush in milliseconds • h.r.flushSize_num_ops, h.r.flushTime_num_ops – total number of flushes so far • TIP: Small h.r.flushSize_avg_time and large flushQueueSize mean premature flushes: may indicate that you need more RAM, or you are ingesting and flushing faster than your disks can handle HBaseCon 2012. 5/22/12 7 Copyright 2012 Cloudera Inc. All rights reserved
  • 8. HBase Operations: region splits • h.r.regionSplitFailureCount – number of unsuccessful splits • h.r.regionSplitSuccessCount – number of successful splits • TIP: Spikes in h.r.regionSplitSuccessCount may mean that you are spending too much time splitting – think about pre-splitting your regions • TIP: Sustained high rates of h.r.regionSplitSuccessCount may mean that you are ingesting fast enough to exceed your region size configuration – change the configuration and/or presplit/disable automatic splits HBaseCon 2012. 5/22/12 8 Copyright 2012 Cloudera Inc. All rights reserved
  • 9. HBase Operations: stores and storefiles • h.r.stores – total number of stores • h.r.storefiles – total number of storefiles • TIP: Large ratio between number of h.r.stores and h.r.storefiles may indicate it’s time to compact more frequently – otherwise read performance can suffer HBaseCon 2012. 5/22/12 9 Copyright 2012 Cloudera Inc. All rights reserved
  • 10. Memory: memstores • h.r.memstoreSizeMB – sum of all the memstore sizes in megabytes • h.r.numPutsWithoutWAL – number of puts with setWriteToWAL(false) • h.r.mbInMemoryWithoutWAL – amount of data from puts with setWriteToWAL(false) in megabytes • TIP: Anytime you have non-zero values in h.r.numPutsWithoutWAL and h.r.mbInMemoryWithoutWAL, you risk data loss if the RS crashes, until the next flush when they go back down to zero. Useful to detect applications that setWriteToWAL(false). HBaseCon 2012. 5/22/12 10 Copyright 2012 Cloudera Inc. All rights reserved
  • 11. Memory: block cache • h.r.blockCacheCount - number of blocks in block cache • h.r.blockCacheEvictedCount – number of blocks evicted in the last period • h.r.blockCacheFree, h.r.blockCacheSize – free/occupied space in block cache in bytes • TIP: High sustained levels of h.r.blockCacheEvictedCount mean your block cache is turning over due to heap size constraints – possibly more GCs • Get more memory • Repartition heap amongst the various processes on the host – more for RS HBaseCon 2012. 5/22/12 11 Copyright 2012 Cloudera Inc. All rights reserved
  • 12. Memory: block cache • h.r.blockCacheHitCount, h.r.blockCacheMissCount – number of cache hits/misses • h.r.blockCacheHitRatio/h.r.blockCacheHitRatioPastNPeriods – hit ratio (cache hits/total requests) for past period, past N periods • h.r.blockCacheHitCachingRatio/h.r.blockCacheHitCachingRatioPastNPeriods – hit caching ratio (cache hits from requests set to use block cache/total requests set to use block cache) for past period, past N periods • TIP: With sustained traffic, in general you want your block cache to be fully utilized for maximum performance – high h.r.blockCacheHitRatio and h.r.blockCacheHitCachingRatio HBaseCon 2012. 5/22/12 12 Copyright 2012 Cloudera Inc. All rights reserved
  • 13. Memory: JVM-specific metrics • GC • TIP: Correlate with “concurrent mode failure” or “promotion failed” in the GC logs for GC pauses • Heap usage • TIP: Do not want this to max out – add more memory or assign more heap to your RS • Number of logs categorized by level • TIP: Be careful of any WARN or ERROR logs – helpful first indicator to look more deeply in logs • Threads blocked/running HBaseCon 2012. 5/22/12 13 Copyright 2012 Cloudera Inc. All rights reserved
  • 14. Latency: FS read • h.r.fsReadLatency_avg_time – average time per sequential read in ms • h.r.fsReadLatency_num_ops – number of sequential reads • h.r.fsPreadLatency_avg_time – average time per positional read in ms • h.r.fsPreadLatency_num_ops – number of positional reads • Various histograms based on this – 75th, 95th percentile, mean, standard deviation, etc., in nanoseconds • TIP: Spikes in h.r.fsReadLatency_avg_time/h.r.fsPreadLatency_avg_time can indicate HDFS/disk/network problems HBaseCon 2012. 5/22/12 14 Copyright 2012 Cloudera Inc. All rights reserved
  • 15. Latency: FS write/sync • h.r.fsWriteLatency_avg_time – average time per HLog edit write in ms • h.r.fsWriteSize_avg_time – average size per HLog edit write in bytes • h.r.fsWriteLatency_num_ops, h.r.fsWriteSize_num_ops – number of HLog edit writes • h.r.fsSyncLatency_avg_time – average time to sync HLogs to the filesystem in ms • h.r.fsSyncLatency_num_ops – number of HLog syncs • h.r.slowHLogAppendCount – number of HLog edits that took longer than 1 second TIP: Search for a WARN-level log message with the text “appending an edit to hlog”; use that time to spelunk through logs to see what else is going on • Various histograms based on this – 75th, 95th percentile, mean, standard deviation, etc., in nanoseconds • TIP: Spikes in write or sync latencies can also be due to HDFS/bad disks/bad network HBaseCon 2012. 5/22/12 15 Copyright 2012 Cloudera Inc. All rights reserved
  • 16. Latency, region: per-operation-type, per-region • From regionserver metrics: h.r.*RequestLatency - latency histograms for various client operations in nanoseconds • Also general RPC metrics for all requests from clients • rpc.metrics.RPCQueueTime is time it takes from receipt of the RPC until it starts being processed • rpc.metrics.RPCProcessingTime is time it takes from start to end of processing • TIP: These are some of the first places to look if your client seems to be running slow • h.r.readRequestsCount – requests for gets, scanners. Not # of rows. • h.r.writeRequestsCount – requests for puts, deletes, etc. Not # of rows. • hbase.RegionServerDynamicStatistics.* contains some metrics on a per- region and per-column-family basis • Subset of block cache, compaction, flush, store/storefile sizes, etc. • TIP: These metrics can be used to answer the questions: • Is the problem only in one region or in all regions? • Is the problem only with one operation type or all operations? HBaseCon 2012. 5/22/12 16 Copyright 2012 Cloudera Inc. All rights reserved
  • 17. Host-level metrics • CPU: • Load averages • % idle/system/user/wio (waiting for block I/O) • Running/total processes • Correlate with “top”, “sar”, “mpstat” to figure out which process is doing what. • TIP: If a process is eating a lot of CPU, that is a clue to look at its logs • Memory: • swap_free/swap_total • cached/free/shared • TIP: Compare with logs, other metrics to help determine causes of OOMs HBaseCon 2012. 5/22/12 17 Copyright 2012 Cloudera Inc. All rights reserved
  • 18. Host-level metrics • Network: • Bytes/packets sent/received • TIP: Correlate with ZK timeouts from logs if RSes are going down • TIP: Also look at Ethernet frame errors from ifconfig if you are experiencing unexpected dips in network traffic • Disk I/O: • Read/write latencies • Slow disks make HBase performance very bad, especially on .META. • TIP: Check dmesg for SCSI errors • disk space available • swap usage • TIP: Should be 0 – otherwise you will have timeouts and RSes going down. Add RAM and/or buy more boxes. HBaseCon 2012. 5/22/12 18 Copyright 2012 Cloudera Inc. All rights reserved
  • 19. Takeaways • Know what you are looking for • Know what metrics are available, what they mean • Collect a lot of different metrics, but don’t drown in them • Metrics are not all you need • Correlate metrics with logs, workload • Metrics are another tool in your toolbox. You still have to do the work to monitor/debug/tune. HBaseCon 2012. 5/22/12 19 Copyright 2012 Cloudera Inc. All rights reserved
  • 20. Takeaways • Take a baseline of your system in steady-state • For later comparison if things go bad • Try to make this as apples-to- apples as possible, e.g. same hardware/workload/config • Spikes or dips from baseline can indicate problems • But also depends on which metric and if you can explain it (e.g. increased workload) HBaseCon 2012. 5/22/12 20 Copyright 2012 Cloudera Inc. All rights reserved
  • 21. Thank you (Especially to Jon Hsieh and Todd Lipcon for their helpful reviews and suggestions) Cloudera is hiring E-mail me: dsw@cloudera.com HBaseCon 2012. 5/22/12 21 Copyright 2012 Cloudera Inc. All rights reserved

Editor's Notes

  • #4: To understand the steady-state behavior of your HBase cluster:Establish a baselineTo debug when something bad happens:Compare with baselineTo help evaluate changes:ConfigurationWorkloadHardwareHelps point out bottlenecks
  • #5: Most metrics reside in the region serverMetrics for various categories (e.g. Stores, compactions, flushes)Metrics per operation type (e.g. get, put, delete)Remember HDFS,JVM, and host metrics as well
  • #6: Use FileContext in hadoop-metrics.properties to have metrics dumped to a file periodicallyweb UIs’ /jmx web pages dump metrics in JSONjconsole for interactive browsingGanglia: has built-in support in Hadoop/HBase, use GangliaContext or GangliaContext31
  • #7: avg_time metrics name is confusing when you are measuring something that isn’t time. Multiple num_ops metrics that mean the same thing are also confusing. Both are legacy of how code is writtenor use time-based keys, salted keys, reduce data (less columns/smaller column names, compression)
  • #8: again can change data schema (salted keys, row key composite of time and sha1/md5)
  • #9: Unsuccessful splits are rolled back. If the rollback fails, the RS aborts.
  • #10: Stores represent a CF, and can contain one or more StoreFiles. Reads have to go through all of the StoreFiles to get an overall view of the dataset for reads.Bloom filters and time range predicates may preclude storefiles from being culled.
  • #11: Remember that there is one memstore per store/CF
  • #13: http://hbase.apache.org/book/regionserver.arch.html contains a thorough explanation of how the block cache is used and what you can do to utilize it better.Turn off block caching for tables that have full table scans
  • #14: http://hbase.apache.org/book/trouble.log.html#trouble.log.gc explains how to configure GC logging and what they meanhttp://hbase.apache.org/book/jvm.html for what to do about GCs
  • #15: Network problems can come into play here if HDFS needs to fetch data for the read from somewhere else.
  • #16: HFile latencies are handled by the compaction and flush metricsHLog edits affect client-facing system latency more visiblyHDFS will have a pipeline per write, so any hiccups along that pipeline in either network or disk will affect latency.
  • #17: Hotspotting can be solved by methods such as hashing your rowkeys and pre-splitting regionshdfsBlocksLocalityIndex (HBASE-4114) may also be useful as higher indices normally mean lower latencies
  • #20: Easier to screen out metrics if you know what each of them mean
  • #21: Keep a library of baselines, changing one thing at a time