Acceleration of stochastic algorithm on fpga system
Download as DOCX, PDF0 likes156 views

This document describes a project to accelerate a stochastic disease spread simulation algorithm by implementing it on an FPGA system. It first designs a MATLAB simulation of a basic Susceptible-Infected-Recovered (SIR) disease model. It then implements the algorithm on three FPGAs using a hardware-compatible discrete version. The FPGA implementation generates random networks using MATLAB and displays results on a VGA screen in real-time. Verification shows the FPGA results match the MATLAB simulation, validating the hardware implementation.


![it and how many individuals could be implemented is
determined by area. For MATLAB simulation, with
the parameters mentioned above, the average
computing time is 4s with 7000 time steps. For
FPGA simulation, with the same parameters and
50MHz clock, the computing time is 0.56ms.As we
can see, FPGA version shows a much better
performance even with a relatively slow clock
frequency. On Altera DE2-115 board with 115000
logic elements, the maximum individual number that
can be implemented is about 120.In general, the
hardware solution transfers the complexity in time to
area, which may provide a good way to simulate a
large network in real time.
VI. CONCLUSION
In this project, we designed a FPGA based device to
simulate SIR model, which is about 1000 times faster
than it is in MATLAB. The Verilog code is
automatically generated in MATLAB and the
parameters are set in MATLAB as well. The use of
Verilog code generation provides excellent design
flexibility. A well designed hardware random number
generator is introduced to ensure the simulation is
valid. The hardware simulation is verified for solving
SIR model compared to theoretical method. For
future development, it is predicted that the FPGA
model would give an even better performance when
the model scales to even larger devices or a network
of FPGA devices.
REFERENCE
[1] ATLAS Collaboration, The ATLAS experiment at the
Large Hadron Collider http://iopscience.iop.org/1748-
0221/3/08/S08003
[2] G. Aad et al., ATLAS Pixel Detector Electronics and
Sensors http://iopscience.iop.org/1748-
0221/3/07/P07007
[3] The ATLAS collaboration, ATLAS Insert able B-Layer
Technical Design Report
http://cdsweb.cern.ch/record/1291633/files/ATLAS-
TDR-019.pdf
[4] M. Garcia-Shivers, et al., The FE-I4 pixel readout
integrated circuit
http://www.sciencedirect.com/science/article/pii/S0168
900210009551
[5] D. Falchieri et al., ATLAS IBL: integration of new
HW/SW readout features for the additional layer of
Pixel Detector http://cdsweb.cern.ch/record/
1301775/files/ATL-INDET-PROC-2010-032.pdf
[6] S. K. Goudos, K. B. Baltzis, K. Antoniadis, Z. D.
Zaharis, and C. S. Hilas, "A comparative study of
common and self-adaptive differential evolution
strategies on numerical benchmark problems," Procedia
Computer Science, vol. 3, pp. 83-88, 2013.
[7] M. Srinivas and G. P. Rangaiah, "A study of differential
evolution and tabu search for benchmark, phase
equilibrium and phase stability problems," Computers
& Chemical Engineering, vol. 31, no. 7, pp. 760-772,
2012.
[8] V. C. Mariani, L. G. J. Luvizotto, F. A. Guerra, and L.
S. Coelho, "A hybrid shuffled complex evolution
approach based on differential evolution for
unconstrained optimization," Applied Mathematics and
Computation, vol. 217, no. 12, pp.5822-5829, 2013.
[9] A. K. Qin, V. L. Huang, and P. N. Suganthan,
"Differential evolution algorithm with strategy
adaptation for global numerical optimization," IEEE
Transactions on Evolutionary Computation, vol. 13, no.
2, pp. 398-417, 2013.
[10] R. Mallipeddi, P. N. Suganthan, Q. K. Pan, and M. F.
Tasgetiren, "Differential evolution algorithm with
ensemble of parameters and mutation strategies,"
Applied Soft Computing, vol. 11, no. 2, pp. 1679-1696,
2013.](https://image.slidesharecdn.com/accelerationofstochasticalgorithmonfpgasystem-140315081833-phpapp01/85/Acceleration-of-stochastic-algorithm-on-fpga-system-7-320.jpg)
Acceleration of stochastic algorithm on fpga system
- 1. ACCELERATION OF STOCHASTIC ALGORITHM ON FPGA SYSTEM J.Sheela Arokia Mary Dept of Electrical & Electronics Engineering, Chennai, India sheelarokiamary@gmail.com Abstract - This project is designed to implement a stochastic algorithm on an FPGA system to accelerate a biological simulation. A fast national disease spread prediction algorithm is needed to anticipate the tendency of an infectious disease to spread in a given geography. Using a traditional computing system, the simulation would require large execution time as the model size grows. The project explores methods for implementing such an algorithm on an FPGA system. By utilizing the parallel features of an FPGA, we may find a way to run the whole simulation in real time. In this project, a MATLAB simulation is firstly designed for a hardware compatible algorithm for an SIR model, which is a basic disease spread model. Then, three kinds of FPGAs are used to implement the algorithm. Finally, some verification is applied to validate the result. The project has successfully implemented a hardware compatible algorithm for an SIR model on an FPGA system. Keywords – Stochastic Algorithm, FPGA System, SIR model. I. INTRODUCTION As the performance of the computing systems improves, researchers are trying to predict complicated, real life situations using stochastic algorithms. However, it is becoming more difficult to execute a large network in serial processors because of the large scale of data and nodes to compute. Thus, parallelization tends to be the new solution to solve such stochastic simulations. An FPGA system provides an excellent platform to explore such parallel solutions. Instead of using traditional CPUs as the main processors, An FPGA system executes the simulation using compiled HDL code running on FPGA hardware using register and logic elements. In this way, increasing scale of the simulation leads to a tradeoff between FPGA area and simulation execution time. Evena relatively large network with many nodes can be computed on an FPGA system in real time, as long as the FPGA has enough logic elements. In this project, we explore a way to implement a stochastic simulation; an SIR model on an FPGA system. The Verilog code is automatically generated by MATLAB code, by which parameters of the model are easily modified and a whole new random network is built for every MATLAB run. The simulation on the FPGA system can execute with the initial seeds for every random number generator, which would give out the exact result for every run, or it can be based on the seeds determined by time, which would result in a different output for the same network. The output is displayed on a VGA screen, showing the figure of infected individuals vs. time. II. DESIGN a) SIR Model There are many different algorithms for stochastic models. We choose the SIR model for the simulation because the SIR model (representing Susceptible, Infectious and Recovered) is a basic, direct model that is widely used for modeling large scale disease outbreaks. It is a good model for initial investigation and is compatible with hardware design. In the SIR model, initially, all individuals are susceptible which means they can be infected by other individuals. Then, several individuals are set to be infectious at the beginning of the simulation. Each individual has its own network, providing interconnection with other individuals in the simulation. Then, with these connections, the disease spreads. A susceptible
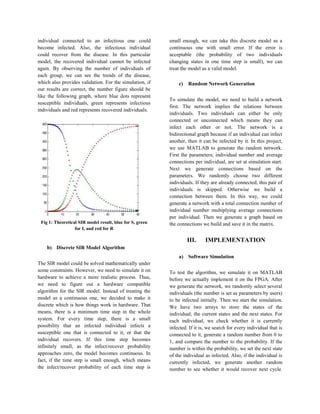
- 2. individual connected to an infectious one could become infected. Also, the infectious individual could recover from the disease. In this particular model, the recovered individual cannot be infected again. By observing the number of individuals of each group, we can see the trends of the disease, which also provides validation. For the simulation, if our results are correct, the number figure should be like the following graph, where blue dots represent susceptible individuals, green represents infectious individuals and red represents recovered individuals. Fig 1: Theoretical SIR model result, blue for S, green for I, and red for R b) Discrete SIR Model Algorithm The SIR model could be solved mathematically under some constraints. However, we need to simulate it on hardware to achieve a more realistic process. Thus, we need to figure out a hardware compatible algorithm for the SIR model. Instead of treating the model as a continuous one, we decided to make it discrete which is how things work in hardware. That means, there is a minimum time step in the whole system. For every time step, there is a small possibility that an infected individual infects a susceptible one that is connected to it, or that the individual recovers. If this time step becomes infinitely small, as the infect/recover probability approaches zero, the model becomes continuous. In fact, if the time step is small enough, which means the infect/recover probability of each time step is small enough, we can take this discrete model as a continuous one with small error. If the error is acceptable (the probability of two individuals changing states in one time step is small), we can treat the model as a valid model. c) Random Network Generation To simulate the model, we need to build a network first. The network implies the relations between individuals. Two individuals can either be only connected or unconnected which means they can infect each other or not. The network is a bidirectional graph because if an individual can infect another, then it can be infected by it. In this project, we use MATLAB to generate the random network. First the parameters; individual number and average connections per individual, are set at simulation start. Next we generate connections based on the parameters. We randomly choose two different individuals. If they are already connected, this pair of individuals is skipped. Otherwise we build a connection between them. In this way, we could generate a network with a total connection number of individual number multiplying average connections per individual. Then we generate a graph based on the connections we build and save it in the matrix. III. IMPLEMENTATION a) Software Simulation To test the algorithm, we simulate it on MATLAB before we actually implement it on the FPGA. After we generate the network, we randomly select several individuals (the number is set as parameters by users) to be infected initially. Then we start the simulation. We have two arrays to store the states of the individual; the current states and the next states. For each individual, we check whether it is currently infected. If it is, we search for every individual that is connected to it, generate a random number from 0 to 1, and compare the number to the probability. If the number is within the probability, we set the next state of the individual as infected. Also, if the individual is currently infected, we generate another random number to see whether it would recover next cycle.
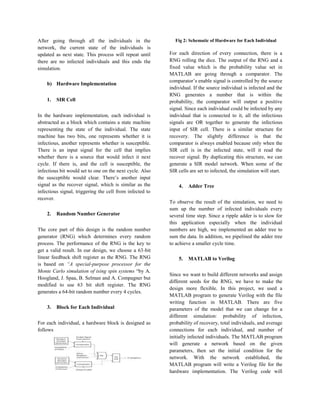
- 3. After going through all the individuals in the network, the current state of the individuals is updated as next state. This process will repeat until there are no infected individuals and this ends the simulation. b) Hardware Implementation 1. SIR Cell In the hardware implementation, each individual is abstracted as a block which contains a state machine representing the state of the individual. The state machine has two bits, one represents whether it is infectious, another represents whether is susceptible. There is an input signal for the cell that implies whether there is a source that would infect it next cycle. If there is, and the cell is susceptible, the infectious bit would set to one on the next cycle. Also the susceptible would clear. There’s another input signal as the recover signal, which is similar as the infectious signal, triggering the cell from infected to recover. 2. Random Number Generator The core part of this design is the random number generator (RNG) which determines every random process. The performance of the RNG is the key to get a valid result. In our design, we choose a 63-bit linear feedback shift register as the RNG. The RNG is based on “A special-purpose processor for the Monte Carlo simulation of ising spin systems “by A. Hoogland, J. Spaa, B. Selman and A. Compagner but modified to use 63 bit shift register. The RNG generates a 64-bit random number every 4 cycles. 3. Block for Each Individual For each individual, a hardware block is designed as follows Fig 2: Schematic of Hardware for Each Individual For each direction of every connection, there is a RNG rolling the dice. The output of the RNG and a fixed value which is the probability value set in MATLAB are going through a comparator. The comparator’s enable signal is controlled by the source individual. If the source individual is infected and the RNG generates a number that is within the probability, the comparator will output a positive signal. Since each individual could be infected by any individual that is connected to it, all the infectious signals are OR together to generate the infectious input of SIR cell. There is a similar structure for recovery. The slightly difference is that the comparator is always enabled because only when the SIR cell is in the infected state, will it read the recover signal. By duplicating this structure, we can generate a SIR model network. When some of the SIR cells are set to infected, the simulation will start. 4. Adder Tree To observe the result of the simulation, we need to sum up the number of infected individuals every several time step. Since a ripple adder is to slow for this application especially when the individual numbers are high, we implemented an adder tree to sum the data. In addition, we pipelined the adder tree to achieve a smaller cycle time. 5. MATLAB to Verilog Since we want to build different networks and assign different seeds for the RNG, we have to make the design more flexible. In this project, we used a MATLAB program to generate Verilog with the file writing function in MATLAB. There are five parameters of the model that we can change for a different simulation: probability of infection, probability of recovery, total individuals, and average connections for each individual, and number of initially infected individuals. The MATLAB program will generate a network based on the given parameters, then set the initial condition for the network. With the network established, the MATLAB program will write a Verilog file for the hardware implementation. The Verilog code will
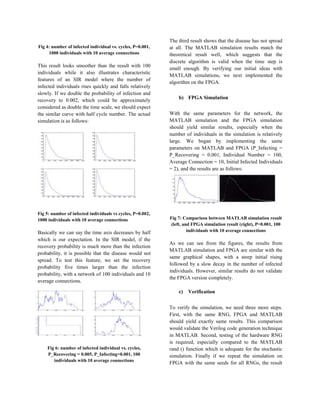
- 4. have hardware connections that describe the network generated in MATLAB. The seeds for random number generators are also randomly generated by MATLAB. MATLAB also builds the adder tree based on the actual number of individual in the simulation. By using MATLAB to generate the Verilog code, the program is much more flexible and easy to modify. Anytime we need a new set of parameters or want a new network or random seed, we only need to change MATLAB parameters and generate a new code. This simplifies the often difficult task of modifying Verilog for each simulation change. c) Output Method To observe the result of the simulation, we need to sum up the infected individuals every several time steps. The interval between additions can be changed by the switches on the FPGA board. To display the results, we used a VGA screen. During the simulation, the sums are saved in SRAM. After saving 640 results (the width of the screen), the simulation stops. The curve of the results will be displayed on VGA screen only the simulation completes. The VGA controller is from Jordan Crittenden. d) Timing Issue There are several timing issues that we need to consider for the design. First, a universal clock is required for the FPGA to work. The FPGA provides a 50MHz internal clock which is a good baseline frequency for testing. However, there are parts in our design that require a slower clock. The VGA control module needs a 25MHz clock, which is provided by an Altera Phase Lock Loop design that is included in the Altera IP library. The adder tree and data storage do not require high speed clocks, but pre scalar to trigger the register is not a good design because that may cause the latency and edge conflict. To avoid these issues, we implemented a counter inside the adder and storage module. By counting a number of values before executing a data add and store, we are triggering the execution on the real clock edge, but also get the slower frequency. If future experiments require higher clock speed, we need to use a PLL to increase the frequency for our main clock. IV. RESULTS AND VERIFICATION a) Simulation Results Before actually implementing the algorithm on hardware, we tried our algorithm on a MATLAB simulation. As we discussed above, we can set five parameters to explore the SIR model. As an initial experiment, we set the P_Infecting = P_Recovering = 0.001 with a network of 100 people and 10 average connections with two individuals initially infected. We simulate using these settings, four times. The following figures show the relation between numbers of infected individuals to simulation cycles. Fig 3: number of infected individuals vs cycles, P=0.001, 100 individuals with 10 average connections As we can see, the output curve looks similar: a sharp rising and a relatively low falling, which matches the theoretical result for the SIR model. However, the curve is not smooth because the individual number is relatively low. If we increase the individual number to 1000, similar results are shown in figure 4:
- 5. Fig 4: number of infected individual vs. cycles, P=0.001, 1000 individuals with 10 average connections This result looks smoother than the result with 100 individuals while it also illustrates characteristic features of an SIR model where the number of infected individuals rises quickly and falls relatively slowly. If we double the probability of infection and recovery to 0.002, which could be approximately considered as double the time scale, we should expect the similar curve with half cycle number. The actual simulation is as follows: Fig 5: number of infected individuals vs cycles, P=0.002, 1000 individuals with 10 average connections Basically we can say the time axis decreases by half which is our expectation. In the SIR model, if the recovery probability is much more than the infection probability, it is possible that the disease would not spread. To test this feature, we set the recovery probability five times larger than the infection probability, with a network of 100 individuals and 10 average connections. Fig 6: number of infected individual vs. cycles, P_Recovering = 0.005, P_Infecting=0.001, 100 individuals with 10 average connections The third result shows that the disease has not spread at all. The MATLAB simulation results match the theoretical result well, which suggests that the discrete algorithm is valid when the time step is small enough. By verifying our initial ideas with MATLAB simulations, we next implemented the algorithm on the FPGA. b) FPGA Simulation With the same parameters for the network, the MATLAB simulation and the FPGA simulation should yield similar results, especially when the number of individuals in the simulation is relatively large. We began by implementing the same parameters on MATLAB and FPGA (P_Infecting = P_Recovering = 0.001, Individual Number = 100, Average Connection = 10, Initial Infected Individuals = 2), and the results are as follows: Fig 7: Comparison between MATLAB simulation result (left, and FPGA simulation result (right), P=0.001, 100 individuals with 10 average connections As we can see from the figures, the results from MATLAB simulation and FPGA are similar with the same graphical shapes, with a steep initial rising followed by a slow decay in the number of infected individuals. However, similar results do not validate the FPGA version completely. c) Verification To verify the simulation, we need three more steps. First, with the same RNG, FPGA and MATLAB should yield exactly same results. This comparison would validate the Verilog code generation technique in MATLAB. Second, testing of the hardware RNG is required, especially compared to the MATLAB rand () function which is adequate for the stochastic simulation. Finally if we repeat the simulation on FPGA with the same seeds for all RNGs, the result
- 6. should not change at all, proving the stability of the hardware simulation. We implemented a 64-bit XOR shift hardware RNG on MATLAB, so we can use the exact same RNG in MATLAB and the FPGA, which establishes the foundation for the first step of verification. To run the same simulation on MATLAB and FPGA, we saved the entire network and the initial seeds for every RNG for hardware implementation and we use the same conditions for software simulation. In this way, every step should be exactly the same so the results should be identical. However, it is difficult to tell difference between two similar graphs. A better way is to reduce the total individual number, making the result special, unique and easy to identify. We used 10 individuals for verification, and the MATLAB/FPGA simulation yielded the identical results as follows: Fig 8: number of infected individuals vs cycles on MATLAB simulation (left) and FPGA simulation (right) with exactly same network and random number generator with same seeds This test shows that the hardware simulation runs exactly as we expected so the implementation and the sampling is correct. Random number generator is the most vital part of a stochastic simulation. It determines the quality of the simulation. An XOR linear feedback shift register is a common solution for RNG in hardware because it is relatively inexpensive (in terms of FPGA resources) and fast. In this case, we need to prove that it is good enough for the simulation. We used two methods to test the RNG: A chi-square test and a serial-correlation test. Since we used rand () function in MATLAB for generating the seeds for hardware RNG and software simulation, we basically assume that the rand () function is good enough for the whole simulation. Therefore, we just need to compare the hardware RNG and the rand () function. Once the RNG is as good as the rand () function, it is good enough for hardware simulation. For chi-square test, we repeated the test 50 times which generated 5000 random numbers. If the confidence is more than 90%, our test passed. Less than 90% would indicate a failed test. If in one test, one of the RNG shows a better result, we add a good to it. For s-c test, we used lag=1 and lag=5, and the confidence is also 90%. The results are as follows: Table 1 verification test comparison for hard random number generator and rand () function in MATLAB From the chart, we can observe that hardware RNG shows an even better performance than rand () function in MATLAB. Consequently, the RNG is sufficient for our simulation. The last thing we need to check is the stability. Since the results should remain the same if the seeds for RNGs are the same, we can repeat the simulation and check for stability. In this case, we sampled the number of infected individual in the first 2000 steps as a flag value and observe this value between simulations. The results showed that the flag values stayed the same for every simulation, which proved the stability of the simulation. V. EVALUATION The most important factors of the implementation is speed and area. The major purpose to transplant the simulation from software to hardware is to accelerate
- 7. it and how many individuals could be implemented is determined by area. For MATLAB simulation, with the parameters mentioned above, the average computing time is 4s with 7000 time steps. For FPGA simulation, with the same parameters and 50MHz clock, the computing time is 0.56ms.As we can see, FPGA version shows a much better performance even with a relatively slow clock frequency. On Altera DE2-115 board with 115000 logic elements, the maximum individual number that can be implemented is about 120.In general, the hardware solution transfers the complexity in time to area, which may provide a good way to simulate a large network in real time. VI. CONCLUSION In this project, we designed a FPGA based device to simulate SIR model, which is about 1000 times faster than it is in MATLAB. The Verilog code is automatically generated in MATLAB and the parameters are set in MATLAB as well. The use of Verilog code generation provides excellent design flexibility. A well designed hardware random number generator is introduced to ensure the simulation is valid. The hardware simulation is verified for solving SIR model compared to theoretical method. For future development, it is predicted that the FPGA model would give an even better performance when the model scales to even larger devices or a network of FPGA devices. REFERENCE [1] ATLAS Collaboration, The ATLAS experiment at the Large Hadron Collider http://iopscience.iop.org/1748- 0221/3/08/S08003 [2] G. Aad et al., ATLAS Pixel Detector Electronics and Sensors http://iopscience.iop.org/1748- 0221/3/07/P07007 [3] The ATLAS collaboration, ATLAS Insert able B-Layer Technical Design Report http://cdsweb.cern.ch/record/1291633/files/ATLAS- TDR-019.pdf [4] M. Garcia-Shivers, et al., The FE-I4 pixel readout integrated circuit http://www.sciencedirect.com/science/article/pii/S0168 900210009551 [5] D. Falchieri et al., ATLAS IBL: integration of new HW/SW readout features for the additional layer of Pixel Detector http://cdsweb.cern.ch/record/ 1301775/files/ATL-INDET-PROC-2010-032.pdf [6] S. K. Goudos, K. B. Baltzis, K. Antoniadis, Z. D. Zaharis, and C. S. Hilas, "A comparative study of common and self-adaptive differential evolution strategies on numerical benchmark problems," Procedia Computer Science, vol. 3, pp. 83-88, 2013. [7] M. Srinivas and G. P. Rangaiah, "A study of differential evolution and tabu search for benchmark, phase equilibrium and phase stability problems," Computers & Chemical Engineering, vol. 31, no. 7, pp. 760-772, 2012. [8] V. C. Mariani, L. G. J. Luvizotto, F. A. Guerra, and L. S. Coelho, "A hybrid shuffled complex evolution approach based on differential evolution for unconstrained optimization," Applied Mathematics and Computation, vol. 217, no. 12, pp.5822-5829, 2013. [9] A. K. Qin, V. L. Huang, and P. N. Suganthan, "Differential evolution algorithm with strategy adaptation for global numerical optimization," IEEE Transactions on Evolutionary Computation, vol. 13, no. 2, pp. 398-417, 2013. [10] R. Mallipeddi, P. N. Suganthan, Q. K. Pan, and M. F. Tasgetiren, "Differential evolution algorithm with ensemble of parameters and mutation strategies," Applied Soft Computing, vol. 11, no. 2, pp. 1679-1696, 2013.