SlideShare a Scribd company logo
Analysis of Fixed and
Floating Interest Rates
For Bonds of Power Grid Corporation of India Limited


                            Under the Guidance of

      Mr. Nalin Jain                                     Mr. K.C. Pant
   Professor, Marketing                              CM- Finance (Bonds)
FORE School of Management                   Power Grid Corporation of India Limited


                            Mr. Vinay Dutta
                       Area Chair Person, Finance
                      FORE School of Management


                                                       Madhusudan Partani
                                                             91029
                                                         PGDM- 2009-11
                                                    FORE School of Management
                                                            New Delhi
Analysis of Fixed and Floating Interest Rates 2010

Table of Contents
Acknowledgement .................................................................................................................................. 5
Chapter I Introduction
Introduction .......................................................................................................................................... 11
Objectives ............................................................................................................................................. 12
Purpose of Study ................................................................................................................................... 13
Scope ..................................................................................................................................................... 14
Data ....................................................................................................................................................... 15
Review of Literature.............................................................................................................................. 16
Introduction .......................................................................................................................................... 19
   Developments in Government Bond Market.................................................................................... 19
   Corporate Bond Market .................................................................................................................... 20
   Development of Equity Market vs. the Debt Market ....................................................................... 22
Chapter II Financial Statetement Analysis
Balance Sheet Analysis .......................................................................................................................... 26
   Capital Composition .......................................................................................................................... 26
   Sources and Application of Funds ..................................................................................................... 28
       Share Capital ................................................................................................................................. 30
       Share Holding Pattern ................................................................................................................... 30
       Brief note on Initial Public Offering .............................................................................................. 32
       Reserves ........................................................................................................................................ 33
       Secured Loans ............................................................................................................................... 33
       Unsecured Loans ........................................................................................................................... 35
       Current Liability ............................................................................................................................. 36
       Fixed Assets ................................................................................................................................... 37
       Investments................................................................................................................................... 38
       Current Assets ............................................................................................................................... 39
Profit and Loss Analysis......................................................................................................................... 40
       Sales/ Operating Income............................................................................................................... 41
       Profits ............................................................................................................................................ 42
       Dividends....................................................................................................................................... 42
Cash Flow Analysis ................................................................................................................................ 44
Ratio Analysis ........................................................................................................................................ 47
   Liquidity Ratio ................................................................................................................................... 47

          1
Analysis of Fixed and Floating Interest Rates 2010
       Current Ratio ................................................................................................................................. 47
       Quick Ratio .................................................................................................................................... 48
   Profitability Ratio .............................................................................................................................. 49
       Operating Profit Margin (PBIDTM) ............................................................................................... 49
       Net Profit Margin .......................................................................................................................... 50
       Cash Profit Margin ........................................................................................................................ 50
       Return on Capital Employed ......................................................................................................... 51
       Return on Net Worth .................................................................................................................... 51
       EPS................................................................................................................................................. 52
   Solvency Ratios ................................................................................................................................. 53
       Debt- Equity Ratio ......................................................................................................................... 53
       Intrest Coverage Ratio .................................................................................................................. 54
   Activity Ratios ................................................................................................................................... 54
       Receivables Turnover Ratio .......................................................................................................... 55
       Inventory Turnover Ratio .............................................................................................................. 55
       Fixed Asset Turnover Ratio ........................................................................................................... 55
   Capital Market Behaviour ................................................................................................................. 56
       P/E Multiple .................................................................................................................................. 56
       Beta ............................................................................................................................................... 57
Chapter III Procedures in Bond Raising
Steps in Issuing Bonds ........................................................................................................................... 60
Dematerialization Process .................................................................................................................... 68
Listing Process ....................................................................................................................................... 70
Debt Servicing ....................................................................................................................................... 72
Chapter IV Characterstics of Bonds
Yield or IRR ............................................................................................................................................ 78
       Current Yield ................................................................................................................................. 78
       Yield to Maturity ........................................................................................................................... 78
       Annualised Yield ............................................................................................................................ 78
       Yield to Call / Put ........................................................................................................................... 79
   Price- Yield Relationship ................................................................................................................... 79
Duration ................................................................................................................................................ 80
       Macaulay’s Duration ..................................................................................................................... 80
       Modified Duration......................................................................................................................... 80

          2
Analysis of Fixed and Floating Interest Rates 2010
Convexity............................................................................................................................................... 81
Yield of PSU and GSec Bonds ................................................................................................................ 82
Duration of PSU and GSec Bonds .......................................................................................................... 90
Convexity of PSU and GSec Bonds ........................................................................................................ 95
Chapter V Analysis of Fixed and Floating Interest Rates
Introduction ........................................................................................................................................ 100
   Fixed Intrest Rate ............................................................................................................................ 100
   Floating Intrest Rate........................................................................................................................ 102
   Indian Issuers going for FRBs .......................................................................................................... 104
       GOI Floating Rate Bonds ............................................................................................................. 104
       Indian Railway Finance Corporation Limited (IRFCL) .................................................................. 105
       Power Finance Corporation Limited, .......................................................................................... 105
       ICICI Bank .................................................................................................................................... 106
       Others ......................................................................................................................................... 106
The Debt Servicing for PGCIL’s Bonds ................................................................................................. 107
Floating Intrest for PGCIL’s Bonds....................................................................................................... 109
   Assumptions.................................................................................................................................... 109
   Selection of Bonds .......................................................................................................................... 109
   Selection of Reference Rate ............................................................................................................ 110
   Reset Period and Reference Period ................................................................................................ 113
   Spread ............................................................................................................................................. 113
   Floating Rate under Reference Rate of Average yield of 1 Year GSec ............................................ 114
       Bond VIII ...................................................................................................................................... 114
       Bond IX ........................................................................................................................................ 116
       Bond X ......................................................................................................................................... 118
       Bond XIII- Opt II ........................................................................................................................... 120
       Bond XIV ...................................................................................................................................... 122
   Floating Rate under Reference Rate of Average yield of 10 year GSec .......................................... 124
       Bond VIII ...................................................................................................................................... 124
       Bond IX ........................................................................................................................................ 125
       Bond X ......................................................................................................................................... 127
       Bond XIII- Opt-II........................................................................................................................... 129
       Bond XIV ...................................................................................................................................... 130
   Floating Rate under Reference Rate of Average yield of 10 year GSec .......................................... 132

         3
Analysis of Fixed and Floating Interest Rates 2010
   Floating Rate under Reference Rate of Average yield of 10 year GSec- Average Spread of last 12
   months ............................................................................................................................................ 135
   Summary of Each Base Rate ........................................................................................................... 135
   Factors Effecting The Selection Of Each Method............................................................................ 137
       Term ............................................................................................................................................ 137
       Coupon Rate................................................................................................................................ 137
       Market Condition ........................................................................................................................ 138
       Quantum of Loan ........................................................................................................................ 139
       Repayment Structure .................................................................................................................. 139
       Time of Issue ............................................................................................................................... 140
Chapter VI Findings and Recommendations
Critical Analysis of Alternatives........................................................................................................... 142
   Fixed Coupon Interest Rate ............................................................................................................ 142
   Floating Rate ................................................................................................................................... 142
   Fixed Coupon Rate with Option ...................................................................................................... 144
Recommendation................................................................................................................................ 145
References .......................................................................................................................................... 146


         4
Analysis of Fixed and Floating Interest Rates 2010

Table of Figures and Charts

FIGURE 1 TREND OF AVERAGE TRADE SIZE - WDM ......................................................................................................... 23
FIGURE 2 CAPITAL COMPOSITION FROM 1996 TO 2009 ................................................................................................... 27
FIGURE 3 SOURCES OF FUNDS- 2008-09 ....................................................................................................................... 28
FIGURE 4 APPLICATIONS OF FUNDS- 2008-09 ................................................................................................................ 29
FIGURE 5 TREND IN SHARE CAPITAL .............................................................................................................................. 30
FIGURE 6 SHARE HOLDING PATTERN AS ON 31ST DEC 2009 ............................................................................................. 31
FIGURE 7 SHARE HOLDING PATTERN ............................................................................................................................. 31
FIGURE 8TREND IN RESERVES AND SURPLUS ................................................................................................................... 33
FIGURE 9 TREND IN NON CONVERTIBLE DEBENTURES ....................................................................................................... 33
FIGURE 10 TREND IN TERM LOANS INSTITUTIONS ............................................................................................................ 34
FIGURE 11 TREND IN TERM LOANS BANKS ..................................................................................................................... 34
FIGURE 12 TREND IN DEFERRED CREDIT ......................................................................................................................... 34
FIGURE 13 TREND IN UNSECURED LOANS....................................................................................................................... 35
FIGURE 14 DEBT COMPOSITION FROM 2003 TO 2009..................................................................................................... 36
FIGURE 15 TREND IN CURRENT LIABILITY........................................................................................................................ 36
FIGURE 16 TREND IN FIXED ASSETS ............................................................................................................................... 37
FIGURE 17 TREND IN INVESTMENTS .............................................................................................................................. 38
FIGURE 18 COMPARISON OF FIXED ASSETS AND INVESTMENTS ........................................................................................... 38
FIGURE 19 TREND IN COMPOSITION OF CURRENT ASSETS ................................................................................................. 39
FIGURE 20 MULTI STEP ANALYSIS OF INCOME................................................................................................................. 40
FIGURE 21 TREND IN INCOMES .................................................................................................................................... 41
FIGURE 22 TREND IN DIFFERENT PROFITS ....................................................................................................................... 42
FIGURE 23 DIVIDEND TREND ....................................................................................................................................... 42
FIGURE 24 PROFIT APPROPRIATIONS OVER THE YEARS ...................................................................................................... 43
FIGURE 25 LIQUIDITY RATIOS....................................................................................................................................... 48
FIGURE 26 OPERATING PROFIT MARGINS ...................................................................................................................... 50
FIGURE 27 NET PROFIT MARGINS................................................................................................................................. 51
FIGURE 28 EPS TREND ............................................................................................................................................... 52
FIGURE 29 DEBT EQUITY RATIO ................................................................................................................................... 53
FIGURE 30 INTEREST COVER RATIO ............................................................................................................................... 54
FIGURE 31 P/E RATIO ................................................................................................................................................ 57
FIGURE 32 RESIDUAL PLOT FOR BETA ............................................................................................................................ 58
FIGURE 33 YIELD CURVE OF PGXXX ............................................................................................................................. 88
FIGURE 34 YIELD CURVE OF GSEC 8.20% ...................................................................................................................... 88
FIGURE 35 YIELD CURVE OF PFC (S-57) ........................................................................................................................ 89
FIGURE 36 MODIFIED VS MACAULAY'S DURATION .......................................................................................................... 93
FIGURE 37 DURATION VS MATURITY ............................................................................................................................ 93
FIGURE 38 DURATION VS YIELD ................................................................................................................................... 94
FIGURE 39 DURATION VS CONVEXITY ............................................................................................................................ 97
FIGURE 40 COUPON RATE VS CONVEXITY (SAME MATURITY) ............................................................................................ 98
FIGURE 41 COUPON RATE VS CONVEXITY (SAME DURATION) ............................................................................................ 98
FIGURE 42 COUPON RATE OF PG VS GSEC RATE........................................................................................................... 108
FIGURE 43 COUPON RATE OF PG VS AVG GSEC YIELD ................................................................................................... 108
FIGURE 44 TREND OF 10 YR GSEC YIELD ..................................................................................................................... 111
FIGURE 45 TREND OF 1YR GSEC YIELD ........................................................................................................................ 111
FIGURE 46 TREND OF COUPON RATES OF PG BONDS ..................................................................................................... 112

          5
Analysis of Fixed and Floating Interest Rates 2010
FIGURE 47 RATES OF PG BONDS VS 1 YR GSEC YIELD .................................................................................................... 112
FIGURE 48 INTREST PAYMENTS UNDER FIXED AND FLOATING RATE FOR PGVIII FOR 1 YEAR GSEC AS REFERENCE RATE .............. 116
FIGURE 49 INTEREST PAYMENT UNDER FIXED AND FLOATING RATES FOR PGIX FOR 1 YEAR GSEC AS REFERENCE RATE ............... 118
FIGURE 50 INTEREST PAYMENT UNDER FIXED AND FLOATING RATES FOR PGX FOR 1 YEAR GSEC AS REFERENCE RATE ................ 120
FIGURE 51 INTEREST PAYMENTS UNDER FIXED AND FLOATING RATES FOR PGXIII FOR 1 YEAR GSEC AS REFERENCE RATE............ 121
FIGURE 52 INTEREST PAYMENTS UNDER FIXED AND FLOATING RATE FOR PGXIV FOR 1 YEAR GSEC AS REFERENCE RATE ............. 123
FIGURE 53 INTEREST PAYMENTS UNDER FIXED AND FLOATING RATE FOR PGIX FOR 10 YEAR GSEC AS REFERENCE RATE ............. 127
FIGURE 54 INTREST PAYMENTS UNDER FIXED AND FLOATING RATES FOR ALL BONDS FOR 10 YEAR GSEC AS BASE RATE ............. 134
FIGURE 55 COMPARISON OF FIXED AND FLOATING IN CASE OF ADVERSE MARKET CONDITIONS............................................... 139


         6
Analysis of Fixed and Floating Interest Rates 2010

Table of Tables

TABLE 1 CAPITAL COMPOSITION FROM 1996 TO 2009 .................................................................................................... 27
TABLE 2 SHARE HOLDING PATTERN FROM 2007 TO 2009 ................................................................................................ 31
TABLE 3 TOP 10 SHARE HOLDERS AS ON 29.01.2009 ..................................................................................................... 32
TABLE 4 CASH FLOW STATEMENT ................................................................................................................................. 45
TABLE 5 LIQUIDITY RATIOS .......................................................................................................................................... 48
TABLE 6 OPERATING PROFIT MARGINS .......................................................................................................................... 49
TABLE 7 NET PROFIT MARGINS .................................................................................................................................... 51
TABLE 8 RETURNS...................................................................................................................................................... 52
TABLE 9 TURNOVER RATIOS......................................................................................................................................... 56
TABLE 10 REGRESSION OUTPUT ................................................................................................................................... 57
TABLE 11 LIST OF BONDS SELECTED FOR STUDY ............................................................................................................... 83
TABLE 12 YIELD TO MATURITY OF PG XXXI.................................................................................................................... 85
TABLE 13 COMPUTATION OF YIELD OF GSEC BOND.......................................................................................................... 85
TABLE 14 YTM AND CURRENT YIELD OF ALL BONDS ........................................................................................................ 86
TABLE 15 MODIFIED AND MACAULAY'S DURATION OF PGXXXI ......................................................................................... 91
TABLE 16 MODIFIED AND MACAULAY'S DURATION OF GSEC ............................................................................................. 91
TABLE 17 MACAULAY'S AND MODIFIED DURATION OF ALL BONDS ..................................................................................... 92
TABLE 18 CONVEXITY OF PGXXXI ................................................................................................................................ 96
TABLE 19 CONVEXITY OF ALL BONDS............................................................................................................................. 97
TABLE 20 FRBS BY GOI ............................................................................................................................................ 105
TABLE 21 FRBS BY IRFC ........................................................................................................................................... 105
TABLE 22 FRBS BY PFC ............................................................................................................................................ 106
TABLE 23 FRBS BY ICICI BANK .................................................................................................................................. 106
TABLE 24 FRBS BY OTHERS ....................................................................................................................................... 106
TABLE 25 LIST OF BONDS SELECTED FOR ANALYSIS ......................................................................................................... 109
TABLE 26 DETERMINATION OF SPREAD FOR PGVIII FOR 1 YEAR GSEC AS REFERENCE RATE ................................................... 114
TABLE 27 FLOATING RATES FOR PGVIII FOR 1 YEAR GSEC AS REFERENCE RATE ................................................................... 115
TABLE 28 INTREST UNDER FIXED AND FLOATING RATES FOR PGVIII FOR 1 YEAR GSEC AS REFERENCE RATE .............................. 115
TABLE 29 CALCULATION OF SPREAD FOR PGIX FOR 1 YEAR GSEC AS REFERENCE RATE ......................................................... 116
TABLE 30 FLOATING RATES FOR PGIX FOR 1 YEAR GSEC AS REFERENCE RATE ..................................................................... 117
TABLE 31 INTEREST UNDER FIXED AND FLOATING RATES FOR PGIX FOR 1 YEAR GSEC AS REFERENCE RATE............................... 117
TABLE 32 CALCULATION OF SPREAD FOR PGX FOR 1 YEAR GSEC AS REFERENCE RATE .......................................................... 119
TABLE 33 FLOATING RATES FOR PGX FOR 1 YEAR GSEC AS REFERENCE RATE ...................................................................... 119
TABLE 34 INTEREST UNDER FIXED AND FLOATING RATE FOR PGX FOR 1 YEAR GSEC AS REFERENCE RATE .................................. 119
TABLE 35 CALCULATION OF SPREAD FOR PGXIII FOR 1 YEAR GSEC AS REFERENCE RATE ....................................................... 121
TABLE 36 FLOATING RATES FOR PGXIII FOR 1 YEAR GSEC AS REFERENCE RATE ................................................................... 121
TABLE 37 INTEREST UNDER FIXED AND FLOATING RATES FOR PGXIII FOR 1 YEAR GSEC AS REFERENCE RATE ............................ 121
TABLE 38 CALCULATION OF SPREAD FOR PGXIV FOR 1 YEAR GSEC AS REFERENCE RATE ....................................................... 122
TABLE 39 FLOATING RATES FOR PGXIV FOR 1 YEAR GSEC AS REFERENCE RATE................................................................... 122
TABLE 40 INTERESTS UNDER FIXED AND FLOATING RATES FOR PGXIV FOR 1 YEAR GSEC AS REFERENCE RATE ........................... 123
TABLE 41 FLOATING RATES FOR PGVIII FOR 10 YEAR GSEC ............................................................................................ 125
TABLE 42 INTERESTS UNDER FIXED AND FLOATING FOR PGVIII FOR 10 YEAR GSEC.............................................................. 125
TABLE 43 CALCULATION OF SPREAD FOR PGX FOR 10 YEAR GSEC AS REFERENCE RATE ........................................................ 126
TABLE 44 FLOATING RATES FOR PGIX FOR 10 YEAR GSEC AS REFERENCE RATE ................................................................... 126
TABLE 45 INTERESTS UNDER FIXED AND FLOATING FOR PGIX FOR 10 YEAR GSEC ................................................................ 127
TABLE 46 TOTAL INTREST UNDER FIXED AND FLOATING RATES FOR ALL BONDS UNDER 10 YEAR GSEC AS BASE RATE ................ 132

          7
Analysis of Fixed and Floating Interest Rates 2010
TABLE 47 SUMMARY OF COSTS UNDER 1 YEAR GSEC AS BASE RATE.................................................................................. 135
TABLE 48 SUMMARY OF COSTS UNDER 10 YEAR GSEC AS BASE RATE ( COUPON PERIOD) ..................................................... 135
TABLE 49 SUMMARY OF COSTS UNDER 10 YEAR GSEC AS BASE RATE ( INTEREST PAYMENT PERIOD)....................................... 136


         8
Analysis of Fixed and Floating Interest Rates 2010

                                    Acknowledgement

The satisfaction and joy that accompanies the successful completion of a task is incomplete without
mentioning the names of those who extended their help and support in making it a success.

The Project Titled “Analysis of Fixed and Floating Rates of Bonds of Power Grid Corporation of India
Limited “has not been a success without the priceless support and assistance of Mr. K.C. Pant (Chief
Manager Finance-Bonds, Power Grid Corporation of India Limited), Mr. Sandesh Nagrare (Chief
Accountant- Bonds, Power Grid Corporation of India Limited) and Mr. S.V. Venkat (Chief Manager,
Finance-Bonds, Power Grid Corporation of India Limited).

I am greatly indebted to Prof. Vinay Dutta (Chairperson, Finance, FORE School of Management),
Prof. Kanhaiya Singh (Sr. Faculty, Finance, FORE School of Management) and Prof. Himanshu Joshi
(Faculty, Finance, FORE School of Management) for their invaluable guidance and direction provided
to me in the course of the study.

A special word of thanks to Prof. Nalin Jain (Faculty, Marketing, FORE School of Management), who
has been a constant support and guided me in the report.

I also wish to express my gratitude and gratefulness towards Mr. Ranjan Srivastav (AGM- Finance,
Power Grid Corporation of India Limited), Mr. V.C. Jagannathan (Executive Director-Finance, Power
Grid Corporation of India Limited) and also Mr. Venkat Krishna (Vice President, ICICI Securities
Primary Dealership Ltd)


Date: 12 May 2010

Place: New Delhi

                                                                               Madhusudan Partani


      9
Analysis of Fixed and Floating Interest Rates 2010


     Chapter I
     INTRODUCTION

                Introduction
                Purpose of Study
                Objectives
                Scope
                Data
                Review of Literature
                Introduction to Bond Market


10
Analysis of Fixed and Floating Interest Rates 2010

Introduction

The project done with the Power Grid Corporation of India Limited in their Finance department,
Bonds Section, is a study on Cost and Benefit analysis of Fixed and Floating rate bonds. Intrest
payment under both the methods is computed for bonds with different characteristics (Maturity,
Coupon rate and Amount). Recommendation has been made on suitability of each method under
different conditions.

Also the Valuation and Convexity measures like Duration, Yield, Convexity have also been computed
for all the Bonds issued by Power Grid Corporation of India Limited and also few GSec Bonds and
other corporation bonds.

Also The Securities Exchange Board of India (SEBI), the regulator of Capital Markets, has made wide
array of policies and guidelines with respect to issue of bonds. Thus it is per se necessary to study
the procedural aspects of issuing bonds, the legal aspects and also the provisions and guidelines. The
scope of the study is extended to Debt-Servicing Process, listing process and dematerialisation
process. And Analysis of Financial statements using different tools like Horizontal analysis of Income
and Position Statement, Cash Flow Analysis, Ratio Analysis has been done.

Apart from the above mentioned aspects, the behaviour of GSec Yields, Comparison of interest rates
on bonds issued by Power Grid Corporation of India Limited with the Government Yield has also
been done.


    11
Analysis of Fixed and Floating Interest Rates 2010

Objectives
The Objectives of study are as follows:

     Comparison of Cost of each bond in case of present system of fixed coupon rate with
      Floating Coupon rate. And to study the suitability of each method for different kinds of
      bonds having different maturity, different coupon rate and different loan quantum.
     To study the Characteristics in terms of Macaulay’s Duration, Convexity, and YTM; of each
      bond issued by PGCIL and also to compare the same with other GSec Bonds and other
      corporate bonds.
     To study and understand the procedural aspects of issuing the bonds, their listing, debt
      servicing and dematerialisation.
     Financial Performance Analysis of Power Grid Corporation of India Limited using different
      techniques like Ratio Analysis, Cash Flow Analysis, Balance sheet and Profit and Loss
      Analysis.

The secondary Objectives will be:

     To study the behaviour of yields on 10 Year and 1 Year GSec papers
     To Understand the Power sector and the value chain of the industry.


    12
Analysis of Fixed and Floating Interest Rates 2010

Purpose of Study

 Bonds have become one of the important sources for long term funds in the present scenario. The
central government, the state government, PSUs, Banks, and also Corporate issue bonds regularly to
raise long term funds. Along with the Primary Issues, the trading in Exchanges has also improved
rapidly. The average trade size has increase from Rs.6.64 Crores in 1994-95 to Rs.23.42 Crs in the
year 2009-10. Thus it is per se necessary to study the Bond market and also understand the growing
importance of Bonds as the source of long term finance.

It is by itself very indispensable to study the financial condition of the company, its financial strength
in terms of profitability, solvency, liquidity etc... To understand the company. Thus Financial
Statement Analysis has been done and study of Balance Sheet, profit and loss, Sources and
applications of funds, Cash flow analysis and also ratio analysis has been done.

As mentioned before, the Bonds have become one of the favoured preferences for the long term
funds. And Power Grid Corporation of India Limited issues Bonds periodically, thus to study the
Bonds and understand the mechanism, it was a necessity to understand the procedural aspects and
legal aspects of issuing the bonds. Thus a detailed study of each and every aspect of issue of bond
ranging from Approval, Listing, Dematerialisation, to Debt Servicing has been studied.

The bond market is not only flooded from supply side, but also there is a rapid growth on demand
side by many fresh players entering the market. The investors in Bonds include Banks, Insurance
companies, Mutual Funds, Provident Funds, Pension Funds and other such funds o different
companies. Thus it is necessary to study the characteristics of the bond and compute their Yields,
Duration, and Sensitivity by means of Convexity. And since there are different kinds of bonds issued
by different bodies, the comparison amongst them is also necessary.

The Power Grid Corporation of India Limited’s Debt structure has changed substantially over the
years. From 35% Unsecured Loans and 13% Secured loans in the total Capital Mix in the year 1996-
97, the composition has changed to 7% Unsecured and 58% Secured loans in the year 2009-10. And
of these 58%, approx 38% is comprised of Secured Bonds. As on 31st march 2010, the company has
Bonds outstanding worth Rs.21420.4 Crs and on these a total Intrest of Rs 1500 Crs is paid annually.
And the interest rate paid is fixed. In simple words the interest rate determined at the time of issue
is kept fixed throughout the tenure of the bond irrespective of the market condition. Alternatively
the company could even go for floating rate Bonds whose interest rate is floating i.e... Varies with
the market conditions. Thus a study has been done to compute the savings in cost under floating
rate mechanism. But since the regulations do not allow the company to take risk of fluctuations in
interest rates, and also in this competitive scenario, cost saving has became one of the most
important tool. Thus instead of floating rate, if the company issues the bonds at an appropriate and
at favourable time period, which lead to low coupon rate and ultimately cost savings has been also
studied.


    13
Analysis of Fixed and Floating Interest Rates 2010

Scope

For the purpose of comparing the cost under fixed and floating Rate five bonds issued by Power Grid
Corporation of India Limited with different tenures, different repayment structure, different coupon
rates and different loan amounts were taken. And the Intrest on them under both the methods has
been computed from the date of issue to the latest Intrest payment has been computed taking
different spreads and different reference rates as per the Industry practices.

And for studying the duration, Yields and Sensitivity of the Bonds, all the Bonds issued by Power Grid
Corporation of India Limited and which are active are selected. Along with these Two GSec bonds
and bond series (S-57) issued by Power Finance Corporation has been selected.

For studying the procedural aspects, the steps of the issue, Dematerialisation, Rating, Listing etc
have been studied by referring to the process of issue of Power Grid Bonds XXX issued on 29 th
September 2009.

And for the financial performance analysis, specific study has been done based on the financial
figures of the financial year 2008-09. The scope was not extended to the latest FY 2009-10 because
the audited results were not yet published till the preparation of this report. And for studying the
trend and growth, the figures of last 8 years starting from 2003 has been selected.


    14
Analysis of Fixed and Floating Interest Rates 2010

Data

For the purpose of study the data has been collected from the Company’s Balance Sheets, The
details of Loans and Intrest payments schedules as provided from the internal records of the
company and also different correspondence letters, approval letters, legal documents as provided by
the company were used.

For historical yields on GSec Papers the data has been collected from Reuters Database1. And for
determining the spread for the purpose of deciding the floating rate, the data on spreads as
published by FIMMDA2 has been used. And also data published by RBI related to GSec and also the
Data from Indiastat has been used. For computing the Duration, Yields and Convexity, the present
value has been taken from the NSE websites WDM (Wholesale Debt Segment).


1
    A premium Database which provides the data on Global Macro Economic Indicators
2
    Fixed Income Money Market and Derivatives Association of India

       15
Analysis of Fixed and Floating Interest Rates 2010

Review of Literature

For the purpose of understanding the concepts and having the thorough knowledge of Bonds and
also to have background knowledge of topics like Floating rate, to understand the valuation concepts
of bonds, the procedural aspects, different articles, papers, reports and other literature has been
studied. Some of the literature is:

          WHAT PRACTITIONERS NEED TO KNOW .....? ABOUT DURATION AND CONVEXITY


Mark               Kritzman,              Windham                   Capital               Management
Financial Analysts Journal (Nov-Dec 1992)

The paper is on Duration and Convexity of Bonds. It has the concept of Macaulay’s Duration and the
author has explained why the time weighted PVs of future cash flows are to be considered instead of
just PVs. The author has also extended the scope of paper by discussing the property of Duration
that with constant YTM and Coupon Payments, the increase in Maturity will increase duration but
the rate of increase is lower.

Modified Duration, which measures sensitivity of price of bond to the changes in yield, does not
accurately predict the sensitivity for the larger changes in YTM. Thus he proposes to use Convexity as
measure of sensitivity. Convexity measures sensitivity of price of bond to the change in Duration.

Apart from the concept of Convexity and Duration, the author has also explained the application of
these measures in Portfolio management. How they can be used to leverage the price appreciation
in case of fall in rates by increasing the duration of the portfolio. Also how it can be used in hedging
the liabilities. The author has also shared how the portfolio can be immunized from interest rate
shifts by setting its duration equal to the investors’ holding g period.

In a nutshell, the paper introduces one to Duration and other valuation techniques and also it shows
the applicability of each. From this literature I am able to understand the concepts of Macaulay’s
Duration, Modified Duration, and Convexity and also their computation and inferences.

          A “DURATION” FALLACY


                                                                       Miles Livingston and John Caks
                                                  The Journal of Finance (Vol XXXII No.1 March 1977)

As the title of the paper itself portrays that content is related to a fallacy in general opinion on
Duration. The authors wish to prove that duration is a function of the yield curve but the yield curve
is not the function of duration. Thus one cannot ‘correct the yield curve for the duration’ because
bonds with identical duration do not necessarily have identical yields. They have proved this by
comparing and analysing the two bonds of similar duration.

Also they have concluded that that if bonds with identical durations always have identical yields to
maturity, then the entire term structure of interest rates is determined by the first two rates; given


    16
Analysis of Fixed and Floating Interest Rates 2010
r1 and r2, we can calculate r3 and then (recursively) all subsequent forward rates. This result
contradicts experience and the theoretical work done on term structure.

             ‘POWER SECTOR IN INDIA’


                                     WHITE PAPER ON IMPLEMENTATION CHALLENGES AND OPPORTUNITIES
                                                                               KPMG (Jan 2010)

It is an annual report on Power Sector published by KPMG. This paper throws light on Industry
overview, the value chain, and the different players in each business operation namely generation,
transmition and distribution. The paper also discusses the regulations in this sector which are paving
the way for private sector participation.

Also the challenges in this sector which needs to be tackled are also discussed. Some of the
prominent challenges are the Project Execution, The scarcity of fuel, Equipment shortage,
Manpower Shortage, problems in land acquisition and Environment clearance.

This paper helps in understanding the power sector in general, and its structure. And also the
challenges in that sector can be understood.

             SEBI (DISCLOSURES AND INVESTORS PROTECTION) GUIDELINES, 2000


Securities Exchange Board of India, the sole regulator of Capital market in India, issues various
guidelines to regulate the capital market of the nation. The DIP Guidelines were issued for the
purpose of protecting investors from fraudulent practices by issuers and also to ensure maximum
disclosure.

It has guidelines with respect to Offer letter, its contents, the promoters share, lock-in period,
requirements for issuing IPOs, Guidelines on Advertising of issue, guidelines on Pricing of issue etc...

The copy of the above mentioned guidelines has many regulations which are not under purview of
my study. Thus only few aspects were studied. The review of them is as follows:

The objectives of these guidelines are:

   i.    Enhance level of protection of investors
  ii.    To increase transparency and efficiency of primary market
 iii.    To strengthen disclosure and eligibility norms of the issuer
 iv.     Rationalize and simplify operational procedures in primary market.

The guidelines on Book building process, Green Shoe Option, Disclosure requirement in the offer
document and guidelines pertaining to issue of Debentures were studied to have foreground
knowledge of various guidelines.


        17
Analysis of Fixed and Floating Interest Rates 2010
           INFORMATION MEMORANDUMS


Then Information Memorandum or Disclosure Document is similar to an invitation letter to the
investors, inviting them to invest in the issue. As per SEBI, this offer document must have all the
details as mentioned by it and which are important and material for investor. Thus it has the
company profile, the challenges and strengths, the financial history, latest financial data, share
holding pattern, details of previous issues of similar security etc... It also has the details of the issue,
the structure of issue, details on Open and close of issue, the details Arrangers, bankers, Registrar,
Trustee etc

By studying this document one can understand the company profile and its financial position in a
gist. Also every minute detail of a particular issue like the interest payment, the terms and
conditions, redemption details, listing details can be understood from this document.

For the purpose of understanding the issue structure and coupon rate determination, IMs of various
bonds of Power Grid Corporation of India Limited have been studied.

Also to understand the Intrest rate determination under Floating rate mechanism and the terms
under that mechanism, the IMs of previous issues of FRBs by firms including Power Finance
Corporation, Railway Finance Corporation Limited, ICICI Bank, IDBI Bank, and Kotak Mahindra etc...
were studied.

           WORKING MANUAL FOR DOMESTIC RESOURCE PLANNING AND MOBILISATION
           IN P OWER GRID


The Power Grid Corporation of India Limited for its internal policies has a manual on Resources
rising. The document has the policies as defined by its Articles of Association and as vested by Board
with related to Borrowing power, the authority, accountability for activities related to resource rising
(including Term loans and Bonds).

The document also has the procedure of rising funds through Bonds and also through term loan
from banks, the Debt Servicing, the book building process, conversion of bonds from Physical to
Demat, statutory compliance etc.

It also has the formats of each letter to be sent to various parties like Registrar, Arranger, Investor,
Stock Exchange, Depository etc... The guidelines by SEBI and the copy of internal guidelines are also
included.

Thus overview of fund raising process along with legal and procedural aspects can be understood
from this document.


    18
Analysis of Fixed and Floating Interest Rates 2010

Introduction

The debt market is much more popular than the equity markets in most parts of the world. In India
the reverse has been true. Nevertheless, the Indian debt market has transformed itself into a much
more vibrant trading field for debt instruments from the rudimentary market about a decade ago.

The sections below encompass the transformation of government and corporate debt markets in
India along with a comparison of the developments in equity market.

Developments in Government Bond Market


Prior to 1992, money was collected and lent according to Plan. Lacunae in institutional infrastructure
and inefficient market practices characterized the government securities market. In fact the sole
objective pursued was to keep the cost of government borrowing as low as possible. If planning
went awry, the government sent word to its banker. The central bank made a few phone calls to the
heads of banks and bonds were issued and the money arranged. No questions asked, no
explanations given. The GOI bond market did not use trading on an exchange. It featured bilateral
negotiation between dealers. The market thus lacked price-time priority and the bilateral
transactions imposed counterparty credit risk on participants. This narrowed down the market into a
“club” with homogeneous credit risk. This was the state of the government debt market in India ten
years ago.

The major thrust of Financial Reforms commenced in 1992. This was when the contours of the debt
market began taking shape. The idea of the financial reform movement was to have more and more
different markets and not necessarily have whole financial intermediation left to the banks. The
reform process attempted at doing away with regulations in favour of controls based on market
forces i.e. an era where the interest rates are governed more by the market forces of demand and
supply and less by centralized supervision. Slowly, but steadily, the market grew, adding fresh
players and novel instruments. Several measures have added greater transparency and have brought
the issuances closer to the market levels.

The major reforms that took place in the 1990’s were:

• Introduction of the auction system for sale of dated government securities in June1992. This
signalled the end of the era of administered interest rates.

• The RBI moved to computerize the SGL and implement a form of a ‘delivery versus payment’ (DvP)
system. The DvP enabled mitigating of settlement risk in securities and ensured the smoothness of
settlement by synchronizing the payment and delivery of securities.

• Innovative products in form of Zero Coupon Bonds and Capital Indexed Bonds (Ex. Inflation Linked)
were issued to attract a wider gamut of investors. However, the pace of innovation suffered due to
non-sophistication of the markets and lack of persistence with some of the new bonds like Inflation
Indexed bonds after the initial lukewarm response.


    19
Analysis of Fixed and Floating Interest Rates 2010
• The system of Primary Dealers was established in March 1995. These primary dealers have since
then acquired a large chunk of share in the GOI bond market and have played the role of market
makers.

• The RBI setup “trade for trade” regime, a strong regulatory system which required that every trade
must be settled with funds and bonds. All forms of netting were prohibited.

• Wholesale Debt Market (WDM) segment was set up at NSE; a limited degree of transparency came
about through the WDM at NSE, where roughly half the trading volume of India’s GOI bond market
is reported.

• The Ways And Means agreement put an end to issuance of ad hoc treasury bills, the government’s
favourite instrument of funding its profligacy.

• Interest Income in G-Secs was exempted from the purview of TDS.

• FIIs with 100% Debt Schemes were allowed to invest in GOI Securities and T-Bills while other FIIs
were allowed 30% investment in these instruments.

• Dematerialised forms of securities in G-Secs were done through the SGL and Constituents SGL
accounts.

The above-mentioned measures have served in bringing about greater market orientation of the
sovereign issues. This is particularly important as the sovereign borrowing parameters have a direct
bearing on the cost of capital for other non-sovereign issuers. The Primary market for G-Secs
registered an almost ten-fold increase between 1990-91 and 1998-99. The broadening of the market
was also apparent from the fact that RBI’s participation, as reflected by absorption of primary issues,
came down from 45.90% in 1992-93 to 0.74% in 1994-95.

Though significant improvements have been made in the primary market, the secondary market
continued to be plagued by certain shortcomings like dominance of a few players (acted as a
deterrent to lending width in the market), strategy of holding to maturity by leading players
(prevented the improvement in the depth of the market), the pre-1992 “telephone market”
continued to exist (prevents information dissemination and hence price discovery is limited) and low
retail participation in G-Secs continues to exist even today. Experts believe that there is tremendous
potential for widening the investor base for Government securities among retail investors. This
requires a two-pronged approach, increasing their awareness about Government securities as
adoption for investment and improving liquidity in the secondary market that will provide them with
an exit route. Also infrastructure is seen as the vital element in the further development and
deepening of the market.

Corporate Bond Market


In the last decade, market related borrowings by the corporate sector have remained depressed as a
plethora of Financial Institutions were available for disbursal of credit. These Institutions managed to
mobilize a significant amount of domestic savings and route them for corporate consumption.


    20
Analysis of Fixed and Floating Interest Rates 2010
Also the reforms abolished the office of the Controller of Capital Issues (CCI), which meant that
companies were free to price their equity issues as per the market appetite. This led to a slew of
primary issue of equity and the relative attractiveness of issue of debt yielded way to equities. In
fact, even debt issues were made with attached sweeteners like convertible portion of the fixed
income instrument. In addition, several relaxations in regulations post 1992 have encouraged Indian
corporate to raise debt from overseas capital markets leading to further shunning of the domestic
debt market by creditworthy issuers. Therefore, the corporate debt market in India has continued to
be dominated by the PSU’s.

In the recent past, the corporate debt market has seen high growth of innovative asset-backed
securities. The servicing of debt and related obligations for such instruments is backed by some sort
of financial assets and/or credit support from a third party. Over the years greater innovation has
been witnessed in the corporate bond issuances, like floating rate instruments, zero coupon bonds,
convertible bonds, callable (put-able) bonds and step-redemption bonds. For example, step bonds
issued by ICICI in 1998, paid progressively higher rates of interest as the maturity approached while
the IDBI’s step bond was issued with a feature to pay out the redemption amount in instalments
after an initial holding period. The deep discount bond issued by IDBI in the same year had two put
and call options before maturity.

What these innovative issues have done is that they have provided a gamut of securities that caters
to wider segment of investors in terms of maintaining a desirable risk-return balance. Over the last
five years, corporate issuers have shown a distinct preference for private placements over public
issues. This has further cramped the liquidity in the market. While private placement has grown 6.23
times to Rs. 62461.80 crores in 2000-2001 since 1995-96, the corresponding increase in public issues
of debt has been merely 40.95 percent from the 1995-96 levels.

The dominance of private placement in total issuances is attributable to a number of factors. First,
the lengthy issuance procedure for public issues, in particular, the information disclosure
requirements, provide a strong incentive for eligible entities to opt for the private placement route.
Secondly, the costs of a public issue are considerably higher than those for a private placement.
Thirdly, the amounts that can be raised through private placements are typically larger than those
that can be garnered through a public issue. Also, a corporate can expect to raise debt from the
market at finer rates than the prime-lending rate of banks and financial institutions only with an AAA
rated paper. This limits the number of entities that would find it profitable to enter the market
directly.

Thus the public issues market has over the years been dominated by financial institutions, which is
exemplified by the fact that ICICI and IDBI accounted for the entire debt offerings in 1998–99 and all
but one issue in 1999–2000. Another interesting fact is that in spite of dominating the public issues
market even financial institutions have raised significantly larger amounts through the private
placement route.

Further the secondary market for non-sovereign debt, especially corporate paper remains plagued
by inefficiencies. The primary problem is the total lack of market making in these securities, which
consequently lead to extremely poor liquidity. The biggest investors in this segment of the market,


    21
Analysis of Fixed and Floating Interest Rates 2010
namely LIC, GIC and UTI prefer to hold the instruments to maturity, thereby truncating the supply of
paper in the market.

The secondary market for corporate did receive a boost with the waiver on stamp duty payment on
transfer of debt securities, as long as they are dematerialized debentures, in the Finance Bill 2000.

Development of Equity Market vs. the Debt Market


During this decade of financial reforms development in equity market has been striking as compared
to relatively minor changes in the debt market. In terms of sheer market size, the equity market saw
a drop from 42% of GDP in 1993–94 to 28.6% of GDP in 2000-01. Over the same period, the GOI
bond market saw an increase in market size, fuelled by large fiscal deficits, from 28% of GDP in
1993–94 to 36.7% of GDP in 2000–01. Other things being equal, this should have generated an
improvement in liquidity of the GOI bond market and a reduction in liquidity in the equity market.
Instead, changes in market design on the equity market over this period gave the opposite outcome,
where the improvement in liquidity on the equity market was superior to that observed on the GOI
bond market. The reasons for this have been manifold:

• Foreign capital inflows into the GOI bond market are relatively undesirable to policy-makers. This is
in contrast with capital inflows into the equity market, where policy-makers seek to have the largest
possible capital inflows. Hence, infirmities in the market design on the GOI bond market do not
generate an important opportunity cost as far as harnessing foreign capital inflows are concerned.

• In the presence of “development finance institutions” and banks, firms in India are seen as having
access to debt financing, access to debt finance was therefore not seen as a major bottleneck
hindering investment. Hence, the lack of a liquid bond market was not keenly seen as a constraint in
investment and growth.

• In the case of the GOI bond market, the benefits from a non-transparent market with entry
barriers accrue primarily to banks and PDs. The PDs are largely the creation of RBI and public sector
banks have extremely close ties with RBI. The RBI is the regulator for G-Secs market.

Thus the development of equity markets took precedence over development of debt market in India
but the future does seem promising for the debt market.

The Bond market has been growing popularity over the years. This can be seen from the following
chart depicting the average trade value in Wholesale Debt Segment


    22
Analysis of Fixed and Floating Interest Rates 2010

                     Average Trade Size- WDM Segment
      35.00

      30.00

      25.00
 Rs. Crores


      20.00

      15.00

      10.00

              5.00

              0.00


                     Jun-04
                     Jun-94


                     Jun-96


                     Jun-98


                     Jun-00


                     Jun-02


                     Jun-06


                     Jun-08
                     Oct-95


                     Oct-97


                     Oct-99


                     Oct-01


                     Oct-03


                     Oct-05


                     Oct-07


                     Oct-09
                     Feb 99
                     Feb-95


                     Feb-97


                     Feb-01


                     Feb-03


                     Feb-05


                     Feb-07


                     Feb-09
Figure 1 Trend of Average Trade Size - WDM


From the above trend chart, the tremendous growth of trade in Debt segment can be clearly
demonstrated. The average trade size i.e. Value of each trade has increased from a meagre amount
of Rs. 30 Lacs in the June 1994 to Rs 7.24 Crores in June 2004 to 29.94 in March 2010. There has
been a multi fold


               23
Analysis of Fixed and Floating Interest Rates 2010


     Chapter II
     Financial Statement
     Analysis


                 Balance Sheet Analysis
                 Profit and Loss Analysis
                 Cash Flow Analysis
                 Ratio Analysis


24
Analysis of Fixed and Floating Interest Rates 2010

Financial Statements Analysis
To understand the performance of a concern and to forecast its financial position and financial
strength it is per se necessary to analyse its financial statements. Though a firm makes huge profits
but faces liquidity concerns and though a firm is poor profitability compared to others but yet is
rated as financially strong firm. Thus to comment on ones financial position and financial
performance, it is not possible to comment based on one parameter. Different parameters like
profits, activity, leverage, liquidity, Investments, turnovers, returns, ratios etc is to be analysed.

 Different financial statements that can be analysed are Balance Sheet (Position Statement), Profit
and Loss Account (Performance Statement), Cash Flow Statement, Funds flow statement, Apart from
these there are some non-financial reports which are also part of Annual report of a company, and
they are Directors report, Industry Analysis, Auditors report, Third party disclosures, etc..

Some of the popular tools used for the effective analysis of the financial statements are

       Multi-Step Analysis ( Balance Sheet, Profit and Loss and Cash Flows)
       Common Size Analysis
       Comparative Analysis ( Over the years or with Peers)
       Index
       Trend Analysis
       Ratio Analysis


    25
Analysis of Fixed and Floating Interest Rates 2010

Balance Sheet Analysis

Balance Sheet is one of the most important sources for analysing the financial position of any
company. Some of the very important aspects that can be analysed using the Multi Step Analysis of
the Balance Sheet are Capital Composition, Sources and Application of Funds, Trends in Shareholding
Patterns, Trend of Self and Borrowed Funds. Composition of Loans, Trends in fixed assets, analysis of
Working capital etc....

Capital Composition
Capital is one of the import and prime source of funds. It is a long term source and comprises of
Shareholders Capital (L1), Reserves (L2), Secured loans (L3) and Unsecured loans (L4).

From the flowing stacked area chart and also from the table following things can be interpreted:

     The proportion of Share Capital in total capital is reducing every year. This implies the firm is
      going on leveraging itself and trading on equity. It also implies the firm is not using its equity
      route but either reinvesting the profits or borrowing loans. In the year 2007 though 10%
      fresh equity was issued to the public by the route of IPO the proportion has reduced
      because of continuous borrowings as Secured Debentures and Loans. The contribution has
      reduced from 35 % in 1996 to just 9% in 2009.
     The Reserves and Surplus which includes the reinvestment of profits as retained earnings
      has been increasing from 16% to 25%. This implies firm is in the path of expansion and
      instead of distributing the earnings in form of dividends to the shareholders it is retaining
      and ploughing back the profits in the business.
     There has been an exponential increase in the secured Loans which comprises of
      Debentures, Loans from Banks and Loans from Institutions. The company to fulfil its Cap-Ex
      requirements has a practice of issuing Secured Non Convertible Redeemable Debentures.
      Also it takes term loans from banks and Loans from Multi-Lateral agencies like World Bank
      and Asian Development Bank. The share of this source has increased from 13% to as high as
      58%. But since the firm has security backed with these loans, it is most preferred by the
      investors. But over the years in the same trend continues, there may be liquidity concerns
      and also solvency issues. And a high financial risk is also attached with the loans as they
      demand regular payment of interest and principal no matter if the financial performance is
      good or bad. Default in payment impacts the rating and impairs borrowing ability.
     The Loans from Unsecured Borrowings is regarded as the most risky source as there is no
      security backed for it and also the interest rates are very high due to high risk. The
      Unsecured loans have been on fall over the years. There has been a rise in the years 2001
      and 2006 due to unexpected borrowing needs. But over the years the company is trying to
      repay its unsecured loans which are very costly.
     Overall the Capital Structure of the firm is changing over the years, from a less leveraged
      firm of (D/E) less than 1; it has reached to leveraged ratio of 1.92. And also the proportion of
      Secured loans has been on a rise to compensate the fall in equity and unsecured loans
      contribution. But analysis of Absolute amounts of each source and also analysis of self and
      borrowed funds need to be done for better understanding.


    26
Analysis of Fixed and Floating Interest Rates 2010


                                           Capital Composition
   100%
                                                                                           14.34%      11.69%      9.72%
                                                          17.82%           14.62%
    90%                                  22.06%
                        27.69%
    80%                                                                                                           24.56%
          35.31%                                                                                       26.50%
                                                                           26.28%          25.53%
    70%                                                   23.78%
                                         22.08%
                        18.54%
    60%
          16.03%
    50%                                                                                                           58.38%
    40% 13.33%          23.45%           27.17%           32.14%           36.55%          41.64%       48.73%
    30%

    20%
                        30.32%           28.68%           26.25%
    10% 35.33%                                                             22.55%          18.49%
                                                                                                        13.08% 7.34%
     0%
        1996     1997    1998    1999     2000     2001   2002     2003     2004    2005   2006     2007    2008     2009

                    Unsecured Loans              Secured Loans            Reserves Total          Share Capital


Figure 2 Capital Composition from 1996 to 2009


                                      Share       Reserves       Secured      Unsecured
                                      Capital     Total          Loans        Loans

                         1996         35.31%      16.03%         13.33%       35.33%
                         1997         30.92%      17.45%         19.51%       32.12%
                         1998         27.69%      18.54%         23.45%       30.32%
                         1999         24.55%      19.83%         25.09%       30.52%
                         2000         22.06%      22.08%         27.17%       28.68%
                         2001         20.00%      24.53%         23.25%       32.23%
                         2002         17.82%      23.78%         32.14%       26.25%
                         2003         15.83%      24.48%         34.59%       25.10%
                         2004         14.62%      26.28%         36.55%       22.55%
                         2005         14.14%      26.04%         40.01%       19.81%
                         2006         14.34%      25.53%         41.64%       18.49%
                         2007         12.52%      23.60%         43.15%       20.73%
                         2008         11.69%      26.50%         48.73%       13.08%
                         2009         9.72%       24.56%         58.38%       7.34%
                        Table 1 Capital Composition from 1996 to 2009


     27
Analysis of Fixed and Floating Interest Rates 2010


Sources and Application of Funds


Every firm has different sources of funds like share capital, reserves, Loans, Debentures, Current
liability, public borrowings etc... And the funds are borrowed for some specific applications like fixed
assets, Investments, Current Assets etc... An analysis of the sources is to be done for the purpose of
assessing the costs and also the applications to analyse the profitability. It is necessary to invest the
funds in profitable resources to earn good Return on Investment and fulfil the expectations of the
stake holders. Following pie-charts show the sources of funds and applications of the same for the
year 2008-09.


                        Total Current
                                        Sources of Funds- 2008-09
                          Liabilities                                               Term Loans
                             19%                                                   (Institutions)
                                                                                         1%
                                                                                             Term Loans (Banks)
               Unsecured Loans                                Non Convertible                       1%
                     6%                                         Debentures
                                                      Secured      28%
                                                       Loans                             Deferred Credit
                                                        47%                                   17%
             Reserves and Surplus
                     20%

                    Share Capital                     Reserves and Surplus          Unsecured Loans
                    Total Current Liabilities         Non Convertible Debentures    Term Loans (Institutions)

                                      Share Capital
                                           8%


Figure 3 Sources of Funds- 2008-09

From the above chart on Sources of Funds, following interpretations can be made:

     The company has just 28% of the sources as shareholders Funds (Non borrowed funds) this
      implies the firm is highly leveraged. But seeing the nature of the business of the firm which is
      into power transmission and with many projects regularly under implementation, it faces
      high capital requirement. Thus it depends on the borrowed funds.
     As mentioned earlier, the firm is a high growth firm thus has just 19% from Short term
      sources like suppliers credit and customers advance.
     Highest is being contributed by Secured Loans which has Non Convertible Debentures,
      Deferred Credit and Term Loans.
     The firm prefers to raise loan by issuing the Non Convertible Debentures because it has less
      interest rate than term loans and are the availability of Option of moratorium period which
      matches with the gestation period of the projects.


     28
Analysis of Fixed and Floating Interest Rates 2010
     Unsecured loans which are very costly due to high rates of interest when compared to
      secured loans are just 6%.
     The firm in the year 2009 has funds of Rs. 53787.32 Crores.


                                 Applications of Funds- 2008-09
                                Total Current
                                  Assets
               Investments         15%
                  3%                                                             Net Block
                                                                                 Capital Work in Progress
                                Capital
                                                Net Block
                              Work in                                            Investments
                                                 57%
                              Progress                                           Total Current Assets
                                25%


Figure 4 Applications of Funds- 2008-09

The application of funds implies the avenues where the investment is made to earn the revenue and
to carry on the activities as per the objectives of the business.

     Being a capital intensive firm, the 57% of the funds are invested in Net Block i.e... Fixed
      assets like Transmission Grids, transmitters etc...
     As high as 25% of the resources are invested in Capital WIP (Work in progress), this signifies
      that the company is in the path of expansion and is undertaking the projects. The Capital
      WIP implies the funds given as advance to the contractors, the Under Construction buildings
      and plants, etc...
     Just 3% of the funds are into Investment and 15% in current assets. We can infer that either
      the firm has operational excellence in Working capital management or since it is Under
      Expansion stage the investment in short term assets is low.

From the Sources and Applications it can be analysed that 15% of short term Assets (CA) is wholly
financed by the Current liabilities which is 19%. This implies the firm is matching its short term
requirements with short term sources. This may be termed as aggressive strategy because the
Permanent and temporary working capital is being financed by the short term funds.


     29
Analysis of Fixed and Floating Interest Rates 2010
Share Capital
After analysing the various sources and Applications of funds, it is now necessary to analyse the
trend in each component of the sources and application over the years. The share capital has been
increasing over the years; this is because of the companies borrowing from Government of India by
allotting the shares. Pre-Listing i.e... Before 2007, the company used to allotment shares for this
purpose. In the year 2008, there has been rise in shares allotted because of Initial Public Offer on
26th September 2007. Under the plan of Disinvestment of Public Undertakings, 10% of fresh shares
and 5% of government of India’s holding was issued to the public. In the year 2008 to 2009, the
number of shares and the share capital is constant implying no further issue of share capital is made.
However there is news of further disinvestment through FPO in the year 2010, so there may be
change in share capital in the year 2010-11.


                                  Share Capital
   4,500.00
   4,000.00
   3,500.00
   3,000.00
   2,500.00
   2,000.00                                                         Share Capital
   1,500.00
   1,000.00
     500.00
        0.00
                2003 2004 2005 2006 2007 2008 2009


Figure 5 Trend in Share Capital


Share Holding Pattern


Not only the share capital but also the holding pattern of the same shall be studied. Since Power
Grid Corporation is one of the Public Undertaking, the maximum holding is with the Government of
India. Only after September 2007, i.e... After the Disinvestment, the holding pattern was diluted. The
holding reduced to 86.37%. Through the issue, the Government of India (promoter) sold its 5% stake
and also fresh equity of 10% of the total share capital was issued. As on 31 st of December 2009,
Institutional and Non Institutional investors have almost equal contribution of 7%.


     30
Analysis of Fixed and Floating Interest Rates 2010

                    Share Holding Pattern as on 31st Dec 2009
           Non Promoter
            (Institution)                     Non Promoter (Non-
                 7%                               Institution)
                                                       7%


                                                                                  Government(Central / State)
                                                                                  Non Promoter (Institution)
                                           Government(Central                     Non Promoter (Non-Institution)
                                                / State)
                                                  86%


Figure 6 Share Holding Pattern as on 31st Dec 2009


Share Holders                                                   31-12-     31-03-       31-03-      19-04-
                                                                2009       2009         2008        2007
Government(Central / State)                                     86.37%     86.37%       86.37%      100.00%
Individuals / Hindu Undivided Family                            0.00%      0.00%        0.00%       0.00%
Financial Institutions / Banks                                  1.13%      0.66%        0.37%       0.00%
Foreign Institutional Investors                                 1.62%      2.58%        2.89%       0.00%
Insurance Companies                                             3.68%      2.37%        0.97%       0.00%
Mutual Funds / UTI                                              0.66%      0.79%        0.65%       0.00%
Bodies Corporate                                                1.65%      1.69%        1.93%       0.00%
Individuals (up to Rs. 1 lakh)                                  4.17%      5.10%        6.10%       0.00%
Others                                                          0.73%      0.45%        0.72%       0.00%
Table 2 Share Holding Pattern from 2007 to 2009


                                     Share Holding Pattern
                                                                         Government(Central /
                                                                         State)
                                                                         Financial Institutions /
                                                                         Banks
                                                                         Foreign Institutional
                                       31-12-2009                        Investors
                                                                         Insurance Companies
                                            31-03-2009
                                             31-03-2008
                                                                         Individuals holding upto
                                      19-04-2007
                                                                         Rs. 1 lakh


Figure 7 Share Holding Pattern


     31
Analysis of Fixed and Floating Interest Rates 2010
Name of Share Holder                                                 No. Of Shares         (%)
                                                                     ( of Rs. 10 each)
President Of India ( Ministry of Power)                    3533637935                      83.96%
President Of India ( Ministry Of Development Of North East 101269800                       2.41%
Region)
Life Insurance                                             60342943                        1.43%
Corporation Of India
LIC Of India - Market Plus                                 48942430                        1.16%
LIC Of India Money Plus                                    38713829                        0.92%
Janus Contrarian Fund                                      32210129                        0.77%
LIC Of India Market Plus – 1                               23728370                        0.56%
ICICI Prudential Life                                      20647334                        0.49%
Insurance Company Ltd.
Life Insurance                                             8105330                         0.19%
Corporation Of India Profit Plus
HDFC Standard Life                                         5950579                         0.14%
Insurance Company Limited
Total                                                      3873548679                      92.03%
                                                3
Table 3 Top 10 Share Holders as on 29.01.2009

Some of the supposition that can be made analysing the holding pattern over the years and the Top
ten shareholders is:

       The holding of promoter (Government) has reduced to 86.37% post IPO. But after that the
        holding is constant implying no further dilution or no further issue has been made.
       Over the years the holding of Individuals holding up to Rs. 1 lakh (i.e... Retail Investors) is
        falling
       Holding of Insurance Companies is increasing over the years, which implies that the
        company is attracting that kind of clients.
       Also the holdings by FIIs are on the fall and are compensated by holdings of Financial
        Institutions which is increasing.
       From the list of Top 10 shareholders and the proportion of their holdings, it can be very
        clearly observed that the holding is very much skewed.
       92% of total share capital is held by the top 10 shareholders. Thus the Ownership and
        control is under few hands.

Brief note on Initial Public Offering
The corporation has come up with Initial Public Offer in the month September, 2007 with an issue
size up to573, 932,895 equity shares of Rs. 10 each for cash at a price of Rs. 52 per equity share
aggregating Rs. 2985crores. The issue comprised a fresh issue of up to 382,621,930 equity shares
and an offer for sale of up to191,310,965 equity shares by the President of India acting through the
Ministry of Power, Government of India. The issue comprised a net issue to the public of up to
559,954,895 equity shares and a reservation of up to 13,978,000 equity shares for subscription by
employees at the issue price. The issue comprised approximately 13.64% of the fully diluted post-
issue capital of POWERGRID.

3
    Source: Final Disclosure Document for XXXI issue of Bonds of Power Grid (www.nseindia.com)


       32
Analysis of Fixed and Floating Interest Rates 2010
Reserves


                       Reserves and Surplus
   12000
   10000
    8000
    6000
    4000                                                    Reserves Total

    2000
        0


Figure 8Trend in Reserves and Surplus

The Reserves in the form of General reserve, Capital Reserve, Share Premium, Debenture
Redemption reserve and Profit and Loss Account’s Credit balance are maintained. There has been
continuous increase in the reserves over the years. In the year 2008, the steep increase is
attributable to the share premium account started after the IPO. The shares were issued at a
premium of Rs. 42 per share. Overall, the company is able to retain the earnings and ploughing back
them to fund the capital expansion plans.

Secured Loans


The secured loans in specific to Power Grid Corporation of India Limited comprises of Debentures,
Loans from banks like Indian Overseas Bank, Corporation Bank, Punjab National Bank; Loans from
Institutes like Asian Development Bank, and World Bank (IBRD) and Deferred Credit.


                 Non Convertible Debentures
       20000
       15000
       10000
        5000
            0


                               Non Convertible Debentures


Figure 9 Trend in Non Convertible Debentures


     33
Analysis of Fixed and Floating Interest Rates 2010

                             Term Loans Institutions
        1000
         800
         600
         400
         200
           0
                      2004            2005                2006            2007        2008     2009

                                                   Term Loans Institutions


Figure 10 Trend in Term Loans Institutions


                                     Term Loans Banks
         1000

             500

               0
                       2004                2005           2006            2007        2008    2009

                                                     Term Loans Banks


Figure 11 Trend in Term Loans Banks


               Deferred Credit / Hire Purchase
    10000

     8000

     6000
                                                                                         Deferred Credit / Hire
     4000
                                                                                         Purchase
     2000

         0
               2000
                      2001
                             2002
                                    2003
                                            2004
                                                   2005
                                                          2006
                                                                 2007
                                                                        2008
                                                                               2009


Figure 12 Trend in Deferred Credit


     34
Analysis of Fixed and Floating Interest Rates 2010
From the above facts and figures and the trend of growth over the years, following analysis can be
made:

     There has been a constant increase in the amount of Loan from Non Convertible
      debentures. From a mere amount of Rs. 1139 Crores in the year 2000-01, the amount has
      exponentially increased to Rs. 15112 Crores in the year 2009-10.
     Usually the firm issues Non Convertible, Secured, Taxable, and Redeemable Bonds with a
      rating of AAA/ LAAA which implies the most secured investment being issued by the credit
      rating agencies like CRISIL, CARE and ICRA. Due to the security, and Ratings, the firm is able
      to attract funds at a lower rate than compared to the rate being paid in case of term loans.
     At present as on 31st March 2010, the firm has issued 32 series of bonds and 26 Bonds are
      active and interest is being paid on them.
     The Term Loans from Institutions mainly has the loans from LIC at different rates. This
      amount is depleting over the years as it is redeemed in equal instalments every year. And
      also since they are raised at rate of 10% or high, the firm is proffering to repay the amount.
     The Term Loans from Banks include loans from banks like ICICI, PNB, and IOB etc... Over the
      years the loan from this source is also on the fall. This is mainly because the firm prefers to
      issue bonds as they have a moratorium period of 3-4 years and also the Intrest rates are
      lower there. And in case of Term loans the rates are linked to PLR and thus there are wide
      fluctuations.
     Loans in form of Deferred Credit or Hire Purchase are used to finance the Machines and
      Plants purchase. Since the firm is expanding and has many projects under implementation
      the machines and plants are being financed through this operation.


Unsecured Loans


                                 Unsecured Loans
                                                 7000
                                                 6000
                                                 5000
                                                 4000
                                                 3000
                                                               Unsecured Loans
                                                 2000
                                                 1000
                                                 0


Figure 13 Trend in Unsecured Loans


     35
Analysis of Fixed and Floating Interest Rates 2010
The Unsecured loans have been in a constant range and they include Unsecured Bonds, Loans from
Institutions and Banks at a higher rate and without a security. In the year 2007, there has been a
steep increase in the secured loans because of Increase in borrowings from secured Bonds.


                               Debt-Composition
    100%
     90%
     80%
     70%
     60%
     50%                                                      Unsecured Loans
     40%
     30%                                                      Secured Loans
     20%
     10%
      0%


Figure 14 Debt Composition from 2003 to 2009

From the above chart it can be very clearly commented that the composition of secured loan has
been increasing over the years. This is mainly because of issuing of secured bonds and redemption of
unsecured bonds.

Current Liability


                                 Current Liability
   12000

   10000

    8000

    6000                                                      Provisions

    4000                                                     Current Liabilities

    2000

        0
             2003 2004 2005 2006 2007 2008 2009

Figure 15 Trend in Current Liability


     36
Analysis of Fixed and Floating Interest Rates 2010
One of the component of sources of Funds and which is short term in nature is Current Liability.
Some of the observations that can be made are:

     The Current Liabilities has increase from Rs. 1646 Crores in the year 2003-04 to as high as
      Rs.10472 Crs in the year 2009-10.
     Also the Proportion of Provisions for deferred tax and Debtors is increasing over the year.
      This is mainly because of guidelines issued by CERC (Central Electricity Regulations Code),
      which has the guidelines of making provisions as per the Tariff system for its customers who
      are SEBs since the financial position of SEBs is not sound.


Fixed Assets


                                  Fixed Assets
                                          35000
                                          30000
                                          25000
                                          20000
                                                      Net Block
                                          15000
                                                      Capital Work in Progress
                                          10000
                                          5000
                                          0
    2003 2004 2005 2006 2007 2008 2009


Figure 16 Trend in Fixed Assets

Some of the observations that can be made are:

     The point that the firm is under a rapid expansion stage is very clear from the trend in
      growth of fixed assets.
     The Fixed assets have increased at an exponential rate. This is mainly because of the
      National Grid project.
     Also the firm has many projects under implementation stage thus has a high amount in
      Capital Work in progress, which include the advances to the supplier of machinery, Under
      construction plants and buildings etc...


     37
Analysis of Fixed and Floating Interest Rates 2010
Investments


                                      Investments
   2500

   2000

   1500

   1000                                                               Investments


    500

       0
               2003    2004    2005    2006   2007     2008   2009


Figure 17 Trend in Investments

The firm has investments of its residual surplus in the income earning instruments. But since the
CREC guidelines do not permit them to invest in different Money market instruments like
Commercial papers, Certificate of Deposits etc... It is permitted to invest only into the safest and also
secured securities like fixed deposits. And also though the amount in investments is not much
fluctuating, but this must be compared with that of fixed assets. From the following chart, it is very
clearly evident that the firm invests its surplus into fixed assets than in investments. Only the surplus
which cannot be invested into capital creation is invested in those avenues. Also though the fixed
assets proportion is exponentially increasing, the proportion of investments is constant.


                        Fixed Assets: Investments
   45000
   40000
   35000
   30000
   25000
                                                                      Fixed Assets
   20000
   15000                                                              Investments
   10000
    5000
           0
           2003       2004    2005    2006    2007     2008    2009


Figure 18 Comparison of Fixed Assets and Investments


     38
Analysis of Fixed and Floating Interest Rates 2010
Current Assets


                                 Current Assets
   9000
   8000
   7000
   6000
                                                           Loans and Advances
   5000
                                                            Inventories
   4000
   3000                                                    Sundry Debtors
   2000                                                     Cash and Bank
   1000
       0
            2003 2004 2005 2006 2007 2008 2009


Figure 19 Trend in Composition of Current Assets

The short term applications of the funds are Current Assets. These are the assets which can be
converted to cash in less than a year. The current assets have been at an increase over the years.

Following analysis can be done:

     The Cash and Bank balance, which signifies the actual cash in hand of the firm, has increased
      over the years. From a negligible amount of Rs. 118 Crores in the year 2003-04 the balance
      has increased to Rs. 2428 Crores in the year 2009-10. This implies that the firm has good
      liquidity management and holds cash in hands. But this also implies that the firms
      opportunity cost of holding cash is high since the same can be invested in other avenues and
      get returns.
     The Sundry debtors which were very high or the year 2003-04 have decreased over the years
      and have increased in the year 2009-10. This could be due to the expansion in the
      operations and also since the customers are mainly SEBs (State electricity Boards), whose
      financial position is weak, thus the debtors have increased.
     Being a capital intensive firm it has very least amount of Inventories which are in form of
      spares, consumables etc... The amount is very negligible compared o the other components.
     The Loans and advances have been increased. This can be because of short term loans to its
      subsidiaries.
     Overall, if we compare the current assets and Current liabilities position, the firm is able to
      match the current assets and current liabilities and is adopting Matching approach of
      working capital management by financing the short term needs by short term sources.


     39
Analysis of Fixed and Floating Interest Rates 2010

Profit and Loss Analysis

After analysing the components of balance sheet which depicts the financial positions of the firm, it
is also per se necessary to study the financial performance of the firm. The Profit and Loss account or
the Income Statement of the firm for the financial year very truly depicts the profitability of the firm.
The aspects like Operating Income, Sales, Profits and expenses can be analysed from this statement.


                 Multi-Step Analysis of Incomes
   30000

   25000
                                                                            Sales
   20000
                                                                            PBIDT
   15000                                                                    PBIT

   10000                                  Sales                             PBDT
                                          PBIDT                             PBT
    5000                                   PBIT
                                          PBDT                              PAT
                                           PBT
        0                                  PAT
         2003       2004       2005       2006    2007   2008    2009


Figure 20 Multi Step Analysis of Income

Multi Step Analysis Implies analysing each and every component of the Profits and expenses. This
helps in analysing the behaviour of different costs namely, Depreciation, Non Operating Expenses,
Financial Expenses, Taxes etc...

Some of the analyses that can be made are:

      The sales have been increasing over the year and the blue portion which depicts the
       Operating Expenses; it is increasing at a variable rate with the increase in the sales.
      The PBIDT (Operating Profit) is increasing in tandem with the sales.
      The PBIT (Profit before Intrest and Taxes) is also increasing but the increase in the PBIT is
       less than the increase in the sales in the year 2009 because of more than proportionate
       increase in the operating expenses.
      The purple segment which represents Intrest expenses have been at a raise over the years
       because of high borrowings by the firm in form of Loans and debentures. The raise is
       disallowing the firm to take advantage of operating leverage. But yet the proportionate
       increase in PBDT or PBT is more than that of sales.
      As discussed before the proportionate increase in PBDT (Profit before Depreciation and
       Taxes) is more than the increase in Sale. This is because of the operating leverage enjoyed
       by the firm due to presence of the fixed expenses in form of depreciation and Intrest.


     40
Analysis of Fixed and Floating Interest Rates 2010
      The Green proportion which corresponds to Depreciation is increasing due to continuous
       additions in the fixed assets.
      The PBT (Profit before Tax) which is arrived at after deducting the Depreciation from PBDT
       and the PAT (profit After Tax) which is resultant after Tax amount is deducted from the PBT
       are growing at a same tandem. This implies there has been no change in the Tax rate, which
       is represented by the colour Sky Blue in the above chart.

Sales/ Operating Income


                             Operating Income
     7000

     6000

     5000

     4000

     3000                                                       Operating Income

     2000

     1000

         0
              2003    2004   2005   2006   2007   2008   2009

Figure 21 Trend in Incomes

Operating Income is one of the very vital sources of revenue for any firm. The profits, the activity
and all the important performance parameters are measured in relation to this factor. Some of the
observations that can be made from the above trend chart are:

     The main object of the business as defined by the Memorandum of Association is to transmit
      the power and it has been termed as CTU (Central Transmission Unit) by the Central
      Government.
     Since there are few competitors in form of SEBs and no firm with the similar size of Power
      Grid Corporation of India Limited, thus it has a near monopoly in this sector.
     The continuous increase in sales/ Transmission Income can be regarded to the fact that the
      business is expansion.
     In the year 2007, the firm entered into the business of Telecommunication ( leasing of over
      head lines) and Consultancy ( consultancy to other countries and also consulting the Govt
      project of RGGVY)
     Seeing the growth of Operating Income from Rs.2103 Crores to Rs.6579 Crores between the
      years 2003 and 2010, it can be remarked that the company has a good performance


     41
Analysis of Fixed and Floating Interest Rates 2010
Profits


                                              Profits
   5000
   4500
   4000
   3500
   3000
                                                                                  PBIT
   2500
   2000                                                                           PBT
   1500                                                                           PAT
   1000
    500
      0
                         2003   2004   2005   2006   2007   2008   2009


Figure 22 Trend in different Profits

The Profits (Operating, Before Tax and After Tax) have been increasing over the last 7 years. But
some of the points to be observed are:

      Though the Operating Profit (PBIT) has increased at a very tremendous rate, but the increase
       in the PBT is not at the proportionate rate because of simultaneous increase in Non
       Operating and Financial Expenses.
      Also in the year 2003-04, the PBT (Profit before Tax) was less than the PAT (Profit after Tax)
       because of Tax Credit and Tax Subsidy being provided by the Government.
      Since 2005-06, the gap between PBT and PAT has been at a rise implying that the Tax
       amount being paid by the company is increasing.

Dividends


                                         Dividends
                    15

                    10
    of Face Value


                     5                                                    Dividends

                     0
                          2003 2004 2005 2006 2007 2008 2009


Figure 23 Dividend Trend


        42
Analysis of Fixed and Floating Interest Rates 2010
The dividends are one of the ways in which the company can return the earnings to the share
holders. The dividends depict the profitability of the company. From the above chart it can be
clearly seen that the dividends are growing over the year. Pre-2007, when Government of India (The
President of India) was the sole share holder/promoter, the number of shares issued to it kept on
changing every year. The capital requirement was funded by the government by means of Equity
capital infusion. Thus the dividend proportion has also increased. And in the year 2008 and 2009,
after the IPO, when apart from GoI, general public too participated in the shareholding pattern; the
dividend percentage has remained same. Also pre 2007, the face value of shares was Rs.100 and
from the year 2007 the face values of the shares have changed to Rs.10.

The analysis of the Dividend payment can be made more effective by studying the Retention and
payout ratio. It can be seen from the following graph that, the retention of profits which is
represented by the colour green, is very high in the initial years, but the payout ratio has increased
over the years and especially after the IPO (Disinvestment). But the retention ratio is always at least
60-70% which depicts that the firm is reinvesting and pooling back its earnings into the business
instead of distributing it to the shareholders. By this it also signals that the internal rate of return of
the firm is higher than the Share holders expectation thus the earnings are retained back.


                                        Profits Appropriation
          100%
           90%
           80%
           70%
           60%
           50%
           40%
           30%
                                                                                             Payout
           20%
           10%                                                                               Retaintion
            0%
                     2003        2004       2005    2006    2007     2008       2009

                     2003        2004       2005    2006    2007     2008       2009
      Payout         31.47      37.07       31.52   31.32   24.2     17.07     15.72
      Retaintion     68.53      62.93       68.48   68.68   75.8     82.93     84.28


Figure 24 Profit Appropriations over the years


     43
Analysis of Fixed and Floating Interest Rates 2010

Cash Flow Analysis

Cash is regarded as the blood of any business. A company may be highly profitable with high
balances in general and Capital reserve, with a good asset value and high Net worth. But the
situation will be worsening if cash positions are low. A firm with a very high profitability but with
constrained liquidity would face the problem of solvency. Thus it is per se necessary to analyse and
study the cash flows from various sources and also its application.

The Cash flow statement is divided into three parts namely Cash from Operating activities, cash from
Investing activities and cash from financial activities. The cash flow statement for the year 2009 and
2008 are:


Cash Flow Statement                                                          200903              200803

   Cash and Cash Equivalents at Beginning of the year                        1865.59            1196.82

  Cash Flow From Operating Activities

  Net Profit before Tax & Extraordinary Items                                2228.57            1730.53

  Total Adjustments (PBT & Extraordinary Items)                              3518.25            2111.69

  Op. Profit before Working Capital Changes                                  5746.82            3842.22

  Adjustment For WC Changes                                                  1048.29            -629.48

  Cash Generated from/(used in) Operations                                   6795.11            3212.74

     Direct Taxes Paid                                                       -154.02            -221.91

  Net Cash from Operating Activities                                         6641.09            2990.83

  Cash Flow from Investing Activities

  Purchased of Fixed Assets                                                  -770.82                     0

  Sale of Fixed Assets                                                              0            261.01

  capital WIP                                                               -8652.78           -6075.15

  Sale of Investments                                                         182.89             241.13

  Interest Received                                                           132.99             149.99

  Dividend Received                                                            19.54                5.39

  Investment in Group Cos                                                       -39.5             -10.35

  Others                                                                       -29.07             84.67

   Net Cash Used in Investing Activities                                    -9156.75           -5343.31


    44
Analysis of Fixed and Floating Interest Rates 2010
  Cash Flow From Financing Activities

  Proceeds from Issue of shares (incl share premium)                               0           1989.63

  Proceed from 0ther Long Term Borrowings                                   7629.85            4118.71

  Proceed from Short Term Borrowings                                            750                750

  Of the Long Term Borrowings                                              -1427.89           -1180.73

  Of the short term Borrowings                                                  -750               -750

  Dividend Paid                                                             -505.08            -464.28

  Interest Paid                                                            -2532.09           -1339.55

  Others                                                                      -85.84           -102.53

    Net Cash From Financing Activities                                      3078.95            3021.25

    Net Inc/(Dec) in Cash and Cash Equivalent                                563.29             668.77

    Cash and Cash Equivalents at End of the year                            2428.88            1865.59

Table 4 Cash Flow Statement

Some of the analyses that can be made from the above cash flow statement are:

     The cash flows from operating activities, which imply the cash generated by performing the
      business activities has increased from previous year. It has grown by approximately 122%
      which is very positive.
     Mainly there has been rise in cash flows from profits.
     Also the cash from Working capital was negative in the previous year implying more current
      assets were used in the previous year. But in the current year the cash from working capital
      is negative, this implies that the cash has been generated from the Current liabilities.
     The cash from Investing activity is negative this implies the firm is investing into assets and
      other income generating investments.
     The cash used in financing activities has increased by 71% over the previous year.
     Fixed assets worth Rs. 770 Crores were purchased this year implying the firm is expanding its
      scope of operation and also the fact that Assets worth Rs. 261 crores were sold last year and
      the figure of sale has been 0 this year.
     The Capital working Progress is very high at Rs.8 Thousand Crores. And also the amount has
      increased by 42% over the previous year. The main reason behind this is the projects
      undertaken by the company are of long completion and long implementation [period, thus
      lot of amount gets blocked as WIP.
     The firm is also generating some cash from the sale of Investments and also inform of
      income on the investments like Intrest and dividends.
     The cash from Financing activities include the cash generated from the resource raising
      activities in form of loans shares etc... It also includes the repayments of the earlier loans
      and the interest and dividends paid on them.
     There has been not much change in the cash generated from financing activities; it has risen
      by just 2 % over the previous year.

     45
Analysis of Fixed and Floating Interest Rates 2010
 There has been a high amount being generated by issue of shares in the year 2007-08
  because the shares were issued to public in form of IPO in the month of September, 2007.
 The Long term borrowings in form of issue of debentures (Bonds) domestic and international
  loans, has risen with a steep rate of 85% over the previous year.
 Some amount is also used in repayment of the borrowed short and long term funds.
 The amount used as repayment of interest towards the funds borrowed has also increased
  by 89%. This is tandem with the rise in borrowed funds which has risen by 85%.
 Overall the firm is generating cash from Financing and Operating Activities i.e. from its
  normal business course and also from borrowings and using all the funds in Investment
  activities like investing in fixed assets and other income generating investments.
 Overall the cash balance has increased by 30% over the previous year.
 Overall the cash flows are well managed, but the firm is unable to fulfil its requirements
  from the operational activities and has to depend on borrowings. But since it is in rapid
  expansion stage the borrowings are inevitable.


46
Analysis of Fixed and Floating Interest Rates 2010

Ratio Analysis

After analysing the balance sheet, the analysis of sources and applications of funds, profit and loss
analysis and also the cash flow analysis, It is per se necessary to also analyse the financial ratios of
the company. The financial analysis as a detached without comparing the figures with each other is
incomplete analysis and will not lead to true analysis. Thus every figure must not only be analysed
over the years but must also be compared with the other components of the same year. It is a tool
used by individuals to conduct a quantitative analysis of information in a company's financial
statements. Ratios are calculated from current year numbers and are then compared to previous
years, other companies, the industry, or even the economy to judge the performance of the
company. Ratio analysis is predominately used by proponents of fundamental analysis.

Some of the important aspects of ratio analysis are to scrutinize the profitability, liquidity, solvency,
as well as the efficiency of the company. Some of the important classes of ratios are:

       Liquidity Ratios
       Profitability Ratios
       Turnover / Activity Ratios
       Solvency Ratio

In the following section, the ratios of above mentioned heads foe Power Grid Corporation of India
Limited will be computed for last 5 years from 2004-05 to 2008-09. Also these figures will be
compared with the Industry average. Since there are very few players in the power transmission, the
benchmark of power generation industry has been considered.

Liquidity Ratio


These set of ratios help in analysing the liquidity position of the company. They can be defined as a
class of financial metrics that is used to determine a company's ability to pay off its short-terms
debts obligations. Generally, the higher the value of the ratio, the larger the margin of safety that
the company possesses to cover short-term debts. Liquidity ratios provide information about a
firm's ability to meet its short-term financial obligations. They are of particular interest to those
extending short-term credit to the firm. Two frequently-used liquidity ratios are the current ratio (or
working capital ratio) and the quick ratio.

Current Ratio
The current ratio is the ratio of current assets to current liabilities:

                                                                   
                                   =
                                                                

Short-term creditors prefer a high current ratio since it reduces their risk. Shareholders may prefer a
lower current ratio so that more of the firm's assets are working to grow the business. Typical values
for the current ratio vary by firm and industry. For example, firms in cyclical industries may maintain
a higher current ratio in order to remain solvent during downturns.


     47
Analysis of Fixed and Floating Interest Rates 2010
Quick Ratio
One drawback of the current ratio is that inventory may include many items that are difficult to
liquidate quickly and that have uncertain liquidation values. The quick ratio is an alternative measure
of liquidity that does not include inventory in the current assets. The quick ratio is defined as
follows:


                                                             − 
                                   =


The current assets used in the quick ratio are cash, accounts receivable, and notes receivable. These
assets essentially are current assets less inventory. The quick ratio often is referred to as the acid
test.

The company’s Current Ratio and Quick ratio for the year 2009-10 is 0.79 and 0.77 times
respectively. This infers that the company’s current liability is not covered fully by the current assets.
In case of unforeseen demand for payment from the current liabilities arises, the company will not
be in a position to honour them as it does not has enough current assets. Also the quick ratio is less
than its idle point of 1. The quick ratio considers the quick ratio which can be converted into cash in
a very short term. The ratio less than 1 implies the company is unable to maintain enough
marketable assets to cover the current liabilities. But these ratios must also be compared with the
overall industry standards.

                                     2008-09          2007-08             2006-07           2005-06           2004-05
Current Ratio                        0.793768         0.799878            0.577718          0.605015          0.810153
Quick Ratio                          0.765338         0.762923             0.54741          0.564984          0.752983
Industry- CA                              1.66             1.58                1.48              1.61              1.56
Table 5 Liquidity Ratios


                                   Liquidity Ratio
   1.8
   1.6
   1.4
   1.2
                                                                                              Current Ratio
     1
           2008-09     2007-08      2006-07        2005-06          2004-05                   Quick Ratio
   0.8
                                                                                              Industry- CA
   0.6
   0.4
   0.2
     0


Figure 25 Liquidity Ratios


     48
Analysis of Fixed and Floating Interest Rates 2010
After comparing the Current Ratio of Industry and the company along the years, it can be seen that,
the Current Asset ratio of the company is always lower than the standard level of the industry. This
implies that the liquidity position of the company vis a vis the industry standard is poor. Also though
the level fell in the year 2005-06 but has increase over the years after the year 2006-07. The Quick
ratio is also in tandem with the Current ratio implying that the company’s inventory level over the
year is constant. And the gap between these two ratios depicts the inventory position, and it can be
seen that the gap is less over the years, thus the average investment in inventory is very less.

Profitability Ratio


The profitability ratio is useful to measure the profitability of the company. Its ability to generate
returns on the capital invested. These can be understood as set of ratios that are used to assess a
business's ability to generate earnings as compared to its expenses and other relevant costs incurred
during a specific period of time. For most of these ratios, having a higher value relative to a
competitor's ratio or the same ratio from a previous period is indicative that the company is doing
well.

Profitability ratios show a company's overall efficiency and performance. We can divide profitability
ratios into two types: margins and returns. Ratios that show margins represent the firm's ability to
translate sales into profits at various stages of measurement. Ratios that show returns represent the
firm's ability to measure the overall efficiency of the firm in generating returns for its shareholders.

Operating Profit Margin (PBIDTM)
The Operating profit margin helps in determining the ability of the firm to convert what proportion
of the sales into the operating profit. The Operating profit here implies the Profits before Interest,
Depreciation and Tax (PBDIT). It is computed as:

                                                                                      
                                      =
                                                                                     

Alternatively, Instead of taking PBDIT as the Operating profit, PBDT i.e... Operating profit after
deducting the Intrest expenses also needs to be studied in this case, as the company has approx 60%
of its capital structure as borrowings and high proportion of the income is paid as interest. The PBDT
implies Profits Before Depreciation and Taxes.

For the year 2008-09, the PBDITM for the company and the industry standard was 89.08% and
36.37% respectively. And PBDTM for the company and the industry standard was 50.6 % and
28.24% respectively.

The figures for over the years for the company as well as the industry are:

                               2008-09        2007-08          2006-07         2005-06           2004-05
PBIDTM (%)                       89.08          87.44            96.28           90.95             94.16
PBDTM (%)                         50.6          58.41            64.52           60.83              61.7
PBIDTM (%)- Industry             36.37          29.96            28.66           37.09             39.73
PBDTM (%)- Industry              28.24           23.7             21.7           28.88             30.84
Table 6 Operating Profit Margins


     49
Analysis of Fixed and Floating Interest Rates 2010

                        Operating Profit Margin
   120

   100
                                                                             PBIDTM (%)
    80
                                                                             PBDTM (%)
    60

    40                                                                       PBIDTM (%)-
                                                                             Industry
    20                                                                       PBDTM (%)- Industry

     0
          2008-09 2007-08 2006-07 2005-06 2004-05


Figure 26 Operating Profit Margins

From the figures it can be stated that the company’s profitability position is excellent. It is able to
maintain margins at a much higher level when compared to the industry standards. The main reason
behind this is the company’s diversified profile. It has not restricted itself to Power transmission, but
has also entered into Consultation and Telecom.

Also the PBIDTM and PBDTM are in tandem for the years before 2007-08. In the year 2007-08, the
PBDTM has decreased disproportionately when compared to PBDITM and the main reason behind
this is the company’s increased borrowing which leads to increased interest payment.

Net Profit Margin
Net Profit margin is the ration of Pat and the Net Sales. PAT implies the Profit before Tax which the
net profit generated after paying all the operating, financial and other charges. It is computed using
the formula

                                                                              
                                        =
                                                                           

The Net profit margin or PATM of the company and also the Industry in the year 2008-09 was at
25.69% and 17.4% respectively.

Cash Profit Margin
Net profit is the residual of Income after deducting all type of expenses. But A net profit generated
need not imply excess cash of that amount is added in the business. The cash profit and Net profit
would differ because there are few non-cash expenses like Depreciation which shall not be
considered in case of computing Cash profits. Thus it is necessary to also study the Cash profit
Margin. It is the ratio of Cash Profits to the Net Sales.

For the year 2008-09 he cash profit Margin of the company along with the Industry average was
42.42% and 24.98% respectively.

The trend of both the above mentioned margins over the years is

     50
Analysis of Fixed and Floating Interest Rates 2010
                               2008-09    2007-08            2006-07           2005-06           2004-05
CPM (%)                          42.42       52.3              57.48             55.74             56.81
PATM (%)                         25.69      31.39              34.25             32.08             31.26
CPM (%)- Industry                24.98      19.98              19.47             26.96              28.3
PATM (%)- Industry                17.4      13.44              12.31             18.04             18.39
Table 7 Net Profit Margins


                                    Profit Margin
   70

   60

   50
                                                                                      CPM (%)
   40
                                                                                      PATM (%)
   30
                                                                                      CPM (%)- Industry
   20
                                                                                      PATM (%)- Industry
   10

    0
         2008-09 2007-08 2006-07 2005-06 2004-05


Figure 27 Net Profit Margins

In both the cases i.e... Cash profit Margin or The Net Profit Margin, the company figures are better
than the overall industry average. Also the cash profits are more than the Net profits; this shows
that a large amount of non- cash expenditure in way of depreciation and amortization is charged to
the profits.

Return on Capital Employed
Return on Capital Employed (ROCE) is used in finance as a measure of the returns that a company is
realising from its capital employed. It is commonly used as a measure for comparing the
performance between businesses and for assessing whether a business generates enough returns to
pay for its cost of capital. It is computed using

                                                                       
                                  =
                                                −  

The ROCE for the company in the year 2008-09 was 12% as compared to 9.35% of Industry average.

Return on Net Worth
Return on Net Worth (RONW) or popularly known as Return on Equity (ROE) measures the rate of
return on the ownership interest (shareholders' equity) of the common stock owners. It measures a
firm's efficiency at generating profits from every unit of shareholders. ROE shows how well a
company uses investment funds to generate earnings growth. It is computed using the formula

                                                                       
                                      =
                                                        + 


     51
Analysis of Fixed and Floating Interest Rates 2010
The RONW for the company and the Industry average in the year 2008-09 were 11.82% and 9%
respectively. Over the years, the RONW and ROCE trend can be seen from the following table.

                             2008-09    2007-08     2006-07   2005-06   2004-05
ROCE (%)                          12       9.27         9.5      8.95      8.01
RONW (%)                       11.82      11.74       11.77     10.65      8.99
ROCE (%)-Industry               9.35       9.09        9.38       8.8      9.44
RONW (%)-Industry               9.97       9.61       10.24      9.38     10.01
Table 8 Returns

EPS
EPS stands for Earnings per share. Similar to RONW which computes the percentage of earnings as
compared to the total net worth; EPS is a measure to determine the profits per share. It is ratio of
Net profits or Earnings Available to equity share holders and the No. of equity shares.

In case of Power Grid Corporation of India Limited there are no preference shares, so the total
earnings would be the earnings available to equity shareholders. And also in the year 2007, a 1
shares was split into 100 shares, thus the EPS needs to be adjusted for that period.


                                       EPS
          4.5
            4
          3.5
            3
          2.5
            2
          1.5
            1
          0.5
            0
                  2008-09    2007-08     2006-07       2005-06     2004-05
           EPS        3.81    3.24           3.09      2.6962       2.4018


Figure 28 EPS Trend


The EPS of Rs.3.81 on a face value of Rs.10 is a good indicator. Also the EPS has been on a rise
over the years, depicting the profitability of the company.


     52
Analysis of Fixed and Floating Interest Rates 2010
Solvency Ratios


Solvency ratios indicate the risk inherent in the company as a result of its debt. A good financial
analyst will also use solvency ratios to assess the debt profile of a company from its financial
statements, and analyze whether the company needs to undergo debt restructuring exercises such
as mortgage refinancing, debt consolidation, etc. In simple words the solvency ratio implies the
ratios that help investors assess a company’s ability to meet its long-term obligations. They also tell
investors how the company has been financed (debt or equity) and whether that is changing over
time.

Two most used Ratios are Leverage Ratio (D/E) and Interest Coverage Ratio.

Debt- Equity Ratio


Debt-Equity Ratio is one of the most popular ratios used in financial analysis of the company. It
shows how much the entity is trading on equity. It is the ratio of Borrowings and the owned capital.
Though a standard of 2 or 1.5 is considered as optimum, but it also differs based on industry and
business activity of the company. The Debt-Equity ratio of the company as on 31st March 2009 was
1.77. And based on unaudited figures the ratio was 2.11 as on 31st March 20104. Though it is high,
but it can be commented upon without comparing the same with the industry standard. The Debt
Equity of Power Generation Industry for the year 2008-09 is 0.75. But since the company is a Central
Transmitter Unit and also a sole large unit in the power transmission segment thus is into rapid
expansion and growth stage, the borrowings are very high.

The Debt Equity Ratio or Leverage Ratio over the years follows the following trend


                                Debt-Equity Ratio
                       1.95

                       1.75

                       1.55

                       1.35

                       1.15

                       0.95

                       0.75
                                 2008-09   2007-08   2006-07    2005-06   2004-05
            Debt-Equity Ratio     1.77      1.69         1.64     1.5      1.47


Figure 29 Debt Equity Ratio


4
    Source: The Information Memorandum of XXXII Issue.

       53
Analysis of Fixed and Floating Interest Rates 2010
Intrest Coverage Ratio
A ratio used to determine how easily a company can pay interest on outstanding debt. The interest
coverage ratio is calculated by dividing a company's earnings before interest and taxes (EBIT) of one
period by the company's interest expenses of the same period. The formula used is

                                                                     
                                              =
                                                         

The lower the ratio, the more the company is burdened by debt expense. When a company's
interest coverage ratio is 1.5 or lower, its ability to meet interest expenses may be questionable. An
interest coverage ratio below 1 indicates the company is not generating sufficient revenues to satisfy
interest expenses.

The Interest coverage ratio of the company is 1.88 times for the year 2008-09. And the trend for the
same is as follows:


                             Interest Cover Ratio
                            2.5


                          2.25


                                 2


                          1.75


                            1.5
                                     2008-09     2007-08        2006-07         2005-06     2004-05
            Interest Cover Ratio      1.88         2.29             2.3            2.23      2.11


Figure 30 Interest Cover Ratio

There has been steep fall in the coverage for the year 2008-09. This is mainly because of high
borrowings from the year 2007. And this borrowing has lead to high interest obligation.

Activity Ratios

Activity Ratios, as defined by Investopedia5 are, ‘Accounting ratios that measure a firm's ability to
convert different accounts within their balance sheets into cash or sales’.

Asset turnover ratios indicate of how efficiently the firm utilizes its assets. They sometimes are
referred to as efficiency ratios, asset utilization ratios, or asset management ratios. Three commonly
used asset turnover ratios are receivables turnover and inventory turnover and Fixed assets
Turnover ratio.


5
    http://www.investopedia.com/terms/a/activityratio.asp

       54
Analysis of Fixed and Floating Interest Rates 2010
Receivables Turnover Ratio
Receivables turnover is an indication of how quickly the firm collects its accounts receivables and is
defined as follows:

                                                                                     
                     =


The receivables turnover often is reported in terms of the number of days that credit sales remain in
accounts receivable before they are collected. This number is known as the collection period. It is
the accounts receivable balance divided by the average daily credit sales, calculated as follows:

                                                                                                365
                        =
                                                                            

The Receivables Turnover ratio and the collection period for the company for the year 2007-08 are
5.32 times and 68.6 days respectively. This implies that on average debtors are converted into cash
in approx 69 days.

Inventory Turnover Ratio
Another major asset turnover ratio is inventory turnover. It is the cost of goods sold in a time period
divided by the average inventory level during that period:

                                                                                             
                               =


The inventory turnover often is reported as the inventory period, which is the number of day’s
worth of inventory on hand, calculated by dividing the inventory by the average daily cost of goods
sold:

                                                                                      365
                                =
                                                                    

The Inventory turnover ratio and the inventory holding period for this company for the year 2007-08
are 24.09 times and 15.15 days respectively.


Fixed Asset Turnover Ratio
This ratio depicts the ability of the entity to convert its fixed assets into cash (Sales). A financial ratio
of net sales to fixed assets. The fixed-asset turnover ratio measures a company's ability to generate
net sales from fixed-asset investments - specifically property, plant and equipment (PP&E) - net of
depreciation. A higher fixed-asset turnover ratio shows that the company has been more effective in
using the investment in fixed assets to generate revenues. It is computed using the formula

                                                                                   
                             =
                                                                                               

     55
Analysis of Fixed and Floating Interest Rates 2010
The ratio for the year 2008-09 is 0.17 times. This is a very low figure, but since the firm is a capital
intensive and has projects which are of longer gestation, so this figure can be justified.

The trend in the above discussed ratios over the years is summarised in the following table

Turnover Ratios               2008-09     2007-08       2006-07     2005-06     2004-05
Receivables                        5.32         5.8           8.8         8.1        5.37
Collection Period             68.60902    62.93103      41.47727    45.06173     67.9702
Inventory                         24.09       21.34          19.7       17.26       13.19
Inventory Holding Period      15.15152    17.10403      18.52792    21.14716    27.67248
Fixed Assets                       0.17        0.14          0.13        0.13        0.12
Table 9 Turnover Ratios

Capital Market Behaviour

Since the shares of the company are listed on the stock exchanges and are also actively traded, it is
per se necessary to also analyse the behaviour of share prices. Some of the important ratios that can
be computed and analysed are P/E Multiple, Beta etc...

P/E Multiple
The P/E stands for Price to earnings Ratio. It signifies the relationship between the market price per
share and earnings per share. It can be computed using formula

                                                       
                                             / =
                                                       

The P/E of the firm as on 31st Dec 2009 was 21.80. This implies the investor is willing to pay Rs. 21.80
for 1 Re of current earning.

In general, a high P/E suggests that investors are expecting higher earnings growth in the future
compared to companies with a lower P/E. However, the P/E ratio doesn't tell us the whole story by
itself. It's usually more useful to compare the P/E ratios of one company to other companies in the
same industry, to the market in general or against the company's own historical P/E. It would not be
useful for investors using the P/E ratio as a basis for their investment to compare the P/E of a
technology company (high P/E) to a utility company (low P/E) as each industry has much different
growth prospects.

Over the years the P/E has been


     56
Analysis of Fixed and Floating Interest Rates 2010

                                                      P/E
      24.000
      23.000
      22.000
      21.000
               Sep-2008          Dec-2008      Mar-2009         Jun-2009        Sep-2009        Dec-2009

                   Sep-2008        Dec-2008     Mar-2009        Jun-2009     Sep-2009       Dec-2009
           P/E        23.124        22.654          22.861      23.611         23.085        21.807


Figure 31 P/E Ratio

Beta

Beta is a measure of the volatility, or systematic risk, of a security or a portfolio in comparison to the
market as a whole. Beta is used in the capital asset pricing model (CAPM), a model that calculates
the expected return of an asset based on its beta and expected market returns... It is also known as
beta coefficient.

Beta is calculated using regression analysis, and you can think of beta as the tendency of a security's
returns to respond to swings in the market. A beta of 1 indicates that the security's price will move
with the market. A beta of less than 1 means that the security will be less volatile than the market
and beta of greater than 1 indicates that the security's price will be more volatile than the market.

The result of regression for Sensex Returns and Power Grid Corporation of India Limited’s shares
returns from 8th October 2007 to 31st April 20106 is as follows:

SUMMARY OUTPUT

   Regression Statistics
Multiple R         0.664819
R Square           0.441985
Adjusted R         0.441074
Square
Standard Error     0.022539
Observations             615


                          Coefficients   Standard      t Stat    P-value    Lower 95%        Upper
                                           Error                                             95%
Intercept                   0.000388     0.000909     0.42683   0.669653       -0.0014     0.002173
Return-Market               0.839983     0.038121    22.03489   1.08E-79       0.76512     0.914845
Table 10 Regression Output


6
    The data has been uploaded on online appendix. Please refer the Appendix page

       57
Analysis of Fixed and Floating Interest Rates 2010
And the residual plot for the same is

                                                                                    y = 0.84x + 0.0004
                                             Residual Plot                              R² = 0.442

                                           0.25


                                            0.2


                                           0.15


                                            0.1


                                           0.05


                                              0
   -0.15            -0.1           -0.05           0   0.05          0.1          0.15          0.2
                                           -0.05


                                            -0.1


                                           -0.15


                                            -0.2

Figure 32 Residual Plot for Beta

From the above results we can see that The Company’s shares are Low beta at 0.84. This implies for
every 1 percent change in the market returns (here Sensex), the returns on shares of the company
will change by 0.84 percent in the same direction.

Also the R-Square, which is 0.442, implies the 44% variations in the share price are explained by the
known factors that are due to market variations. In simple words 44% of the variations are
explained.


     58
Analysis of Fixed and Floating Interest Rates 2010


        Chapter III
        Procedure of Bond
        Raising

                  Steps in Issuing Bonds
                  Dematerialisation
                  Listing Process
                  Debt Servicing


59
Analysis of Fixed and Floating Interest Rates 2010

Steps in Issuing Bonds

To understand the procedural aspects and legal aspects in raising bonds and also to have practical
exposure to actual raising process, a study of steps in issuing bonds is per se indispensible.

The need for funds is determined based on Cash flow projections of the year. The amount to be
financed by means of bonds is determined.

The process of raising funds though bonds start with:

Board Approval

A board meeting at beginning of the year is held where authority to raise loan by means of Bonds is
provided to the concerned person. The MoU between Ministry of power and PGCIL is also
considered. The Committee of Directors for Bonds is appointed and the authority with respect of
issuing of Bonds and all matters related to it are provided to the same by BoD. This is meeting is held
at the beginning of the financial year or at later date if needed.

Shortlist of Arrangers

The process of issue starts by selection of arrangers. The arrangers are similar to Merchant bankers
in the case of Bonds issue; they facilitate the process by bringing Investors for the issue. In Case of
PGCIL, the arrangers are selected based on Past records and their past participation. The arrangers
are selected based on their Rankings in PRIME Database. The rankings are allotted to the arrangers
based on their history of performance. The criteria for ranking is based on

             Amount Arranged in between a period
             % of Total issue being arranged by that particular Arranger
             No. of issues being participated by the arranger.

This data can be generated from the website http://www.primedatabase.com/ by creating League
Table of arrangers. It provides Ranks to the arrangers based on the period selected by the user. From
the results top 10 or top 5 or the number as required are shortlisted.

Meeting of Committee of Directors for Bonds for Engagement of Arrangers

The meeting with Committee of Directors of Bonds (will be referred as Committee henceforth) is
held with the purpose to appoint the arrangers... The following points are covered in the Minutes of
Meeting prepared for the purpose of meeting:

             Authority to raise loan of Amount Rs........, as approved by Board of Directors in the
              General meeting in one or many trenches.
             Approval that Committee may engage Merchant bankers of Power Grid IPO as
              Arrangers for this issue too
             Estimation of cash requirement and amount of Loan to be raised based on Cash
              Flows (Actual and Projections)


    60
Analysis of Fixed and Floating Interest Rates 2010
             Appointing the shortlisted arrangers and also addition of other arrangers or
              rejection of exiting from the list.

        Thus shortlisted arrangers are invited and were also asked to quote for Arrangers fees
            The Received quotes in sealed Envelope which is kept highly confidential and shall
               be opened by a committee which has:
                              One representation from Corporate Finance
                              One representation from Company Secretariat
                              One representation from Corporate Planning
            In case of any variation in fees, the arrangers are asked to match their fees with the
               fee quoted by L-1 bidder. (Here L-1 implies the arranger biding lowest rate)
            The arrangers fee (which is common for all arrangers) shall be charged on Amount
               allotted by the issue and can be shared among the Arrangers.
            The PGCIL proposes to appoint a minimum no. of Arrangers for each issue based on
               the requirement.
            The decisions on Appointment of arrangers, their fees etc shall be authorised by the
               Committee

Thus the above points are discussed by the committee. This Minute of Meeting is signed by
Committee of Directors for Bonds.

Invitation for Quote to selected Arrange rs

After the approval by the committee on the selection of arrangers, an invitation letter is sent to the
arrangers. Some of the important contents of the letter are

             The details on Issue Size, type of issue, type of debentures and proposed time of
              issue. In this case it was Issue of Non Convertible, Redeemable, Taxable, and
              Secured Bonds of PGCIL.... issue, the issue size being Rs..... Crores with a green shoe
              option. And the type of issue being private placement and the proposed time.......
             The arrangers shall be registered with SEBI
             Intimation of appointing them as arrangers for the issue and also requesting them to
              quote for the Arrangers fees as percentage (%).
             The address of Issuer to whom the quote letter/ acceptance letter shall be mailed or
              sent by courier in a closed envelope is also mentioned
             The deadline by which the letters shall be reached is also mentioned.
             The time of opening the letters was also mentioned.
             The invitation letter shall in no way construed as indication for appointment.

This letter is mailed to the shortlisted arrangers.

Letter of Acceptance with Quotes by the Arrangers

The arrangers after receiving the Letter of appointments reply back their acceptance and also their
quote for Arrangers fees on their Letter head. The received letters are then reviewed and based on
the quote for the arranger’s fees, the arrangers quoting lowest fees are selected, keeping the


    61
Analysis of Fixed and Floating Interest Rates 2010
number of arrangers up to the minimum number as permitted by the committee. In case if similar
bids are not received, the arrangers are asked to come in consensus with the L-1 bidder.

The reply letters along with the envelope is documented.

Recommendation of Bid Opening Committee

After the quotes are received, the envelopes are opened by the committee formed for this purpose
having 3 persons, one from Corporate Planning, Company Secretariat and Corporate Finance each.
The committee, based on the quotes for arranger’s fee as quoted by the arrangers, will recommend
the final arranger fee and also the selected arrangers.

These Recommendations are to be signed by the members of the Committee formed for opening
the Envelopes and also by The Committee of Directors of Bonds.

Letter of Appointment to the Arrangers

Based on the recommendations of the Bid Opening committee and henceforth approved by the
Committee, the letters of appointment is sent to each of the selected arranger. The letter usually has
following points:

             Intimation of appointing them as the arranger
             Also the names of co-arrangers
             The Arrangers Fee approved by the Committee
             Also a request to meet for the discussion on Issue Structure, Programme and Timing
              of the issue
             A request to reply back the acceptance by sending back the duplicate copy of the
              letter with duly acceptance.

Meeting with Arrangers

A meeting with the Arrangers is held at Power Grid Corporate office, Gurgaon to discuss the issue
structure, plan of issue, the discussion on timing, the Intrest rate, Cap and Floor rate, etc... . In this
meeting based on the Current G-Sec yield, Corporate Bonds yield and spread, Liquidity conditions in
market, RBI policies, Issues of other corporate and PSUs, etc... The arrangers suggest the interest
rate band depending upon the interest band as fixed by other PSUs whose issues are live in the
market. Usually the Cap rate is fixed and the floor rate is kept open to take advantage of market
condition.

Letter to Trustee

A letter is sent to the Trustee who can act as Trustee for the Bondholders of the present issue. The
letter has the details of the issue like security details, issue size etc... Also a request is made for
consent for acting as Trustee. A draft consent letter, which the Trustee shall reply back for
communicating the consent of approval, is attached with the letter. The Trustee is acting as IDBI


    62
Analysis of Fixed and Floating Interest Rates 2010
Trusteeship since XII issue of Bonds7. Though the same Trustee is appointed for every issue, but a
separate letter is to be sent for each issue.

Letter to Banker

A letter is sent to the proposed Banker who can act as Banker to the Issue. The letter has the details
of the issue like security details, issue size etc... Also a request is made for consent for acting as
Banker to the Issue. A draft consent letter, which the Banker shall reply back for communicating the
consent of approval, is attached with the letter. The Indian Overseas Bank acts as the banker to
issue.

Letter to Registrar and Transfer Agent (RTA)

A letter is sent to the Registrar who can act as Registrar for an issue. The letter has the details of the
issue like security details, issue size etc... Also a request is made for consent for acting as RTA. A
draft consent letter, which the Registrar shall reply back for communicating the consent of approval,
is attached with the letter. The RTA for Power Grid Corporation of India Limited Bonds is MCS Ltd.

Letter to Credit Rating Agencies

As per SEBI’s guidelines with respect to issue of debentures and also with respect to Disclosures, an
issuer must get credit rating from at least two credit rating agencies and shall also communicate the
rating in the Information memorandum. Thus a letter to Credit rating agencies is sent for
Revalidating the Credit rating which was assigned by the respective Credit rating Agency before. The
letter has the issue details, the details of the security, issue size, etc... The details of rating provided
at beginning of the year along with the loan amount are also shared (backed by the reference to the
letter no. and letter date). A request is made for the issue of fresh letter of credit rating.

The Power Grid Corporation of India Limited takes the rating from 3 agencies namely, ICRA, CARE
and CRISIL.

Letter from Trustee

A consent to act as Trustee, specifying the issue details is sent to BoD by the trustee. The content is
same as provided by issuer as draft letter. Trustee also authorises the issuer to forward the letter to
NSE or any stock exchange where bonds will be listed

Letters from Credit Rating Agencies

Revalidation letters from credit rating agency are received. The letter has reference to previous
letter from issuer. It also confirms the rating of the security to be issued. It has following conditions:

                 Rating specific to terms and conditions of the specific issue.
                 Any change shall be brought into notice of the rating agency.
                 Right to suspend, withdraw, or revise the rating at any time on the basis of new
                  information or unavailability of any information.
                 Rating should not be treated as recommendation to buy.

7
    Prior to this, Indian Overseas Bank acted as the Trustee

       63
Analysis of Fixed and Floating Interest Rates 2010
             Any information on delay/default in payment of interest shall be timely
              communicated.

The letter also has a condition that if the instrument rated is not issued within 10 months in case of
ICRA or 6 months in case of CARE and CRISIL, then the rating would stand withdrawn.

Letter from Banker

A consent to act as the Banker to issue, specifying the issue details is sent to BoD by the banker. The
content is same as provided by issuer as draft letter. Trustee also authorises the issuer to forward
the letter to NSE or any stock exchange where bonds will be listed.

Letter to Banker

After receiving the consent of acting as banker to issue, a letter is sent to banker is sent by the
issuer. The letter has details such as issue size, reference to the consent letter, and details of
payment specifications. The letter also mentions the proposed collection centres and a request is
made to inform the respective branch heads of the collection centre to make necessary
arrangements. A request for intimating the branch head to collect the cheques in high value clearing
zone is also made in the letter.

Declaration by Board of Directors

A declaration by the Directors undertaking that No statement made in Disclosure Document is
contrary to the provisions of Companies Act, 1956 or SEBI Act, 1992 or rules made there under or
guidelines/ Notification issued.

This declaration is signed by the Board of Directors. The Board consist of

               Chairman and Managing Director
               Director (Finance)
               Director (Operations)
               Director (Projects)

Request letter to NSE for in Principle Approval

After preparing the Draft Disclosure document, a request letter to National Stock Exchange for In
Principle Approval of getting the Bonds listed in WDM (Wholesale Debt market) of NSE. The letter
has following details

             The proposed date of issue
             The Issue Size, type of issue,
             Enclosures: Draft Disclosure Document and also a digital copy of the document in
              PDF format for the purpose of uploading the same on website
             Intimation of sending the final copy of Disclosure Document in due course time
             Undertaking that Disclosure Document being prepared in compliance with
              Notification dated 6th December 2008 issued by Securities Exchange Board of India
              (Issue and Listing of Debt Securities) regulations 2008.

    64
Analysis of Fixed and Floating Interest Rates 2010
             Undertaking that company will execute the new listing agreement with NSE after the
              allotment is done
             And finally a request for an In-Principle approval.

In-Principle Approval from NSE

The National Stock Exchange issues the In-principle Approval to PGCIL for the issue. The In-principle
approval is approval that the bonds may be listed on the exchange but it is a conditional approval
and not a commitment. Only on fulfilment of all compliances and conditions the bonds will be listed.

The letter has

             Intimation of Grant of In principle Approval with specifying Nature of Bonds, Face
              Value and Issue Size
             Also the conditions for Listing and provisions of Securities Exchange Board of India
              (Issue and Listing of Debt Securities) regulations 2008.

Draft- Disclosure Document

Covering Letter to Disclosure Document to Arrangers

A covering letter to Draft Disclosure Document is sent to the arrangers. Also Application forms and
Letter of commitment (Draft) is sent to the Investors. According to Sec 67 of Companies Act, not
more than 49 can participate in case of Private Placement. Thus only 49 application forms are
printed and 4 applications are sent to each arrangers and the rest are kept by Power Grid. These are
issued to the arrangers in case of further requirement.

Letters of Commitment

It is a Letter given by Investors to the Power Grid on their letter head. The draft of the same is
provided by the Power grid. This letter has an undertaking that a specific number of bonds shall be
applied by the Investor at a particular rate when the issue is made and bonds are allotted. It is an
irrevocable commitment. In the letter a commitment to invest number of bonds, minimum of 10
bonds and a multiple of 5 thereafter,

        @ Coupon Rate (it can be any rate between the spread i.e... Floor and Cap rate)
        @ rate higher than the coupon rate
                            OR
        @ Cut-Off rate

The letter also has an undertaking by Investors to pay for the bonds allotted in form of Cheque/
Demand draft (High Value Clearing) or RTGS

The Investors shall send their bids to the Power Grid by means of Fax or in person in between the
Issue open and Issue Closing time.

The offer cannot be revoked unless superseded by a subsequent letter from the investor before the
closing of the issue.


    65
Analysis of Fixed and Floating Interest Rates 2010
Book Building

For the purpose of determining a Cut-Off interest rate at which the bonds shall be issued, a Book
Building procedure is carried out. A work sheet with details of all the bids of investors is prepared.
The Worksheet has the following information:

               Date of Bid
               Name of the Investor
               Form No.
               Name of the Arranger
               Amount that will be invested at different rates
               Cut Off Rate
               Cap Rate
               Floor Rate
               Different rates within the spread
               Total Amount of Investment

While Recording the Bids, the same bid amount shall be recorded under all the interest rates at and
above the quoted rate by the investor. The rationale behind this is since he is ready to invest an
amount at a quoted rate; he will be ready to invest the same amount at a higher rate. For Instance, if
a firm X quoted for 30 Bonds i.e... Rs 45 Crs @ 8.7%, the amount Rs 45 Crs will be recorded under
the interest rates 8.7%, 8.78% and also 8.8%

Also if an investor quoted an amount under Cut-Off rate, the amount shall be recorded under all the
interest rates since he is indifferent to invest at any rate. For Instance a firm Y quoted 20 Bonds i.e...
Rs 30 Crs at Cut-Off rate, then the amount Rs 30 Crs shall be recorded under all the interest rates
i.e... 8.6%, 8.65%, 8.7%, 8.78% and 8.8%.

In case of a revised bid, the previous bid is stroked off and the new offer is recorded.

The rate under which the maximum amount is being invested is apportioned as Cut-off rate. This is
the rate at which the bonds will be issued.

In case if the issue is over-subscribed i.e... Exceed the limits then the allotment is bone in the
following order:

               Full allotment to the Investor quoted lowest coupon rate
               The investors quoting at the Cut-Off rate
               For investors investing at a same coupon rate, earlier bid will be allotted first
               In case of a tie with respect to coupon rate and also the date of bid, the allotment is
                done pro-rata basis.

Agenda for Meeting of Committee of Directors for Bonds

After determining the cut-off rate and list of investors, the Committee of Directors for Bonds meets.
Following points are to be discussed in the meeting.

             Details of the arranger’s fee

    66
Analysis of Fixed and Floating Interest Rates 2010
                   Names of the Arrangers
                   Summary of the Investors and their Investments
                   Summary of proposed Allotment
                   Also decision on form of allotment. Here it is done in D-Mat (electronic Mode)

Letters to Arrangers

After the allotment is approved by the Committee, a letter to all the arrangers is sent. It has

                Information on Applications
                Allotment Details
                Requesting them to intimate their investors for filling and submitting application
                 along with the application money.
                Also the payment details like payment shall be made by Cheque/demand drafts or
                 RTGS by the.......... (Deadline date)
                The cheques/ DDs shall be of High value clearing
                Also the Account details and IFSC Code of Banker to Issue is communicated for the
                 purpose of RTGS payment. The account details are “Power Grid Corporation of India
                 Ltd. C.A. No. 1408 Bonds XXX-Issue”8 and IFSC Code of Banker to Issue, here, Indian
                 Overseas Bank, and Parliament Road, New Delhi is IOBA0000762
                Also the Annexure of list of investors along with the allotment details is
                 communicated
                The report of facsimile sent to the Arrangers is also documented.

Letters to Investors

An intimation letter to each investor to whom the allotment is done is sent. Also request is made to
send their application forms along with the Application money. It has details on Allotment, the Cut-
Off rate of Interest, Payment details, the last date for payment etc... In case if an Investor makes
payment by means of RTGS, only the application letter can be sent to Power Grids Office through the
arrangers. This letter is Carbon Copied to the respective arrangers of the Investors.

Details from Banker to Issue

After the pay-in date i.e... Last date for payment of application, the banker to issue communicates
the receipts of funds with specific to the issue. It provides details of Funds received Towards the
Issue Account along with the date of receipt.

Final Allotment Meeting

The agenda for this meeting is:

                   Details of the allotment
                   Details on Mutual funds participated
                   Any material issue
                   List of the Investors with the allotment details

8
    The name of account for each bond series differs

       67
Analysis of Fixed and Floating Interest Rates 2010

Dematerialization Process

As per SEBI Guidelines all the securities in form of equity or debt shall be issued only in De-Mat (read
dematerialised) form. Thus it is per se indispensable to understand the process of dematerializing
i.e...converting the securities into electronic form.

The process starts by:

Tri-Partite Agreement between Depository, Issuer and RTA

A Tri-Partite agreement between each depository and RTA and issuer is entered before an issue.
Once signed agreement will; be valid for all the issues unless any change in Terms or change in the
party or any new regulations is made. Two agreements each with NSDL and CDSL are made. The RTA
(Registrar and Transfer Agent) is MCS services.

Letter to NSDL and CDSL

A letter is sent to the depository, here, National Securities Depository Limited (NSDL) and CDSL
(Central Depository Services Limited) with a request to allot ISIN (International Securities
Identification Number), an unique identification number, for the securities to be issued. The Details
of STRPPs are also communicated since each STRPP has different maturity period and thus will have
different ISIN code. The Pay-In date and also the deemed date of allotment is mentioned. This
communication is mailed before the closing of books. The MCF (Master file Creation Form) for the
purpose of allotment of ISIN code is also attached. Intimation that the Corporate Action file shall be
sent separately is also made. A true copy of extract of resolution approved by the Committee of
Directors for Bonds is also attached.

The ISIN code is a 12 digit Alpha-Numeric code. The first three characters are alphabets which
represent the Nation of Origin (for Indian securities it is INE), the next five characters are issuer
specific (like 752E0 for Power Grid and 002A0 for Reliance Industries) and the last four are specific to
characteristics of security like Equity, Secured Debentures, and Maturity etc...

The MCF file has details like Name of the Entity (issuer), contact details, security details, debenture
trustee details, type of placement, issue size, stock exchange details, registrar details etc…

Some of the attachments along with the letters are:

               Articles of Association of the firm
               Memorandum of Association
               Certificate of Incorporation and Certificate of Commencement
               Audited Accounts of last three years
               Trust deed
               Offer Document (Disclosure Document)
               In-Principal approval for Listing from NSE
               Copy of board resolution


    68
Analysis of Fixed and Floating Interest Rates 2010
Corporate Action

A request is made to execute the corporate action to the credit the following securities to the
accounts in NSDL. The details provided are ISIN of securities, Allotment date, Security description,
face value per security, and Distinctive number. Since no security is being issued in physical form
there will not be any distinctive number...

Also allotment details like number of securities and number of records with NSDL, CDSL and Physical
form are also shared.

Undertaking that all the necessary approvals have been obtained is also mentioned. The resolution
by the Committee and ISIN wise details of securities is enclosed along with the letter.

Letters from NSDL and CDSL

Reply letters from both the depositories are received. It communicates that as per the Corporate
Action executed, the details of Bonds credited/debited on the systems. The details like ISIN, ISIN
Description, Records, Quantity, and Execution date are communicated to the issuer. The records are
number of distinct entities holding the security.

Details of Demat Allotment

The allotment details of the issue are prepared by the issuer for the purpose of records. Details like:

               ISIN
               Name of the Investor
               Details of Security (STRPP wise)
               Date of allotment
               Date of Maturity
               DP name
               DP Id
               Client Id
               No. of STRPPs of that particular STRPP (A-L)
               Total amount for that particular STRPP (i.e...Rs. 12.5 lacs X No. of STRPPs)
               House/ Non House (House implies Investor and the DP are same)


    69
Analysis of Fixed and Floating Interest Rates 2010

Listing Process

All the bonds issued by the company are listed with NSE under WDM segment. Since the bonds can
be listed only after they are issued and allotted to the investors, they are issued as proposed to be
listed to the investors.

The short summary of listing process is as follows:

               Approval for Listing Agreement with NSE from Board
               Listing Agreement with PGCIL and NSE
               Letter to NSE (Undertaking)
               Letter to NSE (Fees details)
               Letter from NSE (Intimation of Listing)
               Letter to NSE (Covering letter for Trust Deed)


The process of Listing starts with the In-Principle Approval from NSE taken before issuing the bonds.
The In-principle approval signifies that the bonds shall be listed after they are allotted on an
condition that, all the procedurals, policies and guidelines are followed.

After the shares are allotted, approval is taken from the Board for the [purpose of creating a listing
agreement with NSE. The Listing Agreement is signed on a stamp paper. It has all the clauses,
undertakings and policies with respect to the listing guidelines as mentioned by SEBI. This agreement
is to be signed by The Board and also by the company secretary.

After the listing agreement is signed, this agreement along with the application form, the company
contact details, the details of Bond structure and also the STRPP details are to be attached.

A checklist is provided by the NSE, to ensure that all the formalities have been furnished and also all
the required documents are attached with the application form.

Along with the Listing agreement and the application form, a separate letter is sent to NSE stating
that:

       Undertaking that all the guidelines as issued by SEBI (Issues and Listing of Debt Securities),
        Regulations, 2008, provisions of Companies Act, 1956 have been followed.
       Undertaking that Trust deed has not yet been executed and shall submit the true copy as
        soon as it is done.
       Also an undertaking that the Offer document has been prepared as per SEBI ( Issues and
        Listing of Debt Securities), Regulations, 2008

Apart from the above documents, a separate letter is sent to NSE regarding the Fee details. The
letter has the details of the previous listings of PGCIL Bonds, details of present listing along with the
maturity value, date of allotment etc... And since the fees is paid at the maximum cap of Rs. 7.5 Lakh
in advance, no further fees is needed to be paid for the present listing. Also a request is made to list
the present issue of bonds at WDM segment.

    70
Analysis of Fixed and Floating Interest Rates 2010
After, all the documents are submitted to NSE and all the formalities are fulfilled; an Intimation
letter from NSE is received stating that, the securities as specified in the agreement are duly listed
on WDM segment with effect from a date as mentioned.

After this the bonds are listed on the WDM segment of NSE and the investors are allowed to trade.
And NSE provides the monthly statistics of for daily price and the volume.

But after the trust deed is executed, a covering letter along with the Trust deed is sent to the NSE.


    71
Analysis of Fixed and Floating Interest Rates 2010

Debt Servicing

The bonds are issued with a specific payment structure pre defined at the time of issue and
mentioned in the offer document/ information memorandum. For instance a bond may be issued
with the structure as Intrest paid half yearly with 3 years moratorium and 10 equal instalments. In
this case the Bond is divided into 10 STRPPs (Separately Transferable Redeemable Principal parts)
redeemable each year after 3 years of the issue. And the interest is paid on every 6 months on the
amount outstanding.

Also the interest payment and redemption date are also pre determined. Usually both the dates are
kept as the date on which the bonds are issued. The issue date of the bond series becomes its Intrest
and principal payment date.

By and large, the company issues its bonds with following structure:

               3 year moratorium period + 10 equal instalments
               1 year moratorium + 5 equal instalment
               4 year moratorium + 12 equal instalments
               5 years moratorium + 10 equal instalment

As on 31st of March, 2010, the total number of Bonds outstanding was 26, from series No.VI to XXXI,
(excluding the series no. VII), which is redeemed.

Thus the company has regular interest payments and principal payments scheduled over the year
depending upon the issue date. (The details of each bond along with the coupon rate, payment
structure and payment date has been made available in online appendix)

Before understanding the process, some of the terms need to be mentioned

Record Date

The bonds of the company are listed on NSE- WDM (Wholesale Debt market) Segment and are
traded. Thus the holding changes after every trade. For the purpose of payment of interest and
redemption of STRPPs, the book of transfers is closed a month before the scheduled interest
payment date. And the BO position as on the record date is considered and the interest is paid to
the holder on or before the Record date.

BO Position

The Beneficiary Owner position is the list of beneficial owners to whom the interest is to be paid. It
may or may not be the list of actual owner. For instance a person holding the security on record date
will be included in the BO position statement though he sells it after the record date. This position is
provided by the registrar to the company on record date of each issue.


    72
Analysis of Fixed and Floating Interest Rates 2010
Registrar

Registrar and Transfer agent is the party who records all the transfers took place. He is expected to
maintain a register of holders of each Bond along with the STRPP details and should update the
register after every transfer taking place. He is also required to provide the BO Position statement
whenever company asks for it.

Demat and Physical Holding

SEBI has necessitated that, all the issues of fresh equity and debentures must be in Demat Form. The
Demat (Dematerialised) implies in digital form instead of physical form. In this case the bonds are
traded electronically through the route of depositories. But the initial issues of bonds till XII issue,
the bonds were issued in Physical form i.e... In form of Physical Bond certificates. In this case the
transfers take place at individual level and the information is provided to the Registrar by either of
the investor.

Depository

Depository as the name signifies, it acts as the depository of the physical certificates of the
dematerialised securities. It is reservoir of the physical securities and issues dematerialised securities
replacing the physical form. And also it acts as the central body for transferring the securities into
different accounts based on the trading takes place. In India the two central depositories are
National Securities Depository Limited (NSDL) and Central Depository Services (India) Limited (CDSL).

Depository Participant (DP)

Depository Participant is similar to a commercial bank, if the Depository is regarded as Central bank.
It acts as the middleman between the investor and the central depository. It facilitates the trades of
his clients and holds his securities in Demat form on his behalf and maintains an account. The DPs
can be commercial banks, private brokers, Broker institutes etc... Some of the DPs in India are ICICI
Bank, Religare Securities, Motilal Oswal Securities Ltd., and Anand Rathi etc...

DP ID

The DP ID is the unique identification of each Depository participant. As similar to Bank code
required for a banking transaction, DP ID is requisite for any transaction in securities in Demat form.

Client ID

As mentioned before, each DP has clients. These clients are normal investors including individuals,
corporations and associations etc... The client ID is unique account number for the Demat account of
each client. This number is required for transferring securities in the clients account.

IFSC Code

The IFSC code stands for Indian Financial System Code. It is a unique code for each financial
institution in India. It is an 11 digit code, of which the first 4 represents bank code; the fifth character
is at present ‘0’ for all, which may be changed for further codes. The next 6 characters represent the


    73
Analysis of Fixed and Floating Interest Rates 2010
Branch code. This unique code is used for reference of each branch of a bank. It is used for purpose
of Fund transfers in case of RTGS payment.

RTGS and NEFT

RTGS stands for Real Time Gross Settlement. The funds between banks can be transferred by way of
NEFT (National Electronic Fund Transfer) or RTGS. In case of NEFT, there is limitation in way of
transfer of funds. NEFT settlement takes place 6 times a day during the week days (9.30 am, 10.30
am, 12.00 noon. 1.00 pm, 3.00 pm and 4.00 pm) and 3 times during Saturdays (9.30 am, 10.30 am
and 12.00 noon). Any transaction initiated after a designated settlement time would have to wait till
the next designated settlement time.

RTGS system is a funds transfer mechanism where transfer of money takes place from one bank to
another on a "real time" and on "gross" basis. This is the fastest possible money transfer system
through the banking channel. Settlement in "real time" means payment transaction is not subjected
to any waiting period. The transactions are settled as soon as they are processed. "Gross settlement"
means the transaction is settled on one to one basis without bunching with any other transaction.
Considering that money transfer takes place in the books of the Reserve Bank of India, the payment
is taken as final and irrevocable. But in case of RTGS, the funds are transferred on Gross basis, i.e...
Funds are transferred as soon as the fund is received. But RTGS can be used only in case if amount
exceeds Rs. 1 lakh.

PAN

PAN stands for Permanent Account Number. It is unique code allotted by Central Board of Direct
Taxes (CBDT) for each tax payer. According to CBDT, the PAN number should be disclosed for all the
transactions exceeding Rs. 50,000. PAN is a 10 digit code of which the first five are Alpha, the next
four are Numerical and the last is an alphabet. And of these, the fourth character represents the
type of assessee. According to Income Tax Act 1961 Assessee is a' as a person by whom any tax or
any other sum of money is payable under this Act, and includes - Company (C), Association of person
(A), Person (P), HUF (H), Trust (T), Government (G). And the fifth character can be the last name of
the surname in case of person or the first name of the entity in case of company or association or
rest.

UTR No.

UTR stands for Unique Transaction Reference number. It is generated in case of a RTGS Transaction.
It is a 16 digit unique code used for future reference of any NEFT/ RTGS Transaction.


After understanding the above discussed terms, the Debt Servicing process can be understood
easily. The process of debt servicing starts with:

Master RTGS File

A Master RTGS file is maintained by the company which has details of all the investors of all the
bonds. It includes the details of all the previous as well as current investors. And the data required

    74
Analysis of Fixed and Floating Interest Rates 2010
for payment of interest like IFSC code, Account No. etc are taken from this file. The file has details
like:

Index No. : Unique no. for each investor for easy reference
Name of the Investor or Beneficiary
Bank name
IFSC code of the Bank Branch
Branch Name
Account Number of the Investor
MICR code
Contact person and his email and phone number
PAN Number
DP ID and
Client ID


BO position from RTA

After the record date of each issue, the BO position of that issue is requested from RTA. For Instance
for the issue XXV, whose interest payment is due on 12th June, the BO Position is asked from the RTA
in month of May. The BO position for Demat is provided in a digital copy and for the physical holding
(Remat) the statement is provided in a physical format. The details like DP Id, Client ID, name of the
Investor and his holdings are provided in the BO Position.

Checking the Availability of Details if the Beneficiary

After receiving the names of beneficial owners to whom the interest is to be remitted, the required
details for remitting the amount like IFSC code, Account Number, Bank and its Branch etc... are to be
gathered. For this purpose, first the Master RTGS file is referred to collect the data.

Call for Details

In case if the details of the BO are not available in the Master RTGS file, then in that case, a letter or
email is sent to the BOs asking for the details like Bank Name, Branch name, IFSC Code, Client ID, DP
ID, Account Number, PAN, Contact person and his contact number and email, etc...

The received details in reply from the BOs are indexed and the Master RTGS file is updated. In some
cases even after the letter or email, the BO does not respond, thus calls are to be made to them to
get the details.

List of Beneficiaries is sent to Bank

The list of beneficiaries to whom the interest and principal repayment is given to the banker with the
details required for RTGS or payment through cheque. The amount to be paid is also mentioned and
a cheque for the lump sum amount is given to the banker. The banker takes the responsibility of
remitting the funds to individuals as per the list given to it. IDBI bank acts as the banker for remitting
the funds.


    75
Analysis of Fixed and Floating Interest Rates 2010
The company directs the Bank to remit the funds mostly by RTGS because it is most economical
method and also the safest and quickest mode of transfer. And also since most of the cases the
payment exceeds rs.1 lakh making the RTGS possible. Sometimes even NEFT mode is also used.

In case if the Beneficiaries Branch does not have RTGS facility or if he is unable to provide IFSC
details and wishes to receive the amount by cheque, post dated cheques are sent to such investors.

Payment Details from Banker

After the payment is made, the Bank provides the payment details for each issue separately under
RTGS and through cheque. It provides details like UTR No., Amount, Instrument status as in whether
the schedule has been generated or not, and Beneficiary description, beneficiary’s Bank and branch,
IFSC code etc... in case of RTGS payment.And in case if payment is made through cheques, the
details like Beneficiary name, Instrument Number ( the cheque number), Instrument amount,
Instrument date, Instrument status and liquidation date. The status may be paid or Unpaid
depending upon the encashment of the cheque. The status remains unpaid till the cheque is
presented for payment by the beneficiary’s bank or till the cheque is expired.

Reconciliation

After the details of payment are received, the Bonds department reconciles the total payment
through RTGS route and by Cheques mode with the total amount of cheque given to the bank for
the purpose.

In case of deviation, the entries are reconciled with the BO list provided to the bank.

In case of Single Investor

The Power Grid Corporation of India Limited issues its bonds by route of Private Placement. Thus
sometimes, the whole issue size is mobilised by single investor and usually it is Life Insurance
Corporation of India Limited (LIC). In this case since the interest and principal of that specific issue is
to be paid to the single party, the payment is made by the company itself and this job is not done
through the IDBI bank. The payment is made to it by RTGS. For instance in case of XVIII, XX and XXIV
issue, the sole investor is LIC, thus the payment is made to it directly.


    76
Analysis of Fixed and Floating Interest Rates 2010


     Chapter IV
     Characteristics of
     Bonds
                 Yield
                 Duration
                 Convexity
                 Yield of PSU and GSec Bonds
                 Duration of PSU and GSec Bonds
                 Convexity of PSU and GSec Bonds


77
Analysis of Fixed and Floating Interest Rates 2010

Yield or IRR

The yield on any investment is the interest rate that will make the present value of the cash flows
from the investment equal to the present value (i.e... the price an investor pays to buy the
investment). Mathematically the yield cab be computed as

                               1      2        3              
                        =          +          2
                                                  +          3
                                                               + ……..+
                              1 +    (1 + )     (1 + )           (1 + )

Here P= Present value
    CF= Cash Flows (Intrest as well as principal for each year)
    y = IRR/ Yield to Maturity
    N = Tenure

There are different measures for the yield commonly quoted by the dealers and used by the
portfolio managers. Some of the Conventional measures are

Current Yield
As the name signifies it is the yield for the current period. It relates the annual cash flow to the
current market price. But here only Intrest receipt is considered and the other gains which affects
the yield like capital gain, discount price etc are ignored. The time value of money is also ignored.
Thus

                                                                
                                  =
                                                                      

This measure is commonly used by short term investors and also more suitable for short tenure
bonds.

Yield to Maturity
Yield to maturity is also the IRR of the future Cash Inflows as discussed before. Unlike the Current
yield, here all the gains in form of Intrest as well as Capital redemption are considered. Also the Time
value of money is considered. The formula for the same is

                                                                     
                =          +         2
                                         +         3
                                                     + ……..+         
                                                                        +
                      1 +    (1 + )    (1 + )          (1 + )     (1 + )

Here P= Price the Investor paid to get the Investment
    C= Coupon Payment (half yearly or annual)
    M = Principal Payment (Maturity value)
    N= Number of Periods (Tenure X frequency)

Annualised Yield
In the above formula the payments may be annual or half yearly or even monthly. Thus the yield
obtained using above formula needs to be annualised if the payments are not on annual basis. Thus
the formula for the same is


    78
Analysis of Fixed and Floating Interest Rates 2010
                                            = (1 +   ) − 1

Here Y= Annualised Yield
     m= Frequency of payments (2 for half yearly and 12 for Monthly)

Yield to Call / Put
The bonds may be issued with the option of Call or Put. In case of option with Call, the issuer has the
right to call back the bond and pre-pay the amount after a predetermined period. The issuer uses
this option in case of availability of alternative sources of cheaper funds. The investor is under
obligation to sell the bonds if the issuer exercises the option.

Similarly the Bonds can be issued with the Put Option where the Investor is given right to sell the
Bonds i.e... Put the bonds to the issuer at any time after a predetermined period. The investor uses
this option in case if he has more profitable avenues to invest when compared to the bonds.

Thus the Yield is computed for different options like Yield to First call (for the bonds which are not
presently callable), Yield to next call (for the bonds which are currently callable), Yield to Refunding,
etc.... Yield to Worst is the lowest yield rate of every possible call and put date.

Price- Yield Relationship


A Fundamental property of a bond is that the price changes in the opposite direction from the
change in yield. The reason or the justification for the same could be, the present price is discounted
future cash flow of the bond and the discount rate being used is the required yield. In case of
increase in the yield i.e... The discount rate increases and leads to the fall in the present value of the
future cash flows which leads o fall in the price and vice versa.


    79
Analysis of Fixed and Floating Interest Rates 2010

Duration

A bond's maturity measures the time to receipt of the final principal repayment and, therefore, the
length of time the bondholder is exposed to the risk that interest rates will increase and devalue the
remaining cash flows. Although it is typically the case that, the longer a bond's maturity, the more
sensitive its price is to changes in interest rates, this relationship does not always hold. Maturity is an
inadequate measure of the sensitivity of a bond's price to changes in interest rates, because it
ignores the effects of coupon payments and prepayment of principal.

Duration is the measure for the sensitivity of the Bonds. As discussed before there is a negative
relationship between yield and price. A change in yield would lead to a change in price. Thus the
duration measures the impact of change in yield on change in price.

Macaulay’s Duration
Dr. Fedrick Macaulay has coined this term and used this measure rather than a maturity as a proxy
for the average length of the time that a bond investment is outstanding. Macaulay recognized this
distinction and determined that the time to receipt of each cash flow should be weighted, not by the
relative magnitude of the cash flow, but by the present value of its relative magnitude. Macaulay's
duration, therefore, equals the average time to receipt of a bond's cash flows, in which each cash
flow's time to receipt is weighted by its present value as a percentage of the total present value of
all the cash flows. The sum of the present values of all the cash flows, of course, equals the price of
the bond. The formula for the same is

                                                 1      2                       
                                                      +          + …….+          + (1 + )
                                                1 +  (1 + )2        (1 + )
              =
                                                                    

Here C= Coupon Inflows
     y = IRR/ Yield
    M= Maturity Amount (Redemption Amount)
    n= Number of Periods
    P= Price

Modified Duration
The ratio of Macaulay’s Duration to (1+yield) is commonly termed as Modified Duration. The
Modified duration is the approximate percentage change in price for a given change in yield.
Although Macaulay conceived of duration as a measure of the effective life of a bond, it can be
modified to measure the sensitivity of a bond's price to changes in the yield to maturity. The
modification simply requires dividing Macaulay's duration by the quantity one plus the yield to
maturity,
                                                              ′  
                           =
                                                                         (1 + )


    80
Analysis of Fixed and Floating Interest Rates 2010

Convexity

The duration is the measure of volatility. But it depicts a linear relationship between the Price and
yield. But in reality it is not a case. The relationship between Yield and the price may not be linear
and it could be collinear. Thus the Convexity is the second derivative measure of relationship
between [rice and the yield.

In finance, convexity is a measure of the sensitivity of the duration of a bond to changes in interest
rates. There is an inverse relationship between convexity and sensitivity - in general, the higher the
convexity, the less sensitive the bond price is to interest rate shifts, the lower the convexity, the
more sensitive it is.

As discussed before Duration is a linear measure or 1st derivative of how the price of a bond
changes in response to interest rate changes. As interest rates change, the price is not likely to
change linearly, but instead it would change over some curved function of interest rates. The more
curved the price function of the bond is, the more inaccurate duration is as a measure of the interest
rate sensitivity.

Convexity is a measure of the curvature or 2nd derivative of how the price of a bond varies with
interest rate, i.e. how the duration of a bond changes as the interest rate changes. Specifically, one
assumes that the interest rate is constant across the life of the bond and that changes in interest
rates occur evenly. Using these assumptions, duration can be formulated as the first derivative of
the price function of the bond with respect to the interest rate in question. Then the convexity
would be the second derivative of the price function with respect to the interest rate.

The formula for computing the convexity is

                                                        + 1 
                                                       1 +  +2
                                =                  /2
                                                           100


Here t= Time period No.
     CF= Cash Flow (Interest and Principal)
     r = Yield
    m= Frequency of Debt Servicing


In actual markets the assumption of constant interest rates and even changes is not correct, and
more complex models are needed to actually price bonds. However, these simplifying assumptions
allow one to quickly and easily calculate factors which describe the sensitivity of the bond prices to
interest rate changes.


    81
Analysis of Fixed and Floating Interest Rates 2010

Yield of PSU and GSec Bonds

Bonds have become a very important source of long term funds for Government of India (Both
Central and State Government) and also the corporations including private sector and also public
sector. Different issuers have different structure of their bond with different repayment structure,
differing interest rates and different terms. For Instance the GSec (acronym for the securities issued
by Government of India through Reserve Bank of India) is repaid at the end of tenure where as
bonds of Power Grid Corporation of India Limited are repaid in 12 equal instalments. Also the
frequency of Intrest payment would differ and they may be quarterly, half yearly or even annual.
Thus it is per se necessary to compute yields and other parameters of different bonds.

Selection of Bonds
For the purpose of study all the bonds which are issued by the Power Grid Corporation of India
Limited till date and are yet to be redeemed are considered. Apart from this two bonds of the Power
Finance Corporation which have similar issue and redemption date with that of two Power Grid
Corporation of India Limited’s bonds and also two GSec bonds having similar Maturity to that of the
two selected PFC Bonds are selected.

The summary of the bonds selected is

Bond              Date of Issue     Tenure Average Redemption Duration to              Coupon Present
Description                                Tenure Date        Maturity (               Rate   Value ( Rs.
                                                              Yrs)                            Crores)
PGXIII            31.07.2002             15          9   31-7-2017      7.333333333      8.63%        1.133466
PGXIV             17.07.2003             12          7   17-7-2015      5.297222222      6.10%        0.705981
PGXV              23.02.2004             15          9   23-2-2019      8.897222222      6.68%        1.139539
PGXVI             18.02.2005             13          8   18-2-2018      7.883333333      7.10%        1.122116
PGXVII            22.09.2005             13          8   22-9-2018      8.477777778      7.39%         1.27544
PGXVIII           09.03.2006             15          9   09-3-2021      10.94166667      8.15%            1.375
PGXIX             24.07.2006             15          9   24-7-2021      11.31666667      9.25%       1.4997551
PGXX              07.09.2006             15          9   07-9-2021      11.43611111      8.93%              1.5
PGXXI             11.10.2006             15          9   11-10-2021     11.53055556      8.73%       1.5046713
PGXXII            07.12.2006             15          9   07-12-2021     11.68611111      8.68%        1.494723
PGXXIII           09.02.2007             15          9   09-2-2022      11.85833333      9.25%              1.5
PGXXIV            26.03.2007             15          9   26-3-2022      11.98888889      9.95%              1.5
PGXXV             12.06.2007             15          9   12-6-2022              12.2    10.10%       1.4917073
PGXXVI            07.03.2008             15          9   07-3-2023      12.93611111      9.30%              1.5
PGXXVII           31.03.2008             15          9   31-3-2023                13     9.47%       1.5065713
PGXXVIII          15.12.2008             15          9   15-12-2023     13.70833333      9.33%        1.568498
PGXXIX            12.03.2009             15          9   12-3-2024             13.95     9.20%        1.535168
PGXXX             29.09.2009             15          9   29-9-2024      14.49722222      8.80%        1.517222
PGXXXI            25.02.2010             15          9   25-2-2025      14.90277778      8.90%        1.507589
PGXXXII           29.03.2010             15          9   29-3-2025      14.99722222      8.84%              1.5


    82
Analysis of Fixed and Floating Interest Rates 2010
PFC ( S-57)           07-08-2009              15          10 07-08-2024          14.35277778        8.60%        99.43469
PFC 8.85%             31-05-2006              15          10 31-05-2021          11.16666667        8.85%         100.089
2021(S-XXVIII)
GOI LOAN              30-05-2001              15          15 30-05-2021          11.16666667       10.25%         115.259
10.25% 2021
GOI LOAN              15-09-2009              15          15 15-09-2024          14.45833333        8.20%             999
8.20% 2024 OIL
BOND
Table 11 List of Bonds selected for Study

Bond Description: The PG implies bonds issued by Power Grid Corporation of India Limited and the
subsequent roman number implies the series number of the bond. Each bond issue is numbered and
given an identification nomenclature. For Power Grid Corporation of India Limited till date it has
issued 32 bond series. Similarly for Power Finance two bonds of 28th series and 57th series are
selected. And the last two entries are the bond issued by Central Government of India.

Date of Issue: This date is relevant to compute the tenure, average tenure and also all the payments
of interest and capital redemption are made with reference to the date of issue.

Tenure: The tenure is the absolute number of years between the issue date and the redemption
date. It is the period for which the bond will remain active and servicing of debt needs to be done.

Average Tenure: Bonds may be issued with a moratorium period followed by Instalment payment.
For example the Power Grid Corporation of India Limited issues bonds with the moratorium period
of 4 years and followed by 12 equal annual instalments. Thus in this case, for the initial 3 years only
interest will be paid and from the year 4 onwards along with the interest the 12 th part of loan
amount will be repaid. Thus the average tenure will be 3 years + 12/2 years i.e... 9 years. And in case
of Power Finance’s Bond Series 5710, the repayment is done in 3 equal 5 yearly instalments. Thus
though the tenure is 15 years, the average tenure will be 10 years And in case of G-Sec the amount
is repaid at end of tenure thus the tenure and average tenure will be same.

Redemption Date: As the name clearly signifies it is the date on which the whole principal
outstanding is to be redeemed. This date is useful in computing the Years to Maturity.

Duration to Maturity: Duration to maturity implies number of years remained for the bond to
mature. It is just a gap between Today’s date and the maturity date. This figure is relevant for the
investor as he can know the period for which the bond is to be held. Also the volatility and sensitivity
is the function of years remained for maturity.

Coupon Rate: The coupon rate is the rate of Intrest the issuer pays on the face value of the
outstanding bond. This coupon rate may be determine by the issuer or is determined by the Book
Building process. It is one of the important parameter in determining the yield, duration and
convexity.


9
  The Present value is the Index value as published by NSE in its Monthly Trade history. In this case the face
value has been taken as 100.
10
   Source: The Information memorandum published for before the specific issue of PFC,

     83
Analysis of Fixed and Floating Interest Rates 2010
Present Value: The present value is last traded price of the bond. Though the bond market is not
much developed in India, the trading of these bonds takes place in Wholesale Debt Market (WDM)
of NSE. And the bonds issued by Power Grid Corporation of India Limited are in form of 12 STRPPs
(Separately Tradable Redeemable Principal Parts) which have different maturity period since one
STRPP is redeemable every year after the moratorium period. Also the trading takes place differently
for each STRPP. And since the cost of each Bond is Rs. 1.5 Crores, the value of each STRPP will be Rs.
12.5 lakh. Similarly in case of Bonds of Power Finance, the Bond consists of 3 STRPPs redeemable
every 5 years. The assumptions and process of computation of present values is as follows:

        From the data available at NSE website11, the present value of each STRPP was taken
        Average of all the outstanding STRPPs of each bond was computed. For Instance the bond
         PGXIV has 6 STRPPs outstanding, thus the average of the 6 is considered as the present
         value
        In case if any STRPP is not traded, the present value is taken as 100. The NSE has the
         practice of publishing Indexed present value. Since Bonds have different face values ranging
         from Rs 10 lakh to Rs.2 Crores, the values is published with the base as 100. Thus the
         Present value of 99 implies the value is down by 1% from its actual face value and vice versa
         for the case of 101.
        In case of Power Grid Corporation of India Limited Bonds the index value is multiplied with
         the face value of the partial bond i.e... (Sum of Face values of the outstanding STRPPs). For
         Instance for PGXVI series the face value of Bonds was Rs. 1.5 Crores with 10 STRPPs thus the
         face value of each STRPP is Rs 15 Lakh. As on 31st March 2010, the no. of STRPPs
         outstanding is 8. Thus the Index value was multiplied by Rs. 1.2 Crores i.e... 8X15 Lakh.

Computation of Yield to Maturity
For computing the Yield to Maturity all the future cash flows need to be forecasted. Since the
coupon rate is predetermined and also the redemption schedule is predefined, the cash flows can be
determined easily. In case of Floating rate, since there is uncertainty on the rate of interest,
estimation of margin needs to be done.

Following is the computation of Yield for the bond PGXXXI, which has 4 years Moratorium period
with 12 equal instalments to be annually at a coupon rate of 8.90%. The table of future cash flows
and the present value as on 31st March 2010 is used to compute IRR (Yield to maturity).

Year           Interest    Principal Opening Total
                                     Balance Payments

       2010           0            0          0    -1.50759
       2011      0.1335            0        1.5      0.1335
       2012      0.1335            0        1.5      0.1335
       2013      0.1335            0        1.5      0.1335
       2014      0.1335        0.125        1.5      0.2585
       2015    0.122375        0.125      1.375    0.247375
       2016     0.11125        0.125       1.25     0.23625


11
     The Monthly Trading report of WDM Segment for March 2010 available on www.nse-india.com

       84
Analysis of Fixed and Floating Interest Rates 2010
       2017    0.100125          0.125       1.125   0.225125
       2018       0.089          0.125           1      0.214
       2019    0.077875          0.125       0.875   0.202875
       2020     0.06675          0.125        0.75    0.19175
       2021    0.055625          0.125       0.625   0.180625
       2022      0.0445          0.125         0.5     0.1695
       2023    0.033375          0.125       0.375   0.158375
       2024     0.02225          0.125        0.25    0.14725
       2025    0.011125          0.125       0.125   0.136125
Table 12 Yield to Maturity of PG XXXI

Using the IRR Function of the column ‘Total Payments’ Yield to Maturity is computed; in the year
2010 the negative value is the present value of the bond. The negative value implies it is outflow for
the Investor and for the subsequent years the amounts are inflows.

The Yield to Maturity of this Bond as on 31st March 2010 is 8.816%. The yield is less than the Coupon
rate because the present value is more than the face value. This implies that the investor is paying
more amount than the value of that bond.

Similarly in case of GSec Bonds whose redemption is on maturity after 20 years with years to
maturity being 12 years with the coupon rate of 10.25%.

Year          Intrest        Principal Opening Total Payments( C)
                                       Balance
       2010            0             0          0               -115.25
       2010        10.25             0        100                 10.25
       2011        10.25             0        100                 10.25
       2012        10.25             0        100                 10.25
       2013        10.25             0        100                 10.25
       2014        10.25             0        100                 10.25
       2015        10.25             0        100                 10.25
       2016        10.25             0        100                 10.25
       2017        10.25             0        100                 10.25
       2018        10.25             0        100                 10.25
       2019        10.25             0        100                 10.25
       2020        10.25             0        100                 10.25
       2021        10.25           100        100                110.25
Table 13 Computation of Yield of GSec Bond

The Yield to Maturity of this Bond as on 31st March 2010 is 8.205%.


     85
Analysis of Fixed and Floating Interest Rates 2010
Computation of Current Yield
The Current Yield as defined before is the yield to the investor for one year. If holds the bonds or any
investment for the period of 1 year. It is just a ratio of Coupon rate and the face value. Thus say for
Bond PGXXXI the Current yield will be 8.86% for the coupon rate of 8.90% and present value of Rs.
1.5075 Crores. And for the GSec Bond with coupon rate of 10.25%, the Current Yield is 8.89%
because of its high market value.

Similarly Yield to Maturity and Current Yield of all the Bonds are as follows:

Bond                           Duration to Coupon Face       Present        YTM    Current Yield
                               Maturity    Rate   Value      Value
                                                  (Rs. Crs.) (Rs. Crs.)
XXXII                           14.997222   8.84%        1.5            1.5 8.840%         8.84%
XXXI                            14.902778   8.90%        1.5      1.507589 8.816%          8.86%
XXX                             14.497222   8.80%        1.5      1.517222 8.612%          8.70%
XXVIII                          13.708333   9.33%        1.5      1.568498 8.521%          8.92%
XXVII                                   13  9.47%        1.5    1.5065713 9.382%           9.43%
XXVI                            12.936111   9.30%        1.5            1.5 9.300%         9.30%
XXV                                   12.2 10.10%        1.5    1.4917073 10.215%         10.16%
XXIX                                 13.95  9.20%        1.5      1.535168 8.780%          8.99%
XXIV                            11.988889   9.95%        1.5            1.5 9.950%         9.95%
XXIII                           11.858333   9.25%        1.5            1.5 9.250%         9.25%
XXII                            11.686111   8.68%        1.5      1.494723 8.758%          8.71%
XXI                             11.530556   8.73%        1.5    1.5046713 8.661%           8.70%
XX                              11.436111   8.93%        1.5            1.5 8.930%         8.93%
XVIII                           10.941667   8.15%        1.5          1.375 8.150%         8.89%
XVII                            8.4777778   7.39%     1.375        1.27544 8.873%          7.97%
XVI                             7.8833333   7.10%       1.35      1.122116 8.995%          8.54%
XV                              8.8972222   6.68%        1.2      1.139539 6.359%          7.03%
XIX                             11.316667   9.25%     1.125     1.4997551 9.254%           6.94%
XIV                             5.2972222   6.10%       0.75      0.705981 8.153%          6.48%
XIII                            7.3333333   8.63%          1      1.133466 5.141%          7.61%
PFC ( S-57)                     14.352778      8.60%      100*       99.4346*     8.691%             8.65%
GOI LOAN 8.20% 2024             14.458333      8.20%      100*             99*    8.335%             8.28%
OIL BOND
GOI LOAN 10.25% 2021            11.166667     10.25%      100*         115.25*    8.205%             8.89%
Table 14 YTM and Current Yield of All Bonds

Some of the important analysis is:

     For all the Bonds, if market value is less than the present face value (i.e. Face Value less
      redeemed value), the Yield to Maturity will be more than the coupon rate. The rationale
      behind this is that the investor to own the security is paying more amount than its Face
      value. Thus the overall yield will be less than the coupon rate. And the Yields will be more if
      the face value is less than the face value.


     86
Analysis of Fixed and Floating Interest Rates 2010
   Similar is the case with the Current Yield. The coupon rate is calculated on the face value
    whereas the investor will calculate his yield on his investment which is based on market
    value, thus lower the market value, higher the Yield.


                                                   Yield- Coupon-Price
                12.00%

                10.00%

                 8.00%
Coupon/ Yield


                 6.00%                                                                                      Coupon Rate
                                                                                                            YTM
                 4.00%
                                                                                                            Current Yield
                 2.00%

                 0.00%
                -2       0       2       4         6        8         10          12    14   16   18
                                                 Difference in PV and FV


   From the above chart it is clearly visible that both the yields are lower than the coupon rate
    when the difference in Present market Value and the present face value is positive. In other
    words when the present value is more than the face value.
   Also the current yield is less than the Yield to Maturity in case of a small difference, but The
    current yield will be more than the YTM in case of a large difference, this is because, the
    large difference will promise high returns in short term if the security is held for short
    duration but in case of a long duration, the present high returns will be normalised and the
    overall YTM will be reduced.


                                                  Maturity- Yields
                12.000%

                10.000%

                 8.000%
Yields


                 6.000%
                                                                                                   YTM
                 4.000%
                                                                                                   Current Yield
                 2.000%

                 0.000%
                             3       5       7          9        11          13        15    17
                                                 Years to Maturity ( Yrs.)


      87
Analysis of Fixed and Floating Interest Rates 2010
      From the relationship between the Yield and the Duration (years to maturity), it can be seen
       that, less the duration to Maturity, more deviation in Current Yield and YTM. The Yield to
       maturity is computed by calculating the future cash flows, in case if the present value is
       higher and the years for which the cash flows are to be estimated are less, this would lead to
       lower yields. And the reverse situation in a vice versa case.

Price-Yield Relationship
A fundamental principle of an option free bond (i.e... a bond without any call / put option embedded
with it) is that the price of the bond changes in a direction opposite to that of change in the required
yield for the bond. But the relationship may be linear, collinear or quadratic. Thus it is necessary to
determine the price-yield relationship. This relationship when plotted on a graph will give Yield-
Curve. The Yield Curve is used by the investors and also valuators of the bond to measure the
volatility and also the sensitivity.

The Price Yield curve for PGXXX bond which has a coupon rate of 8.80% and Maturity of 15 years is


                                        Yield Curve -PGXXX
              3
            2.5
              2
    Price


            1.5
              1
                                                                                               PRICE
            0.5
              0
              0.00%    5.00%     10.00% 15.00% 20.00% 25.00% 30.00% 35.00% 40.00%
                                                Yield


Figure 33 Yield Curve of PGXXX

Similarly the Yield curve for GSec Bond of coupon rate 8.20% and Maturity of 14.5 years is


                                        Yield Curve- GSec 8.20%
            200

            150
    Price


            100

             50                                                                                        Price

              0
              0.000%           5.000%      10.000%           15.000%   20.000%       25.000%
                                                     Yield


Figure 34 Yield Curve of GSec 8.20%

      88
Analysis of Fixed and Floating Interest Rates 2010
And the Yield Curve for PFC Bond 57 of Coupon rate of 8.60% and the Maturity of 14.5 Years
(approx.)


                                       Yield Curve - PFC Bond 57
            200

            150
    Price


            100

             50                                                                                   Price

              0
                  0%   3%   6%        9%   12% 15% 18% 21% 24% 27% 30% 33% 36% 39%
                                                    Yield


Figure 35 Yield Curve of PFC (S-57)


From the above three yield curves of different Bonds namely of Power Grid Corporation of India
Limited , Government of India and Power Finance Corporation, some of the observations that can be
made are:

      The Yield Curve of all the three Bonds is curvilinear and not exact linear.
      The Curve of PG Bond is curvilinear for the higher prices and is linear for the lower prices.
       This implies, the yield would be less responsive to the rise in price but it will be high
       responsive to the fall in price.
      The GSec Bond is perfectly curvilinear because of its redemption pattern. IT is redeemed as a
       bullet payment after its tenure unlike the Power Grid Corporation of India Limited bonds
       which are redeemed in instalments.
      The sensitivity and convexity of the bonds can be measured with more accuracy using tools
       like Convexity, Modified Duration etc...


      89
Analysis of Fixed and Floating Interest Rates 2010

Duration of PSU and GSec Bonds

After computing and analysing the Yield of each bond and Yield curve, it is also necessary to analyse
the Duration of the selected bonds. As mentioned before the Macaulay’s Duration is effective
tenure of the bonds. In simple words it is time period after which the investor will receive back his
investment at a particular yield to maturity. Macaulay's duration, therefore, equals the average time
to receipt of a bond's cash flows, in which each cash flow's time to receipt is weighted by its present
value as a percentage of the total present value of all the cash flows.

As mentioned before, The Macaulay’s Duration is Time weighted, present values of the future cash
flows. Thus to compute the Macaulay’s Duration, The cash flows must be multiplied by the
respective time period, and its present value needs to be computed. The ratio of sum of the present
values of Time weighted future cash flows and the current price of that bond results in Macaulay’s
Duration. Thus the formula used is:

                                                 1        2                          
                                                1 +  + (1 + )2 + … … . + (1 + ) + (1 + )
              =
                                                                        

Here C= Coupon Inflows
     y = IRR/ Yield
    M= Maturity Amount (Redemption Amount)
    n= Number of Periods
    P= Price

And Modified Duration which shows the sensitivity of the bond prices with respect to the yield. In
other words it shows the change in price with the change in Yield. It is computed by dividing the
Macaulay’s Duration by 1+Yield i.e... (1+y)

Following is the computation of Macaulay’s Duration and Modified Duration for the bond PGXXXI,
which has 4 years Moratorium period with 12 equal instalments to be annually at a coupon rate of
8.90%. The table of future cash flows and the present value as on 31st March 2010 was used to
compute IRR (Yield to maturity). And the same IRR is used to discount and get the present values of
time weighted Cash flows.

Period    Year          Total Payments         (1+r)^n  N*C               N*C/(1+r)^n
  (N)                          (C)             r=8.816%
   0         2010           -1.50759               1            0               0
   1         2011            0.1335            1.088162      0.1335         0.122684
   2         2012            0.1335            1.184098       0.267         0.225488
   3         2013            0.1335            1.28849       0.4005         0.310829
   4         2014            0.2585            1.402087       1.034         0.737472
   5         2015           0.247375           1.525698     1.236875        0.810694
   6         2016            0.23625           1.660208      1.4175         0.853809
   7         2017           0.225125           1.806576     1.575875        0.872299


    90
Analysis of Fixed and Floating Interest Rates 2010
   8          2018            0.214         1.965848         1.712      0.870871
   9          2019          0.202875        2.139162       1.825875     0.853547
   10         2020           0.19175        2.327756        1.9175      0.823755
   11         2021          0.180625        2.532976       1.986875     0.784403
   12         2022           0.1695         2.75629          2.034      0.737949
   13         2023          0.158375        2.999291       2.058875     0.686454
   14         2024           0.14725        3.263716        2.0615      0.631642
   15         2025          0.136125        3.551453       2.041875     0.574941
                             Sum (1)                                    9.896837
                     Price(Present Value) (2)                           1.507589
                   Macaulay’s Duration= (1)/ (2)                        6.564678
                        Modified Duration                               6.032811
Table 15 Modified and Macaulay's Duration of PGXXXI

The Macaulay’s Duration is sum of the discounted time weighted values of the future cash flows as
on 31st March 2010. In this case the present value being Rs. 1.507589 Crores, The Macaulay’s
Duration is 6.564678 years. This implies the investor at the present yield of 8.816%, can get back his
investment in 6.5 years, though the years to maturity are 15 years.

And the Modified Duration, which is ratio of Macaulay’s Duration and 1+Yield to maturity, is
6.032811. This implies for every 1 basis point change in the yield, the price will change in a reverse
direction by 6 basis points. Similarly in case of GSec Bonds whose redemption is on maturity after 20
years with years to maturity being 12 years with the coupon rate of 10.25%.

   Period            Year        Total Payments       (1+r)^n         N*C   N*C/(1+r)^n
    (N)                                ( C)           r=8.205%
             0         2010            -115.25          1              0               0
             1         2010              10.25 1.08204869          10.25    9.472771505
             2         2011              10.25 1.17082937           20.5    17.50895609
             3         2012              10.25 1.26689438          30.75    24.27195225
             4         2013              10.25 1.37084141             41    29.90863839
             5         2014              10.25 1.48331715          51.25    34.55093872
             6         2015              10.25 1.60502138           61.5    38.31724657
             7         2016              10.25 1.73671128          71.75    41.31371789
             8         2017              10.25 1.87920617             82    43.63544636
             9         2018              10.25 2.03339257          92.25    45.36753068
            10         2019              10.25 2.20022977          102.5    46.58604357
            11         2020              10.25 2.38075574         112.75    47.35891128
            12         2021             110.25 2.57609363          1323     513.5682892
                                 Sum (1)                                    891.8604425
                         Price(Present Value) (2)                              115.25*
                       Macaulay’s Duration= (1)/ (2)                        7.738485401
                            Modified Duration                                 7.151698
Table 16 Modified and Macaulay's Duration of GSec


     91
Analysis of Fixed and Floating Interest Rates 2010
Here the present value is in index points as published by NSE WDM Segment. This index implies for
the face value of 100 points, the present value in market is 115.25 points. For simplicity and accuracy
in calculation, 100 have been used as the face value for computing the coupon payments.

The Macaulay’s Duration turns up to 7.74 years (Approx) and Modified Duration is 7.15. Every one
basis point increase in the yield would lead to 7.74 basis point fall in the price.

Similarly the Macaulay’s Duration and Modified Duration of each of the Bonds is summarised in the
following table:

Bond                     Duration to Maturity Coupon    YTM     Macaulay's Modified
                         (Years)               Rate             Duration   Duration
XIV                                 5.2972222     6.10%  8.153%  3.128941 2.89307
XVI                                 7.8833333     7.10%  8.995%  3.782077 3.469942
XIII                                7.3333333     8.63%  5.141%  3.919007 3.72737
XVII                                8.4777778     7.39%  8.873%  4.099708 3.765581
XV                                  8.8972222     6.68%  6.359%  4.269027 4.013794
XVIII                               10.941667     8.15%  8.150%  4.720113 4.364413
XXIV                                11.988889     9.95%  9.950%  4.760437 4.329638
XIX                                 11.316667     9.25%  9.254%  4.850537 4.439701
XXIII                               11.858333     9.25%  9.250%  4.850878 4.440163
XX                                  11.436111     8.93%  8.930%  4.893468 4.492305
XXII                                11.686111     8.68%  8.758%  4.919947 4.523764
XXI                                 11.530556     8.73%  8.661%  4.926986 4.534258
XXV                                       12.2   10.10% 10.215%  5.295218 4.804435
XXVII                                       13    9.47%  9.382%  5.413836 4.949495
XXVI                                12.936111     9.30%  9.300%  5.432109 4.969907
XXIX                                     13.95    9.20%  8.780%  6.037437 5.550137
XXVIII                              13.708333     9.33%  8.521%  6.057109 5.58152
XXXI                                14.902778     8.90%  8.816%  6.564678 6.032811
XXXII                               14.997222     8.84%  8.840%  6.567683 6.034255
XXX                                   14.497222           8.80%   8.612%   6.60183     6.07838
PFC ( S-57)                           14.352778           8.60%   8.691%   6.761574 6.220913
GOI LOAN 10.25%                       11.166667          10.25%   8.205%   7.738485 7.151698
2021
GOI LOAN 8.20%                        14.458333           8.20%   8.335%   8.049266 7.429977
2024 OIL BOND
Table 17 Macaulay's and Modified Duration of All Bonds

From the above table of summary, some of the observations that can be made are:

     Modified and Macaulay’s duration are less than Maturity. This implies that, though the
      security has a longer maturity, but the investor can get back his investment sooner than the
      redemption date.
     And also, the Modified duration is always less than the Macaulay’s Duration.


      92
Analysis of Fixed and Floating Interest Rates 2010

                                                       Duration
               9
               8
               7
               6
    Duration


               5
                                                                                     Macaulay's Duration
               4
               3                                                                     Modified Duration
               2
               1
               0
                       1 2 3 4 5 6 7 8 9 10 11 12 13 14 15 16 17 18 19 20 21 22 23


Figure 36 Modified Vs Macaulay's Duration

      For same maturity bonds, Lower the coupon greater the duration
      With all factors constant, Longer the maturity, greater the modified duration


                                             Duration- Maturity
               7
               6
               5
    Maturity


               4
               3                                                                     Macaulay's Duration
               2                                                                     Modified Duration
               1
               0
                   0                5             10             15            20
                                               Duration


Figure 37 Duration Vs Maturity

      With all factors constant, Lower the coupon rate, greater the modified duration
      With all factors constant, Lower the yield, greater the modified duration


       93
Analysis of Fixed and Floating Interest Rates 2010

                                        Duration- Yield
               8

               7
    Duration


               6
                                                                               Macaulay's Duration
               5
                                                                               Modified Duration
               4
               7.000%         8.000%           9.000%          10.000%
                                       Yield


Figure 38 Duration Vs Yield

      Also, it can be seen that, among the Power grid bonds and PFC bonds and also GSec bonds,
       the Power grid Bonds have less Duration, both the Macaulay’s and modified are less.
      Though the years to Maturity and coupon rate are almost same for PGXXX, PFC (S-57) and
       GOI LOAN 8.20% 2024 OIL BOND, the Macaulay’s Duration and Modified Duration differ and
       it is lowest for the PGXXX followed by PFC (S-57) and then GOI Loan 8.20%. The main reason
       behind this is the repayment structure. In case of Power Grid, the repayment of principal is
       done annually after 3 years, and in case of PFC the principal is repaid in each 5 years and in
       case of GOI, it is paid only on maturity. Thus the repayment also affects the Bonds Duration.


       94
Analysis of Fixed and Floating Interest Rates 2010

Convexity of PSU and GSec Bonds

Convexity is the measure of sensitivity of duration of bond to the change in yield. As discussed
before, the Modified Duration also measures the sensitivity of bond price to the change in Yield. But
the modified duration predicts the relationship more accurately in case of small change in the yield.
There is a scope of error in case of larger change in the yield. Thus Convexity measures the
sensitivity of Duration, which further predicts the sensitivity of bonds.

Duration is a linear measure or 1st derivative of how the price of a bond changes in response to
interest rate changes. As interest rates change, the price is not likely to change linearly, but instead it
would change over some curved function of interest rates. The more curved the price function of the
bond is, the more inaccurate duration is as a measure of the interest rate sensitivity.

Convexity is a measure of the curvature or 2nd derivative of how the price of a bond varies with
interest rate, i.e. how the duration of a bond changes as the interest rate changes. Specifically, one
assumes that the interest rate is constant across the life of the bond and that changes in interest
rates occur evenly. Using these assumptions, duration can be formulated as the first derivative of
the price function of the bond with respect to the interest rate in question. Then the convexity
would be the second derivative of the price function with respect to the interest rate.

In actual markets the assumption of constant interest rates and even changes is not correct, and
more complex models are needed to actually price bonds. However, these simplifying assumptions
allow one to quickly and easily calculate factors which describe the sensitivity of the bond prices to
interest rate changes.

For computing the convexity following formula is used:

                                                         + 1 
                                                        1 +  +2
                                 =                  /2
                                                            100


Here:

t= corresponding period of the payment, (1 for first payment)
C= Coupon Flows
r= Yield to Maturity
m= frequency of Intrest payment in a year (2 for half yearly)


Following page has the computation of Convexity for the bond PGXXXI, which has 4 years
Moratorium period with 12 equal instalments to be annually at a coupon rate of 8.90%. The table of
future cash flows and the present value as on 31st March 2010 was used to compute IRR (Yield to
maturity). And the same IRR is used as discount rate (r).


    95
Analysis of Fixed and Floating Interest Rates 2010
Period        Year             Total      1/(1+r)^t+2 t(t+1)C        t(t+1)C /
                               Payments                              (1+r)^t+2)
          0          2010        -1.50759   0.843226               0            0
          1          2011          0.1335   0.774313           0.267 0.206741481
          2          2012          0.1335   0.711031           0.801 0.569535759
          3          2013          0.1335   0.652921           1.602 1.045979356
          4          2014          0.2585     0.59956           5.17 3.099725703
          5          2015       0.247375      0.55056       7.42125 4.085845154
          6          2016         0.23625   0.505565          9.9225 5.016468269
          7          2017       0.225125    0.464247          12.607 5.852761609
          8          2018           0.214   0.426306          15.408 6.568519178
          9          2019       0.202875    0.391465       18.25875 7.147667886
         10          2020         0.19175   0.359472        21.0925 7.582169706
         11          2021       0.180625    0.330094        23.8425 7.870264977
         12          2022          0.1695   0.303117          26.442 8.015008446
         13          2023       0.158375    0.278344       28.82425 8.023055926
         14          2024         0.14725   0.255596        30.9225 7.903664961
         15          2025       0.136125    0.234707           32.67 7.667877721
                                      Sum                            80.65528613
                                            2
                                (Sum/100)/m                          0.806552861
Table 18 Convexity of PGXXXI

The convexity of the above bonds turns up to 0.806; this implies a one basis point change in yield
would lead to 0.806 basis points change in duration.

Similarly the Convexity of the other bonds is as summarised in the following table:

Bond                                  Duration to  Coupon Rate YTM     Convexity
                                      Maturity
XIV                                     5.2972222         6.10% 8.153%   0.10768
XVI                                     7.8833333         7.10% 8.995%   0.24911
XIII                                    7.3333333         8.63% 5.141%   0.19280
XVII                                    8.4777778         7.39% 8.873%   0.32667
XV                                      8.8972222         6.68% 6.359%   0.28267
XVIII                                   10.941667         8.15% 8.150%   0.42211
XXIV                                    11.988889         9.95% 9.950%   0.46356
XIX                                     11.316667         9.25% 9.254%   0.48399
XXIII                                   11.858333         9.25% 9.250%   0.48399
XX                                      11.436111         8.93% 8.930%   0.49372
XXII                                    11.686111         8.68% 8.758%   0.50151
XXI                                     11.530556         8.73% 8.661%   0.49994
XXV                                           12.2      10.10% 10.215%   0.54853
XXVII                                           13        9.47% 9.382%   0.57145
XXVI                                    12.936111         9.30% 9.300%   0.57785


     96
Analysis of Fixed and Floating Interest Rates 2010
XXIX                                               13.95           9.20%     8.780%      0.68333
XXVIII                                        13.708333            9.33%     8.521%      0.67719
XXXI                                          14.902778            8.90%     8.816%      0.80655
XXXII                                         14.997222            8.84%     8.840%      0.81014
XXX                                           14.497222            8.80%     8.612%      0.81255
PFC ( S-57)                                   14.352778            8.60%     8.691%      0.59129
GOI LOAN 10.25% 2021                          11.166667           10.25%     8.205%      0.65486
GOI LOAN 8.20% 2024 OIL                       14.458333            8.20%     8.335%      0.76856
BOND
Table 19 Convexity of All Bonds

From the above summary of convexity of different bonds, some of the analyses that can be made
are:

        Higher the convexity implies more sensitive the prices of the bonds are.
        For the bonds, whose present value is more than its face value (this can be verified by
         looking at Coupon rate and YTM, if YTM is more than Coupon rate implies the Present value
         is less than the face value and vice versa), the Convexity is low, this signifies that, since the
         price is already high, the sensitivity of the same is decreased.
        Also in case if Present value is less than the face value (i.e... YTM is less than the coupon
         rate), the Convexity is high implying that the sensitivity of the price is high.
        Also it can be seen that, there is a Direct relationship between the Years to Maturity and
         Convexity. In other words Bonds with more years to mature are more sensitive when
         compared to the bonds with shorter maturity. This is mainly because of uncertainty of the
         yield to be remaining constant, and thus the change in yield would impact the prices highly.


                                     Duration-Convexity
                        16
                        14
    Years to Maturity


                        12
                        10
                         8
                         6
                         4
                         2
                         0
                        0.00000   0.20000   0.40000     0.60000    0.80000     1.00000
                                                 Convexity


Figure 39 Duration Vs Convexity


        Also among the bonds having same maturity, there is inverse relationship between the
         Coupon rate and the convexity. The higher the coupon rate, lesser the convexity. This is

            97
Analysis of Fixed and Floating Interest Rates 2010
                  bacause, since all the bonds will be matured in the same year, the bonds with higher coupon
                  rate will be less sensitive to the changes in intrest rates ( Yield) and the oppostie trend in
                  case of bo0nds with lower coupon rate.


                      Coupon Rate- Convexity-Maturity
                  10.20%
                  10.00%
                   9.80%
    Coupon Rate


                   9.60%
                   9.40%
                   9.20%
                   9.00%
                   8.80%
                   8.60%
                      0.46000     0.47000     0.48000     0.49000     0.50000     0.51000
                                                   Convexity


Figure 40 Coupon Rate Vs Convexity (Same Maturity)

       And for the Bonds having same Duration, there exist a positive relationship between Coupon
        rate and the Convexity.


                       Coupon Rate-Convexity-Duration
                  9.00%

                  8.50%
    Coupon Rate


                  8.00%

                  7.50%

                  7.00%

                  6.50%

                  6.00%
                     0.20000 0.25000 0.30000 0.35000 0.40000 0.45000 0.50000 0.55000
                                                  Convexity


Figure 41 Coupon Rate Vs Convexity (Same Duration)


         98
Analysis of Fixed and Floating Interest Rates 2010


     Chapter V
     Analysis of Fixed and
     Floating Intrest Rates


               Introduction to Fixed and
                Floating Rate
               Debt Servicing of PGCIL Bonds
               Floating Interest for PGCIL
                Bonds
               Factors Effecting the Selection
                of Each Method


99
Analysis of Fixed and Floating Interest Rates 2010

Introduction

Bonds (Debentures) are the avenues of the investment for the investors. They are similar to
securities on which a regular income can be generated. And these are issued by the corporate, the
exchequer or by any Public undertaking or Municipal bodies etc... They act as source of funds for the
issuer. They are similar to loans but instead of taking from a sole institute or a consortium, the bonds
are raised from wide range of public. And the issuer pays regular interest on these bonds. This
interest is determined by either the Issuer or the investor or by both. The rate determined is termed
as Coupon rate. This coupon rate can be either fixed at the time or issue or it can be even floating.

In specific to India, the bonds are issued by The Central Government in form of Zero coupon
securities (Treasury Bills), bonds of tenure 1 year, 3 years, 5 years, 10 years, 15 years and even 20
years, by the state government, PSUs ( Public Sector Undertakings) and also private players. These
are of different maturity and also different repayment structure. For instance the GSec (central Govt
Securities) are redeemed only on their maturity and interest is paid half yearly, the corporate bonds
are repaid in equal annual or 3 year or even 5 year instalments with some moratorium period. And
the interest is paid either half yearly or yearly. But the bonds issued by them are usually of fixed
interest rate. But in a recent past, central Government and also some corporate have issued the
bonds at fixed rate. Now let us understand the meanings of fixed and floating rates.

Fixed Intrest Rate

As the name very clearly signifies that the interest rate in this case is fixed and will remain the same
for throughout the life of the bond say 15 years or so. In this case the coupon rate is attached to the
nomenclature of bonds and the coupon rate is paid annually or semi annually on the face value of
bond outstanding. For Instance a bond PGC 8.80% 2025 (S-XXX) implies the bond issued by Power
Grid Corporation of India Limited which will mature in the year 2025 and coupon rate of 8.8% will be
paid annually/ semi-annually as defined in the Information memorandum.

The Coupon rate is determined by the process of Book Building in case of Private Placement or it can
be even fixed by the issuer. However the rationale to set the fixed coupon rate and its process is as
follows:

  I.     Credit rating on the Security to be issued from 2 or more Credit Rating Agencies shall be
         obtained as per the SEBI (Disclosure and Investors’ Protection) Guidelines, 2000 amended on
         14th August 2003.
  II.    At the time of opening of the issue, the prevailing rate on Government securities of same
         tenure that of the security to be issued, is considered. This can be the coupon rate of latest
         issue of the similar bond by GoI or Average of last 5 or so issues.
 III.    Also the prevailing conditions of economy in general and in specific the condition of money
         market is also considered. The high liquidity is considered as favourable and also any policies
         of RBI or any announcements in the recent future or during the time of issue are also
         considered.
 IV.     Also the Bank lending rate ( PLR) is considered


   100
Analysis of Fixed and Floating Interest Rates 2010
  V.       The coupon rate of other corporate bodies issues also impact the coupon rate determination
           of the present issue.
 VI.       After the above factors are considered, the interest rate on GSec is taken as base rate and a
           spread is added to it.
VII.       Since the GSec issued by the government is considered as the safest and secured
           investment, a spread is to be added to its coupon rate based on the security and the rating
           of the bond.
VIII.      The spread is widely influenced by the factors like security on the bond, the credibility of the
           issuer, the market conditions, issues of other players etc.
 IX.       In India, The FIMMDA ( The Fixed Income and Money Market Derivatives Association), a
           association to co-ordinate and also promote the Money market Instruments like Commercial
           papers, Certificate of Credit, Bonds, etc..., provides the spread for each kind of security and
           for each duration.
  X.       Thus based on the tenure of the bonds and the rating on that bond, a spread is obtained.
           The spread published by the FIMMDA is already adjusted with all the factors affecting the
           interest rate.
 XI.       Thus a range of interest rate is defined based on interest rate determined by adding spread
           to GSec rate.
XII.       The range may be defined by defining just the floor or ceiling rate and keeping the other end
           open.
XIII.      Usually the floor rate is kept open to take advantage of sudden change in economic
           conditions, where the issuer could be in a position to get a rate lower than the defined rate.
           And the ceiling rate is fixed to avoid more escalation of rate towards upper end.
XIV.       After the range is defined, by the process of bidding the coupon rate is determine and this
           rate is kept fixed for the whole tenure of the bond.

The fixed interest rate has many benefits attached to it. Some of them are:

         The payment towards interest rate is fixed and the issuer can prepare a budget well in
          advance. And also repayment schedule can be prepared.
         It is preferred by the investors as a fixed income is promised every year and the risk of rates
          falling down can be avoided.
         Also this kind of investments is preferred by the investors seeking for regular and non-
          fluctuating. These include the provident Funds, Pension Funds and Gratuity Funds, which
          form majority in the investors group.
         For the issuer, there is indemnity of hike in rates due to unfavourable circumstances.

Along with the aforesaid merits, there are some demerits attached to it like

     In case of down turn in economy, there will be fall in all the interest rates and also the fall in
      performance of the business leading to unattractive cash flows. But even in this case the
      interest to be paid on the bonds remains at the same level.
     The interest for the whole tenure is based on the conditions of money market and the
      economy at the time of issue. The later conditions are not reflected.
     Even for the investor, there is scope of demerit if the security is issued at the time when the
      condition of economy was poor and the interest rate fixed was very low. And this will not

   101
Analysis of Fixed and Floating Interest Rates 2010
      increase even though the general interest rate is increased due to improvement in the
      economic conditions.
     The issuer may end up paying high debt obligation in case of fixed interest rate and cannot
      take the advantage of fluctuations and trends in other rates.

Thus to avoid the demerits of the Fixed Intrest rate, some issuer go for the FRBs (Floating rate
Bonds).

Floating Intrest Rate

It is clear from the term that, the interest rate is floating and not fixed. In this case the interest rate
will be adjusted periodically based on the benchmark rate. In this case for every interest payment
period the interest rate is determined based on the benchmark rates and a spread is added to it.
Unlike Fixed interest rates where the coupon rate was determined at the time of issue, in this case it
cannot be predetermined. The nomenclature in this kind will be GOI FLOATING RATE +0.14% 2014,
this implies the bond is issued by the Government of India, will be matured in the year 2014 and the
spread is +0.14%. This implies that 0.14% will be added to the benchmark rate for every reset period.
The Benchmark rate and the reset period are determined by the issuer and are shared in their
disclosure document. Usually the reset period is based on the frequency of interest payment. For
instance, in the above case the reset period was 6 months because the interest is paid semi-
annually. And the Benchmark rate was average yield of last 5 T-Bills (Treasury bills) issued by the
Government preceding the reset date.

As in case of fixed interest rate, the coupon rate was determined based on the bidding by the
investor, in the case of floating rate, the spread is determined by the bidding process.


A Benchmark or a Reference Rate is a rate that is an accurate measure of the market price. In the
fixed income market, it is an interest rate that the market respects and closely watches. A
benchmark rate should be from an unbiased source, be representative of the market, transparent,
reliable and continuously available and most importantly be widely acceptable to the market as the
benchmark                                                                                     rate

Such benchmark rates issued by unbiased sources are the Treasury Bill (T-Bill) rate issued by the
Government of India, the bank rate as decided by the Reserve Bank of India, the Mumbai Interbank
Offering Rate (MIBOR) released by the National Stock Exchange of India and GOI Securities. Thus
specifically for the Bonds the base rate can be any of the following:

     Coupon rate of similar tenure GSec Bond issued preceding the reset date.
     Average of Coupon rate of last 5 similar tenure GSec Bonds issued preceding the reset date.
     Average yield of last 5 Treasury Bills of maturity of 364 days issued preceding the reset date.
      ( for annual interest payment)
     Average yield of last 5 Treasury Bills of maturity of 180 days issued preceding the reset date.
      ( for semi annual interest payment)


   102
Analysis of Fixed and Floating Interest Rates 2010
     Average of Yields of similar tenure GSec bonds for the last 12 months preceding the reset
      date.
     Average of Yields of similar tenure GSec bonds for the last 6 months preceding the reset
      date. ( for semi annual interest payment)
     Average daily yield of similar tenure GSec bonds for a month preceding the reset date.
     Average Yield of 1 year GSec for the 3 days preceding the reset date.

The above stated base rates are not exclusive and exhaustive. Different issuers take different base
rates based on the structure of the repayment, the tenure of the bonds etc...

The Reset Date is the date on which the interest rate is reset based on the base rate and the spread
pre determined. The frequency of reset date could be quarterly, half yearly or even annually based
on the interest payment date. Sometimes the reset date may be annually where as the interest is
paid semi annually and vice versa. The determination of reset date depends on the issuers wish.

And the Spread can be either negative or positive i.e... The interest rate can be less than the base
rate or more than that. Usually it is positive signifying that the bonds must pay more interest than
the GSec yield as there is risk attached to it. The spread is predetermined at the time of issue and
remains same for the life of the bond. And the spread can be determined by the bidding by the
investors participating. But the base range is estimated with the help of average spread as published
by FIMMDA or the difference in base rate and the prevailing rate on similar bonds during the time of
issue.

Some of the benefits of Floating rate are:

     The issuer can take advantage of movement in general interest rates and condition of
      market.
     No matter whatever is the condition of economy during the issue, the later on interest rates
      are truly represented by the state of the economy.
     The investors risk is minimised as the returns are based on the market conditions and the
      opportunity cost is negligible.
     Also the floating rate minimises the fluctuation in prices. Floating Rate funds are protective
      funds and shield your investments from interest rate fluctuations.


In a declining interest rate scenario older securities issued at higher coupon rates (interest paid on
the face value of a debt instrument) appear much more attractive than the ones that are currently
issued. Consequently older higher interest bearing securities would go at a premium. Thus long term
income funds by virtue of their investments in longer maturing securities would see a rise in their
Net Asset Values.


However, when interest rates are on the rise newer securities appear more attractive than the ones
that were issued earlier, as they offer higher coupons than their predecessors. The lesser paying
older securities therefore will be sold at a discount. So the same income fund with a majority of
investment in longer maturing securities, now start earning you lesser as newer securities continues
to earn higher returns than the ones in the portfolio.

  103
Analysis of Fixed and Floating Interest Rates 2010
This bearish scenario lasts as long as interest rates continue to show an upward trend. It is during
these times that floating rate funds offer the best utility.

Some of the demerits are:

     The investor is exposed to fluctuations in interest rates.
     He cannot pre plan the expenses towards financial charges well in advance
     Since the interest rates fluctuates, the investor class looking for fixed and regular income (
      including PF Funds and gratuity fund) may not be attracted.

Though both the methods have some merits and some demerits, it can be concluded on which
method is to be used. Suitability of each mechanism is based on the tenure of bond, amount of
interest to be paid, the market condition during the issue etc.....

Indian Issuers going for FRBs


Though most of the Indian issuers of Bonds go for the fixed coupon rate, there are few players who
also go for Floating rate like Government of India issued few of its bonds under floating rate and also
Power Finance Corporation of India, a NBFC to finance power project has also issued one of its bonds
with floating rate. But one must observe that both the above mentioned issuers do not issue only
floating rate but they also issue some of the bonds based on the tenure and condition of economy
with floating rate option. Also the structure of repayment, the benchmark and its determination
differ in each case.

Some of the prominent issuers of FRBs and their issue structure are as follows:

GOI Floating Rate Bonds
As mentioned before the Government of India issues the floating rate bonds along with the fixed
rate. It has issued its first FRB on 02nd of July, 2002 at a spread o =).34% (+3 basis points) over the
yield of last 5 T-Bills issued preceding the Intrest payment date. The tenure of these bonds was 15
years, maturing on 02nd of July, 2017.

As per NSE’s Monthly Trading history provided by its Wholesale Debt Segment, as on 31st March,
2010, there are 8 FRBs issued by Government active on the exchange. Each had different maturity
and different spreads. But the interest on these is paid half yearly with reset period of 6 months.
The benchmark for all the cases was Average yield on last 5- Treasury Bills of 364 Days maturity
issued immediately preceding the Reset date. The summary of all those issues is as follows:

Issue Description                      Spread    Issue Dt.     Mat Dt.      Maturity    Cpn Freq
                                                                            ( years)
GOI FLOATING RATE +0.13% 2011          +0.13%    08-Aug-03     08-Aug-11    8           Half-Yearly
GOI FLOATING RATE +0.09% 2012          +0.09%    10-Nov-03     10-Nov-12    9           Half-Yearly
GOI FRB +0.45% 2013                    +0.45%    10-Sep-04     10-Sep-13    9           Half-Yearly
GOI FLOATING RATE +0.14% 2014          +0.14%    20-May-03     20-May-14    11          Half-Yearly
GOI FLOATING RATE +0.19% 2015          +0.19%    02-Jul-04     02-Jul-15    11          Half-Yearly
GOI FLOATING RATE +0.50% 2015          +0.50%    10-Aug-04     10-Aug-15    11          Half-Yearly


  104
Analysis of Fixed and Floating Interest Rates 2010
GOI FRB +0.04% 2016                          +0.04%   07-May-04        07-May-16       12     Half-Yearly
GOI FLOATING RATE +0.34% 2017                +0.34%   02-Jul-02        02-Jul-17       15     Half-Yearly
                       12
Table 20 FRBs by GOI

Indian Railway Finance Corporation Limited (IRFCL)
The Indian Railway Finance Corporation is a separate unit established for the purpose of finance the
projects related to building and development and also maintenance of railway. The company is a
Government of India undertaking. Along with the fixed coupon rate bonds, it also issues the floating
rate bonds.

The maturity o the bonds issued is 5 years. And in one case the bond series issued was in form of
STRPP (Separately Transferable Redeemable, principal parts) which are redeemed in equal annual
instalments. And the benchmark rate for these bonds is INBMK rate for relevant GSec of relevant
maturity as published by The Reuters. Since the interest payment is semi-annual, the interest rate is
reset in a period of six months. The summary of issues by this company, as provided by NSE (WDM)
as on 31st march 2010 is:

Issue Description            Spread   Issue Dt.   Mat Dt.         Maturity    Redemption    Reference Rate
                                                                  ( years)
IRFC +0.37%     2010         +0.37%   22-Jun-05   22-Jun-10       5           Bullet        INBMK of 5 Yr GSec
(S- 49)
IRFC -0.10%     2010         -0.10%   22-Jun-05   22-Jun-10       5           Bullet        INBMK of 5 Yr GSec
(SER-49)
IRFC +5.60%     2010         +5.60%   25-Aug-5    25-Aug-10       5           Bullet        (5 yr INBMK) – (1Yr
(SERIES-50)                                                                                 INBMK)
IRFC -0.10%     2020         -0.10%   22-Jun-05   22-Jun-20       15          STRPPs        INBMK of GOI relevant
(SER-49)                                                                                    Maturity for each STRPP
                        12
Table 21 FRBs by IRFC

In the above table, for the series 50, the spread seems to be very high, but in this case the
benchmark is determined as the difference between INBMK of 5 year GSec and INBMK of 1 year
GSec. In other words the spread is added to the excess yield on 5 year GSec over the 1 year GSec. In
case if the Floating rate turns out to be negative, no interest is paid.

Also in case of Series 49 Option III (Maturity of 15 years); the redemption is in form of different
STRPPs having different maturity. Thus in that case the interest is determined separately for each
STRPP by taking Reference Rate as INBMK of similar maturity GSec for each STRPP.

Power Finance Corporation Limited,
PFC, a Government of India Undertaking, is a Non Banking Finance Company, established with the
object of financing Power projects in the country. It also issues the bonds regularly and till date it has
issued around 60 series of Bonds. Apart from issuing bonds under fixed coupon rate, it also issues its
bonds as FRBs.

The tenure of bonds range from 3 years to 10 years, and the reset period is six months for semi-
annual Intrest payment and 12 months for annual interest payments. The reference rate is different

12
     Source: www.nse-india.com/Debt/WDM


     105
Analysis of Fixed and Floating Interest Rates 2010
for each series. It is MIBOR (Mumbai Inter Bank Offer Rate), or YINCMT or even difference between
1 yr INBMK and 5 yr INBMK. The summary of the past FRBs by PFCL is as follows:

Issue Description                     Spread    Issue Dt.      Mat Dt.     Maturity   Cpn Freq     Reference Rate
                                                                           ( years)
PFC +5.70% 2010                       +5.70%    01-Sep-05      01-Sep-10   5          Half-        5 yr INBMK - 1Yr
(S- XXIV)                                                                             Yearly       INBMK
PFC MIB +2.15% 2011                   +2.15%    29-May-08      29-May-11   3          Yearly       MIBOR
(S-XLVI)
PFC 1YINCMT+1.35% 12                  +1.35%    20-Nov-09      20-Nov-12   3          Yearly       1 YINCMT
(S-60-A)
PFC 1YINCMT+1.79% 19                  +1.79%    20-Nov-09      20-Nov-19   10         Yearly       1 YINCMT
(S-60-B)
                       13
Table 22 FRBs by PFC

ICICI Bank
ICICI Bank, the largest private sector bank in India, issues both the fixed and floating rate bonds. The
summary of its issues is:

Issue Description                              Spread   Issue Dt.    Mat Dt.     Maturity      Reference
                                                                                  ( years)     Rate
ICICI BK +0.60%2010(S-DFE05FRB                 +0.60%   28-Feb-05    31-May-10   5             1 Yr INBMK
ICICIBK+0.50% 2011(S-DJN05FRB)                 +0.50%   29-Jun-05    29-Apr-11   6             1 Yr INBMK
                                 13
Table 23 FRBs by ICICI Bank

Others
Apart from the above mentioned, many other corporate issue the Floating rate Bonds. And the list
includes:

         UTI Bank,
         IDFC (Infrastructure Development Finance Company Limited),
          Kotak Mahindra Bank ,
         EXIM Bank ( Export Import Bank of India),
          IDBI ( Industrial Development Bank of India),
         CITI Bank,
         Sundaram Finance

The issue details of some of the above mentioned issuers are as follows:

Issue Description                              Spread   Issue Dt.    Mat Dt.     Maturity    Reference Rate
                                                                                 ( years)
EXIM BK +0.33% 2010 (SER-I03)                  +0.33%   09-Aug-05    09-Aug-10   5           Avg Yield on 1 Yr GSec
                                                                                             for 3 days
IDFC +1.50% 2017 (S-PP6/2008)                  +1.50%   16-May-07    16-May-17   10          MIBOR
KOTAK MAH BK +0.55% 2012 (S-                   +0.55%   22-Aug-05    22-Aug-12   7           1 Yr INBMK
I)
                            13
Table 24 FRBs by Others

13
     Source: www.nse-india.com/Debt/WDM


     106
Analysis of Fixed and Floating Interest Rates 2010

The Debt Servicing for PGCIL’s Bonds

The Power Grid Corporation of India Limited issues bonds with fixed coupon rate determined by the
book building procedure. The average maturity of most of the bonds is 15 years (4 years of
moratorium and then repayment of loan in 12 equal annual; instalments). Apart from this it has also
issued different structure bonds of 6 years Maturity ( 1 year moratorium and 6 annual equal
repayments), 12 years maturity ( 3 years moratorium and 10 equal annual repayments) etc... The
details of all the bonds issued by PGCIL till date along with its repayment structure are attached in
the appendix.

The interest rate is determined based on the prevailing interest rate on 10 year GSec ( for a 15 year
PG bond, since the average tenure turns up to be 9 years because of equally annual repayments) and
a spread defined by FIMMDA for a AAA rated bond for 10 years is added to define a range for
bidding by investors. Then the rate obtained by the book building process is taken as the coupon
rate.

Following chart depicts the relationship between the prevailing interest rates on GSec Securities and
the Coupon rate of PGCIL Bonds.

The blue line depicts the coupon rates of each issue of bonds and the green line depicts the coupon
rate of GSec bonds issued immediately before the PGCIL bonds were issued and having same
redemption year and also same maturity. The data is taken from the NSE website’s WDM segment
and also from the Data published by RBI on the outstanding GSec.

From the below chart we can see that for most of the issues the coupon rate on bonds of the
company was more than the coupon rate of GSec of similar tenure issued before the issue of
PGCIL’s bonds. Some of the points to be noticed are:

     In case of XIV issue the Coupon Rate is very much close to the Coupon rate of GSec. The
      coupon rate of bond is 6.10% whereas the rate of GSec is 6.07%. This is mainly because of
      gap of one month. The GSec was issued on June 6th 2003 and was of Maturity of 15 years
      whereas the PGCIL bond was issued on 17th July, 2003 and was with maturity of 12 years.
      Since no GSec of 12 years was issued in the immediate past, this GSec is considered. Also
      the Coupon rate is set lower because of its lesser maturity than the GSec.
     In case of X issue of PGCIL Bonds, the Coupon rate is lower than the GSec rate (highlighted
      by the circle). This is unusual in normal scenario. This was mainly because of excess
      borrowing by the government.
     The gap between the blue and green line is spread. Over the years the spread is more or less
      constant and the average spread is 0.75%. In other words the Coupon rate on an average is
      set 75 basis points above the GSec rate.


  107
Analysis of Fixed and Floating Interest Rates 2010

                                        Coupon Rate Vs Gsec Rate
     14.00%
     13.00%
     12.00%
     11.00%
     10.00%
      9.00%
      8.00%
      7.00%
      6.00%
      5.00%
      4.00%
      3.00%
      2.00%
      1.00%
      0.00%


                                     Coupon Rate- PG Bonds             Interest on Govt Securtiy

                                           14
Figure 42 Coupon Rate of PG Vs GSec Rate

From the following chart we study the behaviour of Coupon rates of each bond with the average
yield on GSec. Here the Yield on GSec is the data published by RBI and is yield on all the GSec of all
the maturities. The blue line which depicts the Coupon rate of each bond series is always more than
the red line which represents the Average GSec yield for the year. Also the gap between them,
termed as spread, is more or less constant and the movement is in tandem.


                                Coupon Rate Vs Avg Gsec Yield
     13.00%
     12.00%
     11.00%
     10.00%
      9.00%
      8.00%
      7.00%
      6.00%
      5.00%


                                                     Rate P.A.   Avg Yield of GS

                                                15
Figure 43 Coupon Rate of PG Vs Avg GSec Yield


14
  Source: http://www.rbi.org.in/scripts/PublicationsView.aspx?id=9483 ; www.nse-India.com (WDM
Segment)
15
     Source: www.Indiastat.com and www.nse-india.com

     108
Analysis of Fixed and Floating Interest Rates 2010

Floating Intrest for PGCIL’s Bonds
As mentioned before the Power Grid Corporation of India Limited has issued till date 32 series of
bonds and all at fixed coupon rate. Thus a study is being made to analyse the interest cost if the
company has gone for the floating rate.

Assumptions
Some of the assumptions taken for the purpose of computation and analysis of Floating rate costs
are as follows:

        Though the Floating rate deemed to have some additional costs for the company in terms of
         arrangers’ fees, internal records maintenance, database for computing reference rate, etc...
         But after speaking to the concerned persons in the company, it has been found that there
         will not be any substantial additional expenses in case of floating rate.
        It is assumed that the Arrangers, as usual will quote a 0% fees because of Ratings (highest
         rating) and also good credibility of the company.
        The company already has the Reuters database and subscribed to the FIMMDA access, thus
         it need not incur additional expenses for determination of reference rate and spread.
        For determining the spread in case of floating rate, as mentioned before usually the spread
         is determined by way of bidding or is determined by the merchant bankers and the issuer
         based on the market conditions. Since the calculations are made backward, thus the spread
         is computed based on the discussion with the Merchant banker16 on the actual industry
         practices of determining the spread.
        For computing the floating rate for each period, three different reference rates are taken
         based on other company’s practices.

Selection of Bonds
For the purpose of comparison under fixed and floating rates, the bonds on which the interest has
been made for 8 or more periods have been selected, so that a good study can be done. Also bonds
of different tenure, different repayment structure and different coupon rates have been taken so
that a comprehensive study for each kind of bond can be done. The details of Bonds selected are as
follows:

Bond               Date of        Loan         Coupon   Redemption         Maturity   Intrest     Loan        Repayment
Description        Drawn                       Rate     Date               (Yrs.)     Payment     Amount      Structure
                                                                                                  (Rs. Crs)
Bonds VIII         27-04-2000                  10.35%   4/2014             14         Half-Yrly   20.00       5 Yr.Moratorium
Issue                                                                                                         + 10 Eq Ann.Inst
Bonds IX           22-08-2000                  12.25%   8/2012             12         Half-Yrly   576.50      3 Yr.Moratorium
Issue                                                                                                         + 10 Eq Ann.Inst
Bonds    X         21-06-2001                  10.90%   6/2015             14         Annual      761.52      3 Yr.Moratorium
Issue                                                                                                         + 12 Eq Ann.Inst
Bonds XIII-        31-07-2002                  7.85%    07/2008            6          Annual      250.50      1 Yr.Moratorium
Issue                                                                                                         + 6 Eq Ann.Inst
Bonds XIV-         17-07-2003                  6.10%    07/2015            12         Annual      699.00      1 Yr.Moratorium
Issue                                                                                                         + 12 Eq Ann.Inst
Table 25 List of Bonds selected for Analysis


16
     Mr. Venkat Krishna, VP, ICICI Securities Primary Dealership Limited

     109
Analysis of Fixed and Floating Interest Rates 2010
The above list has each kind of bond:

        Meagre loan Amount
        Half Yearly Intrest Payment
        Longer Maturity of 14 years
        Shorter Maturity of 6 years
        Low coupon rate

Based on the above selection suitability of Fixed or Floating rate for each kind of bond can be
studied. And as mentioned before, the bonds that are issued in the year 2000, 2001, 2002 and 2003
are selected because the interest is already paid on them under fixed rate and now study can be
made under floating rate for the bonds.

Selection of Reference Rate

As mentioned before in case of a floating rate there is a Reference or Benchmark rate, based on
which the floating interest rate is determined. For computation of floating rate following reference
rates were considered.

   I.    Average Monthly yield of 10 Year GSec preceding the reset month
  II.    Average Yield of 10 year GSec for 12 months preceding the reset month.
         Average Yield of 10 year GSec for 6 months preceding the reset month ( for Semi Annual
         Intrest Payment)
 III.    Average of 1 Year GSec for the past 3 days preceding the reset date.


From the above three options, the option I, which is average of GSec yield for the month preceding
reset month, will depict the market condition of only the month immediately preceding the reset
month. But since the interest is paid for the 6 months or the 12 months, the base rate should truly
reflect the conditions of those 6 or 12 months.

In the Option II, this is Average Yield of 10 years GSec for the 12 months preceding the reset month
for the Annual Intrest payment and 6 months for semi-annual interest payment. On an assumption
that, the investor is a long term investor and has invested in the bonds for purpose of income and
not trade, 10 years GSec is considered. Also all the above selected bonds except one have an
average tenure of 9 years or 10 years, thus Yield on 10 years GSec is comparable.

Following Graph will depict the annualised yields of 10 years GSec monthly and also the moving
average from the period April 1998 to April 2010.


   110
Analysis of Fixed and Floating Interest Rates 2010

                                                                                                                        10 Year Gsec Yield
     14.00
     12.00
     10.00
      8.00
      6.00
      4.00
      2.00
      0.00
                         Sep-1998
                                    Feb-1999
                                                  Jul-1999


                                                                                                                                                                     Sep-2003
                                                                                                                                                                                Feb-2004
                                                                                                                                                                                             Jul-2004


                                                                                                                                                                                                                                                                                                                      Sep-2008
                                                                                                                                                                                                                                                                                                                                 Feb-2009
                                                                                                                                                                                                                                                                                                                                             Jul-2009
                                                             Dec-1999


                                                                                                                                                                                                        Dec-2004


                                                                                                                                                                                                                                                                                                                                                           Dec-2009
              Apr-1998


                                                                        May-2000


                                                                                                          Aug-2001


                                                                                                                                                          Apr-2003


                                                                                                                                                                                                                   May-2005


                                                                                                                                                                                                                                                       Aug-2006


                                                                                                                                                                                                                                                                                                          Apr-2008
                                                                                                                                             Nov-2002


                                                                                                                                                                                                                                                                                            Nov-2007
                                                                                    Oct-2000
                                                                                               Mar-2001


                                                                                                                       Jan-2002
                                                                                                                                  Jun-2002


                                                                                                                                                                                                                                 Oct-2005
                                                                                                                                                                                                                                            Mar-2006


                                                                                                                                                                                                                                                                   Jan-2007
                                                                                                                                                                                                                                                                                 Jun-2007
                                                                                       CLOSE                                            Moving Average ( 12 months)

                                                                                   17
Figure 44 Trend of 10 Yr GSec Yield

From the above graph, it can be clearly seen that, if we take monthly data as base rate, there are lots
of fluctuations and also the interest will get widely affected by the state of economy and market
conditions of a particular month. But in the other case, if average of the 12 or 6 months is taken, the
condition of market for the whole 12 or 6 months is taken care of. Thus Option I is not considered.

And In the option III, which is yield on one year GSec for the preceding 3 days of reset date. Here the
assumptions are

       The investor is not a long term investor and is holding the security for a short term period.
        Thus for him the interest must be based on the one year GSec.
       Also since the interest is paid for annual or semi-annual period, the base rate must also
        reflect the representation of the movements in Sort term Securities ( 1 year GSec)

The following graph portrays the movement of Annualised yield of 1 year GSec on daily basis for the
period between 01-01-1998 to 30-04-2010


                                                                                                                                                    IN1YT=RR
     14.00
     12.00
     10.00
      8.00
      6.00
      4.00
      2.00
      0.00
                                                                                                                                                                                                                                                                      Jan-2007
             Jan-1998


                                       Jan-1999


                                                                    Jan-2000


                                                                                               Jan-2001


                                                                                                                            Jan-2002


                                                                                                                                                        Jan-2003


                                                                                                                                                                                  Jan-2004


                                                                                                                                                                                                              Jan-2005


                                                                                                                                                                                                                                            Jan-2006


                                                                                                                                                                                                                                                                                                       Jan-2008


                                                                                                                                                                                                                                                                                                                                  Jan-2009


                                                                                                                                                                                                                                                                                                                                                                Jan-2010
                                                                                                                                                                                                                                                                                                                     Jul-2008
                         Jul-1998


                                                       Jul-1999


                                                                                   Jul-2000


                                                                                                            Jul-2001


                                                                                                                                         Jul-2002


                                                                                                                                                                     Jul-2003


                                                                                                                                                                                                 Jul-2004


                                                                                                                                                                                                                              Jul-2005


                                                                                                                                                                                                                                                        Jul-2006


                                                                                                                                                                                                                                                                                       Jul-2007


                                                                                                                                                                                                                                                                                                                                                Jul-2009


Figure 45 Trend of 1Yr GSec Yield


17
     Source: Reuters Database

     111
Analysis of Fixed and Floating Interest Rates 2010


From both the graphs showing trend of each 10 year and 1 year GSec Yield, it can be seen that, the
yield is fluctuating over the period and the benefits of fluctuation can be taken.

And if we analyse the Coupon rate of PGCIL Bonds Movement of the issues till date, the trend is as
follows,


                                                 PGBonds
   12.00%
   10.00%
    8.00%
    6.00%
    4.00%
    2.00%
    0.00%


Figure 46 Trend of Coupon Rates of PG Bonds

The curve if compared with the GSec yield it can be seen that the movement in the line is in tandem
with the movement of yield. Thus if the company goes for the floating instead of fixed, this can be
justified by the following graph.

  14.000%
                                      1 Yr Gsec Yield Vs PG Bonds
  12.000%
  10.000%
   8.000%
   6.000%
   4.000%
   2.000%
   0.000%


                                                 IN1YT=RR    PG Rate

Figure 47 Rates of PG Bonds Vs 1 Yr GSec Yield


   112
Analysis of Fixed and Floating Interest Rates 2010
Some of the points to be mentioned are:

     The Blue Circles and Rhombus represent the Coupon rate on the PGCIL Bonds and the red
      line depicts the daily yield on 1 year GSec Yield.
     The Blue Circles represent the Coupon rate of Bonds selected for the study.
     The blue circles are selected in such a case that they represent both at a low yield and also
      at a high yield.
     From the period Jan 2009 onwards the yield has been very low when compared to the
      coupon rate.
     And the gap between the Blue Dots and the red line is considered as the spread. The spread
      has been increasing by the fall in Yield from Jan-2008 onwards.
     Also for first four issues, the corporate payment was half yearly. Thus the interest rate was
      annualised to have a better comparison with the annualised yield.

Reset Period and Reference Period

One of the three main parameters to be determined is the Reset period. It is the period at which the
Intrest rate is reset as per the reference rate. In case of Floating rate, though it is termed as floating,
but the Intrest rate does not change daily, it is reset and calculated at a predetermined period. In
our case the reset date is 12 months in case of Annual interest payment and is 6 months for Semi-
Annual Intrest payment.

Though the interest rate is reset every 12/6 months, but the reference period is also to be
determined. In simple words, the reference period implies, for the purpose of computation of base
rate the data pertaining to which period shall be taken.

In this case, following two situations are considered:

    1. Data pertaining to the period preceding the coupon period. For Instance, in case of Semi
       annual interest payment falling due on 22nd August 2003, then the coupon period starts
       from 22nd February 2003. Thus Average yield of 6 months preceding the 22nd February 2003
       will be considered. i.e... August 2002 to January 2003 will be considered.
    2. The second option is, data pertaining to the period preceding the Intrest payment date. For
       Instance, in case of Semi annual interest payment falling due on 22nd August 2003, then the
       average yield of 6 months preceding the 22nd August 2003 will be considered. i.e... February
       2003 to July 2003 will be considered.

    For the present study both the reference periods have been considered.

Spread

The last parameter to be determined in case of Floating rate is the spread. Depending upon the
reference rate selected, the spreads will be different. And as mentioned before, the spread will
remain constant for the whole tenure of the Bond. Thus it is very crucial thing to determine the
spread. Usually in actual cases a range is to be determined, and the exact spread is determined
based on the bidding process. But for the purpose of study, based on discussion with the


   113
Analysis of Fixed and Floating Interest Rates 2010
experienced persons and merchant bankers on the actual practice in the industry is understood and
in consultation with them the spread is determined using relevant past data.

For purpose of Option II ( 12/ 6 months average yield of 10 years GSec), the spread is taken as
average spread for AAA Bonds for the tenure of 10 years for last 5 days preceding the date of issue.

For the purpose of Option III (3 days average of yield on 1 year GSec), the spread is taken as
difference between base rate as on date of issue and the coupon rate. The rationale behind this is,
since the coupon rate is determined by adding the Spread to the prevailing interest rate on 10 years
GSec, just the gap between the 1 year GSec and the Coupon rate can be taken as spread.

Floating Rate under Reference Rate of Average yield of 1 Year GSec
Bond VIII


Date of Issue: 27th April, 2000

Intrest Payment: Semi Annually

Coupon Rate: 10.35%

Loan Amount: Rs. 20 Crores

Repayment: 5 years Moratorium and 10 equal Instalments

Maturity: 27th April, 2014

Determination of Spread
Since the date of issue is 27th April, 2000, the average yields of 3 days preceding i.e... 24th, 25th and
26th April, 2000 is computed and the difference between the average and coupon rate is calculated
and the difference turned up to be 1.036% or 103.6 basis points. The computation is as follows:

 Date             Yield-1yr GSec            Average yield             Coupon Rate      Spread
 26-04-2000       9.291
 25-04-2000       9.306                     9.3140%                   10.35%           1.03600%
 24-04-2000       9.345                     931.40%
Table 26 Determination of Spread for PGVIII for 1 year GSec as Reference Rate

Computation of Floating Rate
 Average Yield of 1 years GSec ( 3 days preceding Intrest rate)
 Intrest                                                                        Floating       Fixed
 Payment         Reference Period         Average Govt yield         Spread     rate           rate
 27-Oct-00       Oct- 23, 24, 25              10.39233%              1.036%          11.428%     10.35%
 Apr-01          Apr- 23, 24, 26               8.88833%              1.036%           9.924%     10.35%
 Oct-01          Oct- 23, 24, 25               6.89533%              1.036%           7.931%     10.35%
 Apr-02          Apr- 23, 24, 26               6.17367%              1.036%           7.210%     10.35%
 Oct-02          Oct- 23, 24, 25               5.64967%              1.036%           6.686%     10.35%
 Apr-03          Apr- 23, 24, 25               5.12000%              1.036%           6.156%     10.35%
 Oct-03          Oct- 22, 23, 24               4.71800%              1.036%           5.754%     10.35%
 Apr-04          Apr- 21, 22, 23               4.48700%              1.036%           5.523%     10.35%

   114
Analysis of Fixed and Floating Interest Rates 2010
 Oct-04          Oct- 21, 25, 26                  5.52533%             1.036%             6.561%       10.35%
 Apr-05          Apr- 21, 25, 26                  5.68333%             1.036%             6.719%       10.35%
 Oct-05          Oct- 24, 25, 26                  5.82767%             1.036%             6.864%       10.35%
 Apr-06          Apr- 24, 25, 26                  6.22600%             1.036%             7.262%       10.35%
 Oct-06          Oct- 20, 23, 26                  6.99133%             1.036%             8.027%       10.35%
 Apr-07          Apr- 24, 25, 26                  7.86667%             1.036%             8.903%       10.35%
 Oct-07          Oct- 24, 25, 26                  6.85867%             1.036%             7.895%       10.35%
 Apr-08          Apr- 23, 24, 25                  7.85000%             1.036%             8.886%       10.35%
 Oct-08          Oct- 22, 23, 24                  7.37800%             1.036%             8.414%       10.35%
 Apr-09          Apr- 22, 23, 24                  4.07600%             1.036%             5.112%       10.35%
 Oct-09          Oct- 22, 23, 26                  4.47700%             1.036%             5.513%       10.35%
 Apr-10          Apr- 22, 23, 26                  4.92367%             1.036%             5.960%       10.35%
Table 27 Floating rates for PGVIII for 1 year GSec as Reference Rate

Notes:

     Though the bond will mature in the year 2014, the interest payment till 27 th April 2010 can
      be compared because of unavailability of data.
     In case of reference period, the three days preceding the interest payment date is
      considered. Thus in this case, since the interest is to be paid on 27th of August and April, the
      reference period should be 24th, 25th and 26th. But in case, if wither of 3 days is a holiday,
      and no trade has been taken place the working days preceding to the holiday is considered.

Comparison of Intrest on Fixed and Floating Rate
                                                                                                            (Rs Crs.)

 Intrest Payment-Fixed                                            Intrest Payment-Floating
            Opening                                                           Opening
 Year       Balance       Redemption         Interest             Year        Balance          Redemption   Interest
 Oct-00          20                0              1.035            Oct-00          20                   0   1.142833
 Apr-01          20                0              1.035            Apr-01          20                   0   0.992433
 Oct-01          20                0              1.035            Oct-01          20                   0   0.793133
 Apr-02          20                0              1.035            Apr-02          20                   0   0.720967
 Oct-02          20                0              1.035            Oct-02          20                   0   0.668567
 Apr-03          20                0              1.035            Apr-03          20                   0      0.6156
 Oct-03          20                0              1.035            Oct-03          20                   0      0.5754
 Apr-04          20                0              1.035            Apr-04          20                   0      0.5523
 Oct-04          20                0              1.035            Oct-04          20                   0   0.656133
 Apr-05          20                2              1.035            Apr-05          20                   2   0.671933
 Oct-05          18                0             0.9315            Oct-05          18                   0    0.61773
 Apr-06          18                2             0.9315            Apr-06          18                   2    0.65358
 Oct-06          16                0              0.828            Oct-06          16                   0   0.642187
 Apr-07          16                2              0.828            Apr-07          16                   2   0.712213
 Oct-07          14                0             0.7245            Oct-07          14                   0   0.552627
 Apr-08          14                2             0.7245            Apr-08          14                   2    0.62202
 Oct-08          12                0              0.621            Oct-08          12                   0    0.50484
 Apr-09          12                2              0.621            Apr-09          12                   2    0.30672
 Oct-09          10                0             0.5175            Oct-09          10                   0    0.27565
 Apr-10          10                2             0.5175            Apr-10          10                   2   0.297983
                                                 17.595                                                     12.57485
Table 28 Intrest under Fixed and Floating rates for PGVIII for 1 year GSec as Reference Rate


   115
Analysis of Fixed and Floating Interest Rates 2010

                                                               VIII ( 1 Yr Gsec)
   1.2
     1
   0.8
   0.6                                                                                                               Intrest Payment-Fixed
   0.4
   0.2                                                                                                               Intrest Payment-
     0                                                                                                               Floating
                  Aug-01


                                    Apr-03


                                                                        Aug-06


                                                                                          Apr-08
                                             Feb-04


                                                                                                   Feb-09
                           Jun-02


                                                      Dec-04


                                                                                 Jun-07


                                                                                                            Dec-09
         Oct-00


                                                               Oct-05


Figure 48 Intrest Payments under Fixed and Floating Rate for PGVIII for 1 year GSec as Reference Rate

From the above table and chart, it is clearly visible that, the company would have been able to save
Rs. 5, 02,015,000 (Rs.50.2 Million) if it had issued the bond at floating rate. Also from the we can see
that, during the moratorium period, during which the project is not yet operational, the interest
payment in case of Floating rate ( as depicted by red line) is very less when compared to the same
under fixed rate ( represented by the line blue). And the payment towards interest (if the principal
payment is ignored) the amount towards debt obligation is always less in case of floating rate except
the initial interest payment.

Bond IX


Date of Issue: 22nd August, 2000

Intrest Payment: Semi Annually

Coupon Rate: 12.25%

Loan Amount: Rs. 576.50 Crores

Repayment: 3 years Moratorium and 10 equal Instalments

Maturity: 22nd August, 2012

Determination of Spread
Since the date of issue 22nd August, 2000, the average yield of 3 working days preceding i.e... 16 th,
17th and 18th August, 2000 is computed and the difference between the average and coupon rate is
calculated and the difference turned up to be 1.52% or 152 basis points. The computation is as
follows:

 Date                        Yield-1yr GSec                                                Average yield              Coupon rate       Spread
 18-08-2000                  10.751
 17-08-2000                  10.839                                                        10.730%                    12.25%            1.5203300%
 16-08-2000                  10.599                                                        10.72967
Table 29 Calculation of Spread for PGIX for 1 year GSec as Reference Rate


   116
Analysis of Fixed and Floating Interest Rates 2010
Computation of Floating Rate
 Average Yield of 1 years GSec ( 3 days preceding Intrest rate)
 Intrest
 Payment          Reference Period           Average Govt yield          Spread       Floating rate   Fixed rate
 22-Feb-01        Feb- 15, 16, 20                  9.32%                  1.520%         10.8393%          12.25%
 22-Aug-01        Aug- 16, 17, 20                  7.18%                  1.520%          8.7040%          12.25%
 Feb-02           Feb- 19, 20, 21                  6.37%                  1.520%          7.8920%          12.25%
 Aug-02           Aug- 19, 20, 21                  6.02%                  1.520%          7.5433%          12.25%
 Feb-03           Feb- 19, 20, 21                  5.92%                  1.520%          7.4447%          12.25%
 Aug-03           Aug- 19, 20, 21                  4.97%                  1.520%          6.4947%          12.25%
 Feb-04           Feb- 17, 19, 20                  4.56%                  1.520%          6.0797%          12.25%
 Aug-04           Aug- 17, 18, 19                  5.33%                  1.520%          6.8503%          12.25%
 Feb-05           Feb- 17, 18, 20                  5.74%                  1.520%          7.2627%          12.25%
 Aug-05           Aug- 17, 18, 19                  5.70%                  1.520%          7.2180%          12.25%
 Feb-06           Feb- 17, 20, 21                  6.89%                  1.520%          8.4110%          12.25%
 Aug-06           Aug- 17, 18, 21                  6.86%                  1.520%          8.3820%          12.25%
 Feb-07           Feb- 19, 20, 21                  7.62%                  1.520%          9.1403%          12.25%
 Aug-07           Aug- 16, 17, 21                  7.15%                  1.520%          8.6723%          12.25%
 Feb-08           Feb- 19, 20, 21                  7.55%                  1.520%          9.0713%          12.25%
 Aug-08           Aug- 18, 20, 21                  9.30%                  1.520%         10.8230%          12.25%
 Feb-09           Feb- 17, 18, 19                  4.80%                  1.520%          6.3250%          12.25%
 Aug-09           Aug- 18, 20, 21                  4.64%                  1.520%          6.1567%          12.25%
 Feb-10           Feb- 17, 18, 19                  5.04%                  1.520%          6.5573%          12.25%
Table 30 Floating Rates for PGIX for 1 year GSec as Reference Rate

Comparison of Interest on Fixed and Floating Rate
                                                                                                           (Rs Crs.)

 Intrest Payment-Fixed                                           Intrest Payment-Floating
               Opening                                                         Opening
 Year          Balance       Redemption        Interest          Year          Balance        Redemption    Interest
   Feb-01         576.5               0         35.3106           Feb-01          576.5                0       31.24437
   Aug-01         576.5               0         35.3106           Aug-01          576.5                0       25.08927
   Feb-02         576.5               0         35.3106           Feb-02          576.5                0       22.74868
   Aug-02         576.5               0         35.3106           Aug-02          576.5                0       21.74365
   Feb-03         576.5               0         35.3106           Feb-03          576.5                0       21.45924
   Aug-03         576.5           57.65         35.3106           Aug-03          576.5            57.65       18.72087
   Feb-04       518.85                0         31.7796           Feb-04        518.85                 0       15.77217
   Aug-04       518.85            57.65         31.7796           Aug-04        518.85             57.65       17.77147
   Feb-05         461.2               0         28.2485           Feb-05          461.2                0        16.7477
   Aug-05         461.2           57.65         28.2485           Aug-05          461.2            57.65        16.6447
   Feb-06       403.55                0         24.7174           Feb-06        403.55                 0       16.97129
   Aug-06       403.55            57.65         24.7174           Aug-06        403.55             57.65       16.91277
   Feb-07         345.9               0         21.1864           Feb-07          345.9                0        15.8082
   Aug-07         345.9           57.65         21.1864           Aug-07          345.9            57.65       14.99879
   Feb-08       288.25                0         17.6553           Feb-08        288.25                 0       13.07405
   Aug-08       288.25            57.65         17.6553           Aug-08        288.25             57.65       15.59864
   Feb-09         230.6               0         14.1243           Feb-09          230.6                0       7.292721
   Aug-09         230.6           57.65         14.1243           Aug-09          230.6            57.65       7.098633
   Feb-10       172.95                0         10.5932           Feb-10        172.95                 0       5.670451
                                               497.8798                                                        321.3677
Table 31 Interest under Fixed and Floating Rates for PGIX for 1 year GSec as Reference Rate

   117
Analysis of Fixed and Floating Interest Rates 2010

                                                          IX ( 1 Yr Gsec)
   40.0000
   35.0000
   30.0000
   25.0000
   20.0000                                                                                                      Intrest Payment-Fixed
   15.0000
   10.0000                                                                                                      Intrest Payment-
                                                                                                                Floating
    5.0000
    0.0000
                                        Aug-03


                                                          Apr-05


                                                                                              Aug-08
             Feb-01
                      Dec-01


                                                                   Feb-06
                                                                            Dec-06
                               Oct-02


                                                 Jun-04


                                                                                     Oct-07


                                                                                                       Jun-09

Figure 49 Interest Payment under Fixed and Floating rates for PGIX for 1 year GSec as Reference Rate

In this case the Intrest under floating rate is much lower than the fixed rate. The main reasons are

     When this series was issued the market conditions were not favourable.
     Due to hike in CRR, the Bank rates and GSec rates hiked up,
     Most of the nationalised banks increased their PLR
     60% of Annual borrowings by GoI during the current year amounting to approx. Rs.1,20,000
      Crores is yet to be raised
     All the above mentioned points may bring an upward pressure in GSec rates thus the coupon
      rate was fixed with the spread of 75 basis points over the prevailing rate of 10 years GSec.

The company would have been able to save up to Rs.176, 51, 21,000 (Rs. 1.765 Billion) if it had
issued the bond at floating rate. Also the amount towards debt obligation both in case of fixed and
floating rate is falling over the period because of equal redemption towards principal.

Bond X


Date of Issue: 21st June, 2001

Intrest Payment: Annual

Coupon Rate: 10.90%

Loan Amount: Rs. 761.52 Crores

Repayment: 3 years Moratorium and 12 equal Instalments

Maturity: 21st June, 2015


   118
Analysis of Fixed and Floating Interest Rates 2010
Determination of Spread
Since the date of issue 21st June, 2001, the average yield of 3 working days preceding i.e... 18th, 19th
and 20th June, 2001 is computed and the difference between the average and coupon rate is
calculated and the difference turned up to be 2.69% or 269 basis points. The computation is as
follows:

 Date                 Yield-1yr GSec         Average yield                   Coupon rate       Spread
 20-06-2001           8.151
 19-06-2001           8.20                   8.21%                           10.90%            2.69%
 18-06-2001           8.276                  8.209
Table 32 Calculation of Spread for PGX for 1 year GSec as Reference Rate

Computation of Floating Rate
                 Average Yield of 1 years GSec ( 3 days preceding Interest rate)
 Interest
 Payment        Reference Period           Average Govt yield           Spread       Floating rate   Fixed rate
 21-Jun-02      June 20, 19, 18                 6.756%                    2.69%            9.447%        10.90%
 Jun-03         June 20, 19, 18                 5.070%                    2.69%            7.761%        10.90%
                                18
 Jun-04         June 18, 17, 16                 3.994%                    2.69%            6.685%        10.90%
                                1
 Jun-05         June 20, 17, 16                 5.738%                    2.69%            8.429%        10.90%
                                1
 Jun-06         June 20, 19, 16                 6.988%                    2.69%            9.679%        10.90%
 Jun-07         June 20, 19, 18                 7.863%                    2.69%          10.554%         10.90%
 Jun-08         June 20, 19, 18                 8.421%                    2.69%          11.112%         10.90%
                                1
 Jun-09         June 19, 18, 17                 4.124%                    2.69%            6.815%        10.90%
Table 33 Floating rates for PGX for 1 year GSec as Reference Rate

Comparison of Intrest on Fixed and Floating Rate
                                                                                                         (Rs Crs.)

              Interest Payment-Fixed                                         Interest Payment-Floating
             Opening                                                         Opening
 Year        Balance        Redemption         Interest             Year     Balance        Redemption     Interest
  Jun-02       761.52                0          83.00568            Jun-02       761.52               0     71.93826
  Jun-03       761.52                0          83.00568            Jun-03       761.52               0     59.10157
  Jun-04       761.52            63.46          83.00568            Jun-04       761.52           63.46     50.90761
  Jun-05       698.06            63.46          76.08854            Jun-05       698.06           63.46      58.8418
  Jun-06        634.6            63.46           69.1714            Jun-06        634.6           63.46     61.42293
  Jun-07       571.14            63.46          62.25426            Jun-07       571.14           63.46     60.27812
  Jun-08       507.68            63.46          55.33712            Jun-08       507.68           63.46      56.4134
  Jun-09       444.22            63.46          48.41998            Jun-09       444.22           63.46     30.27359
                                               560.2883                                                    449.1773
Table 34 Interest under fixed and floating Rate for PGX for 1 year GSec as Reference Rate


18
  Since one of the 3 days preceding the interest payment day was a holiday, the days preceding the holiday
has been considered.

     119
Analysis of Fixed and Floating Interest Rates 2010

                                   X ( 1 Yr Gsec)
   90
   80
   70
   60
   50                                                                    Interest Payment-
   40                                                                    Fixed
   30
                                                                         Interest Payment-
   20                                                                    Floating
   10
    0


Figure 50 Interest Payment under Fixed and Floating Rates for PGX for 1 year GSec as Reference Rate

The Bond series was issued during June 2001, which was characterised by favourable market
condition. The coupon rate was fixed after considering the spread of 65 to 90 basis points above the
GSec of similar maturity. Thus the company was able to issue its bonds at a coupon rate of 10.90%.
But if the interest payment is compared with that of Floating rate there is a scope of savings of
Rs.111,11,111,000 ( Approx Rs.1.1 Billion)

Also if we see the interest rates, there has been a dip in the interest rate under floating rate in the
year 2003, 2004 and 2009, leading to a huge gap between both the methods.

Bond XIII- Opt II


Date of Issue: 31st July, 2002

Intrest Payment: Annually

Coupon Rate: 7.85%

Loan Amount: Rs. 250.50 Crores

Repayment: 1 year Moratorium and 6 equal Instalments

Maturity: 31st July, 2008


Determination of Spread
Since the date of issue 31st July, 2002, the average yield of 3 working days preceding i.e... 26th, 29th
and 30th July, 2000 is computed and the difference between the average and coupon rate is
calculated and the difference turned up to be 1.794% or approx 180 basis points. The computation is
as follows:


   120
Analysis of Fixed and Floating Interest Rates 2010
 Date             Yield-1yr GSec         Average yield        Coupon rate         Spread
 30-07-2002       6.087
 29-07-2002       6.091                  6.056%               7.85%               1.79400%
 26-07-2002       5.99                   6.05600
Table 35 Calculation of Spread for PGXIII for 1 year GSec as Reference Rate

Computation of Floating Rate
                  Average Yield of 1 years GSec ( 3 days preceding Intrest rate)
 Interest
 Payment       Reference Period          Average Govt yield            Spread       Floating rate     Fixed rate
 31-Jul-03     Jul- 25, 28, 29                4.8430%                  1.7940%            6.6370%          7.85%
 Jul-04        Jul- 28, 29, 30                4.8477%                  1.7940%            6.6417%          7.85%
 Jul-05        Jul- 25, 26, 29                5.8010%                  1.7940%            7.5950%          7.85%
 Jul-06        Jul- 26, 27, 28                6.9283%                  1.7940%            8.7223%          7.85%
 Jul-07        Jul- 26, 27, 30                6.7923%                  1.7940%            8.5863%          7.85%
 Jul-08        Jul- 28, 29, 30                9.4020%                  1.7940%           11.1960%          7.85%
Table 36 Floating Rates for PGXIII for 1 year GSec as Reference Rate

Comparison of Intrest on Fixed and Floating Rate
                                                                                                             (Rs Crs.)

              Interest Payment-Fixed                                            Interest Payment-Floating
             Opening                                                           Opening
 Year        Balance        Redemption         Interest           Year         Balance          Redemption     Interest
  Jul-03        250.5            41.75          19.66425           Jul-03           250.5            41.75        16.62569
  Jul-04       208.75            41.75          16.38688           Jul-04          208.75            41.75        13.86448
  Jul-05          167            41.75           13.1095           Jul-05             167            41.75        12.68365
  Jul-06       125.25            41.75          9.832125           Jul-06          125.25            41.75        10.92472
  Jul-07         83.5            41.75           6.55475           Jul-07            83.5            41.75        7.169588
  Jul-08        41.75            41.75          3.277375           Jul-08           41.75            41.75         4.67433
                                               68.82488                                                        65.94246
Table 37 Interest Under Fixed and Floating rates for PGXIII for 1 year GSec as Reference Rate


                            XIII- Opt-II ( 1 Yr Gsec)
      25
      20
      15
                                                                              Interest Payment-
      10                                                                      Fixed
       5                                                                      Interest Payment-
                                                                              Floating
       0


 Figure 51 Interest Payments under Fixed and Floating Rates for PGXIII for 1 year GSec as
 Reference Rate


   121
Analysis of Fixed and Floating Interest Rates 2010


The bond was issued at the coupon rate of 7.85% and is one the lower rates among the all PGCIL
Bonds. This is mainly because of its short tenure and also favourable market conditions.

Since the bond is issued for a short duration of 6 years and also due to low coupon rate there is a
nominal saving of Rs. 2,88,242,000 (Approx Rs. 28 Million). Also since the floating rate is pertaining
to a small period, there have been not many fluctuations. Thus the pattern of outflows with respect
to interest payment under both the methods viz fixed and floating is almost same.

Bond XIV


Date of Issue: 17th July, 2003

Intrest Payment: Annually

Coupon Rate: 6.10%

Loan Amount: Rs. 699 Crores

Repayment: 1 year Moratorium and 12 equal Instalments

Maturity: 17th July, 2015

Determination of Spread
Since the date of issue 17th July, 2003, the average yield of 3 working days preceding i.e... 14th, 15th
and 16th July, 2003 is computed and the difference between the average and coupon rate is
calculated and the difference turned up to be 5.87% or approx 587 basis points. The computation is
as follows:

 Date             Yield-1yr GSec        Average yield        Coupon rate        Spread
 16-07-2003       5.028
 15-07-2003       5.027                 5.0273%              6.10%              1.072700%
 14-07-2003       5.027                 5.0273
Table 38 Calculation of Spread for PGXIV for 1 year GSec as Reference Rate

Computation of Floating Rate
                 Average Yield of 1 years GSec ( 3 days preceding Intrest rate)
 Interest
 Payment       Reference Period        Average Govt yield             Spread   Floating rate   Fixed rate
 17-Jul-04     Jul- 14, 15, 16               4.800%                   1.073%         5.8724%        6.10%
 Jul-05        Jul- 13, 14, 15               5.844%                   1.073%         6.9170%        6.10%
 Jul-06        Jul- 14, 13, 12               7.006%                   1.073%         8.0790%        6.10%
 Jul-07        Jul- 16, 13, 12               6.972%                   1.073%         8.0450%        6.10%
 Jul-08        Jul- 14, 15, 16               9.459%                   1.073%       10.5317%         6.10%
 Jul-09        Jul- 14, 15, 16               3.948%                   1.073%         5.0210%        6.10%
Table 39 Floating Rates for PGXIV for 1 year GSec as Reference Rate


   122
Analysis of Fixed and Floating Interest Rates 2010
Comparison of Intrest on Fixed and Floating Rate
                                                                                                             (Rs Crs.)

              Interest Payment-Fixed                                          Interest Payment-Floating
             Opening                                                           Opening
 Year        Balance          Redemption        Interest              Year     Balance          Redemption    Interest
  Jul-04         761.52                0        46.45272             Jul-04      761.52                  0    44.71925
  Jul-05         761.52                0        46.45272             Jul-05      761.52                  0    52.67459
  Jul-06         761.52            63.46        46.45272             Jul-06      761.52              63.46    61.52345
  Jul-07         698.06            63.46        42.58166             Jul-07      698.06              63.46    56.15916
  Jul-08          634.6            63.46         38.7106             Jul-08       634.6              63.46    66.83417
  Jul-09         571.14            63.46        34.83954             Jul-09      571.14              63.46    28.67713
                                                   255.49                                                     310.5878
Table 40 Interests under Fixed and Floating rates for PGXIV for 1 year GSec as Reference Rate


                                  XIV (1 yr Gsec)
   120
   100
    80
    60                                                                    Interest Payment-
                                                                          Floating
    40
                                                                          Interest Payment-
    20                                                                    Fixed
      0


Figure 52 Interest Payments under Fixed and Floating Rate for PGXIV for 1 year GSec as Reference Rate

At the time of the issue the yield in Govt Bonds dipped to lows. The interest rates on GSec also fell
by around 115 basis points. The yield on the govt Bonds of 10 year maturity fell 5.75% indicating a 45
basis points fall. Thus the company was able to issue the bonds at a very low coupon rate of just
6.10% which is the lowest rate among all the series of bonds issued till date by the Power Grid
Corporation of India Limited.

Thus in this case it is highly beneficial for the firm to go for fixed rate. The company would have
ended up paying excess of amount Rs. 55, 09, 77,000 (Approx 550 million) towards interest rate if it
had gone for floating rate.


   123
Analysis of Fixed and Floating Interest Rates 2010
Floating Rate under Reference Rate of Average yield of 10 year GSec
After analysing the costs under the floating rate with reference rate as INBMK 1 Year GSec Yield, the
study has been done by taking reference rate as average yield of 10 year GSec for the 12 months.
Most of the bonds has the repayment structure of 4 years of Moratorium Period and then followed
by 12 annual equal repayment of the principle parts. Thus the average tenure turns up to 9 years.
Since there is no GSec of tenure 9 years, 10 years GSec can be taken as benchmark.

Intrest payment, floating rate and the total payment under both the cases Fixed and floating for
each bond is explained in the following part. Also the reference period is yield of GSec for the 6
months preceding the coupon period for the semi-annual interest payments ( and 12 months for
annual interest payments), and the rate will be determined at the beginning of coupon period.

Bond VIII

Determination of Spread
In this case, since the spread was not available for the preceding 6 months of the month of issue,
the spread of AAA Bonds over 10 year GSec Bond as published by FIMMDA ( Fixed Income and
Monet Market Association) , for the days preceding the opening of offer has been taken as the
spread. Though this spread is for the purpose of Fixed Coupon rate, the same spread is considered
for the floating rate despite the fact that there is less risk for the investors in case of floating rate as
the rate determined is truly reflected by the prevailing market conditions.

During the issue of this series, Market expected a cut in CRR and a fall in GSec ate due to the cut in
CRR. But the situation reversed and though the CR fell, but the rate on GSec 10 years papers
increased. Of the total issue size just 10% was proclaimed. And though the Intrest rates on GSec
increased to 10.70%, the coupon rate was fixed at 10.35%

Though the spread was negative, the spread of 100 basis point (1%) has been taken as the principle
of conservatism.

Computation of Floating Rate
 Average Yield for 10Yrs GSec( 6 Months preceding Coupon period)
 Intrest
 Payment       Reference Period        Average Govt yield      Spread     Floating rate     Fixed rate
 Oct-00        Oct 99 to Mar 00             11.03%              1.00%           12.026%         10.35%
 Apr-01        Apr 00 to Sep 00             11.11%              1.00%           12.108%         10.35%
 Oct-01        Oct 00 to Mar 01             10.78%              1.00%           11.777%         10.35%
 Apr-02        Apr 01 to Sep 01              9.49%              1.00%           10.493%         10.35%
 Oct-02        Oct 01 to Mar 02              7.86%              1.00%            8.863%         10.35%
 Apr-03        Apr 02 to Sep 02              7.37%              1.00%            8.369%         10.35%
 Oct-03        Oct 02 to Mar 03              6.28%              1.00%            7.280%         10.35%
 Apr-04        Apr 03 to Sep 03              5.57%              1.00%            6.574%         10.35%
 Oct-04        Oct 03 to Mar 04              5.17%              1.00%            6.174%         10.35%
 Apr-05        Apr 04 to Sep 04              5.79%              1.00%            6.793%         10.35%
 Oct-05        Oct 04 to Mar 05              6.77%              1.00%            7.772%         10.35%
 Apr-06        Apr 05 to Sep 05              7.07%              1.00%            8.075%         10.35%
 Oct-06        Oct 05 to Mar 06              7.27%              1.00%            8.268%         10.35%
 Apr-07        Apr 06 to Sep 06              7.82%              1.00%            8.824%         10.35%
 Oct-07        Oct 06 to Mar 07              7.73%              1.00%            8.732%         10.35%

   124
Analysis of Fixed and Floating Interest Rates 2010
 Apr-08          Apr 07 to Sep 07                     8.03%               1.00%              9.029%    10.35%
 Oct-08          Oct 07 to Mar 08                     7.75%               1.00%              8.746%    10.35%
 Apr-09          Apr 08 to Sep 08                     8.57%               1.00%              9.574%    10.35%
 Oct-09          Oct 08 to Mar 09                     6.57%               1.00%              7.567%    10.35%
 Apr-10          Apr 09 to Sep 09                     6.90%               1.00%              7.901%    10.35%
 Oct-10          Oct 09 to Mar 10                     7.57%               1.00%              8.571%    10.35%
Table 41 Floating Rates for PGVIII for 10 Year GSec

Comparison of Intrest on Fixed and Floating Rate
                                                                                                        (Rs Crs.)

              Intrest Payment-Fixed                                           Intrest Payment-Floating
              Opening                                                             Opening
 Year         Balance       Redemption         Interest             Year          Balance     Redemption    Interest
 Oct-00             20               0            1.035              Oct-00             20              0      1.2026
 Apr-01             20               0            1.035              Apr-01             20              0   1.210817
 Oct-01             20               0            1.035              Oct-01             20              0   1.177733
 Apr-02             20               0            1.035              Apr-02             20              0   1.049267
 Oct-02             20               0            1.035              Oct-02             20              0   0.886317
 Apr-03             20               0            1.035              Apr-03             20              0    0.83685
 Oct-03             20               0            1.035              Oct-03             20              0       0.728
 Apr-04             20               0            1.035              Apr-04             20              0      0.6574
 Oct-04             20               0            1.035              Oct-04             20              0   0.617417
 Apr-05             20               2            1.035              Apr-05             20              2   0.679317
 Oct-05             18               0           0.9315              Oct-05             18              0    0.69948
 Apr-06             18               2           0.9315              Apr-06             18              2   0.726705
 Oct-06             16               0            0.828              Oct-06             16              0   0.661467
 Apr-07             16               2            0.828              Apr-07             16              2    0.70588
 Oct-07             14               0           0.7245              Oct-07             14              0   0.611205
 Apr-08             14               2           0.7245              Apr-08             14              2   0.631995
 Oct-08             12               0            0.621              Oct-08             12              0    0.52477
 Apr-09             12               2            0.621              Apr-09             12              2    0.57446
 Oct-09             10               0           0.5175              Oct-09             10              0   0.378325
 Apr-10             10               2           0.5175              Apr-10             10              2   0.395067
 Oct-10              8               0            0.414              Oct-10              8              0    0.34282
                                                 18.009                                                     15.29789
Table 42 Interests under Fixed and Floating for PGVIII for 10 Year GSec

Bond IX


Determination of Spread
In this case, the spread is calculated as the average spread for the 6 months preceding the issue
month for AAA Bonds for 10 years Duration as published by FIMMDA. The Spread turns up at 0.75%
or 75 basis points. The computation is as follows:

Avg Spread for AAA
Bonds for 10 Years
Jul-00             74
Jun-00             77
May-00             72
Apr-00             80

   125
Analysis of Fixed and Floating Interest Rates 2010
Mar-00                  70
Feb-00                  75

Avg.            74.66667
                                                                            19
Table 43 Calculation of Spread for PGX for 10 year GSec as Reference Rate

Computation of Floating Rate
 Average Yield for 10Yrs GSec( 6 Months preceding Coupon period)
 Intrest
 Payment       Reference Period         Average Govt yield            Spread       Floating rate   Fixed rate
 Feb-01        Feb-00 to Jul-00               10.79%                   0.75%           11.5442%        12.25%
 Aug-01        Aug-00 to Jan-01               11.22%                   0.75%           11.9663%        12.25%
 Feb-02        Feb-01 to Jul-01                9.86%                   0.75%           10.6057%        12.25%
 Aug-02        Aug-01 to Jan-02                8.41%                   0.75%             9.1612%       12.25%
 Feb-03        Feb-02 to Jul-02                7.47%                   0.75%             8.2233%       12.25%
 Aug-03        Aug-02 to Jan-03                6.66%                   0.75%             7.4127%       12.25%
 Feb-04        Feb-03 to Jul-03                5.84%                   0.75%             6.5890%       12.25%
 Aug-04        Aug-03 to Jan-04                5.18%                   0.75%             5.9262%       12.25%
 Feb-05        Feb-04 to Jul-04                5.47%                   0.75%             6.2200%       12.25%
 Aug-05        Aug-04 to Jan-05                6.63%                   0.75%             7.3803%       12.25%
 Feb-06        Feb-05 to Jul-05                6.91%                   0.75%             7.6580%       12.25%
 Aug-06        Aug-05 to Jan-06                7.15%                   0.75%             7.8960%       12.25%
 Feb-07        Feb-06 to Jul-06                7.73%                   0.75%             8.4753%       12.25%
 Aug-07        Aug-06 to Jan-07                7.66%                   0.75%             8.4125%       12.25%
 Feb-08        Feb-07 to Jul-07                8.04%                   0.75%             8.7875%       12.25%
 Aug-08        Aug-07 to Jan-08                7.83%                   0.75%             8.5817%       12.25%
 Feb-09        Feb-08 to Jul-08                8.24%                   0.75%             8.9945%       12.25%
 Aug-09        Aug-08 to Jan-09                7.23%                   0.75%             7.9823%       12.25%
 Feb-10        Feb-09 to Jul-09                6.72%                   0.75%             7.4667%       12.25%
 Aug-10        Aug-09 to Jan-10                7.37%                   0.75%             8.1248%       12.25%
Table 44 Floating Rates for PGIX for 10 year GSec as Reference Rate

Since the spread is very low because of Heavy borrowing by Government, the floating rate is very
low and is always less than the fixed interest rate.

Comparison of Intrest on Fixed and Floating Rate
                                                                                                         (Rs Crs.)

             Intrest Payment-Fixed                                               Intrest Payment-Floating
              Opening                                                            Opening
 Year         Balance        Redemption       Interest           Year            Balance    Redemption   Interest
 Feb-01          576.5                0       35.31063           Feb-01             576.5            0    33.27606
 Aug-01          576.5                0       35.31063           Aug-01             576.5            0    34.49296
 Feb-02          576.5                0       35.31063           Feb-02             576.5            0    30.57083
 Aug-02          576.5                0       35.31063           Aug-02             576.5            0    26.40706
 Feb-03          576.5                0       35.31063           Feb-03             576.5            0    23.70376
 Aug-03          576.5            57.65       35.31063           Aug-03             576.5        57.65    21.36701
 Feb-04         518.85                0       31.77956           Feb-04            518.85            0    17.09351

19
     Source: www.fimmda.org


     126
Analysis of Fixed and Floating Interest Rates 2010
 Aug-04                     518.85                                      57.65                 31.77956                       Aug-04      518.85        57.65    15.37396
 Feb-05                      461.2                                          0                  28.2485                       Feb-05       461.2            0    14.34332
 Aug-05                      461.2                                      57.65                  28.2485                       Aug-05       461.2        57.65    17.01905
 Feb-06                     403.55                                          0                 24.71744                       Feb-06      403.55            0    15.45193
 Aug-06                     403.55                                      57.65                 24.71744                       Aug-06      403.55        57.65    15.93215
 Feb-07                      345.9                                          0                 21.18638                       Feb-07       345.9            0    14.65809
 Aug-07                      345.9                                      57.65                 21.18638                       Aug-07       345.9        57.65    14.54942
 Feb-08                     288.25                                          0                 17.65531                       Feb-08      288.25            0    12.66498
 Aug-08                     288.25                                      57.65                 17.65531                       Aug-08      288.25        57.65    12.36833
 Feb-09                      230.6                                          0                 14.12425                       Feb-09       230.6            0    10.37066
 Aug-09                      230.6                                      57.65                 14.12425                       Aug-09       230.6        57.65     9.20363
 Feb-10                     172.95                                          0                 10.59319                       Feb-10      172.95            0      6.4568
 Aug-10                     172.95                                      57.65                 10.59319                       Aug-10      172.95        57.65     7.02595
                                                                                              508.473                                                          352.3295
Table 45 Interests under Fixed and Floating for PGIX for 10 Year GSec


                                                                IX ( 10 Yrs Gsec)
   40
   35
   30
   25
   20                                                                                                                          Intrest Payment-Fixed
   15
   10                                                                                                                          Intrest Payment-
    5                                                                                                                          Floating
    0
                                   May-03


                                                                       May-06


                                                                                                           May-09
        Feb-01
                 Nov-01
                          Aug-02


                                            Feb-04
                                                     Nov-04
                                                              Aug-05


                                                                                Feb-07
                                                                                         Nov-07
                                                                                                  Aug-08


                                                                                                                    Feb-10


Figure 53 Interest Payments under Fixed and Floating Rate for PGIX for 10 year GSec as Reference Rate


Bond X


Computation of Spread
Avg Spread for AAA
Bonds for 10 Years
May-01           110
Apr-01           100
Mar-01            78
Feb-01           106
Jan-01           111
Dec-00           104

Avg.                                101.5
Source: www.fimmda.org

   127
Analysis of Fixed and Floating Interest Rates 2010
Computation of Floating Rate
Average Yield for 10Yrs GSec( 12 Months preceding Coupon period)
Interest
Payment     Reference Period   Average Govt yield   Spread    Floating rate     Fixed rate
Jun-02      Jun 00 - May 01           7.82%         1.015%            8.84%         10.90%
Jun-03      Jun 01 - May 02           7.13%         1.015%            8.15%         10.90%
Jun-04      Jun 02 - May 03           6.61%         1.015%            7.62%         10.90%
Jun-05      Jun 03 - May 04           5.37%         1.015%            6.38%         10.90%
Jun-06      Jun 04 - May 05           6.59%         1.015%            7.61%         10.90%
Jun-07      Jun 05 - May 06           8.17%         1.015%            9.19%         10.90%
Jun-08      Jun 06 - May 07          10.63%         1.015%           11.65%         10.90%
Jun-09      Jun 07 - May 08          10.77%         1.015%           11.79%         10.90%
Jun-10      Jun 08 - May 09          12.13%         1.015%           13.15%         10.90%


Comparison of Intrest on Fixed and Floating Rate
                                                                                      (Rs Crs.)

           Interest Payment-Fixed                            Interest Payment-Floating
           Opening                                           Opening
Year       Balance      Redemption   Interest       Year     Balance        Redemption    Interest
Jun-02         761.52            0   83.00568       Jun-02      761.52                0   67.30631
Jun-03         761.52            0   83.00568       Jun-03      761.52                0    62.0569
Jun-04         761.52        63.46   83.00568       Jun-04      761.52           63.46    58.05955
Jun-05         698.06        63.46   76.08854       Jun-05      698.06           63.46    44.54903
Jun-06          634.6        63.46    69.1714       Jun-06       634.6           63.46    48.27085
Jun-07         571.14        63.46   62.25426       Jun-07      571.14           63.46    52.46397
Jun-08         507.68        63.46   55.33712       Jun-08      507.68           63.46    59.12484
Jun-09         444.22        63.46   48.41998       Jun-09      444.22           63.46    52.35725
Jun-10         380.76        63.46   41.50284       Jun-10      380.76           63.46    50.05883
                                     601.7912                                             494.2475


                          X ( 10 yr Gsec )
  90
  80
  70
  60
  50                                                    Interest Payment-
  40                                                    Fixed
  30
                                                        Interest Payment-
  20                                                    Floating
  10
   0


  128
Analysis of Fixed and Floating Interest Rates 2010


Bond XIII- Opt-II

Computation of Spread
Avg Spread for AAA
Bonds for 10 Years
Jun-02           138

May-02              127
Apr-02              173
Mar-02              200
Feb-02              198
Jan-02              159

Avg.        165.8333
Source: www.fimmda.org

Computation of Floating Rate
         Average Yield for 10Yrs GSec( 12 Months preceding Coupon period)
Interest    Reference
Payment     Period            Average Govt yield   Spread   Floating rate    Fixed rate
Jul-03      Jul 01 - Jun 02         8.11%          1.658%           9.77%         7.85%
Jul-04      Jul 02 - Jun 03         6.39%          1.658%           8.05%         7.85%
Jul-05      Jul 03 - Jun 04         5.28%          1.658%           6.94%         7.85%
Jul-06      Jul 04 - Jun 05         6.70%          1.658%           8.36%         7.85%
Jul-07      Jul 05 - Jun 06         7.33%          1.658%           8.99%         7.85%
Jul-08      Jul 06 - Jun 07         7.88%          1.658%           9.54%         7.85%


Comparison of Intrest on Fixed and Floating Rate
                                                                                      (Rs Crs.)

           Interest Payment-Fixed                              Interest Payment-Floating
           Opening                                             Opening
Year       Balance        Redemption   Interest      Year      Balance      Redemption    Interest
 Jul-03         250.5          41.75   19.66425       Jul-03       250.5         41.75    24.47293
 Jul-04        208.75          41.75   16.38688       Jul-04      208.75         41.75    16.80431
 Jul-05           167          41.75    13.1095       Jul-05         167         41.75     11.5839
 Jul-06        125.25          41.75   9.832125       Jul-06      125.25         41.75    10.46606
 Jul-07          83.5          41.75    6.55475       Jul-07        83.5         41.75    7.508501
 Jul-08         41.75          41.75   3.277375       Jul-08       41.75         41.75    3.983458
                                       68.82488                                           74.81915


  129
Analysis of Fixed and Floating Interest Rates 2010

                      XIII-Opt II ( 10 Yr Gsec)
  30

  25

  20
                                                              Interest Payment-
  15                                                          Fixed

  10                                                          Interest Payment-
                                                              Floating
   5

   0
         Jan-03 Jan-04 Jan-05 Jan-06 Jan-07 Jan-08


Bond XIV

Computation of Spread
Avg Spread for AAA
Bonds for 10 Years
Jun-03             50

May-03                50
Apr-03                50
Mar-03                76
Feb-03                86
Jan-03                77

Avg.           64.83333
Source: www.fimmda.org

Computation of Floating Rate
       Average Yield for 10Yrs GSec( 12 Months preceding Coupon period)
Interest     Reference                                         Floating       Fixed
Payment      Period            Average Govt yield    Spread    rate           rate
Jul-04       Jul 02 - Jun 03         6.39%           0.648%         7.04%        6.10%
Jul-05       Jul 03 - Jun 04         5.28%           0.648%         5.93%        6.10%
Jul-06       Jul 04 - Jun 05         6.70%           0.648%         7.35%        6.10%
Jul-07       Jul 05 - Jun 06         7.33%           0.648%         7.98%        6.10%
Jul-08       Jul 06 - Jun 07         7.88%           0.648%         8.53%        6.10%
Jul-09       Jul 07 - Jun 08         7.91%           0.648%         8.56%        6.10%
Jul-10       Jul 08 - Jun 09         7.17%           0.648%         7.82%        6.10%


  130
Analysis of Fixed and Floating Interest Rates 2010
Comparison of Intrest on Fixed and Floating Rate
                                                                                     (Rs Crs.)

          Interest Payment-Fixed                            Interest Payment-Floating
          Opening                                            Opening
Year      Balance      Redemption   Interest        Year     Balance    Redemption    Interest
 Jul-04       761.52            0   46.45272       Jul-04      761.52            0    53.61075
 Jul-05       761.52            0   46.45272       Jul-05      761.52            0    45.13123
 Jul-06       761.52        63.46   46.45272       Jul-06      761.52        63.46    55.94227
 Jul-07       698.06        63.46   42.58166       Jul-07      698.06        63.46    55.72066
 Jul-08        634.6        63.46    38.7106       Jul-08       634.6        63.46     54.1391
 Jul-09       571.14        63.46   34.83954       Jul-09      571.14        63.46    48.90415
 Jul-10       507.68        63.46   30.96848       Jul-10      507.68        63.46    39.69068
                                    286.4584                                          353.1388


                        XIV (10 Yr Gsec)
  60

  50

  40

  30                                                   Interest Payment-
                                                       Fixed
  20
                                                       Interest Payment-
  10                                                   Floating

   0


  131
Analysis of Fixed and Floating Interest Rates 2010
Floating Rate under Reference Rate of Average yield of 10 year GSec
In the previous section, the reference period was taken a 6/12 months preceding the coupon period.
But the interest payment in case of reference period of 6/12 months preceding the interest payment
has also been calculated and analysed.

The spread has determined by the same method as used in the previous section ( i.e. average spread
of 6 months preceding the month of issue) as published by FIMMDA. The computation has been
added to the online appendix. And the summary of total interest in each method is as follows:

Average Yield for 10Yrs GSec( Preceding Interest Payment)
                                                                                                                                  (Rs. Crs)
Bond                       Maturity               Interest paid till                               Spread             Under       Under
                                                                                                                      Fixed       Floating
VIII                       14                     Apr-10                                           1.000%                17.595   14.59242333
IX                         12                     Feb-10                                           0.750%              497.8798        334.674
X                          14                     Jun-09                                           1.015%              560.2883        464.861
XIII-Opt-II                6                      Jul-08                                           1.658%               68.8249          71.826
XIV                        12                     Jul-09                                           0.648%                255.49       320.4026
Table 46 Total Intrest Under Fixed and Floating Rates for All Bonds under 10 Year GSec as Base Rate

And the Intrest trends of each Bond are as follows:


                                                      VIII ( 10 Yrs Gsec)*
   1.4
   1.2
     1
   0.8
                                                                                                                           Intrest Payment-Fixed
   0.6
   0.4                                                                                                                     Intrest Payment-
   0.2                                                                                                                     Floating

     0
                  Aug-01


                                    Apr-03


                                                                        Aug-06


                                                                                          Apr-08
                                             Feb-04


                                                                                                    Feb-09
                                                      Dec-04


                                                                                                             Dec-09
         Oct-00


                           Jun-02


                                                               Oct-05


                                                                                 Jun-07


   132
Analysis of Fixed and Floating Interest Rates 2010

                                                       IX ( 10 Yrs Gsec)*
40
35
30
25
20                                                                                                                        Intrest Payment-Fixed
15
10                                                                                                                        Intrest Payment-
5                                                                                                                         Floating
0


                                                                                                        May-09
                                May-03


                                                  Nov-04


                                                                    May-06
              Nov-01
                       Aug-02


                                                           Aug-05


                                                                                      Nov-07
                                                                                               Aug-08
     Feb-01


                                         Feb-04


                                                                             Feb-07


                                                                                                                 Feb-10


                                                           X ( 10 Yr Gsec)*
90
80
70
60
50                                                                                                                           Interest Payment-
40                                                                                                                           Fixed
30
                                                                                                                             Interest Payment-
20                                                                                                                           Floating
10
 0


                                         XIII- Opt II (10 yr Gsec)*
25

20

15                                                                                                                           Interest Payment-
                                                                                                                             Fixed
10
                                                                                                                             Interest Payment-
                                                                                                                             Floating
5

0
         Jan-03 Jan-04 Jan-05 Jan-06 Jan-07 Jan-08


133
Analysis of Fixed and Floating Interest Rates 2010

                              XIV (10Yrs Gsec)*
   70

   60

   50

   40                                                                    Interest Payment-
                                                                         Fixed
   30
                                                                         Interest Payment-
   20                                                                    Floating
   10

    0
         Jan-04 Jan-05 Jan-06 Jan-07 Jan-08 Jan-09


Figure 54 Intrest Payments Under Fixed and Floating Rates for All Bonds for 10 year GSec as Base Rate


   134
Analysis of Fixed and Floating Interest Rates 2010
Floating Rate under Reference Rate of Average yield of 10 year GSec-
Average Spread of last 12 months


Alternate study of interest cost by taking different spread has also been done. In the previous case,
where average spread of previous 6 months preceding the issue month was considered. But since
the reference rate is calculated by taking the average yield of 10 yr GSec for preceding 12 months,
the spread also need to be taken for the period of 12 months.

Among the 5 issues selected namely, VIII, IX, X, XIII-Opt-II and XIV, the Intrest on the Issue Series VIII
is paid half yearly, thus spread for 12 months need not be calculated. And for Series IX and X, due to
unavailability of data, the spread has not been computed for 12 months preceding the issue month.
Thus for issue Series XIII-Opt II and XIV, the spread as published by FIMMDA for AAA rated PSU
Bonds with reference to 10 year GSec paper for the 12 months preceding the issue month has been
considered. The costs under each case (fixed and floating) is summarised in the table.

Summary of Each Base Rate
The total interest payment till date under both fixed and floating rate for the selected 5 issues has
been summarised in the following table.

               Average Yield for 10Yrs GSec( Preceding Interest Payment)
                                                                                        (Rs. Crs)
                               Interest paid               Under         Under
 Bond               Maturity   till            Spread      Fixed         Floating       Savings
            VIII         14           Apr-10      1.00%       18.009        15.29789     2.71111
             IX          12          Feb-10       0.75%     497.8798          334.674   163.2059
              X          14           Jun-09     1.015%     560.2883        464.8609    95.42745
                                                 1.658%     68.82488        71.82599    -3.00112
     XIII-Opt-II          6          Jul-08           20
                                               1.507%       68.82488            73.49   -4.66512
                                                 0.648%       255.49        320.3901    -64.9001
           XIV           12          Jul-09            2
                                                0.711%        255.49        323.0287    -67.5387
Table 47 Summary of Costs under 1 Year GSec as Base Rate

                   Average Yield for 10Yrs GSec( Preceding Coupon period)
                                                                                        (Rs. Crs)
                               Interest paid               Under        Under
 Bond               Maturity   till            Spread      Fixed        Floating        Savings
            VIII         14           Apr-10     1.00%      17.59500       14.59242     3.002577
             IX          12          Aug-10      0.75%       508.473       352.3925     156.0805
              X          14           Jun-10    1.015%      601.7912         494.247    107.5442
                                                1.658%      68.82488       74.81652     -5.99164
     XIII-Opt-II          6          Jul-08           2
                                               1.507%       68.82488         70.4959    -1.67103
                                                0.648%      286.4584       353.1248     -66.6663
           XIV           12          Jul-10           2
                                               0.711%       286.4584       356.0833     -69.6249
Table 48 Summary of Costs under 10 Year GSec as Base Rate ( Coupon Period)


20
     Spread is determined taking previous 12 months’ average of Spread as published by FIMMDA

     135
Analysis of Fixed and Floating Interest Rates 2010
          Average Yield of 1 years GSec ( 3 days preceding Intrest rate)
                                                                                       (Rs. Crs)
                         Interest paid                Under          Under
 Bond        Maturity    till              Spread     Fixed          Floating          Savings
 VIII             14            Apr-10      1.04%        17.585         12.57485        5.01015
 IX               12           Feb-10       1.52%      497.8798         321.3677       176.5121
 X                14            Jun-09     2.690%      560.2883         449.1773        111.111
 XIII-
 Opt-II             6            Jul-08    1.794%      68.82488           65.9424      2.882475
 XIV               12            Jul-09    1.073%        255.49          310.5878      -55.0978
Table 49 Summary of Costs under 10 Year GSec as Base Rate ( Interest Payment Period)


   136
Analysis of Fixed and Floating Interest Rates 2010
Factors Effecting the Selection of Each Method


From the above computation and comparison of Intrest payments under all the three benchmarks
rates with different spreads for different kinds of bonds differing with each other on the basis of
coupon rate, the quantum of loan and also the duration (Maturity). Some of the analysis that can be
made is:

The selection of different mechanism of paying interest Viz Fixed or Floating rate is influenced by
some of the following factors.

Term
Term implies the tenure of the bond. It is the maturity of the bond, after which the whole principal is
redeemed. For the bonds having short term maturity, the fixed coupon rate is suitable. This can be
validated from the above summary of results, where Bond XII-Opt II, which has the tenure of 6 years,
has interest payments under fixed coupon rate lower than that of payment under floating rate.

The rationale behind the floating rate is, the fluctuations, both short terms as well as long term are
normalised over the life of the bond. Thus in case of longer maturities, the fluctuations, both ups
and downs, are covered, thus on an average the payments under floating rate is normalised. But in
case of short duration bonds the floating rate may be either very low or very high based on the
period it belongs to.


            PG XIII- 1Year Gsec                              PG XIII- 10Year Gsec
  12.00%                                                 12.00%
  10.00%                                                 10.00%
    8.00%                                                 8.00%
    6.00%                                                 6.00%
    4.00%                                                 4.00%
    2.00%                                                 2.00%
    0.00%                                                 0.00%


             1 Year Gsec + Spread      PGXIII                     10 Year Gsec + Spread     PGXIII


In the above chart, depicting the floating and fixed rate for the Bond Series XIII which has the tenure
of 6 Years, it can be seen that though the interest rate in case of floating rate was less than that of
fixed in the initial years, . In this case, since the tenure of short term, the fluctuations of both Ups
and downs are not covered within the period.

Coupon Rate
Coupon rate is the interest rate attached to the bond. The coupon rate exists only in case of fixed
Intrest rate. Under floating rate, since the interest rate is reset after every period, thus a fixed


  137
Analysis of Fixed and Floating Interest Rates 2010
coupon rate cannot be determined. The coupon rate is one of the important factors that affect the
decision of selecting fixed under floating rate.

In case, if the company is able to issue at a lower coupon rate, it will be beneficial for the company
to go for fixed rate. This is because, no matter whatever are the market conditions, in the future, the
company will be needed to pay the low pre-determined rate.

To explain, if we consider the Series XIV, which is issued at a coupon rate of 6.10%, the Floating rate
turns up to be unfavourable. From the following chart, it can be seen that the security is issued when
the Bond is issued just before the GSec rate was at its lowest. Thus the floating rate exceeds the
fixed rate for the subsequent years. Thus when the GSec yield is at its lowest, it is preferable to go
for fixed coupon rate.


              XIV- 1 Yr Gsec                                    XIV- 10 Year Gsec
  12.000%                                              12.00%
  10.000%                                              10.00%
    8.000%                                              8.00%
    6.000%                                              6.00%
    4.000%                                              4.00%
    2.000%                                              2.00%
    0.000%                                              0.00%


               1Yr Gsec + Spread       XIV                       10 Yr Gsec + Spread       XIV


Market Condition
But since the coupon rate is determined based on the market conditions at the time of the issue, the
prevailing GSec rate and the spread, thus the market conditions during the time of issue is also an
important factor to consider.

If the market conditions are favourable, characterised, with adequate liquidity, low interest rates
etc... The prevailing GSec rats will be low and also the spread will be low resulting in low coupon
rate. And the benefit of this favourable condition can be enjoyed throughout the tenure of the bond.

But in case if the market conditions are not favourable, downturn in the economy, high borrowings
by the government, unfavourable policies by the RBI, would lead to high coupon rate. And though
this unfavourable condition lasts just for a month or a year, but the effect of the same shall be beard
over the long term.

Also the spread is determined based on the prevailing market conditions, and under both the cases
i.e... Fixed and floating the spread is kept fixed. But under floating rate, the reference rate keeps on
adjusting and thus there shall be benefits of savings.

  138
Analysis of Fixed and Floating Interest Rates 2010
For instance, in case of IX issue, when this series was issued the market conditions were not
favourable. Some of the events affecting the interest rates were

     Due to hike in CRR, the Bank rates and GSec rates hiked up,
     Most of the nationalised banks increased their PLR
     60% of Annual borrowings by GoI during the current year amounting to approx. Rs.1,20,000
      Crores is yet to be raised
     All the above mentioned points may bring an upward pressure in GSec rates thus the coupon
      rate was fixed with the spread of 75 basis points over the prevailing rate of 10 years GSec.

Thus, the rate determined was at 12.25%. And in this case, if the company had issued floating rate,
the effect of unfavourable conditions had to be suffered only for a year or so, and there would have
been savings under the floating rate.


                                                  XII Issue
   14.0000%
   12.0000%
   10.0000%
    8.0000%
    6.0000%                                                                           Gsec+Spread

    4.0000%                                                                           XII

    2.0000%
    0.0000%
                      2001


                                           2004
               2000


                             2002

                                    2003


                                                   2005

                                                          2006

                                                                 2007

                                                                        2008

                                                                               2009


Figure 55 Comparison of Fixed and Floating in case of Adverse Market conditions

From the graph, it can be commented that, floating rate is beneficial in case when market conditions
are not favourable. From the date of issue to the last interest payment date, the floating rate is
lower than the fixed coupon rate.

Quantum of Loan
The quantum of loan is also a component to be considered. For a loan of small amount, no matter
whatever be the coupon rate and whatever be the tenure, there will be very less losses or gains in
case of going to floating rate. Thus the company can be indifferent between fixed or floating rate.

Thus, in case of Bond series VIII, the loan amount of Rs20 Crores at the coupon rate of 10.35%, very
low saving of Rs.2 crores or Rs.5 crores depending upon different base rates can be seen, under the
floating rate.

Repayment Structure

Repayment structure determines the schedule of repayment of the principal and payment of
interest. Almost all the bonds of Power Grid Corporation of India Limited has initial moratorium

   139
Analysis of Fixed and Floating Interest Rates 2010
period followed by equal annual instalments for the principal payment. Thus the interest is paid for
the whole amount initially and then the payment is done on the outstanding balance which keeps on
reducing over the years.

Thus in case of floating rate, if the market conditions are favourable at the time of issue and
becomes adverse at the end, the company will get benefitted, as a low interest is paid on whole
amount and a higher interest is paid on the less amount. But in case of a reverse condition, i.e...
Market conditions being unfavourable at the initial years and then followed by the favourable
scenario, the fixed coupon rate is advisable.

Time of Issue
The timing of issue is very crucial for deciding the method of interest rate. The scenario of market
widely differs within a period of a month or so. If a month has scheduled government borrowings,
any awaited policy announcements, liquidity conditions etc..., the interest rates on GSec will be high
leading to the high coupon rate.


  140
Analysis of Fixed and Floating Interest Rates 2010


      Chapter VI
      Findings and
      Recommendations

               Critical Analysis of Alternatives
               Recommendations


141
Analysis of Fixed and Floating Interest Rates 2010

Critical Analysis of Alternatives
Based on the above discussed calculations and their analysis, some of the alternatives for the
purpose of issuing bonds are as follows:

Fixed Coupon Interest Rate
The company can go for the fixed coupon rate for some of its bonds based on the market conditions
and the suitability of the rate. In this case the coupon rate fixed by the process of book-bidding will
remain constant for throughout the life of the bond. The company can take benefits of the
favourable market conditions at the time of the issue for the whole life of the bond. But there is also
a risk attached to it, as it is highly skewed towards the market condition and the prevailing interest
rates at the time of the issue, and the company may need to suffer if the market conditions are not
favourable.

Some of the merits of this mechanism are:

     Since the interest rate is fixed at the time of issue, the company can easily forecast the
      interest obligations for the future and budget the same.
     The zero variation in the income in way of interest attracts the client base belonging to Fixed
      Income group. In India majority of investors is comprised of Retirement funds like Provident
      Fund, Pension Plan, Superannuation funds etc. Thus this kind of plan can assure maximum
      acceptance.
     This kind of mechanism is very beneficial, if the conditions of the market are favourable and
      are characterised with low interest rates. Thus the coupon rate fixed at the time of issue
      which remain fixed shall lead to lot of savings.
     This is suitable for a company which is very conservative.

Some of the Cons attached to this type of method are:

     The company cannot take the advantage of fluctuations in the interest rates due to the shift
      in economic conditions and other favourable events.
     The coupon rate determined at the time of issue does not reflect the market conditions of
      the subsequent years.
     If the issue comes out at a period when the market conditions are adverse, the coupon rate
      determined will be very high because of high interest rates as well as high spreads. And the
      rate determined will remain constant for the whole tenure leading to heavy costs.

Floating Rate


As against the case of fixed Coupon rate where the interest rate is determined at the time of issue
and is kept fixed, in case of Floating Interest Rate, the interest rate does not remain constant and is
reset after every predetermined reset period. In this case the interest paid for the period is truly
represented by the market conditions and the prevailing interest rates for that period. But there is
risk of fluctuation of interest rates and these may be very low or very high. Thus this method can be
used for few bonds based on the market situation, tenure of the bond and also the quantum of the
loan.


  142
Analysis of Fixed and Floating Interest Rates 2010
The rate is determined based on the reference rate. And this reference rate can be yield on a
Treasury bill, Yield on 1 year GSec paper, or 10 year GSec paper, or even Bank rates like MIBOR. The
selection of either of the reference rates depend on the kind of security, its maturity, its features in
terms of risk, raying etc. And also the decision is on the discretion of the issuer and the advice of
merchant bankers.

Some of the points in support of Floating rate are:

        The company can take advantage of Intrest rate fluctuations, and pay the interest as per the
         prevailing interest rates in the economy.
        In case if the market conditions are not favourable at the time of issue, the interest paid on
         the security for the subsequent years will not be much influenced by the market conditions
         of the issue period.
        For the investor, this kind of securities are attractive and preferable by them, since the
         returns on the security are truly represented by the market conditions and are similar to the
         opportunity cost21 of the investment.
        Since the interest paid for any period is truly represented by that period’s condition and also
         since the trading is allowed in the bonds, an investor can hold the security for short term
         and need not hold it till the maturity.

Some of the points against this method are:

        This method is characterised with fluctuations in Income for the investors, thus it may be
         less attractive for the Fixed and Regular Income class of the investors (Viz Retirement benefit
         Funds).
        Also, since the interest payments for the future cannot be forecasted, the budgeting of
         funds cannot be done effectively.

           But this can be solved by maintain a provision account for some fixed coupon rate or as
           some margin added to the past floating rate on the outstanding balance.

        For the companies which are very conservative and least prefers the variations in the
         expenses, this method is least attractive.
        The benefit of favourable conditions at the time of issue vanishes in this method.
        Though the interest rates are truly represented by the prevailing market conditions, but the
         spread is determined based on the prevailing spread at the time of issue. Thus there is some
         influence of market conditions at the time of issue.


21
     The returns which he would have received in case of investing in any alternate avenues.

     143
Analysis of Fixed and Floating Interest Rates 2010
Fixed Coupon Rate with Option
As mentioned before, one of the demerits of fixed coupon rate is, in case of high interest rates at the
time of issue, the same coupon rate is paid for throughout the tenure even though the market has
become favourable. This can be avoided if the bonds are issued with an option attached to it.

The option is the Option for the option holder to execute his option of Buy or sell, and the other
party is under obligation to fulfil the option. In this case the option holder has the option but he is
not under obligation to exercise his option. The Option can be compared with the person holding the
Ticket to a cinema. In this case the ticket holder has the right to watch the movie if he wishes to and
the Theatre management cannot deny him from his right and is under obligation to show him the
cinema. But also the Ticket holder is not at all under the obligation of watching the movie and the
management cannot force him to watch the movie.

The company can issue the Bonds with the Call Option with the company or Put option with the
investor. The Call option implies that the Option holder has the right to buy the security in a
predetermined period and at a predetermined price. And the other party is under obligation to sell
them whenever the Call option is exercised.

And the Put option implies that the Option holder has the right to sell the security at a
predetermined price after a predetermined period. But he is not under obligation to exercise the
right. But the other party is under obligation to buy the security in case if the holder exercises the
Option.

The Company can also attach the Option with the Bonds. If the company is expecting a fall in interest
rates after a period of five years, or in case if the current interest rates are very high but the raising
of loan cannot be postponed, in this case the Bonds can be issued with a Call Option with the
company to buy the Bonds after a predetermined period.

In case if the interest rates fall after the predetermined Hold-In period, the Company can call for the
bonds and repay the bondholders and then can raise the fresh bonds at a low coupon rate.

Some of the Merits attached to it are:

     Apart from the merits in case of fixed coupon rate, the coupon rate if is set at a very high
      rate due to unfavourable market conditions, the company can redeem the bonds of high
      coupon rate and can swap the amount with a low coupon rate bonds by issuing the fresh
      bonds.
     Also, since the Investors do not have the Put Option the uncertainty of Disbursements in
      case of sudden selling of bonds by investors is avoided.

But since the put option is not provided to the investors, in case of rise in the interest rates than the
coupon rate, the investor do not has the option of selling these bonds to the company and re-invest
the funds in a better avenue. This makes the instrument less attractive.


  144
Analysis of Fixed and Floating Interest Rates 2010

Recommendation

After comparing the interest costs under Fixed and Floating Rates for a array of bonds having
different characteristics like

      Meagre loan Amount
      Half Yearly Intrest Payment
      Longer Maturity of 14 years
      Shorter Maturity of 6 years
      Low coupon rate

Though the behaviour and pattern of the yields of GSec papers are very fluctuation and do not
follow a fixed pattern, very accurate recommendations could not be given. But based on the trend of
last 10 years GSec yield trend, some of the recommendations that can be made on the suitability of
each kind bond are:

    The company can go for Fixed Intrest rate if the market conditions are favourable at the time
     of issue.
    Also for the meagre loan amount, the company can be indifferent between the Fixed and
     the Floating rate.
    If the bonds are issued for a very short term period, the behaviour of the GSec yield will
     influence the decision. If the issue is made at the period when the yield is high, the floating
     rate will be suitable because the yield curve would fall for the subsequent years and only the
     fall will be covered within the tenure because of short term maturity bond.
    But in case if the curve is already at its low, fixed rate must be preferred for the short tenure
     bonds, because in case of floating rate, only the rise will be covered.
    For a longer maturity bond, Fixed interest is to be preferred if the yield curve of the GSec is
     at its low, and the floating is to be preferred if the yield curve is at its high.
    The method of interest determination is not affected by the frequency of interest payment.
     Be it half yearly or annually.
    In case of recession, the yield of GSec, the interest rates are low; the investors become
     prudent and prioritise the security to the returns. Thus at such conditions, fixed coupon rate
     can be issued as the company will be able to attract investment at low coupon rate.
    Also since as per CERC Guidelines, for the purpose of Tariff determination, the company shall
     provide the interest expenses, if the company goes for the floating rate, the interest
     payments will vary every year, thus a provision account can be maintained.
    The company can also issue the Call Option Embedded Bonds if the market conditions are
     not favourable at the time of issue.
    The Intrest rates on GSec paper and the Yield curve is affected by some of the economic
     events like announcement of budget, announcement of monetary policy by RBI etc... Thus in
     case of fixed coupon rates, the timing of the issue must be planned and thus the advantage
     of favourable market condition can be taken.


  145
Analysis of Fixed and Floating Interest Rates 2010

References

       Bond & Money Markets: Strategy, Trading, Analysis, First South Asian Edition, Moorad Choudhry
       Bond Markets, Analysis, and Strategies, Fifth Edition, Frank J. Fabozzi
       CORPORATE CREDIT RATINGS A Note on Methodology- by ICRA
       Financial Data from Company’s Annual report- 2008-09
       http://en.wikipedia.org/wiki/Reverse_Greenshoe Visited on 11th April
       http://www.equitymaster.com/detail.asp?date=9/6/2003&story=2 Visited on 3rd April
       http://www.equitymaster.com/research-it/sector-info/power/ Visited on 3rd April
       http://www.investopedia.com/terms/g/greenshoe.asp Visited on 11th April
       http://www.jagoinvestor.com/2010/03/floating-rate-mutual-funds-%E2%80%93-how-when-and-
       why.html visited on 26th April, 2010
       http://www.linkedin.com/answers/finance-accounting/corporate-debt/FIN_CDT/327845-24854458
       Visited on 7th April
       http://www.powermin.nic.in/indian_electricity_scenario/introduction.htm Visited on 3rd April
       http://www.sundarandco.com/sebi03.htm Visited on 11th April
       http://www.youtube.com/watch?v=NV0S8pKvje8&feature=related Visited on 14th April
       http://www.youtube.com/watch?v=tJLR3se4Pa4 Visited on 14th April
       Offer Document of Power Grid Corporation of India Limited’s Bond series XII, IX, XXIX and XXXI.
       Offer Documents of FRBs of ICICI Limited, Power Finance Corporation of India Limited, Kotak
       Mahindra Limited, Indian Railway Finance Corporation of India Limited.
       Red Herring Prospectus of Power Grid Corporation of India Limited’s IPO of September, 2007.
       Securities and Exchange Board Of India (Disclosure And Investor Protection) Guidelines, 2000
       Power Sector in India -White paper on Implementation Challenges and Opportunities” – KPMG
       Repos in corporate bonds under consideration, says Sebi”- Newswire18 / Mumbai September 11, 2009,


  Some of the data bases used are:

     Capitaline
     http://nse-india.com/
     Reuters
     www.FIMMDA.org
     www.indiastat.com


 146

More Related Content

PDF
Use of Interest Rate Swaps in hedging bond portfolio
PDF
A general study on Market Potential and Brand Awareness towards TVS Apache 160
PDF
Financial Analysis Of Coats Group PLC
PDF
bilateral_trade_treaties_20080508105059
PDF
Emotional Intelligence & WORK-LIFE BALANCE (WBL) OF EMPLOYEES
PDF
Call guides cpm fy10
PDF
Lauren A Nash Social Media Marketing Final Project
PDF
Ownership structure financial structure and r&d investment evid
Use of Interest Rate Swaps in hedging bond portfolio
A general study on Market Potential and Brand Awareness towards TVS Apache 160
Financial Analysis Of Coats Group PLC
bilateral_trade_treaties_20080508105059
Emotional Intelligence & WORK-LIFE BALANCE (WBL) OF EMPLOYEES
Call guides cpm fy10
Lauren A Nash Social Media Marketing Final Project
Ownership structure financial structure and r&d investment evid

What's hot (20)

PDF
20090104 oecd china country note second draft -2_
PDF
MBA dissertation_Gerald Overstall_FINAL_24_12_13
DOCX
College report
DOC
Language in leadership and management: ACE School Management and Leadership (...
PDF
2012 ASTA Agency Profile
PDF
BERKSHIRE HATHAWAY INC Annual & Interim Reports 2004 2nd
PDF
Coca Cola Company Strategic Management Project ( A Comprehensive Analysis on ...
PDF
Managing teaching and learning: ACE School Management and Leadership (PDF)
PDF
Student Book Module 2
PDF
BERKSHIRE HATHAWAY INC Annual & Interim Reports2004 3rd
DOC
Anuradha Saini Project Report
PDF
Language in leadership and management: ACE School Management and Leadership (...
DOC
Buisness Plan V1
PDF
Dec 2003 business plan for d'lectables
DOCX
Analyzing Textiles Industry of India
PDF
Internship report 2007eit043
PDF
Vhdl cookbook
PDF
Intuit QuickBooks Enterprise Solutions
DOCX
Entrepreneurial training manual owning your future
PDF
Service Marketing Management - Managing Customer Satisfaction at a authorized...
20090104 oecd china country note second draft -2_
MBA dissertation_Gerald Overstall_FINAL_24_12_13
College report
Language in leadership and management: ACE School Management and Leadership (...
2012 ASTA Agency Profile
BERKSHIRE HATHAWAY INC Annual & Interim Reports 2004 2nd
Coca Cola Company Strategic Management Project ( A Comprehensive Analysis on ...
Managing teaching and learning: ACE School Management and Leadership (PDF)
Student Book Module 2
BERKSHIRE HATHAWAY INC Annual & Interim Reports2004 3rd
Anuradha Saini Project Report
Language in leadership and management: ACE School Management and Leadership (...
Buisness Plan V1
Dec 2003 business plan for d'lectables
Analyzing Textiles Industry of India
Internship report 2007eit043
Vhdl cookbook
Intuit QuickBooks Enterprise Solutions
Entrepreneurial training manual owning your future
Service Marketing Management - Managing Customer Satisfaction at a authorized...
Ad

Similar to Analysis of fixed and floating interest rates (20)

PDF
Payroll
PDF
Credit appraisal for term loan and working capital financing with special ref...
DOCX
R4U DENIM FATORY.business plan
PDF
MINERAL TAX CLINIC REVISED EDITION 3
PDF
Implementation of payroll in tally erp 9 | Tally Customization services | Fix...
PDF
Implementation of payroll in tally erp 9
PDF
Principles_of_Managerial_Economics.pdf
PDF
Principles_of_Managerial_Economics (3).pdf
PDF
Microeconomics lecture notes
PDF
Banking industry intro
PDF
Forecasting, Financing & Fast Tracking Your Business Growth
PDF
Develop a portfolio to demonstrate school leadership and management competenc...
PDF
Indian Banks : Trends and Progress, RBI
PDF
Revenue mobilization in_developing_countries.__prepared_by_dr_malik_khalid_me...
DOC
30838403 comparative-analysis-of-mutual-funds
PDF
Microfranchising in Kenya
PDF
Determination of individual competencies by statistical methods yuksek lisans...
PDF
Anual report 1112
DOCX
Learner Guide BSBMGT502 Manage People Perfo.docx
DOCX
Strategic Analysis Final Paper
Payroll
Credit appraisal for term loan and working capital financing with special ref...
R4U DENIM FATORY.business plan
MINERAL TAX CLINIC REVISED EDITION 3
Implementation of payroll in tally erp 9 | Tally Customization services | Fix...
Implementation of payroll in tally erp 9
Principles_of_Managerial_Economics.pdf
Principles_of_Managerial_Economics (3).pdf
Microeconomics lecture notes
Banking industry intro
Forecasting, Financing & Fast Tracking Your Business Growth
Develop a portfolio to demonstrate school leadership and management competenc...
Indian Banks : Trends and Progress, RBI
Revenue mobilization in_developing_countries.__prepared_by_dr_malik_khalid_me...
30838403 comparative-analysis-of-mutual-funds
Microfranchising in Kenya
Determination of individual competencies by statistical methods yuksek lisans...
Anual report 1112
Learner Guide BSBMGT502 Manage People Perfo.docx
Strategic Analysis Final Paper
Ad

More from Madhusudan Partani (20)

PDF
Adidas Brand Study
PPTX
Amul:Brand Audit
PDF
Amul:Brand Audit
PPTX
Arts as Alternative Investment
PDF
Art as Alternate Investment
PPTX
Housing Finance fmg18 Y
PPTX
Euro Birth and Impact on International Trade
PDF
Birth of Euro and Impact on Foriegn Trade
PPTX
Analysis of fixed and Floating Rates
PDF
91029 fmg18 a
DOCX
Segmentation
DOCX
Macro Environment
PPTX
Impact of DDT
PPTX
Cloud Computing
PDF
Conjoint Analysis- Multivariate Analysis
PPTX
Conjoint Analysis
PPTX
The Best HR Practices
PPT
Reverse Auction
PPTX
7 Deadly Wastes
Adidas Brand Study
Amul:Brand Audit
Amul:Brand Audit
Arts as Alternative Investment
Art as Alternate Investment
Housing Finance fmg18 Y
Euro Birth and Impact on International Trade
Birth of Euro and Impact on Foriegn Trade
Analysis of fixed and Floating Rates
91029 fmg18 a
Segmentation
Macro Environment
Impact of DDT
Cloud Computing
Conjoint Analysis- Multivariate Analysis
Conjoint Analysis
The Best HR Practices
Reverse Auction
7 Deadly Wastes

Recently uploaded (20)

PDF
102 student loan defaulters named and shamed – Is someone you know on the list?
PDF
Abdominal Access Techniques with Prof. Dr. R K Mishra
PDF
ANTIBIOTICS.pptx.pdf………………… xxxxxxxxxxxxx
PPTX
Lesson notes of climatology university.
PPTX
1st Inaugural Professorial Lecture held on 19th February 2020 (Governance and...
PDF
Physiotherapy_for_Respiratory_and_Cardiac_Problems WEBBER.pdf
PDF
grade 11-chemistry_fetena_net_5883.pdf teacher guide for all student
PDF
VCE English Exam - Section C Student Revision Booklet
PDF
Pre independence Education in Inndia.pdf
PDF
BÀI TẬP BỔ TRỢ 4 KỸ NĂNG TIẾNG ANH 9 GLOBAL SUCCESS - CẢ NĂM - BÁM SÁT FORM Đ...
PPTX
human mycosis Human fungal infections are called human mycosis..pptx
PDF
01-Introduction-to-Information-Management.pdf
PDF
Sports Quiz easy sports quiz sports quiz
PPTX
school management -TNTEU- B.Ed., Semester II Unit 1.pptx
PDF
Chapter 2 Heredity, Prenatal Development, and Birth.pdf
PDF
O7-L3 Supply Chain Operations - ICLT Program
PDF
FourierSeries-QuestionsWithAnswers(Part-A).pdf
PPTX
PPT- ENG7_QUARTER1_LESSON1_WEEK1. IMAGERY -DESCRIPTIONS pptx.pptx
PPTX
Pharma ospi slides which help in ospi learning
PDF
Basic Mud Logging Guide for educational purpose
102 student loan defaulters named and shamed – Is someone you know on the list?
Abdominal Access Techniques with Prof. Dr. R K Mishra
ANTIBIOTICS.pptx.pdf………………… xxxxxxxxxxxxx
Lesson notes of climatology university.
1st Inaugural Professorial Lecture held on 19th February 2020 (Governance and...
Physiotherapy_for_Respiratory_and_Cardiac_Problems WEBBER.pdf
grade 11-chemistry_fetena_net_5883.pdf teacher guide for all student
VCE English Exam - Section C Student Revision Booklet
Pre independence Education in Inndia.pdf
BÀI TẬP BỔ TRỢ 4 KỸ NĂNG TIẾNG ANH 9 GLOBAL SUCCESS - CẢ NĂM - BÁM SÁT FORM Đ...
human mycosis Human fungal infections are called human mycosis..pptx
01-Introduction-to-Information-Management.pdf
Sports Quiz easy sports quiz sports quiz
school management -TNTEU- B.Ed., Semester II Unit 1.pptx
Chapter 2 Heredity, Prenatal Development, and Birth.pdf
O7-L3 Supply Chain Operations - ICLT Program
FourierSeries-QuestionsWithAnswers(Part-A).pdf
PPT- ENG7_QUARTER1_LESSON1_WEEK1. IMAGERY -DESCRIPTIONS pptx.pptx
Pharma ospi slides which help in ospi learning
Basic Mud Logging Guide for educational purpose

Analysis of fixed and floating interest rates

  • 1. Analysis of Fixed and Floating Interest Rates For Bonds of Power Grid Corporation of India Limited Under the Guidance of Mr. Nalin Jain Mr. K.C. Pant Professor, Marketing CM- Finance (Bonds) FORE School of Management Power Grid Corporation of India Limited Mr. Vinay Dutta Area Chair Person, Finance FORE School of Management Madhusudan Partani 91029 PGDM- 2009-11 FORE School of Management New Delhi
  • 2. Analysis of Fixed and Floating Interest Rates 2010 Table of Contents Acknowledgement .................................................................................................................................. 5 Chapter I Introduction Introduction .......................................................................................................................................... 11 Objectives ............................................................................................................................................. 12 Purpose of Study ................................................................................................................................... 13 Scope ..................................................................................................................................................... 14 Data ....................................................................................................................................................... 15 Review of Literature.............................................................................................................................. 16 Introduction .......................................................................................................................................... 19 Developments in Government Bond Market.................................................................................... 19 Corporate Bond Market .................................................................................................................... 20 Development of Equity Market vs. the Debt Market ....................................................................... 22 Chapter II Financial Statetement Analysis Balance Sheet Analysis .......................................................................................................................... 26 Capital Composition .......................................................................................................................... 26 Sources and Application of Funds ..................................................................................................... 28 Share Capital ................................................................................................................................. 30 Share Holding Pattern ................................................................................................................... 30 Brief note on Initial Public Offering .............................................................................................. 32 Reserves ........................................................................................................................................ 33 Secured Loans ............................................................................................................................... 33 Unsecured Loans ........................................................................................................................... 35 Current Liability ............................................................................................................................. 36 Fixed Assets ................................................................................................................................... 37 Investments................................................................................................................................... 38 Current Assets ............................................................................................................................... 39 Profit and Loss Analysis......................................................................................................................... 40 Sales/ Operating Income............................................................................................................... 41 Profits ............................................................................................................................................ 42 Dividends....................................................................................................................................... 42 Cash Flow Analysis ................................................................................................................................ 44 Ratio Analysis ........................................................................................................................................ 47 Liquidity Ratio ................................................................................................................................... 47 1
  • 3. Analysis of Fixed and Floating Interest Rates 2010 Current Ratio ................................................................................................................................. 47 Quick Ratio .................................................................................................................................... 48 Profitability Ratio .............................................................................................................................. 49 Operating Profit Margin (PBIDTM) ............................................................................................... 49 Net Profit Margin .......................................................................................................................... 50 Cash Profit Margin ........................................................................................................................ 50 Return on Capital Employed ......................................................................................................... 51 Return on Net Worth .................................................................................................................... 51 EPS................................................................................................................................................. 52 Solvency Ratios ................................................................................................................................. 53 Debt- Equity Ratio ......................................................................................................................... 53 Intrest Coverage Ratio .................................................................................................................. 54 Activity Ratios ................................................................................................................................... 54 Receivables Turnover Ratio .......................................................................................................... 55 Inventory Turnover Ratio .............................................................................................................. 55 Fixed Asset Turnover Ratio ........................................................................................................... 55 Capital Market Behaviour ................................................................................................................. 56 P/E Multiple .................................................................................................................................. 56 Beta ............................................................................................................................................... 57 Chapter III Procedures in Bond Raising Steps in Issuing Bonds ........................................................................................................................... 60 Dematerialization Process .................................................................................................................... 68 Listing Process ....................................................................................................................................... 70 Debt Servicing ....................................................................................................................................... 72 Chapter IV Characterstics of Bonds Yield or IRR ............................................................................................................................................ 78 Current Yield ................................................................................................................................. 78 Yield to Maturity ........................................................................................................................... 78 Annualised Yield ............................................................................................................................ 78 Yield to Call / Put ........................................................................................................................... 79 Price- Yield Relationship ................................................................................................................... 79 Duration ................................................................................................................................................ 80 Macaulay’s Duration ..................................................................................................................... 80 Modified Duration......................................................................................................................... 80 2
  • 4. Analysis of Fixed and Floating Interest Rates 2010 Convexity............................................................................................................................................... 81 Yield of PSU and GSec Bonds ................................................................................................................ 82 Duration of PSU and GSec Bonds .......................................................................................................... 90 Convexity of PSU and GSec Bonds ........................................................................................................ 95 Chapter V Analysis of Fixed and Floating Interest Rates Introduction ........................................................................................................................................ 100 Fixed Intrest Rate ............................................................................................................................ 100 Floating Intrest Rate........................................................................................................................ 102 Indian Issuers going for FRBs .......................................................................................................... 104 GOI Floating Rate Bonds ............................................................................................................. 104 Indian Railway Finance Corporation Limited (IRFCL) .................................................................. 105 Power Finance Corporation Limited, .......................................................................................... 105 ICICI Bank .................................................................................................................................... 106 Others ......................................................................................................................................... 106 The Debt Servicing for PGCIL’s Bonds ................................................................................................. 107 Floating Intrest for PGCIL’s Bonds....................................................................................................... 109 Assumptions.................................................................................................................................... 109 Selection of Bonds .......................................................................................................................... 109 Selection of Reference Rate ............................................................................................................ 110 Reset Period and Reference Period ................................................................................................ 113 Spread ............................................................................................................................................. 113 Floating Rate under Reference Rate of Average yield of 1 Year GSec ............................................ 114 Bond VIII ...................................................................................................................................... 114 Bond IX ........................................................................................................................................ 116 Bond X ......................................................................................................................................... 118 Bond XIII- Opt II ........................................................................................................................... 120 Bond XIV ...................................................................................................................................... 122 Floating Rate under Reference Rate of Average yield of 10 year GSec .......................................... 124 Bond VIII ...................................................................................................................................... 124 Bond IX ........................................................................................................................................ 125 Bond X ......................................................................................................................................... 127 Bond XIII- Opt-II........................................................................................................................... 129 Bond XIV ...................................................................................................................................... 130 Floating Rate under Reference Rate of Average yield of 10 year GSec .......................................... 132 3
  • 5. Analysis of Fixed and Floating Interest Rates 2010 Floating Rate under Reference Rate of Average yield of 10 year GSec- Average Spread of last 12 months ............................................................................................................................................ 135 Summary of Each Base Rate ........................................................................................................... 135 Factors Effecting The Selection Of Each Method............................................................................ 137 Term ............................................................................................................................................ 137 Coupon Rate................................................................................................................................ 137 Market Condition ........................................................................................................................ 138 Quantum of Loan ........................................................................................................................ 139 Repayment Structure .................................................................................................................. 139 Time of Issue ............................................................................................................................... 140 Chapter VI Findings and Recommendations Critical Analysis of Alternatives........................................................................................................... 142 Fixed Coupon Interest Rate ............................................................................................................ 142 Floating Rate ................................................................................................................................... 142 Fixed Coupon Rate with Option ...................................................................................................... 144 Recommendation................................................................................................................................ 145 References .......................................................................................................................................... 146 4
  • 6. Analysis of Fixed and Floating Interest Rates 2010 Table of Figures and Charts FIGURE 1 TREND OF AVERAGE TRADE SIZE - WDM ......................................................................................................... 23 FIGURE 2 CAPITAL COMPOSITION FROM 1996 TO 2009 ................................................................................................... 27 FIGURE 3 SOURCES OF FUNDS- 2008-09 ....................................................................................................................... 28 FIGURE 4 APPLICATIONS OF FUNDS- 2008-09 ................................................................................................................ 29 FIGURE 5 TREND IN SHARE CAPITAL .............................................................................................................................. 30 FIGURE 6 SHARE HOLDING PATTERN AS ON 31ST DEC 2009 ............................................................................................. 31 FIGURE 7 SHARE HOLDING PATTERN ............................................................................................................................. 31 FIGURE 8TREND IN RESERVES AND SURPLUS ................................................................................................................... 33 FIGURE 9 TREND IN NON CONVERTIBLE DEBENTURES ....................................................................................................... 33 FIGURE 10 TREND IN TERM LOANS INSTITUTIONS ............................................................................................................ 34 FIGURE 11 TREND IN TERM LOANS BANKS ..................................................................................................................... 34 FIGURE 12 TREND IN DEFERRED CREDIT ......................................................................................................................... 34 FIGURE 13 TREND IN UNSECURED LOANS....................................................................................................................... 35 FIGURE 14 DEBT COMPOSITION FROM 2003 TO 2009..................................................................................................... 36 FIGURE 15 TREND IN CURRENT LIABILITY........................................................................................................................ 36 FIGURE 16 TREND IN FIXED ASSETS ............................................................................................................................... 37 FIGURE 17 TREND IN INVESTMENTS .............................................................................................................................. 38 FIGURE 18 COMPARISON OF FIXED ASSETS AND INVESTMENTS ........................................................................................... 38 FIGURE 19 TREND IN COMPOSITION OF CURRENT ASSETS ................................................................................................. 39 FIGURE 20 MULTI STEP ANALYSIS OF INCOME................................................................................................................. 40 FIGURE 21 TREND IN INCOMES .................................................................................................................................... 41 FIGURE 22 TREND IN DIFFERENT PROFITS ....................................................................................................................... 42 FIGURE 23 DIVIDEND TREND ....................................................................................................................................... 42 FIGURE 24 PROFIT APPROPRIATIONS OVER THE YEARS ...................................................................................................... 43 FIGURE 25 LIQUIDITY RATIOS....................................................................................................................................... 48 FIGURE 26 OPERATING PROFIT MARGINS ...................................................................................................................... 50 FIGURE 27 NET PROFIT MARGINS................................................................................................................................. 51 FIGURE 28 EPS TREND ............................................................................................................................................... 52 FIGURE 29 DEBT EQUITY RATIO ................................................................................................................................... 53 FIGURE 30 INTEREST COVER RATIO ............................................................................................................................... 54 FIGURE 31 P/E RATIO ................................................................................................................................................ 57 FIGURE 32 RESIDUAL PLOT FOR BETA ............................................................................................................................ 58 FIGURE 33 YIELD CURVE OF PGXXX ............................................................................................................................. 88 FIGURE 34 YIELD CURVE OF GSEC 8.20% ...................................................................................................................... 88 FIGURE 35 YIELD CURVE OF PFC (S-57) ........................................................................................................................ 89 FIGURE 36 MODIFIED VS MACAULAY'S DURATION .......................................................................................................... 93 FIGURE 37 DURATION VS MATURITY ............................................................................................................................ 93 FIGURE 38 DURATION VS YIELD ................................................................................................................................... 94 FIGURE 39 DURATION VS CONVEXITY ............................................................................................................................ 97 FIGURE 40 COUPON RATE VS CONVEXITY (SAME MATURITY) ............................................................................................ 98 FIGURE 41 COUPON RATE VS CONVEXITY (SAME DURATION) ............................................................................................ 98 FIGURE 42 COUPON RATE OF PG VS GSEC RATE........................................................................................................... 108 FIGURE 43 COUPON RATE OF PG VS AVG GSEC YIELD ................................................................................................... 108 FIGURE 44 TREND OF 10 YR GSEC YIELD ..................................................................................................................... 111 FIGURE 45 TREND OF 1YR GSEC YIELD ........................................................................................................................ 111 FIGURE 46 TREND OF COUPON RATES OF PG BONDS ..................................................................................................... 112 5
  • 7. Analysis of Fixed and Floating Interest Rates 2010 FIGURE 47 RATES OF PG BONDS VS 1 YR GSEC YIELD .................................................................................................... 112 FIGURE 48 INTREST PAYMENTS UNDER FIXED AND FLOATING RATE FOR PGVIII FOR 1 YEAR GSEC AS REFERENCE RATE .............. 116 FIGURE 49 INTEREST PAYMENT UNDER FIXED AND FLOATING RATES FOR PGIX FOR 1 YEAR GSEC AS REFERENCE RATE ............... 118 FIGURE 50 INTEREST PAYMENT UNDER FIXED AND FLOATING RATES FOR PGX FOR 1 YEAR GSEC AS REFERENCE RATE ................ 120 FIGURE 51 INTEREST PAYMENTS UNDER FIXED AND FLOATING RATES FOR PGXIII FOR 1 YEAR GSEC AS REFERENCE RATE............ 121 FIGURE 52 INTEREST PAYMENTS UNDER FIXED AND FLOATING RATE FOR PGXIV FOR 1 YEAR GSEC AS REFERENCE RATE ............. 123 FIGURE 53 INTEREST PAYMENTS UNDER FIXED AND FLOATING RATE FOR PGIX FOR 10 YEAR GSEC AS REFERENCE RATE ............. 127 FIGURE 54 INTREST PAYMENTS UNDER FIXED AND FLOATING RATES FOR ALL BONDS FOR 10 YEAR GSEC AS BASE RATE ............. 134 FIGURE 55 COMPARISON OF FIXED AND FLOATING IN CASE OF ADVERSE MARKET CONDITIONS............................................... 139 6
  • 8. Analysis of Fixed and Floating Interest Rates 2010 Table of Tables TABLE 1 CAPITAL COMPOSITION FROM 1996 TO 2009 .................................................................................................... 27 TABLE 2 SHARE HOLDING PATTERN FROM 2007 TO 2009 ................................................................................................ 31 TABLE 3 TOP 10 SHARE HOLDERS AS ON 29.01.2009 ..................................................................................................... 32 TABLE 4 CASH FLOW STATEMENT ................................................................................................................................. 45 TABLE 5 LIQUIDITY RATIOS .......................................................................................................................................... 48 TABLE 6 OPERATING PROFIT MARGINS .......................................................................................................................... 49 TABLE 7 NET PROFIT MARGINS .................................................................................................................................... 51 TABLE 8 RETURNS...................................................................................................................................................... 52 TABLE 9 TURNOVER RATIOS......................................................................................................................................... 56 TABLE 10 REGRESSION OUTPUT ................................................................................................................................... 57 TABLE 11 LIST OF BONDS SELECTED FOR STUDY ............................................................................................................... 83 TABLE 12 YIELD TO MATURITY OF PG XXXI.................................................................................................................... 85 TABLE 13 COMPUTATION OF YIELD OF GSEC BOND.......................................................................................................... 85 TABLE 14 YTM AND CURRENT YIELD OF ALL BONDS ........................................................................................................ 86 TABLE 15 MODIFIED AND MACAULAY'S DURATION OF PGXXXI ......................................................................................... 91 TABLE 16 MODIFIED AND MACAULAY'S DURATION OF GSEC ............................................................................................. 91 TABLE 17 MACAULAY'S AND MODIFIED DURATION OF ALL BONDS ..................................................................................... 92 TABLE 18 CONVEXITY OF PGXXXI ................................................................................................................................ 96 TABLE 19 CONVEXITY OF ALL BONDS............................................................................................................................. 97 TABLE 20 FRBS BY GOI ............................................................................................................................................ 105 TABLE 21 FRBS BY IRFC ........................................................................................................................................... 105 TABLE 22 FRBS BY PFC ............................................................................................................................................ 106 TABLE 23 FRBS BY ICICI BANK .................................................................................................................................. 106 TABLE 24 FRBS BY OTHERS ....................................................................................................................................... 106 TABLE 25 LIST OF BONDS SELECTED FOR ANALYSIS ......................................................................................................... 109 TABLE 26 DETERMINATION OF SPREAD FOR PGVIII FOR 1 YEAR GSEC AS REFERENCE RATE ................................................... 114 TABLE 27 FLOATING RATES FOR PGVIII FOR 1 YEAR GSEC AS REFERENCE RATE ................................................................... 115 TABLE 28 INTREST UNDER FIXED AND FLOATING RATES FOR PGVIII FOR 1 YEAR GSEC AS REFERENCE RATE .............................. 115 TABLE 29 CALCULATION OF SPREAD FOR PGIX FOR 1 YEAR GSEC AS REFERENCE RATE ......................................................... 116 TABLE 30 FLOATING RATES FOR PGIX FOR 1 YEAR GSEC AS REFERENCE RATE ..................................................................... 117 TABLE 31 INTEREST UNDER FIXED AND FLOATING RATES FOR PGIX FOR 1 YEAR GSEC AS REFERENCE RATE............................... 117 TABLE 32 CALCULATION OF SPREAD FOR PGX FOR 1 YEAR GSEC AS REFERENCE RATE .......................................................... 119 TABLE 33 FLOATING RATES FOR PGX FOR 1 YEAR GSEC AS REFERENCE RATE ...................................................................... 119 TABLE 34 INTEREST UNDER FIXED AND FLOATING RATE FOR PGX FOR 1 YEAR GSEC AS REFERENCE RATE .................................. 119 TABLE 35 CALCULATION OF SPREAD FOR PGXIII FOR 1 YEAR GSEC AS REFERENCE RATE ....................................................... 121 TABLE 36 FLOATING RATES FOR PGXIII FOR 1 YEAR GSEC AS REFERENCE RATE ................................................................... 121 TABLE 37 INTEREST UNDER FIXED AND FLOATING RATES FOR PGXIII FOR 1 YEAR GSEC AS REFERENCE RATE ............................ 121 TABLE 38 CALCULATION OF SPREAD FOR PGXIV FOR 1 YEAR GSEC AS REFERENCE RATE ....................................................... 122 TABLE 39 FLOATING RATES FOR PGXIV FOR 1 YEAR GSEC AS REFERENCE RATE................................................................... 122 TABLE 40 INTERESTS UNDER FIXED AND FLOATING RATES FOR PGXIV FOR 1 YEAR GSEC AS REFERENCE RATE ........................... 123 TABLE 41 FLOATING RATES FOR PGVIII FOR 10 YEAR GSEC ............................................................................................ 125 TABLE 42 INTERESTS UNDER FIXED AND FLOATING FOR PGVIII FOR 10 YEAR GSEC.............................................................. 125 TABLE 43 CALCULATION OF SPREAD FOR PGX FOR 10 YEAR GSEC AS REFERENCE RATE ........................................................ 126 TABLE 44 FLOATING RATES FOR PGIX FOR 10 YEAR GSEC AS REFERENCE RATE ................................................................... 126 TABLE 45 INTERESTS UNDER FIXED AND FLOATING FOR PGIX FOR 10 YEAR GSEC ................................................................ 127 TABLE 46 TOTAL INTREST UNDER FIXED AND FLOATING RATES FOR ALL BONDS UNDER 10 YEAR GSEC AS BASE RATE ................ 132 7
  • 9. Analysis of Fixed and Floating Interest Rates 2010 TABLE 47 SUMMARY OF COSTS UNDER 1 YEAR GSEC AS BASE RATE.................................................................................. 135 TABLE 48 SUMMARY OF COSTS UNDER 10 YEAR GSEC AS BASE RATE ( COUPON PERIOD) ..................................................... 135 TABLE 49 SUMMARY OF COSTS UNDER 10 YEAR GSEC AS BASE RATE ( INTEREST PAYMENT PERIOD)....................................... 136 8
  • 10. Analysis of Fixed and Floating Interest Rates 2010 Acknowledgement The satisfaction and joy that accompanies the successful completion of a task is incomplete without mentioning the names of those who extended their help and support in making it a success. The Project Titled “Analysis of Fixed and Floating Rates of Bonds of Power Grid Corporation of India Limited “has not been a success without the priceless support and assistance of Mr. K.C. Pant (Chief Manager Finance-Bonds, Power Grid Corporation of India Limited), Mr. Sandesh Nagrare (Chief Accountant- Bonds, Power Grid Corporation of India Limited) and Mr. S.V. Venkat (Chief Manager, Finance-Bonds, Power Grid Corporation of India Limited). I am greatly indebted to Prof. Vinay Dutta (Chairperson, Finance, FORE School of Management), Prof. Kanhaiya Singh (Sr. Faculty, Finance, FORE School of Management) and Prof. Himanshu Joshi (Faculty, Finance, FORE School of Management) for their invaluable guidance and direction provided to me in the course of the study. A special word of thanks to Prof. Nalin Jain (Faculty, Marketing, FORE School of Management), who has been a constant support and guided me in the report. I also wish to express my gratitude and gratefulness towards Mr. Ranjan Srivastav (AGM- Finance, Power Grid Corporation of India Limited), Mr. V.C. Jagannathan (Executive Director-Finance, Power Grid Corporation of India Limited) and also Mr. Venkat Krishna (Vice President, ICICI Securities Primary Dealership Ltd) Date: 12 May 2010 Place: New Delhi Madhusudan Partani 9
  • 11. Analysis of Fixed and Floating Interest Rates 2010 Chapter I INTRODUCTION  Introduction  Purpose of Study  Objectives  Scope  Data  Review of Literature  Introduction to Bond Market 10
  • 12. Analysis of Fixed and Floating Interest Rates 2010 Introduction The project done with the Power Grid Corporation of India Limited in their Finance department, Bonds Section, is a study on Cost and Benefit analysis of Fixed and Floating rate bonds. Intrest payment under both the methods is computed for bonds with different characteristics (Maturity, Coupon rate and Amount). Recommendation has been made on suitability of each method under different conditions. Also the Valuation and Convexity measures like Duration, Yield, Convexity have also been computed for all the Bonds issued by Power Grid Corporation of India Limited and also few GSec Bonds and other corporation bonds. Also The Securities Exchange Board of India (SEBI), the regulator of Capital Markets, has made wide array of policies and guidelines with respect to issue of bonds. Thus it is per se necessary to study the procedural aspects of issuing bonds, the legal aspects and also the provisions and guidelines. The scope of the study is extended to Debt-Servicing Process, listing process and dematerialisation process. And Analysis of Financial statements using different tools like Horizontal analysis of Income and Position Statement, Cash Flow Analysis, Ratio Analysis has been done. Apart from the above mentioned aspects, the behaviour of GSec Yields, Comparison of interest rates on bonds issued by Power Grid Corporation of India Limited with the Government Yield has also been done. 11
  • 13. Analysis of Fixed and Floating Interest Rates 2010 Objectives The Objectives of study are as follows:  Comparison of Cost of each bond in case of present system of fixed coupon rate with Floating Coupon rate. And to study the suitability of each method for different kinds of bonds having different maturity, different coupon rate and different loan quantum.  To study the Characteristics in terms of Macaulay’s Duration, Convexity, and YTM; of each bond issued by PGCIL and also to compare the same with other GSec Bonds and other corporate bonds.  To study and understand the procedural aspects of issuing the bonds, their listing, debt servicing and dematerialisation.  Financial Performance Analysis of Power Grid Corporation of India Limited using different techniques like Ratio Analysis, Cash Flow Analysis, Balance sheet and Profit and Loss Analysis. The secondary Objectives will be:  To study the behaviour of yields on 10 Year and 1 Year GSec papers  To Understand the Power sector and the value chain of the industry. 12
  • 14. Analysis of Fixed and Floating Interest Rates 2010 Purpose of Study Bonds have become one of the important sources for long term funds in the present scenario. The central government, the state government, PSUs, Banks, and also Corporate issue bonds regularly to raise long term funds. Along with the Primary Issues, the trading in Exchanges has also improved rapidly. The average trade size has increase from Rs.6.64 Crores in 1994-95 to Rs.23.42 Crs in the year 2009-10. Thus it is per se necessary to study the Bond market and also understand the growing importance of Bonds as the source of long term finance. It is by itself very indispensable to study the financial condition of the company, its financial strength in terms of profitability, solvency, liquidity etc... To understand the company. Thus Financial Statement Analysis has been done and study of Balance Sheet, profit and loss, Sources and applications of funds, Cash flow analysis and also ratio analysis has been done. As mentioned before, the Bonds have become one of the favoured preferences for the long term funds. And Power Grid Corporation of India Limited issues Bonds periodically, thus to study the Bonds and understand the mechanism, it was a necessity to understand the procedural aspects and legal aspects of issuing the bonds. Thus a detailed study of each and every aspect of issue of bond ranging from Approval, Listing, Dematerialisation, to Debt Servicing has been studied. The bond market is not only flooded from supply side, but also there is a rapid growth on demand side by many fresh players entering the market. The investors in Bonds include Banks, Insurance companies, Mutual Funds, Provident Funds, Pension Funds and other such funds o different companies. Thus it is necessary to study the characteristics of the bond and compute their Yields, Duration, and Sensitivity by means of Convexity. And since there are different kinds of bonds issued by different bodies, the comparison amongst them is also necessary. The Power Grid Corporation of India Limited’s Debt structure has changed substantially over the years. From 35% Unsecured Loans and 13% Secured loans in the total Capital Mix in the year 1996- 97, the composition has changed to 7% Unsecured and 58% Secured loans in the year 2009-10. And of these 58%, approx 38% is comprised of Secured Bonds. As on 31st march 2010, the company has Bonds outstanding worth Rs.21420.4 Crs and on these a total Intrest of Rs 1500 Crs is paid annually. And the interest rate paid is fixed. In simple words the interest rate determined at the time of issue is kept fixed throughout the tenure of the bond irrespective of the market condition. Alternatively the company could even go for floating rate Bonds whose interest rate is floating i.e... Varies with the market conditions. Thus a study has been done to compute the savings in cost under floating rate mechanism. But since the regulations do not allow the company to take risk of fluctuations in interest rates, and also in this competitive scenario, cost saving has became one of the most important tool. Thus instead of floating rate, if the company issues the bonds at an appropriate and at favourable time period, which lead to low coupon rate and ultimately cost savings has been also studied. 13
  • 15. Analysis of Fixed and Floating Interest Rates 2010 Scope For the purpose of comparing the cost under fixed and floating Rate five bonds issued by Power Grid Corporation of India Limited with different tenures, different repayment structure, different coupon rates and different loan amounts were taken. And the Intrest on them under both the methods has been computed from the date of issue to the latest Intrest payment has been computed taking different spreads and different reference rates as per the Industry practices. And for studying the duration, Yields and Sensitivity of the Bonds, all the Bonds issued by Power Grid Corporation of India Limited and which are active are selected. Along with these Two GSec bonds and bond series (S-57) issued by Power Finance Corporation has been selected. For studying the procedural aspects, the steps of the issue, Dematerialisation, Rating, Listing etc have been studied by referring to the process of issue of Power Grid Bonds XXX issued on 29 th September 2009. And for the financial performance analysis, specific study has been done based on the financial figures of the financial year 2008-09. The scope was not extended to the latest FY 2009-10 because the audited results were not yet published till the preparation of this report. And for studying the trend and growth, the figures of last 8 years starting from 2003 has been selected. 14
  • 16. Analysis of Fixed and Floating Interest Rates 2010 Data For the purpose of study the data has been collected from the Company’s Balance Sheets, The details of Loans and Intrest payments schedules as provided from the internal records of the company and also different correspondence letters, approval letters, legal documents as provided by the company were used. For historical yields on GSec Papers the data has been collected from Reuters Database1. And for determining the spread for the purpose of deciding the floating rate, the data on spreads as published by FIMMDA2 has been used. And also data published by RBI related to GSec and also the Data from Indiastat has been used. For computing the Duration, Yields and Convexity, the present value has been taken from the NSE websites WDM (Wholesale Debt Segment). 1 A premium Database which provides the data on Global Macro Economic Indicators 2 Fixed Income Money Market and Derivatives Association of India 15
  • 17. Analysis of Fixed and Floating Interest Rates 2010 Review of Literature For the purpose of understanding the concepts and having the thorough knowledge of Bonds and also to have background knowledge of topics like Floating rate, to understand the valuation concepts of bonds, the procedural aspects, different articles, papers, reports and other literature has been studied. Some of the literature is: WHAT PRACTITIONERS NEED TO KNOW .....? ABOUT DURATION AND CONVEXITY Mark Kritzman, Windham Capital Management Financial Analysts Journal (Nov-Dec 1992) The paper is on Duration and Convexity of Bonds. It has the concept of Macaulay’s Duration and the author has explained why the time weighted PVs of future cash flows are to be considered instead of just PVs. The author has also extended the scope of paper by discussing the property of Duration that with constant YTM and Coupon Payments, the increase in Maturity will increase duration but the rate of increase is lower. Modified Duration, which measures sensitivity of price of bond to the changes in yield, does not accurately predict the sensitivity for the larger changes in YTM. Thus he proposes to use Convexity as measure of sensitivity. Convexity measures sensitivity of price of bond to the change in Duration. Apart from the concept of Convexity and Duration, the author has also explained the application of these measures in Portfolio management. How they can be used to leverage the price appreciation in case of fall in rates by increasing the duration of the portfolio. Also how it can be used in hedging the liabilities. The author has also shared how the portfolio can be immunized from interest rate shifts by setting its duration equal to the investors’ holding g period. In a nutshell, the paper introduces one to Duration and other valuation techniques and also it shows the applicability of each. From this literature I am able to understand the concepts of Macaulay’s Duration, Modified Duration, and Convexity and also their computation and inferences. A “DURATION” FALLACY Miles Livingston and John Caks The Journal of Finance (Vol XXXII No.1 March 1977) As the title of the paper itself portrays that content is related to a fallacy in general opinion on Duration. The authors wish to prove that duration is a function of the yield curve but the yield curve is not the function of duration. Thus one cannot ‘correct the yield curve for the duration’ because bonds with identical duration do not necessarily have identical yields. They have proved this by comparing and analysing the two bonds of similar duration. Also they have concluded that that if bonds with identical durations always have identical yields to maturity, then the entire term structure of interest rates is determined by the first two rates; given 16
  • 18. Analysis of Fixed and Floating Interest Rates 2010 r1 and r2, we can calculate r3 and then (recursively) all subsequent forward rates. This result contradicts experience and the theoretical work done on term structure. ‘POWER SECTOR IN INDIA’ WHITE PAPER ON IMPLEMENTATION CHALLENGES AND OPPORTUNITIES KPMG (Jan 2010) It is an annual report on Power Sector published by KPMG. This paper throws light on Industry overview, the value chain, and the different players in each business operation namely generation, transmition and distribution. The paper also discusses the regulations in this sector which are paving the way for private sector participation. Also the challenges in this sector which needs to be tackled are also discussed. Some of the prominent challenges are the Project Execution, The scarcity of fuel, Equipment shortage, Manpower Shortage, problems in land acquisition and Environment clearance. This paper helps in understanding the power sector in general, and its structure. And also the challenges in that sector can be understood. SEBI (DISCLOSURES AND INVESTORS PROTECTION) GUIDELINES, 2000 Securities Exchange Board of India, the sole regulator of Capital market in India, issues various guidelines to regulate the capital market of the nation. The DIP Guidelines were issued for the purpose of protecting investors from fraudulent practices by issuers and also to ensure maximum disclosure. It has guidelines with respect to Offer letter, its contents, the promoters share, lock-in period, requirements for issuing IPOs, Guidelines on Advertising of issue, guidelines on Pricing of issue etc... The copy of the above mentioned guidelines has many regulations which are not under purview of my study. Thus only few aspects were studied. The review of them is as follows: The objectives of these guidelines are: i. Enhance level of protection of investors ii. To increase transparency and efficiency of primary market iii. To strengthen disclosure and eligibility norms of the issuer iv. Rationalize and simplify operational procedures in primary market. The guidelines on Book building process, Green Shoe Option, Disclosure requirement in the offer document and guidelines pertaining to issue of Debentures were studied to have foreground knowledge of various guidelines. 17
  • 19. Analysis of Fixed and Floating Interest Rates 2010 INFORMATION MEMORANDUMS Then Information Memorandum or Disclosure Document is similar to an invitation letter to the investors, inviting them to invest in the issue. As per SEBI, this offer document must have all the details as mentioned by it and which are important and material for investor. Thus it has the company profile, the challenges and strengths, the financial history, latest financial data, share holding pattern, details of previous issues of similar security etc... It also has the details of the issue, the structure of issue, details on Open and close of issue, the details Arrangers, bankers, Registrar, Trustee etc By studying this document one can understand the company profile and its financial position in a gist. Also every minute detail of a particular issue like the interest payment, the terms and conditions, redemption details, listing details can be understood from this document. For the purpose of understanding the issue structure and coupon rate determination, IMs of various bonds of Power Grid Corporation of India Limited have been studied. Also to understand the Intrest rate determination under Floating rate mechanism and the terms under that mechanism, the IMs of previous issues of FRBs by firms including Power Finance Corporation, Railway Finance Corporation Limited, ICICI Bank, IDBI Bank, and Kotak Mahindra etc... were studied. WORKING MANUAL FOR DOMESTIC RESOURCE PLANNING AND MOBILISATION IN P OWER GRID The Power Grid Corporation of India Limited for its internal policies has a manual on Resources rising. The document has the policies as defined by its Articles of Association and as vested by Board with related to Borrowing power, the authority, accountability for activities related to resource rising (including Term loans and Bonds). The document also has the procedure of rising funds through Bonds and also through term loan from banks, the Debt Servicing, the book building process, conversion of bonds from Physical to Demat, statutory compliance etc. It also has the formats of each letter to be sent to various parties like Registrar, Arranger, Investor, Stock Exchange, Depository etc... The guidelines by SEBI and the copy of internal guidelines are also included. Thus overview of fund raising process along with legal and procedural aspects can be understood from this document. 18
  • 20. Analysis of Fixed and Floating Interest Rates 2010 Introduction The debt market is much more popular than the equity markets in most parts of the world. In India the reverse has been true. Nevertheless, the Indian debt market has transformed itself into a much more vibrant trading field for debt instruments from the rudimentary market about a decade ago. The sections below encompass the transformation of government and corporate debt markets in India along with a comparison of the developments in equity market. Developments in Government Bond Market Prior to 1992, money was collected and lent according to Plan. Lacunae in institutional infrastructure and inefficient market practices characterized the government securities market. In fact the sole objective pursued was to keep the cost of government borrowing as low as possible. If planning went awry, the government sent word to its banker. The central bank made a few phone calls to the heads of banks and bonds were issued and the money arranged. No questions asked, no explanations given. The GOI bond market did not use trading on an exchange. It featured bilateral negotiation between dealers. The market thus lacked price-time priority and the bilateral transactions imposed counterparty credit risk on participants. This narrowed down the market into a “club” with homogeneous credit risk. This was the state of the government debt market in India ten years ago. The major thrust of Financial Reforms commenced in 1992. This was when the contours of the debt market began taking shape. The idea of the financial reform movement was to have more and more different markets and not necessarily have whole financial intermediation left to the banks. The reform process attempted at doing away with regulations in favour of controls based on market forces i.e. an era where the interest rates are governed more by the market forces of demand and supply and less by centralized supervision. Slowly, but steadily, the market grew, adding fresh players and novel instruments. Several measures have added greater transparency and have brought the issuances closer to the market levels. The major reforms that took place in the 1990’s were: • Introduction of the auction system for sale of dated government securities in June1992. This signalled the end of the era of administered interest rates. • The RBI moved to computerize the SGL and implement a form of a ‘delivery versus payment’ (DvP) system. The DvP enabled mitigating of settlement risk in securities and ensured the smoothness of settlement by synchronizing the payment and delivery of securities. • Innovative products in form of Zero Coupon Bonds and Capital Indexed Bonds (Ex. Inflation Linked) were issued to attract a wider gamut of investors. However, the pace of innovation suffered due to non-sophistication of the markets and lack of persistence with some of the new bonds like Inflation Indexed bonds after the initial lukewarm response. 19
  • 21. Analysis of Fixed and Floating Interest Rates 2010 • The system of Primary Dealers was established in March 1995. These primary dealers have since then acquired a large chunk of share in the GOI bond market and have played the role of market makers. • The RBI setup “trade for trade” regime, a strong regulatory system which required that every trade must be settled with funds and bonds. All forms of netting were prohibited. • Wholesale Debt Market (WDM) segment was set up at NSE; a limited degree of transparency came about through the WDM at NSE, where roughly half the trading volume of India’s GOI bond market is reported. • The Ways And Means agreement put an end to issuance of ad hoc treasury bills, the government’s favourite instrument of funding its profligacy. • Interest Income in G-Secs was exempted from the purview of TDS. • FIIs with 100% Debt Schemes were allowed to invest in GOI Securities and T-Bills while other FIIs were allowed 30% investment in these instruments. • Dematerialised forms of securities in G-Secs were done through the SGL and Constituents SGL accounts. The above-mentioned measures have served in bringing about greater market orientation of the sovereign issues. This is particularly important as the sovereign borrowing parameters have a direct bearing on the cost of capital for other non-sovereign issuers. The Primary market for G-Secs registered an almost ten-fold increase between 1990-91 and 1998-99. The broadening of the market was also apparent from the fact that RBI’s participation, as reflected by absorption of primary issues, came down from 45.90% in 1992-93 to 0.74% in 1994-95. Though significant improvements have been made in the primary market, the secondary market continued to be plagued by certain shortcomings like dominance of a few players (acted as a deterrent to lending width in the market), strategy of holding to maturity by leading players (prevented the improvement in the depth of the market), the pre-1992 “telephone market” continued to exist (prevents information dissemination and hence price discovery is limited) and low retail participation in G-Secs continues to exist even today. Experts believe that there is tremendous potential for widening the investor base for Government securities among retail investors. This requires a two-pronged approach, increasing their awareness about Government securities as adoption for investment and improving liquidity in the secondary market that will provide them with an exit route. Also infrastructure is seen as the vital element in the further development and deepening of the market. Corporate Bond Market In the last decade, market related borrowings by the corporate sector have remained depressed as a plethora of Financial Institutions were available for disbursal of credit. These Institutions managed to mobilize a significant amount of domestic savings and route them for corporate consumption. 20
  • 22. Analysis of Fixed and Floating Interest Rates 2010 Also the reforms abolished the office of the Controller of Capital Issues (CCI), which meant that companies were free to price their equity issues as per the market appetite. This led to a slew of primary issue of equity and the relative attractiveness of issue of debt yielded way to equities. In fact, even debt issues were made with attached sweeteners like convertible portion of the fixed income instrument. In addition, several relaxations in regulations post 1992 have encouraged Indian corporate to raise debt from overseas capital markets leading to further shunning of the domestic debt market by creditworthy issuers. Therefore, the corporate debt market in India has continued to be dominated by the PSU’s. In the recent past, the corporate debt market has seen high growth of innovative asset-backed securities. The servicing of debt and related obligations for such instruments is backed by some sort of financial assets and/or credit support from a third party. Over the years greater innovation has been witnessed in the corporate bond issuances, like floating rate instruments, zero coupon bonds, convertible bonds, callable (put-able) bonds and step-redemption bonds. For example, step bonds issued by ICICI in 1998, paid progressively higher rates of interest as the maturity approached while the IDBI’s step bond was issued with a feature to pay out the redemption amount in instalments after an initial holding period. The deep discount bond issued by IDBI in the same year had two put and call options before maturity. What these innovative issues have done is that they have provided a gamut of securities that caters to wider segment of investors in terms of maintaining a desirable risk-return balance. Over the last five years, corporate issuers have shown a distinct preference for private placements over public issues. This has further cramped the liquidity in the market. While private placement has grown 6.23 times to Rs. 62461.80 crores in 2000-2001 since 1995-96, the corresponding increase in public issues of debt has been merely 40.95 percent from the 1995-96 levels. The dominance of private placement in total issuances is attributable to a number of factors. First, the lengthy issuance procedure for public issues, in particular, the information disclosure requirements, provide a strong incentive for eligible entities to opt for the private placement route. Secondly, the costs of a public issue are considerably higher than those for a private placement. Thirdly, the amounts that can be raised through private placements are typically larger than those that can be garnered through a public issue. Also, a corporate can expect to raise debt from the market at finer rates than the prime-lending rate of banks and financial institutions only with an AAA rated paper. This limits the number of entities that would find it profitable to enter the market directly. Thus the public issues market has over the years been dominated by financial institutions, which is exemplified by the fact that ICICI and IDBI accounted for the entire debt offerings in 1998–99 and all but one issue in 1999–2000. Another interesting fact is that in spite of dominating the public issues market even financial institutions have raised significantly larger amounts through the private placement route. Further the secondary market for non-sovereign debt, especially corporate paper remains plagued by inefficiencies. The primary problem is the total lack of market making in these securities, which consequently lead to extremely poor liquidity. The biggest investors in this segment of the market, 21
  • 23. Analysis of Fixed and Floating Interest Rates 2010 namely LIC, GIC and UTI prefer to hold the instruments to maturity, thereby truncating the supply of paper in the market. The secondary market for corporate did receive a boost with the waiver on stamp duty payment on transfer of debt securities, as long as they are dematerialized debentures, in the Finance Bill 2000. Development of Equity Market vs. the Debt Market During this decade of financial reforms development in equity market has been striking as compared to relatively minor changes in the debt market. In terms of sheer market size, the equity market saw a drop from 42% of GDP in 1993–94 to 28.6% of GDP in 2000-01. Over the same period, the GOI bond market saw an increase in market size, fuelled by large fiscal deficits, from 28% of GDP in 1993–94 to 36.7% of GDP in 2000–01. Other things being equal, this should have generated an improvement in liquidity of the GOI bond market and a reduction in liquidity in the equity market. Instead, changes in market design on the equity market over this period gave the opposite outcome, where the improvement in liquidity on the equity market was superior to that observed on the GOI bond market. The reasons for this have been manifold: • Foreign capital inflows into the GOI bond market are relatively undesirable to policy-makers. This is in contrast with capital inflows into the equity market, where policy-makers seek to have the largest possible capital inflows. Hence, infirmities in the market design on the GOI bond market do not generate an important opportunity cost as far as harnessing foreign capital inflows are concerned. • In the presence of “development finance institutions” and banks, firms in India are seen as having access to debt financing, access to debt finance was therefore not seen as a major bottleneck hindering investment. Hence, the lack of a liquid bond market was not keenly seen as a constraint in investment and growth. • In the case of the GOI bond market, the benefits from a non-transparent market with entry barriers accrue primarily to banks and PDs. The PDs are largely the creation of RBI and public sector banks have extremely close ties with RBI. The RBI is the regulator for G-Secs market. Thus the development of equity markets took precedence over development of debt market in India but the future does seem promising for the debt market. The Bond market has been growing popularity over the years. This can be seen from the following chart depicting the average trade value in Wholesale Debt Segment 22
  • 24. Analysis of Fixed and Floating Interest Rates 2010 Average Trade Size- WDM Segment 35.00 30.00 25.00 Rs. Crores 20.00 15.00 10.00 5.00 0.00 Jun-04 Jun-94 Jun-96 Jun-98 Jun-00 Jun-02 Jun-06 Jun-08 Oct-95 Oct-97 Oct-99 Oct-01 Oct-03 Oct-05 Oct-07 Oct-09 Feb 99 Feb-95 Feb-97 Feb-01 Feb-03 Feb-05 Feb-07 Feb-09 Figure 1 Trend of Average Trade Size - WDM From the above trend chart, the tremendous growth of trade in Debt segment can be clearly demonstrated. The average trade size i.e. Value of each trade has increased from a meagre amount of Rs. 30 Lacs in the June 1994 to Rs 7.24 Crores in June 2004 to 29.94 in March 2010. There has been a multi fold 23
  • 25. Analysis of Fixed and Floating Interest Rates 2010 Chapter II Financial Statement Analysis  Balance Sheet Analysis  Profit and Loss Analysis  Cash Flow Analysis  Ratio Analysis 24
  • 26. Analysis of Fixed and Floating Interest Rates 2010 Financial Statements Analysis To understand the performance of a concern and to forecast its financial position and financial strength it is per se necessary to analyse its financial statements. Though a firm makes huge profits but faces liquidity concerns and though a firm is poor profitability compared to others but yet is rated as financially strong firm. Thus to comment on ones financial position and financial performance, it is not possible to comment based on one parameter. Different parameters like profits, activity, leverage, liquidity, Investments, turnovers, returns, ratios etc is to be analysed. Different financial statements that can be analysed are Balance Sheet (Position Statement), Profit and Loss Account (Performance Statement), Cash Flow Statement, Funds flow statement, Apart from these there are some non-financial reports which are also part of Annual report of a company, and they are Directors report, Industry Analysis, Auditors report, Third party disclosures, etc.. Some of the popular tools used for the effective analysis of the financial statements are  Multi-Step Analysis ( Balance Sheet, Profit and Loss and Cash Flows)  Common Size Analysis  Comparative Analysis ( Over the years or with Peers)  Index  Trend Analysis  Ratio Analysis 25
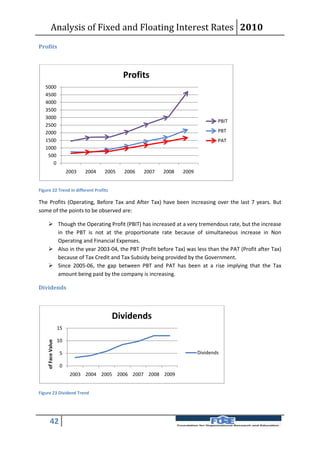
  • 27. Analysis of Fixed and Floating Interest Rates 2010 Balance Sheet Analysis Balance Sheet is one of the most important sources for analysing the financial position of any company. Some of the very important aspects that can be analysed using the Multi Step Analysis of the Balance Sheet are Capital Composition, Sources and Application of Funds, Trends in Shareholding Patterns, Trend of Self and Borrowed Funds. Composition of Loans, Trends in fixed assets, analysis of Working capital etc.... Capital Composition Capital is one of the import and prime source of funds. It is a long term source and comprises of Shareholders Capital (L1), Reserves (L2), Secured loans (L3) and Unsecured loans (L4). From the flowing stacked area chart and also from the table following things can be interpreted:  The proportion of Share Capital in total capital is reducing every year. This implies the firm is going on leveraging itself and trading on equity. It also implies the firm is not using its equity route but either reinvesting the profits or borrowing loans. In the year 2007 though 10% fresh equity was issued to the public by the route of IPO the proportion has reduced because of continuous borrowings as Secured Debentures and Loans. The contribution has reduced from 35 % in 1996 to just 9% in 2009.  The Reserves and Surplus which includes the reinvestment of profits as retained earnings has been increasing from 16% to 25%. This implies firm is in the path of expansion and instead of distributing the earnings in form of dividends to the shareholders it is retaining and ploughing back the profits in the business.  There has been an exponential increase in the secured Loans which comprises of Debentures, Loans from Banks and Loans from Institutions. The company to fulfil its Cap-Ex requirements has a practice of issuing Secured Non Convertible Redeemable Debentures. Also it takes term loans from banks and Loans from Multi-Lateral agencies like World Bank and Asian Development Bank. The share of this source has increased from 13% to as high as 58%. But since the firm has security backed with these loans, it is most preferred by the investors. But over the years in the same trend continues, there may be liquidity concerns and also solvency issues. And a high financial risk is also attached with the loans as they demand regular payment of interest and principal no matter if the financial performance is good or bad. Default in payment impacts the rating and impairs borrowing ability.  The Loans from Unsecured Borrowings is regarded as the most risky source as there is no security backed for it and also the interest rates are very high due to high risk. The Unsecured loans have been on fall over the years. There has been a rise in the years 2001 and 2006 due to unexpected borrowing needs. But over the years the company is trying to repay its unsecured loans which are very costly.  Overall the Capital Structure of the firm is changing over the years, from a less leveraged firm of (D/E) less than 1; it has reached to leveraged ratio of 1.92. And also the proportion of Secured loans has been on a rise to compensate the fall in equity and unsecured loans contribution. But analysis of Absolute amounts of each source and also analysis of self and borrowed funds need to be done for better understanding. 26
  • 28. Analysis of Fixed and Floating Interest Rates 2010 Capital Composition 100% 14.34% 11.69% 9.72% 17.82% 14.62% 90% 22.06% 27.69% 80% 24.56% 35.31% 26.50% 26.28% 25.53% 70% 23.78% 22.08% 18.54% 60% 16.03% 50% 58.38% 40% 13.33% 23.45% 27.17% 32.14% 36.55% 41.64% 48.73% 30% 20% 30.32% 28.68% 26.25% 10% 35.33% 22.55% 18.49% 13.08% 7.34% 0% 1996 1997 1998 1999 2000 2001 2002 2003 2004 2005 2006 2007 2008 2009 Unsecured Loans Secured Loans Reserves Total Share Capital Figure 2 Capital Composition from 1996 to 2009 Share Reserves Secured Unsecured Capital Total Loans Loans 1996 35.31% 16.03% 13.33% 35.33% 1997 30.92% 17.45% 19.51% 32.12% 1998 27.69% 18.54% 23.45% 30.32% 1999 24.55% 19.83% 25.09% 30.52% 2000 22.06% 22.08% 27.17% 28.68% 2001 20.00% 24.53% 23.25% 32.23% 2002 17.82% 23.78% 32.14% 26.25% 2003 15.83% 24.48% 34.59% 25.10% 2004 14.62% 26.28% 36.55% 22.55% 2005 14.14% 26.04% 40.01% 19.81% 2006 14.34% 25.53% 41.64% 18.49% 2007 12.52% 23.60% 43.15% 20.73% 2008 11.69% 26.50% 48.73% 13.08% 2009 9.72% 24.56% 58.38% 7.34% Table 1 Capital Composition from 1996 to 2009 27
  • 29. Analysis of Fixed and Floating Interest Rates 2010 Sources and Application of Funds Every firm has different sources of funds like share capital, reserves, Loans, Debentures, Current liability, public borrowings etc... And the funds are borrowed for some specific applications like fixed assets, Investments, Current Assets etc... An analysis of the sources is to be done for the purpose of assessing the costs and also the applications to analyse the profitability. It is necessary to invest the funds in profitable resources to earn good Return on Investment and fulfil the expectations of the stake holders. Following pie-charts show the sources of funds and applications of the same for the year 2008-09. Total Current Sources of Funds- 2008-09 Liabilities Term Loans 19% (Institutions) 1% Term Loans (Banks) Unsecured Loans Non Convertible 1% 6% Debentures Secured 28% Loans Deferred Credit 47% 17% Reserves and Surplus 20% Share Capital Reserves and Surplus Unsecured Loans Total Current Liabilities Non Convertible Debentures Term Loans (Institutions) Share Capital 8% Figure 3 Sources of Funds- 2008-09 From the above chart on Sources of Funds, following interpretations can be made:  The company has just 28% of the sources as shareholders Funds (Non borrowed funds) this implies the firm is highly leveraged. But seeing the nature of the business of the firm which is into power transmission and with many projects regularly under implementation, it faces high capital requirement. Thus it depends on the borrowed funds.  As mentioned earlier, the firm is a high growth firm thus has just 19% from Short term sources like suppliers credit and customers advance.  Highest is being contributed by Secured Loans which has Non Convertible Debentures, Deferred Credit and Term Loans.  The firm prefers to raise loan by issuing the Non Convertible Debentures because it has less interest rate than term loans and are the availability of Option of moratorium period which matches with the gestation period of the projects. 28
  • 30. Analysis of Fixed and Floating Interest Rates 2010  Unsecured loans which are very costly due to high rates of interest when compared to secured loans are just 6%.  The firm in the year 2009 has funds of Rs. 53787.32 Crores. Applications of Funds- 2008-09 Total Current Assets Investments 15% 3% Net Block Capital Work in Progress Capital Net Block Work in Investments 57% Progress Total Current Assets 25% Figure 4 Applications of Funds- 2008-09 The application of funds implies the avenues where the investment is made to earn the revenue and to carry on the activities as per the objectives of the business.  Being a capital intensive firm, the 57% of the funds are invested in Net Block i.e... Fixed assets like Transmission Grids, transmitters etc...  As high as 25% of the resources are invested in Capital WIP (Work in progress), this signifies that the company is in the path of expansion and is undertaking the projects. The Capital WIP implies the funds given as advance to the contractors, the Under Construction buildings and plants, etc...  Just 3% of the funds are into Investment and 15% in current assets. We can infer that either the firm has operational excellence in Working capital management or since it is Under Expansion stage the investment in short term assets is low. From the Sources and Applications it can be analysed that 15% of short term Assets (CA) is wholly financed by the Current liabilities which is 19%. This implies the firm is matching its short term requirements with short term sources. This may be termed as aggressive strategy because the Permanent and temporary working capital is being financed by the short term funds. 29
  • 31. Analysis of Fixed and Floating Interest Rates 2010 Share Capital After analysing the various sources and Applications of funds, it is now necessary to analyse the trend in each component of the sources and application over the years. The share capital has been increasing over the years; this is because of the companies borrowing from Government of India by allotting the shares. Pre-Listing i.e... Before 2007, the company used to allotment shares for this purpose. In the year 2008, there has been rise in shares allotted because of Initial Public Offer on 26th September 2007. Under the plan of Disinvestment of Public Undertakings, 10% of fresh shares and 5% of government of India’s holding was issued to the public. In the year 2008 to 2009, the number of shares and the share capital is constant implying no further issue of share capital is made. However there is news of further disinvestment through FPO in the year 2010, so there may be change in share capital in the year 2010-11. Share Capital 4,500.00 4,000.00 3,500.00 3,000.00 2,500.00 2,000.00 Share Capital 1,500.00 1,000.00 500.00 0.00 2003 2004 2005 2006 2007 2008 2009 Figure 5 Trend in Share Capital Share Holding Pattern Not only the share capital but also the holding pattern of the same shall be studied. Since Power Grid Corporation is one of the Public Undertaking, the maximum holding is with the Government of India. Only after September 2007, i.e... After the Disinvestment, the holding pattern was diluted. The holding reduced to 86.37%. Through the issue, the Government of India (promoter) sold its 5% stake and also fresh equity of 10% of the total share capital was issued. As on 31 st of December 2009, Institutional and Non Institutional investors have almost equal contribution of 7%. 30
  • 32. Analysis of Fixed and Floating Interest Rates 2010 Share Holding Pattern as on 31st Dec 2009 Non Promoter (Institution) Non Promoter (Non- 7% Institution) 7% Government(Central / State) Non Promoter (Institution) Government(Central Non Promoter (Non-Institution) / State) 86% Figure 6 Share Holding Pattern as on 31st Dec 2009 Share Holders 31-12- 31-03- 31-03- 19-04- 2009 2009 2008 2007 Government(Central / State) 86.37% 86.37% 86.37% 100.00% Individuals / Hindu Undivided Family 0.00% 0.00% 0.00% 0.00% Financial Institutions / Banks 1.13% 0.66% 0.37% 0.00% Foreign Institutional Investors 1.62% 2.58% 2.89% 0.00% Insurance Companies 3.68% 2.37% 0.97% 0.00% Mutual Funds / UTI 0.66% 0.79% 0.65% 0.00% Bodies Corporate 1.65% 1.69% 1.93% 0.00% Individuals (up to Rs. 1 lakh) 4.17% 5.10% 6.10% 0.00% Others 0.73% 0.45% 0.72% 0.00% Table 2 Share Holding Pattern from 2007 to 2009 Share Holding Pattern Government(Central / State) Financial Institutions / Banks Foreign Institutional 31-12-2009 Investors Insurance Companies 31-03-2009 31-03-2008 Individuals holding upto 19-04-2007 Rs. 1 lakh Figure 7 Share Holding Pattern 31
  • 33. Analysis of Fixed and Floating Interest Rates 2010 Name of Share Holder No. Of Shares (%) ( of Rs. 10 each) President Of India ( Ministry of Power) 3533637935 83.96% President Of India ( Ministry Of Development Of North East 101269800 2.41% Region) Life Insurance 60342943 1.43% Corporation Of India LIC Of India - Market Plus 48942430 1.16% LIC Of India Money Plus 38713829 0.92% Janus Contrarian Fund 32210129 0.77% LIC Of India Market Plus – 1 23728370 0.56% ICICI Prudential Life 20647334 0.49% Insurance Company Ltd. Life Insurance 8105330 0.19% Corporation Of India Profit Plus HDFC Standard Life 5950579 0.14% Insurance Company Limited Total 3873548679 92.03% 3 Table 3 Top 10 Share Holders as on 29.01.2009 Some of the supposition that can be made analysing the holding pattern over the years and the Top ten shareholders is:  The holding of promoter (Government) has reduced to 86.37% post IPO. But after that the holding is constant implying no further dilution or no further issue has been made.  Over the years the holding of Individuals holding up to Rs. 1 lakh (i.e... Retail Investors) is falling  Holding of Insurance Companies is increasing over the years, which implies that the company is attracting that kind of clients.  Also the holdings by FIIs are on the fall and are compensated by holdings of Financial Institutions which is increasing.  From the list of Top 10 shareholders and the proportion of their holdings, it can be very clearly observed that the holding is very much skewed.  92% of total share capital is held by the top 10 shareholders. Thus the Ownership and control is under few hands. Brief note on Initial Public Offering The corporation has come up with Initial Public Offer in the month September, 2007 with an issue size up to573, 932,895 equity shares of Rs. 10 each for cash at a price of Rs. 52 per equity share aggregating Rs. 2985crores. The issue comprised a fresh issue of up to 382,621,930 equity shares and an offer for sale of up to191,310,965 equity shares by the President of India acting through the Ministry of Power, Government of India. The issue comprised a net issue to the public of up to 559,954,895 equity shares and a reservation of up to 13,978,000 equity shares for subscription by employees at the issue price. The issue comprised approximately 13.64% of the fully diluted post- issue capital of POWERGRID. 3 Source: Final Disclosure Document for XXXI issue of Bonds of Power Grid (www.nseindia.com) 32
  • 34. Analysis of Fixed and Floating Interest Rates 2010 Reserves Reserves and Surplus 12000 10000 8000 6000 4000 Reserves Total 2000 0 Figure 8Trend in Reserves and Surplus The Reserves in the form of General reserve, Capital Reserve, Share Premium, Debenture Redemption reserve and Profit and Loss Account’s Credit balance are maintained. There has been continuous increase in the reserves over the years. In the year 2008, the steep increase is attributable to the share premium account started after the IPO. The shares were issued at a premium of Rs. 42 per share. Overall, the company is able to retain the earnings and ploughing back them to fund the capital expansion plans. Secured Loans The secured loans in specific to Power Grid Corporation of India Limited comprises of Debentures, Loans from banks like Indian Overseas Bank, Corporation Bank, Punjab National Bank; Loans from Institutes like Asian Development Bank, and World Bank (IBRD) and Deferred Credit. Non Convertible Debentures 20000 15000 10000 5000 0 Non Convertible Debentures Figure 9 Trend in Non Convertible Debentures 33
  • 35. Analysis of Fixed and Floating Interest Rates 2010 Term Loans Institutions 1000 800 600 400 200 0 2004 2005 2006 2007 2008 2009 Term Loans Institutions Figure 10 Trend in Term Loans Institutions Term Loans Banks 1000 500 0 2004 2005 2006 2007 2008 2009 Term Loans Banks Figure 11 Trend in Term Loans Banks Deferred Credit / Hire Purchase 10000 8000 6000 Deferred Credit / Hire 4000 Purchase 2000 0 2000 2001 2002 2003 2004 2005 2006 2007 2008 2009 Figure 12 Trend in Deferred Credit 34
  • 36. Analysis of Fixed and Floating Interest Rates 2010 From the above facts and figures and the trend of growth over the years, following analysis can be made:  There has been a constant increase in the amount of Loan from Non Convertible debentures. From a mere amount of Rs. 1139 Crores in the year 2000-01, the amount has exponentially increased to Rs. 15112 Crores in the year 2009-10.  Usually the firm issues Non Convertible, Secured, Taxable, and Redeemable Bonds with a rating of AAA/ LAAA which implies the most secured investment being issued by the credit rating agencies like CRISIL, CARE and ICRA. Due to the security, and Ratings, the firm is able to attract funds at a lower rate than compared to the rate being paid in case of term loans.  At present as on 31st March 2010, the firm has issued 32 series of bonds and 26 Bonds are active and interest is being paid on them.  The Term Loans from Institutions mainly has the loans from LIC at different rates. This amount is depleting over the years as it is redeemed in equal instalments every year. And also since they are raised at rate of 10% or high, the firm is proffering to repay the amount.  The Term Loans from Banks include loans from banks like ICICI, PNB, and IOB etc... Over the years the loan from this source is also on the fall. This is mainly because the firm prefers to issue bonds as they have a moratorium period of 3-4 years and also the Intrest rates are lower there. And in case of Term loans the rates are linked to PLR and thus there are wide fluctuations.  Loans in form of Deferred Credit or Hire Purchase are used to finance the Machines and Plants purchase. Since the firm is expanding and has many projects under implementation the machines and plants are being financed through this operation. Unsecured Loans Unsecured Loans 7000 6000 5000 4000 3000 Unsecured Loans 2000 1000 0 Figure 13 Trend in Unsecured Loans 35
  • 37. Analysis of Fixed and Floating Interest Rates 2010 The Unsecured loans have been in a constant range and they include Unsecured Bonds, Loans from Institutions and Banks at a higher rate and without a security. In the year 2007, there has been a steep increase in the secured loans because of Increase in borrowings from secured Bonds. Debt-Composition 100% 90% 80% 70% 60% 50% Unsecured Loans 40% 30% Secured Loans 20% 10% 0% Figure 14 Debt Composition from 2003 to 2009 From the above chart it can be very clearly commented that the composition of secured loan has been increasing over the years. This is mainly because of issuing of secured bonds and redemption of unsecured bonds. Current Liability Current Liability 12000 10000 8000 6000 Provisions 4000 Current Liabilities 2000 0 2003 2004 2005 2006 2007 2008 2009 Figure 15 Trend in Current Liability 36
  • 38. Analysis of Fixed and Floating Interest Rates 2010 One of the component of sources of Funds and which is short term in nature is Current Liability. Some of the observations that can be made are:  The Current Liabilities has increase from Rs. 1646 Crores in the year 2003-04 to as high as Rs.10472 Crs in the year 2009-10.  Also the Proportion of Provisions for deferred tax and Debtors is increasing over the year. This is mainly because of guidelines issued by CERC (Central Electricity Regulations Code), which has the guidelines of making provisions as per the Tariff system for its customers who are SEBs since the financial position of SEBs is not sound. Fixed Assets Fixed Assets 35000 30000 25000 20000 Net Block 15000 Capital Work in Progress 10000 5000 0 2003 2004 2005 2006 2007 2008 2009 Figure 16 Trend in Fixed Assets Some of the observations that can be made are:  The point that the firm is under a rapid expansion stage is very clear from the trend in growth of fixed assets.  The Fixed assets have increased at an exponential rate. This is mainly because of the National Grid project.  Also the firm has many projects under implementation stage thus has a high amount in Capital Work in progress, which include the advances to the supplier of machinery, Under construction plants and buildings etc... 37
  • 39. Analysis of Fixed and Floating Interest Rates 2010 Investments Investments 2500 2000 1500 1000 Investments 500 0 2003 2004 2005 2006 2007 2008 2009 Figure 17 Trend in Investments The firm has investments of its residual surplus in the income earning instruments. But since the CREC guidelines do not permit them to invest in different Money market instruments like Commercial papers, Certificate of Deposits etc... It is permitted to invest only into the safest and also secured securities like fixed deposits. And also though the amount in investments is not much fluctuating, but this must be compared with that of fixed assets. From the following chart, it is very clearly evident that the firm invests its surplus into fixed assets than in investments. Only the surplus which cannot be invested into capital creation is invested in those avenues. Also though the fixed assets proportion is exponentially increasing, the proportion of investments is constant. Fixed Assets: Investments 45000 40000 35000 30000 25000 Fixed Assets 20000 15000 Investments 10000 5000 0 2003 2004 2005 2006 2007 2008 2009 Figure 18 Comparison of Fixed Assets and Investments 38
  • 40. Analysis of Fixed and Floating Interest Rates 2010 Current Assets Current Assets 9000 8000 7000 6000 Loans and Advances 5000 Inventories 4000 3000 Sundry Debtors 2000 Cash and Bank 1000 0 2003 2004 2005 2006 2007 2008 2009 Figure 19 Trend in Composition of Current Assets The short term applications of the funds are Current Assets. These are the assets which can be converted to cash in less than a year. The current assets have been at an increase over the years. Following analysis can be done:  The Cash and Bank balance, which signifies the actual cash in hand of the firm, has increased over the years. From a negligible amount of Rs. 118 Crores in the year 2003-04 the balance has increased to Rs. 2428 Crores in the year 2009-10. This implies that the firm has good liquidity management and holds cash in hands. But this also implies that the firms opportunity cost of holding cash is high since the same can be invested in other avenues and get returns.  The Sundry debtors which were very high or the year 2003-04 have decreased over the years and have increased in the year 2009-10. This could be due to the expansion in the operations and also since the customers are mainly SEBs (State electricity Boards), whose financial position is weak, thus the debtors have increased.  Being a capital intensive firm it has very least amount of Inventories which are in form of spares, consumables etc... The amount is very negligible compared o the other components.  The Loans and advances have been increased. This can be because of short term loans to its subsidiaries.  Overall, if we compare the current assets and Current liabilities position, the firm is able to match the current assets and current liabilities and is adopting Matching approach of working capital management by financing the short term needs by short term sources. 39
  • 41. Analysis of Fixed and Floating Interest Rates 2010 Profit and Loss Analysis After analysing the components of balance sheet which depicts the financial positions of the firm, it is also per se necessary to study the financial performance of the firm. The Profit and Loss account or the Income Statement of the firm for the financial year very truly depicts the profitability of the firm. The aspects like Operating Income, Sales, Profits and expenses can be analysed from this statement. Multi-Step Analysis of Incomes 30000 25000 Sales 20000 PBIDT 15000 PBIT 10000 Sales PBDT PBIDT PBT 5000 PBIT PBDT PAT PBT 0 PAT 2003 2004 2005 2006 2007 2008 2009 Figure 20 Multi Step Analysis of Income Multi Step Analysis Implies analysing each and every component of the Profits and expenses. This helps in analysing the behaviour of different costs namely, Depreciation, Non Operating Expenses, Financial Expenses, Taxes etc... Some of the analyses that can be made are:  The sales have been increasing over the year and the blue portion which depicts the Operating Expenses; it is increasing at a variable rate with the increase in the sales.  The PBIDT (Operating Profit) is increasing in tandem with the sales.  The PBIT (Profit before Intrest and Taxes) is also increasing but the increase in the PBIT is less than the increase in the sales in the year 2009 because of more than proportionate increase in the operating expenses.  The purple segment which represents Intrest expenses have been at a raise over the years because of high borrowings by the firm in form of Loans and debentures. The raise is disallowing the firm to take advantage of operating leverage. But yet the proportionate increase in PBDT or PBT is more than that of sales.  As discussed before the proportionate increase in PBDT (Profit before Depreciation and Taxes) is more than the increase in Sale. This is because of the operating leverage enjoyed by the firm due to presence of the fixed expenses in form of depreciation and Intrest. 40
  • 42. Analysis of Fixed and Floating Interest Rates 2010  The Green proportion which corresponds to Depreciation is increasing due to continuous additions in the fixed assets.  The PBT (Profit before Tax) which is arrived at after deducting the Depreciation from PBDT and the PAT (profit After Tax) which is resultant after Tax amount is deducted from the PBT are growing at a same tandem. This implies there has been no change in the Tax rate, which is represented by the colour Sky Blue in the above chart. Sales/ Operating Income Operating Income 7000 6000 5000 4000 3000 Operating Income 2000 1000 0 2003 2004 2005 2006 2007 2008 2009 Figure 21 Trend in Incomes Operating Income is one of the very vital sources of revenue for any firm. The profits, the activity and all the important performance parameters are measured in relation to this factor. Some of the observations that can be made from the above trend chart are:  The main object of the business as defined by the Memorandum of Association is to transmit the power and it has been termed as CTU (Central Transmission Unit) by the Central Government.  Since there are few competitors in form of SEBs and no firm with the similar size of Power Grid Corporation of India Limited, thus it has a near monopoly in this sector.  The continuous increase in sales/ Transmission Income can be regarded to the fact that the business is expansion.  In the year 2007, the firm entered into the business of Telecommunication ( leasing of over head lines) and Consultancy ( consultancy to other countries and also consulting the Govt project of RGGVY)  Seeing the growth of Operating Income from Rs.2103 Crores to Rs.6579 Crores between the years 2003 and 2010, it can be remarked that the company has a good performance 41
  • 43. Analysis of Fixed and Floating Interest Rates 2010 Profits Profits 5000 4500 4000 3500 3000 PBIT 2500 2000 PBT 1500 PAT 1000 500 0 2003 2004 2005 2006 2007 2008 2009 Figure 22 Trend in different Profits The Profits (Operating, Before Tax and After Tax) have been increasing over the last 7 years. But some of the points to be observed are:  Though the Operating Profit (PBIT) has increased at a very tremendous rate, but the increase in the PBT is not at the proportionate rate because of simultaneous increase in Non Operating and Financial Expenses.  Also in the year 2003-04, the PBT (Profit before Tax) was less than the PAT (Profit after Tax) because of Tax Credit and Tax Subsidy being provided by the Government.  Since 2005-06, the gap between PBT and PAT has been at a rise implying that the Tax amount being paid by the company is increasing. Dividends Dividends 15 10 of Face Value 5 Dividends 0 2003 2004 2005 2006 2007 2008 2009 Figure 23 Dividend Trend 42
  • 44. Analysis of Fixed and Floating Interest Rates 2010 The dividends are one of the ways in which the company can return the earnings to the share holders. The dividends depict the profitability of the company. From the above chart it can be clearly seen that the dividends are growing over the year. Pre-2007, when Government of India (The President of India) was the sole share holder/promoter, the number of shares issued to it kept on changing every year. The capital requirement was funded by the government by means of Equity capital infusion. Thus the dividend proportion has also increased. And in the year 2008 and 2009, after the IPO, when apart from GoI, general public too participated in the shareholding pattern; the dividend percentage has remained same. Also pre 2007, the face value of shares was Rs.100 and from the year 2007 the face values of the shares have changed to Rs.10. The analysis of the Dividend payment can be made more effective by studying the Retention and payout ratio. It can be seen from the following graph that, the retention of profits which is represented by the colour green, is very high in the initial years, but the payout ratio has increased over the years and especially after the IPO (Disinvestment). But the retention ratio is always at least 60-70% which depicts that the firm is reinvesting and pooling back its earnings into the business instead of distributing it to the shareholders. By this it also signals that the internal rate of return of the firm is higher than the Share holders expectation thus the earnings are retained back. Profits Appropriation 100% 90% 80% 70% 60% 50% 40% 30% Payout 20% 10% Retaintion 0% 2003 2004 2005 2006 2007 2008 2009 2003 2004 2005 2006 2007 2008 2009 Payout 31.47 37.07 31.52 31.32 24.2 17.07 15.72 Retaintion 68.53 62.93 68.48 68.68 75.8 82.93 84.28 Figure 24 Profit Appropriations over the years 43
  • 45. Analysis of Fixed and Floating Interest Rates 2010 Cash Flow Analysis Cash is regarded as the blood of any business. A company may be highly profitable with high balances in general and Capital reserve, with a good asset value and high Net worth. But the situation will be worsening if cash positions are low. A firm with a very high profitability but with constrained liquidity would face the problem of solvency. Thus it is per se necessary to analyse and study the cash flows from various sources and also its application. The Cash flow statement is divided into three parts namely Cash from Operating activities, cash from Investing activities and cash from financial activities. The cash flow statement for the year 2009 and 2008 are: Cash Flow Statement 200903 200803 Cash and Cash Equivalents at Beginning of the year 1865.59 1196.82 Cash Flow From Operating Activities Net Profit before Tax & Extraordinary Items 2228.57 1730.53 Total Adjustments (PBT & Extraordinary Items) 3518.25 2111.69 Op. Profit before Working Capital Changes 5746.82 3842.22 Adjustment For WC Changes 1048.29 -629.48 Cash Generated from/(used in) Operations 6795.11 3212.74 Direct Taxes Paid -154.02 -221.91 Net Cash from Operating Activities 6641.09 2990.83 Cash Flow from Investing Activities Purchased of Fixed Assets -770.82 0 Sale of Fixed Assets 0 261.01 capital WIP -8652.78 -6075.15 Sale of Investments 182.89 241.13 Interest Received 132.99 149.99 Dividend Received 19.54 5.39 Investment in Group Cos -39.5 -10.35 Others -29.07 84.67 Net Cash Used in Investing Activities -9156.75 -5343.31 44
  • 46. Analysis of Fixed and Floating Interest Rates 2010 Cash Flow From Financing Activities Proceeds from Issue of shares (incl share premium) 0 1989.63 Proceed from 0ther Long Term Borrowings 7629.85 4118.71 Proceed from Short Term Borrowings 750 750 Of the Long Term Borrowings -1427.89 -1180.73 Of the short term Borrowings -750 -750 Dividend Paid -505.08 -464.28 Interest Paid -2532.09 -1339.55 Others -85.84 -102.53 Net Cash From Financing Activities 3078.95 3021.25 Net Inc/(Dec) in Cash and Cash Equivalent 563.29 668.77 Cash and Cash Equivalents at End of the year 2428.88 1865.59 Table 4 Cash Flow Statement Some of the analyses that can be made from the above cash flow statement are:  The cash flows from operating activities, which imply the cash generated by performing the business activities has increased from previous year. It has grown by approximately 122% which is very positive.  Mainly there has been rise in cash flows from profits.  Also the cash from Working capital was negative in the previous year implying more current assets were used in the previous year. But in the current year the cash from working capital is negative, this implies that the cash has been generated from the Current liabilities.  The cash from Investing activity is negative this implies the firm is investing into assets and other income generating investments.  The cash used in financing activities has increased by 71% over the previous year.  Fixed assets worth Rs. 770 Crores were purchased this year implying the firm is expanding its scope of operation and also the fact that Assets worth Rs. 261 crores were sold last year and the figure of sale has been 0 this year.  The Capital working Progress is very high at Rs.8 Thousand Crores. And also the amount has increased by 42% over the previous year. The main reason behind this is the projects undertaken by the company are of long completion and long implementation [period, thus lot of amount gets blocked as WIP.  The firm is also generating some cash from the sale of Investments and also inform of income on the investments like Intrest and dividends.  The cash from Financing activities include the cash generated from the resource raising activities in form of loans shares etc... It also includes the repayments of the earlier loans and the interest and dividends paid on them.  There has been not much change in the cash generated from financing activities; it has risen by just 2 % over the previous year. 45
  • 47. Analysis of Fixed and Floating Interest Rates 2010  There has been a high amount being generated by issue of shares in the year 2007-08 because the shares were issued to public in form of IPO in the month of September, 2007.  The Long term borrowings in form of issue of debentures (Bonds) domestic and international loans, has risen with a steep rate of 85% over the previous year.  Some amount is also used in repayment of the borrowed short and long term funds.  The amount used as repayment of interest towards the funds borrowed has also increased by 89%. This is tandem with the rise in borrowed funds which has risen by 85%.  Overall the firm is generating cash from Financing and Operating Activities i.e. from its normal business course and also from borrowings and using all the funds in Investment activities like investing in fixed assets and other income generating investments.  Overall the cash balance has increased by 30% over the previous year.  Overall the cash flows are well managed, but the firm is unable to fulfil its requirements from the operational activities and has to depend on borrowings. But since it is in rapid expansion stage the borrowings are inevitable. 46
  • 48. Analysis of Fixed and Floating Interest Rates 2010 Ratio Analysis After analysing the balance sheet, the analysis of sources and applications of funds, profit and loss analysis and also the cash flow analysis, It is per se necessary to also analyse the financial ratios of the company. The financial analysis as a detached without comparing the figures with each other is incomplete analysis and will not lead to true analysis. Thus every figure must not only be analysed over the years but must also be compared with the other components of the same year. It is a tool used by individuals to conduct a quantitative analysis of information in a company's financial statements. Ratios are calculated from current year numbers and are then compared to previous years, other companies, the industry, or even the economy to judge the performance of the company. Ratio analysis is predominately used by proponents of fundamental analysis. Some of the important aspects of ratio analysis are to scrutinize the profitability, liquidity, solvency, as well as the efficiency of the company. Some of the important classes of ratios are:  Liquidity Ratios  Profitability Ratios  Turnover / Activity Ratios  Solvency Ratio In the following section, the ratios of above mentioned heads foe Power Grid Corporation of India Limited will be computed for last 5 years from 2004-05 to 2008-09. Also these figures will be compared with the Industry average. Since there are very few players in the power transmission, the benchmark of power generation industry has been considered. Liquidity Ratio These set of ratios help in analysing the liquidity position of the company. They can be defined as a class of financial metrics that is used to determine a company's ability to pay off its short-terms debts obligations. Generally, the higher the value of the ratio, the larger the margin of safety that the company possesses to cover short-term debts. Liquidity ratios provide information about a firm's ability to meet its short-term financial obligations. They are of particular interest to those extending short-term credit to the firm. Two frequently-used liquidity ratios are the current ratio (or working capital ratio) and the quick ratio. Current Ratio The current ratio is the ratio of current assets to current liabilities: = Short-term creditors prefer a high current ratio since it reduces their risk. Shareholders may prefer a lower current ratio so that more of the firm's assets are working to grow the business. Typical values for the current ratio vary by firm and industry. For example, firms in cyclical industries may maintain a higher current ratio in order to remain solvent during downturns. 47
  • 49. Analysis of Fixed and Floating Interest Rates 2010 Quick Ratio One drawback of the current ratio is that inventory may include many items that are difficult to liquidate quickly and that have uncertain liquidation values. The quick ratio is an alternative measure of liquidity that does not include inventory in the current assets. The quick ratio is defined as follows: − = The current assets used in the quick ratio are cash, accounts receivable, and notes receivable. These assets essentially are current assets less inventory. The quick ratio often is referred to as the acid test. The company’s Current Ratio and Quick ratio for the year 2009-10 is 0.79 and 0.77 times respectively. This infers that the company’s current liability is not covered fully by the current assets. In case of unforeseen demand for payment from the current liabilities arises, the company will not be in a position to honour them as it does not has enough current assets. Also the quick ratio is less than its idle point of 1. The quick ratio considers the quick ratio which can be converted into cash in a very short term. The ratio less than 1 implies the company is unable to maintain enough marketable assets to cover the current liabilities. But these ratios must also be compared with the overall industry standards. 2008-09 2007-08 2006-07 2005-06 2004-05 Current Ratio 0.793768 0.799878 0.577718 0.605015 0.810153 Quick Ratio 0.765338 0.762923 0.54741 0.564984 0.752983 Industry- CA 1.66 1.58 1.48 1.61 1.56 Table 5 Liquidity Ratios Liquidity Ratio 1.8 1.6 1.4 1.2 Current Ratio 1 2008-09 2007-08 2006-07 2005-06 2004-05 Quick Ratio 0.8 Industry- CA 0.6 0.4 0.2 0 Figure 25 Liquidity Ratios 48
  • 50. Analysis of Fixed and Floating Interest Rates 2010 After comparing the Current Ratio of Industry and the company along the years, it can be seen that, the Current Asset ratio of the company is always lower than the standard level of the industry. This implies that the liquidity position of the company vis a vis the industry standard is poor. Also though the level fell in the year 2005-06 but has increase over the years after the year 2006-07. The Quick ratio is also in tandem with the Current ratio implying that the company’s inventory level over the year is constant. And the gap between these two ratios depicts the inventory position, and it can be seen that the gap is less over the years, thus the average investment in inventory is very less. Profitability Ratio The profitability ratio is useful to measure the profitability of the company. Its ability to generate returns on the capital invested. These can be understood as set of ratios that are used to assess a business's ability to generate earnings as compared to its expenses and other relevant costs incurred during a specific period of time. For most of these ratios, having a higher value relative to a competitor's ratio or the same ratio from a previous period is indicative that the company is doing well. Profitability ratios show a company's overall efficiency and performance. We can divide profitability ratios into two types: margins and returns. Ratios that show margins represent the firm's ability to translate sales into profits at various stages of measurement. Ratios that show returns represent the firm's ability to measure the overall efficiency of the firm in generating returns for its shareholders. Operating Profit Margin (PBIDTM) The Operating profit margin helps in determining the ability of the firm to convert what proportion of the sales into the operating profit. The Operating profit here implies the Profits before Interest, Depreciation and Tax (PBDIT). It is computed as: = Alternatively, Instead of taking PBDIT as the Operating profit, PBDT i.e... Operating profit after deducting the Intrest expenses also needs to be studied in this case, as the company has approx 60% of its capital structure as borrowings and high proportion of the income is paid as interest. The PBDT implies Profits Before Depreciation and Taxes. For the year 2008-09, the PBDITM for the company and the industry standard was 89.08% and 36.37% respectively. And PBDTM for the company and the industry standard was 50.6 % and 28.24% respectively. The figures for over the years for the company as well as the industry are: 2008-09 2007-08 2006-07 2005-06 2004-05 PBIDTM (%) 89.08 87.44 96.28 90.95 94.16 PBDTM (%) 50.6 58.41 64.52 60.83 61.7 PBIDTM (%)- Industry 36.37 29.96 28.66 37.09 39.73 PBDTM (%)- Industry 28.24 23.7 21.7 28.88 30.84 Table 6 Operating Profit Margins 49
  • 51. Analysis of Fixed and Floating Interest Rates 2010 Operating Profit Margin 120 100 PBIDTM (%) 80 PBDTM (%) 60 40 PBIDTM (%)- Industry 20 PBDTM (%)- Industry 0 2008-09 2007-08 2006-07 2005-06 2004-05 Figure 26 Operating Profit Margins From the figures it can be stated that the company’s profitability position is excellent. It is able to maintain margins at a much higher level when compared to the industry standards. The main reason behind this is the company’s diversified profile. It has not restricted itself to Power transmission, but has also entered into Consultation and Telecom. Also the PBIDTM and PBDTM are in tandem for the years before 2007-08. In the year 2007-08, the PBDTM has decreased disproportionately when compared to PBDITM and the main reason behind this is the company’s increased borrowing which leads to increased interest payment. Net Profit Margin Net Profit margin is the ration of Pat and the Net Sales. PAT implies the Profit before Tax which the net profit generated after paying all the operating, financial and other charges. It is computed using the formula = The Net profit margin or PATM of the company and also the Industry in the year 2008-09 was at 25.69% and 17.4% respectively. Cash Profit Margin Net profit is the residual of Income after deducting all type of expenses. But A net profit generated need not imply excess cash of that amount is added in the business. The cash profit and Net profit would differ because there are few non-cash expenses like Depreciation which shall not be considered in case of computing Cash profits. Thus it is necessary to also study the Cash profit Margin. It is the ratio of Cash Profits to the Net Sales. For the year 2008-09 he cash profit Margin of the company along with the Industry average was 42.42% and 24.98% respectively. The trend of both the above mentioned margins over the years is 50
  • 52. Analysis of Fixed and Floating Interest Rates 2010 2008-09 2007-08 2006-07 2005-06 2004-05 CPM (%) 42.42 52.3 57.48 55.74 56.81 PATM (%) 25.69 31.39 34.25 32.08 31.26 CPM (%)- Industry 24.98 19.98 19.47 26.96 28.3 PATM (%)- Industry 17.4 13.44 12.31 18.04 18.39 Table 7 Net Profit Margins Profit Margin 70 60 50 CPM (%) 40 PATM (%) 30 CPM (%)- Industry 20 PATM (%)- Industry 10 0 2008-09 2007-08 2006-07 2005-06 2004-05 Figure 27 Net Profit Margins In both the cases i.e... Cash profit Margin or The Net Profit Margin, the company figures are better than the overall industry average. Also the cash profits are more than the Net profits; this shows that a large amount of non- cash expenditure in way of depreciation and amortization is charged to the profits. Return on Capital Employed Return on Capital Employed (ROCE) is used in finance as a measure of the returns that a company is realising from its capital employed. It is commonly used as a measure for comparing the performance between businesses and for assessing whether a business generates enough returns to pay for its cost of capital. It is computed using = − The ROCE for the company in the year 2008-09 was 12% as compared to 9.35% of Industry average. Return on Net Worth Return on Net Worth (RONW) or popularly known as Return on Equity (ROE) measures the rate of return on the ownership interest (shareholders' equity) of the common stock owners. It measures a firm's efficiency at generating profits from every unit of shareholders. ROE shows how well a company uses investment funds to generate earnings growth. It is computed using the formula = + 51
  • 53. Analysis of Fixed and Floating Interest Rates 2010 The RONW for the company and the Industry average in the year 2008-09 were 11.82% and 9% respectively. Over the years, the RONW and ROCE trend can be seen from the following table. 2008-09 2007-08 2006-07 2005-06 2004-05 ROCE (%) 12 9.27 9.5 8.95 8.01 RONW (%) 11.82 11.74 11.77 10.65 8.99 ROCE (%)-Industry 9.35 9.09 9.38 8.8 9.44 RONW (%)-Industry 9.97 9.61 10.24 9.38 10.01 Table 8 Returns EPS EPS stands for Earnings per share. Similar to RONW which computes the percentage of earnings as compared to the total net worth; EPS is a measure to determine the profits per share. It is ratio of Net profits or Earnings Available to equity share holders and the No. of equity shares. In case of Power Grid Corporation of India Limited there are no preference shares, so the total earnings would be the earnings available to equity shareholders. And also in the year 2007, a 1 shares was split into 100 shares, thus the EPS needs to be adjusted for that period. EPS 4.5 4 3.5 3 2.5 2 1.5 1 0.5 0 2008-09 2007-08 2006-07 2005-06 2004-05 EPS 3.81 3.24 3.09 2.6962 2.4018 Figure 28 EPS Trend The EPS of Rs.3.81 on a face value of Rs.10 is a good indicator. Also the EPS has been on a rise over the years, depicting the profitability of the company. 52
  • 54. Analysis of Fixed and Floating Interest Rates 2010 Solvency Ratios Solvency ratios indicate the risk inherent in the company as a result of its debt. A good financial analyst will also use solvency ratios to assess the debt profile of a company from its financial statements, and analyze whether the company needs to undergo debt restructuring exercises such as mortgage refinancing, debt consolidation, etc. In simple words the solvency ratio implies the ratios that help investors assess a company’s ability to meet its long-term obligations. They also tell investors how the company has been financed (debt or equity) and whether that is changing over time. Two most used Ratios are Leverage Ratio (D/E) and Interest Coverage Ratio. Debt- Equity Ratio Debt-Equity Ratio is one of the most popular ratios used in financial analysis of the company. It shows how much the entity is trading on equity. It is the ratio of Borrowings and the owned capital. Though a standard of 2 or 1.5 is considered as optimum, but it also differs based on industry and business activity of the company. The Debt-Equity ratio of the company as on 31st March 2009 was 1.77. And based on unaudited figures the ratio was 2.11 as on 31st March 20104. Though it is high, but it can be commented upon without comparing the same with the industry standard. The Debt Equity of Power Generation Industry for the year 2008-09 is 0.75. But since the company is a Central Transmitter Unit and also a sole large unit in the power transmission segment thus is into rapid expansion and growth stage, the borrowings are very high. The Debt Equity Ratio or Leverage Ratio over the years follows the following trend Debt-Equity Ratio 1.95 1.75 1.55 1.35 1.15 0.95 0.75 2008-09 2007-08 2006-07 2005-06 2004-05 Debt-Equity Ratio 1.77 1.69 1.64 1.5 1.47 Figure 29 Debt Equity Ratio 4 Source: The Information Memorandum of XXXII Issue. 53
  • 55. Analysis of Fixed and Floating Interest Rates 2010 Intrest Coverage Ratio A ratio used to determine how easily a company can pay interest on outstanding debt. The interest coverage ratio is calculated by dividing a company's earnings before interest and taxes (EBIT) of one period by the company's interest expenses of the same period. The formula used is = The lower the ratio, the more the company is burdened by debt expense. When a company's interest coverage ratio is 1.5 or lower, its ability to meet interest expenses may be questionable. An interest coverage ratio below 1 indicates the company is not generating sufficient revenues to satisfy interest expenses. The Interest coverage ratio of the company is 1.88 times for the year 2008-09. And the trend for the same is as follows: Interest Cover Ratio 2.5 2.25 2 1.75 1.5 2008-09 2007-08 2006-07 2005-06 2004-05 Interest Cover Ratio 1.88 2.29 2.3 2.23 2.11 Figure 30 Interest Cover Ratio There has been steep fall in the coverage for the year 2008-09. This is mainly because of high borrowings from the year 2007. And this borrowing has lead to high interest obligation. Activity Ratios Activity Ratios, as defined by Investopedia5 are, ‘Accounting ratios that measure a firm's ability to convert different accounts within their balance sheets into cash or sales’. Asset turnover ratios indicate of how efficiently the firm utilizes its assets. They sometimes are referred to as efficiency ratios, asset utilization ratios, or asset management ratios. Three commonly used asset turnover ratios are receivables turnover and inventory turnover and Fixed assets Turnover ratio. 5 http://www.investopedia.com/terms/a/activityratio.asp 54
  • 56. Analysis of Fixed and Floating Interest Rates 2010 Receivables Turnover Ratio Receivables turnover is an indication of how quickly the firm collects its accounts receivables and is defined as follows: = The receivables turnover often is reported in terms of the number of days that credit sales remain in accounts receivable before they are collected. This number is known as the collection period. It is the accounts receivable balance divided by the average daily credit sales, calculated as follows: 365 = The Receivables Turnover ratio and the collection period for the company for the year 2007-08 are 5.32 times and 68.6 days respectively. This implies that on average debtors are converted into cash in approx 69 days. Inventory Turnover Ratio Another major asset turnover ratio is inventory turnover. It is the cost of goods sold in a time period divided by the average inventory level during that period: = The inventory turnover often is reported as the inventory period, which is the number of day’s worth of inventory on hand, calculated by dividing the inventory by the average daily cost of goods sold: 365 = The Inventory turnover ratio and the inventory holding period for this company for the year 2007-08 are 24.09 times and 15.15 days respectively. Fixed Asset Turnover Ratio This ratio depicts the ability of the entity to convert its fixed assets into cash (Sales). A financial ratio of net sales to fixed assets. The fixed-asset turnover ratio measures a company's ability to generate net sales from fixed-asset investments - specifically property, plant and equipment (PP&E) - net of depreciation. A higher fixed-asset turnover ratio shows that the company has been more effective in using the investment in fixed assets to generate revenues. It is computed using the formula = 55
  • 57. Analysis of Fixed and Floating Interest Rates 2010 The ratio for the year 2008-09 is 0.17 times. This is a very low figure, but since the firm is a capital intensive and has projects which are of longer gestation, so this figure can be justified. The trend in the above discussed ratios over the years is summarised in the following table Turnover Ratios 2008-09 2007-08 2006-07 2005-06 2004-05 Receivables 5.32 5.8 8.8 8.1 5.37 Collection Period 68.60902 62.93103 41.47727 45.06173 67.9702 Inventory 24.09 21.34 19.7 17.26 13.19 Inventory Holding Period 15.15152 17.10403 18.52792 21.14716 27.67248 Fixed Assets 0.17 0.14 0.13 0.13 0.12 Table 9 Turnover Ratios Capital Market Behaviour Since the shares of the company are listed on the stock exchanges and are also actively traded, it is per se necessary to also analyse the behaviour of share prices. Some of the important ratios that can be computed and analysed are P/E Multiple, Beta etc... P/E Multiple The P/E stands for Price to earnings Ratio. It signifies the relationship between the market price per share and earnings per share. It can be computed using formula / = The P/E of the firm as on 31st Dec 2009 was 21.80. This implies the investor is willing to pay Rs. 21.80 for 1 Re of current earning. In general, a high P/E suggests that investors are expecting higher earnings growth in the future compared to companies with a lower P/E. However, the P/E ratio doesn't tell us the whole story by itself. It's usually more useful to compare the P/E ratios of one company to other companies in the same industry, to the market in general or against the company's own historical P/E. It would not be useful for investors using the P/E ratio as a basis for their investment to compare the P/E of a technology company (high P/E) to a utility company (low P/E) as each industry has much different growth prospects. Over the years the P/E has been 56
  • 58. Analysis of Fixed and Floating Interest Rates 2010 P/E 24.000 23.000 22.000 21.000 Sep-2008 Dec-2008 Mar-2009 Jun-2009 Sep-2009 Dec-2009 Sep-2008 Dec-2008 Mar-2009 Jun-2009 Sep-2009 Dec-2009 P/E 23.124 22.654 22.861 23.611 23.085 21.807 Figure 31 P/E Ratio Beta Beta is a measure of the volatility, or systematic risk, of a security or a portfolio in comparison to the market as a whole. Beta is used in the capital asset pricing model (CAPM), a model that calculates the expected return of an asset based on its beta and expected market returns... It is also known as beta coefficient. Beta is calculated using regression analysis, and you can think of beta as the tendency of a security's returns to respond to swings in the market. A beta of 1 indicates that the security's price will move with the market. A beta of less than 1 means that the security will be less volatile than the market and beta of greater than 1 indicates that the security's price will be more volatile than the market. The result of regression for Sensex Returns and Power Grid Corporation of India Limited’s shares returns from 8th October 2007 to 31st April 20106 is as follows: SUMMARY OUTPUT Regression Statistics Multiple R 0.664819 R Square 0.441985 Adjusted R 0.441074 Square Standard Error 0.022539 Observations 615 Coefficients Standard t Stat P-value Lower 95% Upper Error 95% Intercept 0.000388 0.000909 0.42683 0.669653 -0.0014 0.002173 Return-Market 0.839983 0.038121 22.03489 1.08E-79 0.76512 0.914845 Table 10 Regression Output 6 The data has been uploaded on online appendix. Please refer the Appendix page 57
  • 59. Analysis of Fixed and Floating Interest Rates 2010 And the residual plot for the same is y = 0.84x + 0.0004 Residual Plot R² = 0.442 0.25 0.2 0.15 0.1 0.05 0 -0.15 -0.1 -0.05 0 0.05 0.1 0.15 0.2 -0.05 -0.1 -0.15 -0.2 Figure 32 Residual Plot for Beta From the above results we can see that The Company’s shares are Low beta at 0.84. This implies for every 1 percent change in the market returns (here Sensex), the returns on shares of the company will change by 0.84 percent in the same direction. Also the R-Square, which is 0.442, implies the 44% variations in the share price are explained by the known factors that are due to market variations. In simple words 44% of the variations are explained. 58
  • 60. Analysis of Fixed and Floating Interest Rates 2010 Chapter III Procedure of Bond Raising  Steps in Issuing Bonds  Dematerialisation  Listing Process  Debt Servicing 59
  • 61. Analysis of Fixed and Floating Interest Rates 2010 Steps in Issuing Bonds To understand the procedural aspects and legal aspects in raising bonds and also to have practical exposure to actual raising process, a study of steps in issuing bonds is per se indispensible. The need for funds is determined based on Cash flow projections of the year. The amount to be financed by means of bonds is determined. The process of raising funds though bonds start with: Board Approval A board meeting at beginning of the year is held where authority to raise loan by means of Bonds is provided to the concerned person. The MoU between Ministry of power and PGCIL is also considered. The Committee of Directors for Bonds is appointed and the authority with respect of issuing of Bonds and all matters related to it are provided to the same by BoD. This is meeting is held at the beginning of the financial year or at later date if needed. Shortlist of Arrangers The process of issue starts by selection of arrangers. The arrangers are similar to Merchant bankers in the case of Bonds issue; they facilitate the process by bringing Investors for the issue. In Case of PGCIL, the arrangers are selected based on Past records and their past participation. The arrangers are selected based on their Rankings in PRIME Database. The rankings are allotted to the arrangers based on their history of performance. The criteria for ranking is based on  Amount Arranged in between a period  % of Total issue being arranged by that particular Arranger  No. of issues being participated by the arranger. This data can be generated from the website http://www.primedatabase.com/ by creating League Table of arrangers. It provides Ranks to the arrangers based on the period selected by the user. From the results top 10 or top 5 or the number as required are shortlisted. Meeting of Committee of Directors for Bonds for Engagement of Arrangers The meeting with Committee of Directors of Bonds (will be referred as Committee henceforth) is held with the purpose to appoint the arrangers... The following points are covered in the Minutes of Meeting prepared for the purpose of meeting:  Authority to raise loan of Amount Rs........, as approved by Board of Directors in the General meeting in one or many trenches.  Approval that Committee may engage Merchant bankers of Power Grid IPO as Arrangers for this issue too  Estimation of cash requirement and amount of Loan to be raised based on Cash Flows (Actual and Projections) 60
  • 62. Analysis of Fixed and Floating Interest Rates 2010  Appointing the shortlisted arrangers and also addition of other arrangers or rejection of exiting from the list. Thus shortlisted arrangers are invited and were also asked to quote for Arrangers fees  The Received quotes in sealed Envelope which is kept highly confidential and shall be opened by a committee which has:  One representation from Corporate Finance  One representation from Company Secretariat  One representation from Corporate Planning  In case of any variation in fees, the arrangers are asked to match their fees with the fee quoted by L-1 bidder. (Here L-1 implies the arranger biding lowest rate)  The arrangers fee (which is common for all arrangers) shall be charged on Amount allotted by the issue and can be shared among the Arrangers.  The PGCIL proposes to appoint a minimum no. of Arrangers for each issue based on the requirement.  The decisions on Appointment of arrangers, their fees etc shall be authorised by the Committee Thus the above points are discussed by the committee. This Minute of Meeting is signed by Committee of Directors for Bonds. Invitation for Quote to selected Arrange rs After the approval by the committee on the selection of arrangers, an invitation letter is sent to the arrangers. Some of the important contents of the letter are  The details on Issue Size, type of issue, type of debentures and proposed time of issue. In this case it was Issue of Non Convertible, Redeemable, Taxable, and Secured Bonds of PGCIL.... issue, the issue size being Rs..... Crores with a green shoe option. And the type of issue being private placement and the proposed time.......  The arrangers shall be registered with SEBI  Intimation of appointing them as arrangers for the issue and also requesting them to quote for the Arrangers fees as percentage (%).  The address of Issuer to whom the quote letter/ acceptance letter shall be mailed or sent by courier in a closed envelope is also mentioned  The deadline by which the letters shall be reached is also mentioned.  The time of opening the letters was also mentioned.  The invitation letter shall in no way construed as indication for appointment. This letter is mailed to the shortlisted arrangers. Letter of Acceptance with Quotes by the Arrangers The arrangers after receiving the Letter of appointments reply back their acceptance and also their quote for Arrangers fees on their Letter head. The received letters are then reviewed and based on the quote for the arranger’s fees, the arrangers quoting lowest fees are selected, keeping the 61
  • 63. Analysis of Fixed and Floating Interest Rates 2010 number of arrangers up to the minimum number as permitted by the committee. In case if similar bids are not received, the arrangers are asked to come in consensus with the L-1 bidder. The reply letters along with the envelope is documented. Recommendation of Bid Opening Committee After the quotes are received, the envelopes are opened by the committee formed for this purpose having 3 persons, one from Corporate Planning, Company Secretariat and Corporate Finance each. The committee, based on the quotes for arranger’s fee as quoted by the arrangers, will recommend the final arranger fee and also the selected arrangers. These Recommendations are to be signed by the members of the Committee formed for opening the Envelopes and also by The Committee of Directors of Bonds. Letter of Appointment to the Arrangers Based on the recommendations of the Bid Opening committee and henceforth approved by the Committee, the letters of appointment is sent to each of the selected arranger. The letter usually has following points:  Intimation of appointing them as the arranger  Also the names of co-arrangers  The Arrangers Fee approved by the Committee  Also a request to meet for the discussion on Issue Structure, Programme and Timing of the issue  A request to reply back the acceptance by sending back the duplicate copy of the letter with duly acceptance. Meeting with Arrangers A meeting with the Arrangers is held at Power Grid Corporate office, Gurgaon to discuss the issue structure, plan of issue, the discussion on timing, the Intrest rate, Cap and Floor rate, etc... . In this meeting based on the Current G-Sec yield, Corporate Bonds yield and spread, Liquidity conditions in market, RBI policies, Issues of other corporate and PSUs, etc... The arrangers suggest the interest rate band depending upon the interest band as fixed by other PSUs whose issues are live in the market. Usually the Cap rate is fixed and the floor rate is kept open to take advantage of market condition. Letter to Trustee A letter is sent to the Trustee who can act as Trustee for the Bondholders of the present issue. The letter has the details of the issue like security details, issue size etc... Also a request is made for consent for acting as Trustee. A draft consent letter, which the Trustee shall reply back for communicating the consent of approval, is attached with the letter. The Trustee is acting as IDBI 62
  • 64. Analysis of Fixed and Floating Interest Rates 2010 Trusteeship since XII issue of Bonds7. Though the same Trustee is appointed for every issue, but a separate letter is to be sent for each issue. Letter to Banker A letter is sent to the proposed Banker who can act as Banker to the Issue. The letter has the details of the issue like security details, issue size etc... Also a request is made for consent for acting as Banker to the Issue. A draft consent letter, which the Banker shall reply back for communicating the consent of approval, is attached with the letter. The Indian Overseas Bank acts as the banker to issue. Letter to Registrar and Transfer Agent (RTA) A letter is sent to the Registrar who can act as Registrar for an issue. The letter has the details of the issue like security details, issue size etc... Also a request is made for consent for acting as RTA. A draft consent letter, which the Registrar shall reply back for communicating the consent of approval, is attached with the letter. The RTA for Power Grid Corporation of India Limited Bonds is MCS Ltd. Letter to Credit Rating Agencies As per SEBI’s guidelines with respect to issue of debentures and also with respect to Disclosures, an issuer must get credit rating from at least two credit rating agencies and shall also communicate the rating in the Information memorandum. Thus a letter to Credit rating agencies is sent for Revalidating the Credit rating which was assigned by the respective Credit rating Agency before. The letter has the issue details, the details of the security, issue size, etc... The details of rating provided at beginning of the year along with the loan amount are also shared (backed by the reference to the letter no. and letter date). A request is made for the issue of fresh letter of credit rating. The Power Grid Corporation of India Limited takes the rating from 3 agencies namely, ICRA, CARE and CRISIL. Letter from Trustee A consent to act as Trustee, specifying the issue details is sent to BoD by the trustee. The content is same as provided by issuer as draft letter. Trustee also authorises the issuer to forward the letter to NSE or any stock exchange where bonds will be listed Letters from Credit Rating Agencies Revalidation letters from credit rating agency are received. The letter has reference to previous letter from issuer. It also confirms the rating of the security to be issued. It has following conditions:  Rating specific to terms and conditions of the specific issue.  Any change shall be brought into notice of the rating agency.  Right to suspend, withdraw, or revise the rating at any time on the basis of new information or unavailability of any information.  Rating should not be treated as recommendation to buy. 7 Prior to this, Indian Overseas Bank acted as the Trustee 63
  • 65. Analysis of Fixed and Floating Interest Rates 2010  Any information on delay/default in payment of interest shall be timely communicated. The letter also has a condition that if the instrument rated is not issued within 10 months in case of ICRA or 6 months in case of CARE and CRISIL, then the rating would stand withdrawn. Letter from Banker A consent to act as the Banker to issue, specifying the issue details is sent to BoD by the banker. The content is same as provided by issuer as draft letter. Trustee also authorises the issuer to forward the letter to NSE or any stock exchange where bonds will be listed. Letter to Banker After receiving the consent of acting as banker to issue, a letter is sent to banker is sent by the issuer. The letter has details such as issue size, reference to the consent letter, and details of payment specifications. The letter also mentions the proposed collection centres and a request is made to inform the respective branch heads of the collection centre to make necessary arrangements. A request for intimating the branch head to collect the cheques in high value clearing zone is also made in the letter. Declaration by Board of Directors A declaration by the Directors undertaking that No statement made in Disclosure Document is contrary to the provisions of Companies Act, 1956 or SEBI Act, 1992 or rules made there under or guidelines/ Notification issued. This declaration is signed by the Board of Directors. The Board consist of  Chairman and Managing Director  Director (Finance)  Director (Operations)  Director (Projects) Request letter to NSE for in Principle Approval After preparing the Draft Disclosure document, a request letter to National Stock Exchange for In Principle Approval of getting the Bonds listed in WDM (Wholesale Debt market) of NSE. The letter has following details  The proposed date of issue  The Issue Size, type of issue,  Enclosures: Draft Disclosure Document and also a digital copy of the document in PDF format for the purpose of uploading the same on website  Intimation of sending the final copy of Disclosure Document in due course time  Undertaking that Disclosure Document being prepared in compliance with Notification dated 6th December 2008 issued by Securities Exchange Board of India (Issue and Listing of Debt Securities) regulations 2008. 64
  • 66. Analysis of Fixed and Floating Interest Rates 2010  Undertaking that company will execute the new listing agreement with NSE after the allotment is done  And finally a request for an In-Principle approval. In-Principle Approval from NSE The National Stock Exchange issues the In-principle Approval to PGCIL for the issue. The In-principle approval is approval that the bonds may be listed on the exchange but it is a conditional approval and not a commitment. Only on fulfilment of all compliances and conditions the bonds will be listed. The letter has  Intimation of Grant of In principle Approval with specifying Nature of Bonds, Face Value and Issue Size  Also the conditions for Listing and provisions of Securities Exchange Board of India (Issue and Listing of Debt Securities) regulations 2008. Draft- Disclosure Document Covering Letter to Disclosure Document to Arrangers A covering letter to Draft Disclosure Document is sent to the arrangers. Also Application forms and Letter of commitment (Draft) is sent to the Investors. According to Sec 67 of Companies Act, not more than 49 can participate in case of Private Placement. Thus only 49 application forms are printed and 4 applications are sent to each arrangers and the rest are kept by Power Grid. These are issued to the arrangers in case of further requirement. Letters of Commitment It is a Letter given by Investors to the Power Grid on their letter head. The draft of the same is provided by the Power grid. This letter has an undertaking that a specific number of bonds shall be applied by the Investor at a particular rate when the issue is made and bonds are allotted. It is an irrevocable commitment. In the letter a commitment to invest number of bonds, minimum of 10 bonds and a multiple of 5 thereafter, @ Coupon Rate (it can be any rate between the spread i.e... Floor and Cap rate) @ rate higher than the coupon rate OR @ Cut-Off rate The letter also has an undertaking by Investors to pay for the bonds allotted in form of Cheque/ Demand draft (High Value Clearing) or RTGS The Investors shall send their bids to the Power Grid by means of Fax or in person in between the Issue open and Issue Closing time. The offer cannot be revoked unless superseded by a subsequent letter from the investor before the closing of the issue. 65
  • 67. Analysis of Fixed and Floating Interest Rates 2010 Book Building For the purpose of determining a Cut-Off interest rate at which the bonds shall be issued, a Book Building procedure is carried out. A work sheet with details of all the bids of investors is prepared. The Worksheet has the following information:  Date of Bid  Name of the Investor  Form No.  Name of the Arranger  Amount that will be invested at different rates  Cut Off Rate  Cap Rate  Floor Rate  Different rates within the spread  Total Amount of Investment While Recording the Bids, the same bid amount shall be recorded under all the interest rates at and above the quoted rate by the investor. The rationale behind this is since he is ready to invest an amount at a quoted rate; he will be ready to invest the same amount at a higher rate. For Instance, if a firm X quoted for 30 Bonds i.e... Rs 45 Crs @ 8.7%, the amount Rs 45 Crs will be recorded under the interest rates 8.7%, 8.78% and also 8.8% Also if an investor quoted an amount under Cut-Off rate, the amount shall be recorded under all the interest rates since he is indifferent to invest at any rate. For Instance a firm Y quoted 20 Bonds i.e... Rs 30 Crs at Cut-Off rate, then the amount Rs 30 Crs shall be recorded under all the interest rates i.e... 8.6%, 8.65%, 8.7%, 8.78% and 8.8%. In case of a revised bid, the previous bid is stroked off and the new offer is recorded. The rate under which the maximum amount is being invested is apportioned as Cut-off rate. This is the rate at which the bonds will be issued. In case if the issue is over-subscribed i.e... Exceed the limits then the allotment is bone in the following order:  Full allotment to the Investor quoted lowest coupon rate  The investors quoting at the Cut-Off rate  For investors investing at a same coupon rate, earlier bid will be allotted first  In case of a tie with respect to coupon rate and also the date of bid, the allotment is done pro-rata basis. Agenda for Meeting of Committee of Directors for Bonds After determining the cut-off rate and list of investors, the Committee of Directors for Bonds meets. Following points are to be discussed in the meeting.  Details of the arranger’s fee 66
  • 68. Analysis of Fixed and Floating Interest Rates 2010  Names of the Arrangers  Summary of the Investors and their Investments  Summary of proposed Allotment  Also decision on form of allotment. Here it is done in D-Mat (electronic Mode) Letters to Arrangers After the allotment is approved by the Committee, a letter to all the arrangers is sent. It has  Information on Applications  Allotment Details  Requesting them to intimate their investors for filling and submitting application along with the application money.  Also the payment details like payment shall be made by Cheque/demand drafts or RTGS by the.......... (Deadline date)  The cheques/ DDs shall be of High value clearing  Also the Account details and IFSC Code of Banker to Issue is communicated for the purpose of RTGS payment. The account details are “Power Grid Corporation of India Ltd. C.A. No. 1408 Bonds XXX-Issue”8 and IFSC Code of Banker to Issue, here, Indian Overseas Bank, and Parliament Road, New Delhi is IOBA0000762  Also the Annexure of list of investors along with the allotment details is communicated  The report of facsimile sent to the Arrangers is also documented. Letters to Investors An intimation letter to each investor to whom the allotment is done is sent. Also request is made to send their application forms along with the Application money. It has details on Allotment, the Cut- Off rate of Interest, Payment details, the last date for payment etc... In case if an Investor makes payment by means of RTGS, only the application letter can be sent to Power Grids Office through the arrangers. This letter is Carbon Copied to the respective arrangers of the Investors. Details from Banker to Issue After the pay-in date i.e... Last date for payment of application, the banker to issue communicates the receipts of funds with specific to the issue. It provides details of Funds received Towards the Issue Account along with the date of receipt. Final Allotment Meeting The agenda for this meeting is:  Details of the allotment  Details on Mutual funds participated  Any material issue  List of the Investors with the allotment details 8 The name of account for each bond series differs 67
  • 69. Analysis of Fixed and Floating Interest Rates 2010 Dematerialization Process As per SEBI Guidelines all the securities in form of equity or debt shall be issued only in De-Mat (read dematerialised) form. Thus it is per se indispensable to understand the process of dematerializing i.e...converting the securities into electronic form. The process starts by: Tri-Partite Agreement between Depository, Issuer and RTA A Tri-Partite agreement between each depository and RTA and issuer is entered before an issue. Once signed agreement will; be valid for all the issues unless any change in Terms or change in the party or any new regulations is made. Two agreements each with NSDL and CDSL are made. The RTA (Registrar and Transfer Agent) is MCS services. Letter to NSDL and CDSL A letter is sent to the depository, here, National Securities Depository Limited (NSDL) and CDSL (Central Depository Services Limited) with a request to allot ISIN (International Securities Identification Number), an unique identification number, for the securities to be issued. The Details of STRPPs are also communicated since each STRPP has different maturity period and thus will have different ISIN code. The Pay-In date and also the deemed date of allotment is mentioned. This communication is mailed before the closing of books. The MCF (Master file Creation Form) for the purpose of allotment of ISIN code is also attached. Intimation that the Corporate Action file shall be sent separately is also made. A true copy of extract of resolution approved by the Committee of Directors for Bonds is also attached. The ISIN code is a 12 digit Alpha-Numeric code. The first three characters are alphabets which represent the Nation of Origin (for Indian securities it is INE), the next five characters are issuer specific (like 752E0 for Power Grid and 002A0 for Reliance Industries) and the last four are specific to characteristics of security like Equity, Secured Debentures, and Maturity etc... The MCF file has details like Name of the Entity (issuer), contact details, security details, debenture trustee details, type of placement, issue size, stock exchange details, registrar details etc… Some of the attachments along with the letters are:  Articles of Association of the firm  Memorandum of Association  Certificate of Incorporation and Certificate of Commencement  Audited Accounts of last three years  Trust deed  Offer Document (Disclosure Document)  In-Principal approval for Listing from NSE  Copy of board resolution 68
  • 70. Analysis of Fixed and Floating Interest Rates 2010 Corporate Action A request is made to execute the corporate action to the credit the following securities to the accounts in NSDL. The details provided are ISIN of securities, Allotment date, Security description, face value per security, and Distinctive number. Since no security is being issued in physical form there will not be any distinctive number... Also allotment details like number of securities and number of records with NSDL, CDSL and Physical form are also shared. Undertaking that all the necessary approvals have been obtained is also mentioned. The resolution by the Committee and ISIN wise details of securities is enclosed along with the letter. Letters from NSDL and CDSL Reply letters from both the depositories are received. It communicates that as per the Corporate Action executed, the details of Bonds credited/debited on the systems. The details like ISIN, ISIN Description, Records, Quantity, and Execution date are communicated to the issuer. The records are number of distinct entities holding the security. Details of Demat Allotment The allotment details of the issue are prepared by the issuer for the purpose of records. Details like:  ISIN  Name of the Investor  Details of Security (STRPP wise)  Date of allotment  Date of Maturity  DP name  DP Id  Client Id  No. of STRPPs of that particular STRPP (A-L)  Total amount for that particular STRPP (i.e...Rs. 12.5 lacs X No. of STRPPs)  House/ Non House (House implies Investor and the DP are same) 69
  • 71. Analysis of Fixed and Floating Interest Rates 2010 Listing Process All the bonds issued by the company are listed with NSE under WDM segment. Since the bonds can be listed only after they are issued and allotted to the investors, they are issued as proposed to be listed to the investors. The short summary of listing process is as follows:  Approval for Listing Agreement with NSE from Board  Listing Agreement with PGCIL and NSE  Letter to NSE (Undertaking)  Letter to NSE (Fees details)  Letter from NSE (Intimation of Listing)  Letter to NSE (Covering letter for Trust Deed) The process of Listing starts with the In-Principle Approval from NSE taken before issuing the bonds. The In-principle approval signifies that the bonds shall be listed after they are allotted on an condition that, all the procedurals, policies and guidelines are followed. After the shares are allotted, approval is taken from the Board for the [purpose of creating a listing agreement with NSE. The Listing Agreement is signed on a stamp paper. It has all the clauses, undertakings and policies with respect to the listing guidelines as mentioned by SEBI. This agreement is to be signed by The Board and also by the company secretary. After the listing agreement is signed, this agreement along with the application form, the company contact details, the details of Bond structure and also the STRPP details are to be attached. A checklist is provided by the NSE, to ensure that all the formalities have been furnished and also all the required documents are attached with the application form. Along with the Listing agreement and the application form, a separate letter is sent to NSE stating that:  Undertaking that all the guidelines as issued by SEBI (Issues and Listing of Debt Securities), Regulations, 2008, provisions of Companies Act, 1956 have been followed.  Undertaking that Trust deed has not yet been executed and shall submit the true copy as soon as it is done.  Also an undertaking that the Offer document has been prepared as per SEBI ( Issues and Listing of Debt Securities), Regulations, 2008 Apart from the above documents, a separate letter is sent to NSE regarding the Fee details. The letter has the details of the previous listings of PGCIL Bonds, details of present listing along with the maturity value, date of allotment etc... And since the fees is paid at the maximum cap of Rs. 7.5 Lakh in advance, no further fees is needed to be paid for the present listing. Also a request is made to list the present issue of bonds at WDM segment. 70
  • 72. Analysis of Fixed and Floating Interest Rates 2010 After, all the documents are submitted to NSE and all the formalities are fulfilled; an Intimation letter from NSE is received stating that, the securities as specified in the agreement are duly listed on WDM segment with effect from a date as mentioned. After this the bonds are listed on the WDM segment of NSE and the investors are allowed to trade. And NSE provides the monthly statistics of for daily price and the volume. But after the trust deed is executed, a covering letter along with the Trust deed is sent to the NSE. 71
  • 73. Analysis of Fixed and Floating Interest Rates 2010 Debt Servicing The bonds are issued with a specific payment structure pre defined at the time of issue and mentioned in the offer document/ information memorandum. For instance a bond may be issued with the structure as Intrest paid half yearly with 3 years moratorium and 10 equal instalments. In this case the Bond is divided into 10 STRPPs (Separately Transferable Redeemable Principal parts) redeemable each year after 3 years of the issue. And the interest is paid on every 6 months on the amount outstanding. Also the interest payment and redemption date are also pre determined. Usually both the dates are kept as the date on which the bonds are issued. The issue date of the bond series becomes its Intrest and principal payment date. By and large, the company issues its bonds with following structure:  3 year moratorium period + 10 equal instalments  1 year moratorium + 5 equal instalment  4 year moratorium + 12 equal instalments  5 years moratorium + 10 equal instalment As on 31st of March, 2010, the total number of Bonds outstanding was 26, from series No.VI to XXXI, (excluding the series no. VII), which is redeemed. Thus the company has regular interest payments and principal payments scheduled over the year depending upon the issue date. (The details of each bond along with the coupon rate, payment structure and payment date has been made available in online appendix) Before understanding the process, some of the terms need to be mentioned Record Date The bonds of the company are listed on NSE- WDM (Wholesale Debt market) Segment and are traded. Thus the holding changes after every trade. For the purpose of payment of interest and redemption of STRPPs, the book of transfers is closed a month before the scheduled interest payment date. And the BO position as on the record date is considered and the interest is paid to the holder on or before the Record date. BO Position The Beneficiary Owner position is the list of beneficial owners to whom the interest is to be paid. It may or may not be the list of actual owner. For instance a person holding the security on record date will be included in the BO position statement though he sells it after the record date. This position is provided by the registrar to the company on record date of each issue. 72
  • 74. Analysis of Fixed and Floating Interest Rates 2010 Registrar Registrar and Transfer agent is the party who records all the transfers took place. He is expected to maintain a register of holders of each Bond along with the STRPP details and should update the register after every transfer taking place. He is also required to provide the BO Position statement whenever company asks for it. Demat and Physical Holding SEBI has necessitated that, all the issues of fresh equity and debentures must be in Demat Form. The Demat (Dematerialised) implies in digital form instead of physical form. In this case the bonds are traded electronically through the route of depositories. But the initial issues of bonds till XII issue, the bonds were issued in Physical form i.e... In form of Physical Bond certificates. In this case the transfers take place at individual level and the information is provided to the Registrar by either of the investor. Depository Depository as the name signifies, it acts as the depository of the physical certificates of the dematerialised securities. It is reservoir of the physical securities and issues dematerialised securities replacing the physical form. And also it acts as the central body for transferring the securities into different accounts based on the trading takes place. In India the two central depositories are National Securities Depository Limited (NSDL) and Central Depository Services (India) Limited (CDSL). Depository Participant (DP) Depository Participant is similar to a commercial bank, if the Depository is regarded as Central bank. It acts as the middleman between the investor and the central depository. It facilitates the trades of his clients and holds his securities in Demat form on his behalf and maintains an account. The DPs can be commercial banks, private brokers, Broker institutes etc... Some of the DPs in India are ICICI Bank, Religare Securities, Motilal Oswal Securities Ltd., and Anand Rathi etc... DP ID The DP ID is the unique identification of each Depository participant. As similar to Bank code required for a banking transaction, DP ID is requisite for any transaction in securities in Demat form. Client ID As mentioned before, each DP has clients. These clients are normal investors including individuals, corporations and associations etc... The client ID is unique account number for the Demat account of each client. This number is required for transferring securities in the clients account. IFSC Code The IFSC code stands for Indian Financial System Code. It is a unique code for each financial institution in India. It is an 11 digit code, of which the first 4 represents bank code; the fifth character is at present ‘0’ for all, which may be changed for further codes. The next 6 characters represent the 73
  • 75. Analysis of Fixed and Floating Interest Rates 2010 Branch code. This unique code is used for reference of each branch of a bank. It is used for purpose of Fund transfers in case of RTGS payment. RTGS and NEFT RTGS stands for Real Time Gross Settlement. The funds between banks can be transferred by way of NEFT (National Electronic Fund Transfer) or RTGS. In case of NEFT, there is limitation in way of transfer of funds. NEFT settlement takes place 6 times a day during the week days (9.30 am, 10.30 am, 12.00 noon. 1.00 pm, 3.00 pm and 4.00 pm) and 3 times during Saturdays (9.30 am, 10.30 am and 12.00 noon). Any transaction initiated after a designated settlement time would have to wait till the next designated settlement time. RTGS system is a funds transfer mechanism where transfer of money takes place from one bank to another on a "real time" and on "gross" basis. This is the fastest possible money transfer system through the banking channel. Settlement in "real time" means payment transaction is not subjected to any waiting period. The transactions are settled as soon as they are processed. "Gross settlement" means the transaction is settled on one to one basis without bunching with any other transaction. Considering that money transfer takes place in the books of the Reserve Bank of India, the payment is taken as final and irrevocable. But in case of RTGS, the funds are transferred on Gross basis, i.e... Funds are transferred as soon as the fund is received. But RTGS can be used only in case if amount exceeds Rs. 1 lakh. PAN PAN stands for Permanent Account Number. It is unique code allotted by Central Board of Direct Taxes (CBDT) for each tax payer. According to CBDT, the PAN number should be disclosed for all the transactions exceeding Rs. 50,000. PAN is a 10 digit code of which the first five are Alpha, the next four are Numerical and the last is an alphabet. And of these, the fourth character represents the type of assessee. According to Income Tax Act 1961 Assessee is a' as a person by whom any tax or any other sum of money is payable under this Act, and includes - Company (C), Association of person (A), Person (P), HUF (H), Trust (T), Government (G). And the fifth character can be the last name of the surname in case of person or the first name of the entity in case of company or association or rest. UTR No. UTR stands for Unique Transaction Reference number. It is generated in case of a RTGS Transaction. It is a 16 digit unique code used for future reference of any NEFT/ RTGS Transaction. After understanding the above discussed terms, the Debt Servicing process can be understood easily. The process of debt servicing starts with: Master RTGS File A Master RTGS file is maintained by the company which has details of all the investors of all the bonds. It includes the details of all the previous as well as current investors. And the data required 74
  • 76. Analysis of Fixed and Floating Interest Rates 2010 for payment of interest like IFSC code, Account No. etc are taken from this file. The file has details like: Index No. : Unique no. for each investor for easy reference Name of the Investor or Beneficiary Bank name IFSC code of the Bank Branch Branch Name Account Number of the Investor MICR code Contact person and his email and phone number PAN Number DP ID and Client ID BO position from RTA After the record date of each issue, the BO position of that issue is requested from RTA. For Instance for the issue XXV, whose interest payment is due on 12th June, the BO Position is asked from the RTA in month of May. The BO position for Demat is provided in a digital copy and for the physical holding (Remat) the statement is provided in a physical format. The details like DP Id, Client ID, name of the Investor and his holdings are provided in the BO Position. Checking the Availability of Details if the Beneficiary After receiving the names of beneficial owners to whom the interest is to be remitted, the required details for remitting the amount like IFSC code, Account Number, Bank and its Branch etc... are to be gathered. For this purpose, first the Master RTGS file is referred to collect the data. Call for Details In case if the details of the BO are not available in the Master RTGS file, then in that case, a letter or email is sent to the BOs asking for the details like Bank Name, Branch name, IFSC Code, Client ID, DP ID, Account Number, PAN, Contact person and his contact number and email, etc... The received details in reply from the BOs are indexed and the Master RTGS file is updated. In some cases even after the letter or email, the BO does not respond, thus calls are to be made to them to get the details. List of Beneficiaries is sent to Bank The list of beneficiaries to whom the interest and principal repayment is given to the banker with the details required for RTGS or payment through cheque. The amount to be paid is also mentioned and a cheque for the lump sum amount is given to the banker. The banker takes the responsibility of remitting the funds to individuals as per the list given to it. IDBI bank acts as the banker for remitting the funds. 75
  • 77. Analysis of Fixed and Floating Interest Rates 2010 The company directs the Bank to remit the funds mostly by RTGS because it is most economical method and also the safest and quickest mode of transfer. And also since most of the cases the payment exceeds rs.1 lakh making the RTGS possible. Sometimes even NEFT mode is also used. In case if the Beneficiaries Branch does not have RTGS facility or if he is unable to provide IFSC details and wishes to receive the amount by cheque, post dated cheques are sent to such investors. Payment Details from Banker After the payment is made, the Bank provides the payment details for each issue separately under RTGS and through cheque. It provides details like UTR No., Amount, Instrument status as in whether the schedule has been generated or not, and Beneficiary description, beneficiary’s Bank and branch, IFSC code etc... in case of RTGS payment.And in case if payment is made through cheques, the details like Beneficiary name, Instrument Number ( the cheque number), Instrument amount, Instrument date, Instrument status and liquidation date. The status may be paid or Unpaid depending upon the encashment of the cheque. The status remains unpaid till the cheque is presented for payment by the beneficiary’s bank or till the cheque is expired. Reconciliation After the details of payment are received, the Bonds department reconciles the total payment through RTGS route and by Cheques mode with the total amount of cheque given to the bank for the purpose. In case of deviation, the entries are reconciled with the BO list provided to the bank. In case of Single Investor The Power Grid Corporation of India Limited issues its bonds by route of Private Placement. Thus sometimes, the whole issue size is mobilised by single investor and usually it is Life Insurance Corporation of India Limited (LIC). In this case since the interest and principal of that specific issue is to be paid to the single party, the payment is made by the company itself and this job is not done through the IDBI bank. The payment is made to it by RTGS. For instance in case of XVIII, XX and XXIV issue, the sole investor is LIC, thus the payment is made to it directly. 76
  • 78. Analysis of Fixed and Floating Interest Rates 2010 Chapter IV Characteristics of Bonds  Yield  Duration  Convexity  Yield of PSU and GSec Bonds  Duration of PSU and GSec Bonds  Convexity of PSU and GSec Bonds 77
  • 79. Analysis of Fixed and Floating Interest Rates 2010 Yield or IRR The yield on any investment is the interest rate that will make the present value of the cash flows from the investment equal to the present value (i.e... the price an investor pays to buy the investment). Mathematically the yield cab be computed as 1 2 3 = + 2 + 3 + ……..+ 1 + (1 + ) (1 + ) (1 + ) Here P= Present value CF= Cash Flows (Intrest as well as principal for each year) y = IRR/ Yield to Maturity N = Tenure There are different measures for the yield commonly quoted by the dealers and used by the portfolio managers. Some of the Conventional measures are Current Yield As the name signifies it is the yield for the current period. It relates the annual cash flow to the current market price. But here only Intrest receipt is considered and the other gains which affects the yield like capital gain, discount price etc are ignored. The time value of money is also ignored. Thus = This measure is commonly used by short term investors and also more suitable for short tenure bonds. Yield to Maturity Yield to maturity is also the IRR of the future Cash Inflows as discussed before. Unlike the Current yield, here all the gains in form of Intrest as well as Capital redemption are considered. Also the Time value of money is considered. The formula for the same is = + 2 + 3 + ……..+ + 1 + (1 + ) (1 + ) (1 + ) (1 + ) Here P= Price the Investor paid to get the Investment C= Coupon Payment (half yearly or annual) M = Principal Payment (Maturity value) N= Number of Periods (Tenure X frequency) Annualised Yield In the above formula the payments may be annual or half yearly or even monthly. Thus the yield obtained using above formula needs to be annualised if the payments are not on annual basis. Thus the formula for the same is 78
  • 80. Analysis of Fixed and Floating Interest Rates 2010 = (1 + ) − 1 Here Y= Annualised Yield m= Frequency of payments (2 for half yearly and 12 for Monthly) Yield to Call / Put The bonds may be issued with the option of Call or Put. In case of option with Call, the issuer has the right to call back the bond and pre-pay the amount after a predetermined period. The issuer uses this option in case of availability of alternative sources of cheaper funds. The investor is under obligation to sell the bonds if the issuer exercises the option. Similarly the Bonds can be issued with the Put Option where the Investor is given right to sell the Bonds i.e... Put the bonds to the issuer at any time after a predetermined period. The investor uses this option in case if he has more profitable avenues to invest when compared to the bonds. Thus the Yield is computed for different options like Yield to First call (for the bonds which are not presently callable), Yield to next call (for the bonds which are currently callable), Yield to Refunding, etc.... Yield to Worst is the lowest yield rate of every possible call and put date. Price- Yield Relationship A Fundamental property of a bond is that the price changes in the opposite direction from the change in yield. The reason or the justification for the same could be, the present price is discounted future cash flow of the bond and the discount rate being used is the required yield. In case of increase in the yield i.e... The discount rate increases and leads to the fall in the present value of the future cash flows which leads o fall in the price and vice versa. 79
  • 81. Analysis of Fixed and Floating Interest Rates 2010 Duration A bond's maturity measures the time to receipt of the final principal repayment and, therefore, the length of time the bondholder is exposed to the risk that interest rates will increase and devalue the remaining cash flows. Although it is typically the case that, the longer a bond's maturity, the more sensitive its price is to changes in interest rates, this relationship does not always hold. Maturity is an inadequate measure of the sensitivity of a bond's price to changes in interest rates, because it ignores the effects of coupon payments and prepayment of principal. Duration is the measure for the sensitivity of the Bonds. As discussed before there is a negative relationship between yield and price. A change in yield would lead to a change in price. Thus the duration measures the impact of change in yield on change in price. Macaulay’s Duration Dr. Fedrick Macaulay has coined this term and used this measure rather than a maturity as a proxy for the average length of the time that a bond investment is outstanding. Macaulay recognized this distinction and determined that the time to receipt of each cash flow should be weighted, not by the relative magnitude of the cash flow, but by the present value of its relative magnitude. Macaulay's duration, therefore, equals the average time to receipt of a bond's cash flows, in which each cash flow's time to receipt is weighted by its present value as a percentage of the total present value of all the cash flows. The sum of the present values of all the cash flows, of course, equals the price of the bond. The formula for the same is 1 2 + + …….+ + (1 + ) 1 + (1 + )2 (1 + ) = Here C= Coupon Inflows y = IRR/ Yield M= Maturity Amount (Redemption Amount) n= Number of Periods P= Price Modified Duration The ratio of Macaulay’s Duration to (1+yield) is commonly termed as Modified Duration. The Modified duration is the approximate percentage change in price for a given change in yield. Although Macaulay conceived of duration as a measure of the effective life of a bond, it can be modified to measure the sensitivity of a bond's price to changes in the yield to maturity. The modification simply requires dividing Macaulay's duration by the quantity one plus the yield to maturity, ′ = (1 + ) 80
  • 82. Analysis of Fixed and Floating Interest Rates 2010 Convexity The duration is the measure of volatility. But it depicts a linear relationship between the Price and yield. But in reality it is not a case. The relationship between Yield and the price may not be linear and it could be collinear. Thus the Convexity is the second derivative measure of relationship between [rice and the yield. In finance, convexity is a measure of the sensitivity of the duration of a bond to changes in interest rates. There is an inverse relationship between convexity and sensitivity - in general, the higher the convexity, the less sensitive the bond price is to interest rate shifts, the lower the convexity, the more sensitive it is. As discussed before Duration is a linear measure or 1st derivative of how the price of a bond changes in response to interest rate changes. As interest rates change, the price is not likely to change linearly, but instead it would change over some curved function of interest rates. The more curved the price function of the bond is, the more inaccurate duration is as a measure of the interest rate sensitivity. Convexity is a measure of the curvature or 2nd derivative of how the price of a bond varies with interest rate, i.e. how the duration of a bond changes as the interest rate changes. Specifically, one assumes that the interest rate is constant across the life of the bond and that changes in interest rates occur evenly. Using these assumptions, duration can be formulated as the first derivative of the price function of the bond with respect to the interest rate in question. Then the convexity would be the second derivative of the price function with respect to the interest rate. The formula for computing the convexity is + 1 1 + +2 = /2 100 Here t= Time period No. CF= Cash Flow (Interest and Principal) r = Yield m= Frequency of Debt Servicing In actual markets the assumption of constant interest rates and even changes is not correct, and more complex models are needed to actually price bonds. However, these simplifying assumptions allow one to quickly and easily calculate factors which describe the sensitivity of the bond prices to interest rate changes. 81
  • 83. Analysis of Fixed and Floating Interest Rates 2010 Yield of PSU and GSec Bonds Bonds have become a very important source of long term funds for Government of India (Both Central and State Government) and also the corporations including private sector and also public sector. Different issuers have different structure of their bond with different repayment structure, differing interest rates and different terms. For Instance the GSec (acronym for the securities issued by Government of India through Reserve Bank of India) is repaid at the end of tenure where as bonds of Power Grid Corporation of India Limited are repaid in 12 equal instalments. Also the frequency of Intrest payment would differ and they may be quarterly, half yearly or even annual. Thus it is per se necessary to compute yields and other parameters of different bonds. Selection of Bonds For the purpose of study all the bonds which are issued by the Power Grid Corporation of India Limited till date and are yet to be redeemed are considered. Apart from this two bonds of the Power Finance Corporation which have similar issue and redemption date with that of two Power Grid Corporation of India Limited’s bonds and also two GSec bonds having similar Maturity to that of the two selected PFC Bonds are selected. The summary of the bonds selected is Bond Date of Issue Tenure Average Redemption Duration to Coupon Present Description Tenure Date Maturity ( Rate Value ( Rs. Yrs) Crores) PGXIII 31.07.2002 15 9 31-7-2017 7.333333333 8.63% 1.133466 PGXIV 17.07.2003 12 7 17-7-2015 5.297222222 6.10% 0.705981 PGXV 23.02.2004 15 9 23-2-2019 8.897222222 6.68% 1.139539 PGXVI 18.02.2005 13 8 18-2-2018 7.883333333 7.10% 1.122116 PGXVII 22.09.2005 13 8 22-9-2018 8.477777778 7.39% 1.27544 PGXVIII 09.03.2006 15 9 09-3-2021 10.94166667 8.15% 1.375 PGXIX 24.07.2006 15 9 24-7-2021 11.31666667 9.25% 1.4997551 PGXX 07.09.2006 15 9 07-9-2021 11.43611111 8.93% 1.5 PGXXI 11.10.2006 15 9 11-10-2021 11.53055556 8.73% 1.5046713 PGXXII 07.12.2006 15 9 07-12-2021 11.68611111 8.68% 1.494723 PGXXIII 09.02.2007 15 9 09-2-2022 11.85833333 9.25% 1.5 PGXXIV 26.03.2007 15 9 26-3-2022 11.98888889 9.95% 1.5 PGXXV 12.06.2007 15 9 12-6-2022 12.2 10.10% 1.4917073 PGXXVI 07.03.2008 15 9 07-3-2023 12.93611111 9.30% 1.5 PGXXVII 31.03.2008 15 9 31-3-2023 13 9.47% 1.5065713 PGXXVIII 15.12.2008 15 9 15-12-2023 13.70833333 9.33% 1.568498 PGXXIX 12.03.2009 15 9 12-3-2024 13.95 9.20% 1.535168 PGXXX 29.09.2009 15 9 29-9-2024 14.49722222 8.80% 1.517222 PGXXXI 25.02.2010 15 9 25-2-2025 14.90277778 8.90% 1.507589 PGXXXII 29.03.2010 15 9 29-3-2025 14.99722222 8.84% 1.5 82
  • 84. Analysis of Fixed and Floating Interest Rates 2010 PFC ( S-57) 07-08-2009 15 10 07-08-2024 14.35277778 8.60% 99.43469 PFC 8.85% 31-05-2006 15 10 31-05-2021 11.16666667 8.85% 100.089 2021(S-XXVIII) GOI LOAN 30-05-2001 15 15 30-05-2021 11.16666667 10.25% 115.259 10.25% 2021 GOI LOAN 15-09-2009 15 15 15-09-2024 14.45833333 8.20% 999 8.20% 2024 OIL BOND Table 11 List of Bonds selected for Study Bond Description: The PG implies bonds issued by Power Grid Corporation of India Limited and the subsequent roman number implies the series number of the bond. Each bond issue is numbered and given an identification nomenclature. For Power Grid Corporation of India Limited till date it has issued 32 bond series. Similarly for Power Finance two bonds of 28th series and 57th series are selected. And the last two entries are the bond issued by Central Government of India. Date of Issue: This date is relevant to compute the tenure, average tenure and also all the payments of interest and capital redemption are made with reference to the date of issue. Tenure: The tenure is the absolute number of years between the issue date and the redemption date. It is the period for which the bond will remain active and servicing of debt needs to be done. Average Tenure: Bonds may be issued with a moratorium period followed by Instalment payment. For example the Power Grid Corporation of India Limited issues bonds with the moratorium period of 4 years and followed by 12 equal annual instalments. Thus in this case, for the initial 3 years only interest will be paid and from the year 4 onwards along with the interest the 12 th part of loan amount will be repaid. Thus the average tenure will be 3 years + 12/2 years i.e... 9 years. And in case of Power Finance’s Bond Series 5710, the repayment is done in 3 equal 5 yearly instalments. Thus though the tenure is 15 years, the average tenure will be 10 years And in case of G-Sec the amount is repaid at end of tenure thus the tenure and average tenure will be same. Redemption Date: As the name clearly signifies it is the date on which the whole principal outstanding is to be redeemed. This date is useful in computing the Years to Maturity. Duration to Maturity: Duration to maturity implies number of years remained for the bond to mature. It is just a gap between Today’s date and the maturity date. This figure is relevant for the investor as he can know the period for which the bond is to be held. Also the volatility and sensitivity is the function of years remained for maturity. Coupon Rate: The coupon rate is the rate of Intrest the issuer pays on the face value of the outstanding bond. This coupon rate may be determine by the issuer or is determined by the Book Building process. It is one of the important parameter in determining the yield, duration and convexity. 9 The Present value is the Index value as published by NSE in its Monthly Trade history. In this case the face value has been taken as 100. 10 Source: The Information memorandum published for before the specific issue of PFC, 83
  • 85. Analysis of Fixed and Floating Interest Rates 2010 Present Value: The present value is last traded price of the bond. Though the bond market is not much developed in India, the trading of these bonds takes place in Wholesale Debt Market (WDM) of NSE. And the bonds issued by Power Grid Corporation of India Limited are in form of 12 STRPPs (Separately Tradable Redeemable Principal Parts) which have different maturity period since one STRPP is redeemable every year after the moratorium period. Also the trading takes place differently for each STRPP. And since the cost of each Bond is Rs. 1.5 Crores, the value of each STRPP will be Rs. 12.5 lakh. Similarly in case of Bonds of Power Finance, the Bond consists of 3 STRPPs redeemable every 5 years. The assumptions and process of computation of present values is as follows:  From the data available at NSE website11, the present value of each STRPP was taken  Average of all the outstanding STRPPs of each bond was computed. For Instance the bond PGXIV has 6 STRPPs outstanding, thus the average of the 6 is considered as the present value  In case if any STRPP is not traded, the present value is taken as 100. The NSE has the practice of publishing Indexed present value. Since Bonds have different face values ranging from Rs 10 lakh to Rs.2 Crores, the values is published with the base as 100. Thus the Present value of 99 implies the value is down by 1% from its actual face value and vice versa for the case of 101.  In case of Power Grid Corporation of India Limited Bonds the index value is multiplied with the face value of the partial bond i.e... (Sum of Face values of the outstanding STRPPs). For Instance for PGXVI series the face value of Bonds was Rs. 1.5 Crores with 10 STRPPs thus the face value of each STRPP is Rs 15 Lakh. As on 31st March 2010, the no. of STRPPs outstanding is 8. Thus the Index value was multiplied by Rs. 1.2 Crores i.e... 8X15 Lakh. Computation of Yield to Maturity For computing the Yield to Maturity all the future cash flows need to be forecasted. Since the coupon rate is predetermined and also the redemption schedule is predefined, the cash flows can be determined easily. In case of Floating rate, since there is uncertainty on the rate of interest, estimation of margin needs to be done. Following is the computation of Yield for the bond PGXXXI, which has 4 years Moratorium period with 12 equal instalments to be annually at a coupon rate of 8.90%. The table of future cash flows and the present value as on 31st March 2010 is used to compute IRR (Yield to maturity). Year Interest Principal Opening Total Balance Payments 2010 0 0 0 -1.50759 2011 0.1335 0 1.5 0.1335 2012 0.1335 0 1.5 0.1335 2013 0.1335 0 1.5 0.1335 2014 0.1335 0.125 1.5 0.2585 2015 0.122375 0.125 1.375 0.247375 2016 0.11125 0.125 1.25 0.23625 11 The Monthly Trading report of WDM Segment for March 2010 available on www.nse-india.com 84
  • 86. Analysis of Fixed and Floating Interest Rates 2010 2017 0.100125 0.125 1.125 0.225125 2018 0.089 0.125 1 0.214 2019 0.077875 0.125 0.875 0.202875 2020 0.06675 0.125 0.75 0.19175 2021 0.055625 0.125 0.625 0.180625 2022 0.0445 0.125 0.5 0.1695 2023 0.033375 0.125 0.375 0.158375 2024 0.02225 0.125 0.25 0.14725 2025 0.011125 0.125 0.125 0.136125 Table 12 Yield to Maturity of PG XXXI Using the IRR Function of the column ‘Total Payments’ Yield to Maturity is computed; in the year 2010 the negative value is the present value of the bond. The negative value implies it is outflow for the Investor and for the subsequent years the amounts are inflows. The Yield to Maturity of this Bond as on 31st March 2010 is 8.816%. The yield is less than the Coupon rate because the present value is more than the face value. This implies that the investor is paying more amount than the value of that bond. Similarly in case of GSec Bonds whose redemption is on maturity after 20 years with years to maturity being 12 years with the coupon rate of 10.25%. Year Intrest Principal Opening Total Payments( C) Balance 2010 0 0 0 -115.25 2010 10.25 0 100 10.25 2011 10.25 0 100 10.25 2012 10.25 0 100 10.25 2013 10.25 0 100 10.25 2014 10.25 0 100 10.25 2015 10.25 0 100 10.25 2016 10.25 0 100 10.25 2017 10.25 0 100 10.25 2018 10.25 0 100 10.25 2019 10.25 0 100 10.25 2020 10.25 0 100 10.25 2021 10.25 100 100 110.25 Table 13 Computation of Yield of GSec Bond The Yield to Maturity of this Bond as on 31st March 2010 is 8.205%. 85
  • 87. Analysis of Fixed and Floating Interest Rates 2010 Computation of Current Yield The Current Yield as defined before is the yield to the investor for one year. If holds the bonds or any investment for the period of 1 year. It is just a ratio of Coupon rate and the face value. Thus say for Bond PGXXXI the Current yield will be 8.86% for the coupon rate of 8.90% and present value of Rs. 1.5075 Crores. And for the GSec Bond with coupon rate of 10.25%, the Current Yield is 8.89% because of its high market value. Similarly Yield to Maturity and Current Yield of all the Bonds are as follows: Bond Duration to Coupon Face Present YTM Current Yield Maturity Rate Value Value (Rs. Crs.) (Rs. Crs.) XXXII 14.997222 8.84% 1.5 1.5 8.840% 8.84% XXXI 14.902778 8.90% 1.5 1.507589 8.816% 8.86% XXX 14.497222 8.80% 1.5 1.517222 8.612% 8.70% XXVIII 13.708333 9.33% 1.5 1.568498 8.521% 8.92% XXVII 13 9.47% 1.5 1.5065713 9.382% 9.43% XXVI 12.936111 9.30% 1.5 1.5 9.300% 9.30% XXV 12.2 10.10% 1.5 1.4917073 10.215% 10.16% XXIX 13.95 9.20% 1.5 1.535168 8.780% 8.99% XXIV 11.988889 9.95% 1.5 1.5 9.950% 9.95% XXIII 11.858333 9.25% 1.5 1.5 9.250% 9.25% XXII 11.686111 8.68% 1.5 1.494723 8.758% 8.71% XXI 11.530556 8.73% 1.5 1.5046713 8.661% 8.70% XX 11.436111 8.93% 1.5 1.5 8.930% 8.93% XVIII 10.941667 8.15% 1.5 1.375 8.150% 8.89% XVII 8.4777778 7.39% 1.375 1.27544 8.873% 7.97% XVI 7.8833333 7.10% 1.35 1.122116 8.995% 8.54% XV 8.8972222 6.68% 1.2 1.139539 6.359% 7.03% XIX 11.316667 9.25% 1.125 1.4997551 9.254% 6.94% XIV 5.2972222 6.10% 0.75 0.705981 8.153% 6.48% XIII 7.3333333 8.63% 1 1.133466 5.141% 7.61% PFC ( S-57) 14.352778 8.60% 100* 99.4346* 8.691% 8.65% GOI LOAN 8.20% 2024 14.458333 8.20% 100* 99* 8.335% 8.28% OIL BOND GOI LOAN 10.25% 2021 11.166667 10.25% 100* 115.25* 8.205% 8.89% Table 14 YTM and Current Yield of All Bonds Some of the important analysis is:  For all the Bonds, if market value is less than the present face value (i.e. Face Value less redeemed value), the Yield to Maturity will be more than the coupon rate. The rationale behind this is that the investor to own the security is paying more amount than its Face value. Thus the overall yield will be less than the coupon rate. And the Yields will be more if the face value is less than the face value. 86
  • 88. Analysis of Fixed and Floating Interest Rates 2010  Similar is the case with the Current Yield. The coupon rate is calculated on the face value whereas the investor will calculate his yield on his investment which is based on market value, thus lower the market value, higher the Yield. Yield- Coupon-Price 12.00% 10.00% 8.00% Coupon/ Yield 6.00% Coupon Rate YTM 4.00% Current Yield 2.00% 0.00% -2 0 2 4 6 8 10 12 14 16 18 Difference in PV and FV  From the above chart it is clearly visible that both the yields are lower than the coupon rate when the difference in Present market Value and the present face value is positive. In other words when the present value is more than the face value.  Also the current yield is less than the Yield to Maturity in case of a small difference, but The current yield will be more than the YTM in case of a large difference, this is because, the large difference will promise high returns in short term if the security is held for short duration but in case of a long duration, the present high returns will be normalised and the overall YTM will be reduced. Maturity- Yields 12.000% 10.000% 8.000% Yields 6.000% YTM 4.000% Current Yield 2.000% 0.000% 3 5 7 9 11 13 15 17 Years to Maturity ( Yrs.) 87
  • 89. Analysis of Fixed and Floating Interest Rates 2010  From the relationship between the Yield and the Duration (years to maturity), it can be seen that, less the duration to Maturity, more deviation in Current Yield and YTM. The Yield to maturity is computed by calculating the future cash flows, in case if the present value is higher and the years for which the cash flows are to be estimated are less, this would lead to lower yields. And the reverse situation in a vice versa case. Price-Yield Relationship A fundamental principle of an option free bond (i.e... a bond without any call / put option embedded with it) is that the price of the bond changes in a direction opposite to that of change in the required yield for the bond. But the relationship may be linear, collinear or quadratic. Thus it is necessary to determine the price-yield relationship. This relationship when plotted on a graph will give Yield- Curve. The Yield Curve is used by the investors and also valuators of the bond to measure the volatility and also the sensitivity. The Price Yield curve for PGXXX bond which has a coupon rate of 8.80% and Maturity of 15 years is Yield Curve -PGXXX 3 2.5 2 Price 1.5 1 PRICE 0.5 0 0.00% 5.00% 10.00% 15.00% 20.00% 25.00% 30.00% 35.00% 40.00% Yield Figure 33 Yield Curve of PGXXX Similarly the Yield curve for GSec Bond of coupon rate 8.20% and Maturity of 14.5 years is Yield Curve- GSec 8.20% 200 150 Price 100 50 Price 0 0.000% 5.000% 10.000% 15.000% 20.000% 25.000% Yield Figure 34 Yield Curve of GSec 8.20% 88
  • 90. Analysis of Fixed and Floating Interest Rates 2010 And the Yield Curve for PFC Bond 57 of Coupon rate of 8.60% and the Maturity of 14.5 Years (approx.) Yield Curve - PFC Bond 57 200 150 Price 100 50 Price 0 0% 3% 6% 9% 12% 15% 18% 21% 24% 27% 30% 33% 36% 39% Yield Figure 35 Yield Curve of PFC (S-57) From the above three yield curves of different Bonds namely of Power Grid Corporation of India Limited , Government of India and Power Finance Corporation, some of the observations that can be made are:  The Yield Curve of all the three Bonds is curvilinear and not exact linear.  The Curve of PG Bond is curvilinear for the higher prices and is linear for the lower prices. This implies, the yield would be less responsive to the rise in price but it will be high responsive to the fall in price.  The GSec Bond is perfectly curvilinear because of its redemption pattern. IT is redeemed as a bullet payment after its tenure unlike the Power Grid Corporation of India Limited bonds which are redeemed in instalments.  The sensitivity and convexity of the bonds can be measured with more accuracy using tools like Convexity, Modified Duration etc... 89
  • 91. Analysis of Fixed and Floating Interest Rates 2010 Duration of PSU and GSec Bonds After computing and analysing the Yield of each bond and Yield curve, it is also necessary to analyse the Duration of the selected bonds. As mentioned before the Macaulay’s Duration is effective tenure of the bonds. In simple words it is time period after which the investor will receive back his investment at a particular yield to maturity. Macaulay's duration, therefore, equals the average time to receipt of a bond's cash flows, in which each cash flow's time to receipt is weighted by its present value as a percentage of the total present value of all the cash flows. As mentioned before, The Macaulay’s Duration is Time weighted, present values of the future cash flows. Thus to compute the Macaulay’s Duration, The cash flows must be multiplied by the respective time period, and its present value needs to be computed. The ratio of sum of the present values of Time weighted future cash flows and the current price of that bond results in Macaulay’s Duration. Thus the formula used is: 1 2 1 + + (1 + )2 + … … . + (1 + ) + (1 + ) = Here C= Coupon Inflows y = IRR/ Yield M= Maturity Amount (Redemption Amount) n= Number of Periods P= Price And Modified Duration which shows the sensitivity of the bond prices with respect to the yield. In other words it shows the change in price with the change in Yield. It is computed by dividing the Macaulay’s Duration by 1+Yield i.e... (1+y) Following is the computation of Macaulay’s Duration and Modified Duration for the bond PGXXXI, which has 4 years Moratorium period with 12 equal instalments to be annually at a coupon rate of 8.90%. The table of future cash flows and the present value as on 31st March 2010 was used to compute IRR (Yield to maturity). And the same IRR is used to discount and get the present values of time weighted Cash flows. Period Year Total Payments (1+r)^n N*C N*C/(1+r)^n (N) (C) r=8.816% 0 2010 -1.50759 1 0 0 1 2011 0.1335 1.088162 0.1335 0.122684 2 2012 0.1335 1.184098 0.267 0.225488 3 2013 0.1335 1.28849 0.4005 0.310829 4 2014 0.2585 1.402087 1.034 0.737472 5 2015 0.247375 1.525698 1.236875 0.810694 6 2016 0.23625 1.660208 1.4175 0.853809 7 2017 0.225125 1.806576 1.575875 0.872299 90
  • 92. Analysis of Fixed and Floating Interest Rates 2010 8 2018 0.214 1.965848 1.712 0.870871 9 2019 0.202875 2.139162 1.825875 0.853547 10 2020 0.19175 2.327756 1.9175 0.823755 11 2021 0.180625 2.532976 1.986875 0.784403 12 2022 0.1695 2.75629 2.034 0.737949 13 2023 0.158375 2.999291 2.058875 0.686454 14 2024 0.14725 3.263716 2.0615 0.631642 15 2025 0.136125 3.551453 2.041875 0.574941 Sum (1) 9.896837 Price(Present Value) (2) 1.507589 Macaulay’s Duration= (1)/ (2) 6.564678 Modified Duration 6.032811 Table 15 Modified and Macaulay's Duration of PGXXXI The Macaulay’s Duration is sum of the discounted time weighted values of the future cash flows as on 31st March 2010. In this case the present value being Rs. 1.507589 Crores, The Macaulay’s Duration is 6.564678 years. This implies the investor at the present yield of 8.816%, can get back his investment in 6.5 years, though the years to maturity are 15 years. And the Modified Duration, which is ratio of Macaulay’s Duration and 1+Yield to maturity, is 6.032811. This implies for every 1 basis point change in the yield, the price will change in a reverse direction by 6 basis points. Similarly in case of GSec Bonds whose redemption is on maturity after 20 years with years to maturity being 12 years with the coupon rate of 10.25%. Period Year Total Payments (1+r)^n N*C N*C/(1+r)^n (N) ( C) r=8.205% 0 2010 -115.25 1 0 0 1 2010 10.25 1.08204869 10.25 9.472771505 2 2011 10.25 1.17082937 20.5 17.50895609 3 2012 10.25 1.26689438 30.75 24.27195225 4 2013 10.25 1.37084141 41 29.90863839 5 2014 10.25 1.48331715 51.25 34.55093872 6 2015 10.25 1.60502138 61.5 38.31724657 7 2016 10.25 1.73671128 71.75 41.31371789 8 2017 10.25 1.87920617 82 43.63544636 9 2018 10.25 2.03339257 92.25 45.36753068 10 2019 10.25 2.20022977 102.5 46.58604357 11 2020 10.25 2.38075574 112.75 47.35891128 12 2021 110.25 2.57609363 1323 513.5682892 Sum (1) 891.8604425 Price(Present Value) (2) 115.25* Macaulay’s Duration= (1)/ (2) 7.738485401 Modified Duration 7.151698 Table 16 Modified and Macaulay's Duration of GSec 91
  • 93. Analysis of Fixed and Floating Interest Rates 2010 Here the present value is in index points as published by NSE WDM Segment. This index implies for the face value of 100 points, the present value in market is 115.25 points. For simplicity and accuracy in calculation, 100 have been used as the face value for computing the coupon payments. The Macaulay’s Duration turns up to 7.74 years (Approx) and Modified Duration is 7.15. Every one basis point increase in the yield would lead to 7.74 basis point fall in the price. Similarly the Macaulay’s Duration and Modified Duration of each of the Bonds is summarised in the following table: Bond Duration to Maturity Coupon YTM Macaulay's Modified (Years) Rate Duration Duration XIV 5.2972222 6.10% 8.153% 3.128941 2.89307 XVI 7.8833333 7.10% 8.995% 3.782077 3.469942 XIII 7.3333333 8.63% 5.141% 3.919007 3.72737 XVII 8.4777778 7.39% 8.873% 4.099708 3.765581 XV 8.8972222 6.68% 6.359% 4.269027 4.013794 XVIII 10.941667 8.15% 8.150% 4.720113 4.364413 XXIV 11.988889 9.95% 9.950% 4.760437 4.329638 XIX 11.316667 9.25% 9.254% 4.850537 4.439701 XXIII 11.858333 9.25% 9.250% 4.850878 4.440163 XX 11.436111 8.93% 8.930% 4.893468 4.492305 XXII 11.686111 8.68% 8.758% 4.919947 4.523764 XXI 11.530556 8.73% 8.661% 4.926986 4.534258 XXV 12.2 10.10% 10.215% 5.295218 4.804435 XXVII 13 9.47% 9.382% 5.413836 4.949495 XXVI 12.936111 9.30% 9.300% 5.432109 4.969907 XXIX 13.95 9.20% 8.780% 6.037437 5.550137 XXVIII 13.708333 9.33% 8.521% 6.057109 5.58152 XXXI 14.902778 8.90% 8.816% 6.564678 6.032811 XXXII 14.997222 8.84% 8.840% 6.567683 6.034255 XXX 14.497222 8.80% 8.612% 6.60183 6.07838 PFC ( S-57) 14.352778 8.60% 8.691% 6.761574 6.220913 GOI LOAN 10.25% 11.166667 10.25% 8.205% 7.738485 7.151698 2021 GOI LOAN 8.20% 14.458333 8.20% 8.335% 8.049266 7.429977 2024 OIL BOND Table 17 Macaulay's and Modified Duration of All Bonds From the above table of summary, some of the observations that can be made are:  Modified and Macaulay’s duration are less than Maturity. This implies that, though the security has a longer maturity, but the investor can get back his investment sooner than the redemption date.  And also, the Modified duration is always less than the Macaulay’s Duration. 92
  • 94. Analysis of Fixed and Floating Interest Rates 2010 Duration 9 8 7 6 Duration 5 Macaulay's Duration 4 3 Modified Duration 2 1 0 1 2 3 4 5 6 7 8 9 10 11 12 13 14 15 16 17 18 19 20 21 22 23 Figure 36 Modified Vs Macaulay's Duration  For same maturity bonds, Lower the coupon greater the duration  With all factors constant, Longer the maturity, greater the modified duration Duration- Maturity 7 6 5 Maturity 4 3 Macaulay's Duration 2 Modified Duration 1 0 0 5 10 15 20 Duration Figure 37 Duration Vs Maturity  With all factors constant, Lower the coupon rate, greater the modified duration  With all factors constant, Lower the yield, greater the modified duration 93
  • 95. Analysis of Fixed and Floating Interest Rates 2010 Duration- Yield 8 7 Duration 6 Macaulay's Duration 5 Modified Duration 4 7.000% 8.000% 9.000% 10.000% Yield Figure 38 Duration Vs Yield  Also, it can be seen that, among the Power grid bonds and PFC bonds and also GSec bonds, the Power grid Bonds have less Duration, both the Macaulay’s and modified are less.  Though the years to Maturity and coupon rate are almost same for PGXXX, PFC (S-57) and GOI LOAN 8.20% 2024 OIL BOND, the Macaulay’s Duration and Modified Duration differ and it is lowest for the PGXXX followed by PFC (S-57) and then GOI Loan 8.20%. The main reason behind this is the repayment structure. In case of Power Grid, the repayment of principal is done annually after 3 years, and in case of PFC the principal is repaid in each 5 years and in case of GOI, it is paid only on maturity. Thus the repayment also affects the Bonds Duration. 94
  • 96. Analysis of Fixed and Floating Interest Rates 2010 Convexity of PSU and GSec Bonds Convexity is the measure of sensitivity of duration of bond to the change in yield. As discussed before, the Modified Duration also measures the sensitivity of bond price to the change in Yield. But the modified duration predicts the relationship more accurately in case of small change in the yield. There is a scope of error in case of larger change in the yield. Thus Convexity measures the sensitivity of Duration, which further predicts the sensitivity of bonds. Duration is a linear measure or 1st derivative of how the price of a bond changes in response to interest rate changes. As interest rates change, the price is not likely to change linearly, but instead it would change over some curved function of interest rates. The more curved the price function of the bond is, the more inaccurate duration is as a measure of the interest rate sensitivity. Convexity is a measure of the curvature or 2nd derivative of how the price of a bond varies with interest rate, i.e. how the duration of a bond changes as the interest rate changes. Specifically, one assumes that the interest rate is constant across the life of the bond and that changes in interest rates occur evenly. Using these assumptions, duration can be formulated as the first derivative of the price function of the bond with respect to the interest rate in question. Then the convexity would be the second derivative of the price function with respect to the interest rate. In actual markets the assumption of constant interest rates and even changes is not correct, and more complex models are needed to actually price bonds. However, these simplifying assumptions allow one to quickly and easily calculate factors which describe the sensitivity of the bond prices to interest rate changes. For computing the convexity following formula is used: + 1 1 + +2 = /2 100 Here: t= corresponding period of the payment, (1 for first payment) C= Coupon Flows r= Yield to Maturity m= frequency of Intrest payment in a year (2 for half yearly) Following page has the computation of Convexity for the bond PGXXXI, which has 4 years Moratorium period with 12 equal instalments to be annually at a coupon rate of 8.90%. The table of future cash flows and the present value as on 31st March 2010 was used to compute IRR (Yield to maturity). And the same IRR is used as discount rate (r). 95
  • 97. Analysis of Fixed and Floating Interest Rates 2010 Period Year Total 1/(1+r)^t+2 t(t+1)C t(t+1)C / Payments (1+r)^t+2) 0 2010 -1.50759 0.843226 0 0 1 2011 0.1335 0.774313 0.267 0.206741481 2 2012 0.1335 0.711031 0.801 0.569535759 3 2013 0.1335 0.652921 1.602 1.045979356 4 2014 0.2585 0.59956 5.17 3.099725703 5 2015 0.247375 0.55056 7.42125 4.085845154 6 2016 0.23625 0.505565 9.9225 5.016468269 7 2017 0.225125 0.464247 12.607 5.852761609 8 2018 0.214 0.426306 15.408 6.568519178 9 2019 0.202875 0.391465 18.25875 7.147667886 10 2020 0.19175 0.359472 21.0925 7.582169706 11 2021 0.180625 0.330094 23.8425 7.870264977 12 2022 0.1695 0.303117 26.442 8.015008446 13 2023 0.158375 0.278344 28.82425 8.023055926 14 2024 0.14725 0.255596 30.9225 7.903664961 15 2025 0.136125 0.234707 32.67 7.667877721 Sum 80.65528613 2 (Sum/100)/m 0.806552861 Table 18 Convexity of PGXXXI The convexity of the above bonds turns up to 0.806; this implies a one basis point change in yield would lead to 0.806 basis points change in duration. Similarly the Convexity of the other bonds is as summarised in the following table: Bond Duration to Coupon Rate YTM Convexity Maturity XIV 5.2972222 6.10% 8.153% 0.10768 XVI 7.8833333 7.10% 8.995% 0.24911 XIII 7.3333333 8.63% 5.141% 0.19280 XVII 8.4777778 7.39% 8.873% 0.32667 XV 8.8972222 6.68% 6.359% 0.28267 XVIII 10.941667 8.15% 8.150% 0.42211 XXIV 11.988889 9.95% 9.950% 0.46356 XIX 11.316667 9.25% 9.254% 0.48399 XXIII 11.858333 9.25% 9.250% 0.48399 XX 11.436111 8.93% 8.930% 0.49372 XXII 11.686111 8.68% 8.758% 0.50151 XXI 11.530556 8.73% 8.661% 0.49994 XXV 12.2 10.10% 10.215% 0.54853 XXVII 13 9.47% 9.382% 0.57145 XXVI 12.936111 9.30% 9.300% 0.57785 96
  • 98. Analysis of Fixed and Floating Interest Rates 2010 XXIX 13.95 9.20% 8.780% 0.68333 XXVIII 13.708333 9.33% 8.521% 0.67719 XXXI 14.902778 8.90% 8.816% 0.80655 XXXII 14.997222 8.84% 8.840% 0.81014 XXX 14.497222 8.80% 8.612% 0.81255 PFC ( S-57) 14.352778 8.60% 8.691% 0.59129 GOI LOAN 10.25% 2021 11.166667 10.25% 8.205% 0.65486 GOI LOAN 8.20% 2024 OIL 14.458333 8.20% 8.335% 0.76856 BOND Table 19 Convexity of All Bonds From the above summary of convexity of different bonds, some of the analyses that can be made are:  Higher the convexity implies more sensitive the prices of the bonds are.  For the bonds, whose present value is more than its face value (this can be verified by looking at Coupon rate and YTM, if YTM is more than Coupon rate implies the Present value is less than the face value and vice versa), the Convexity is low, this signifies that, since the price is already high, the sensitivity of the same is decreased.  Also in case if Present value is less than the face value (i.e... YTM is less than the coupon rate), the Convexity is high implying that the sensitivity of the price is high.  Also it can be seen that, there is a Direct relationship between the Years to Maturity and Convexity. In other words Bonds with more years to mature are more sensitive when compared to the bonds with shorter maturity. This is mainly because of uncertainty of the yield to be remaining constant, and thus the change in yield would impact the prices highly. Duration-Convexity 16 14 Years to Maturity 12 10 8 6 4 2 0 0.00000 0.20000 0.40000 0.60000 0.80000 1.00000 Convexity Figure 39 Duration Vs Convexity  Also among the bonds having same maturity, there is inverse relationship between the Coupon rate and the convexity. The higher the coupon rate, lesser the convexity. This is 97
  • 99. Analysis of Fixed and Floating Interest Rates 2010 bacause, since all the bonds will be matured in the same year, the bonds with higher coupon rate will be less sensitive to the changes in intrest rates ( Yield) and the oppostie trend in case of bo0nds with lower coupon rate. Coupon Rate- Convexity-Maturity 10.20% 10.00% 9.80% Coupon Rate 9.60% 9.40% 9.20% 9.00% 8.80% 8.60% 0.46000 0.47000 0.48000 0.49000 0.50000 0.51000 Convexity Figure 40 Coupon Rate Vs Convexity (Same Maturity)  And for the Bonds having same Duration, there exist a positive relationship between Coupon rate and the Convexity. Coupon Rate-Convexity-Duration 9.00% 8.50% Coupon Rate 8.00% 7.50% 7.00% 6.50% 6.00% 0.20000 0.25000 0.30000 0.35000 0.40000 0.45000 0.50000 0.55000 Convexity Figure 41 Coupon Rate Vs Convexity (Same Duration) 98
  • 100. Analysis of Fixed and Floating Interest Rates 2010 Chapter V Analysis of Fixed and Floating Intrest Rates  Introduction to Fixed and Floating Rate  Debt Servicing of PGCIL Bonds  Floating Interest for PGCIL Bonds  Factors Effecting the Selection of Each Method 99
  • 101. Analysis of Fixed and Floating Interest Rates 2010 Introduction Bonds (Debentures) are the avenues of the investment for the investors. They are similar to securities on which a regular income can be generated. And these are issued by the corporate, the exchequer or by any Public undertaking or Municipal bodies etc... They act as source of funds for the issuer. They are similar to loans but instead of taking from a sole institute or a consortium, the bonds are raised from wide range of public. And the issuer pays regular interest on these bonds. This interest is determined by either the Issuer or the investor or by both. The rate determined is termed as Coupon rate. This coupon rate can be either fixed at the time or issue or it can be even floating. In specific to India, the bonds are issued by The Central Government in form of Zero coupon securities (Treasury Bills), bonds of tenure 1 year, 3 years, 5 years, 10 years, 15 years and even 20 years, by the state government, PSUs ( Public Sector Undertakings) and also private players. These are of different maturity and also different repayment structure. For instance the GSec (central Govt Securities) are redeemed only on their maturity and interest is paid half yearly, the corporate bonds are repaid in equal annual or 3 year or even 5 year instalments with some moratorium period. And the interest is paid either half yearly or yearly. But the bonds issued by them are usually of fixed interest rate. But in a recent past, central Government and also some corporate have issued the bonds at fixed rate. Now let us understand the meanings of fixed and floating rates. Fixed Intrest Rate As the name very clearly signifies that the interest rate in this case is fixed and will remain the same for throughout the life of the bond say 15 years or so. In this case the coupon rate is attached to the nomenclature of bonds and the coupon rate is paid annually or semi annually on the face value of bond outstanding. For Instance a bond PGC 8.80% 2025 (S-XXX) implies the bond issued by Power Grid Corporation of India Limited which will mature in the year 2025 and coupon rate of 8.8% will be paid annually/ semi-annually as defined in the Information memorandum. The Coupon rate is determined by the process of Book Building in case of Private Placement or it can be even fixed by the issuer. However the rationale to set the fixed coupon rate and its process is as follows: I. Credit rating on the Security to be issued from 2 or more Credit Rating Agencies shall be obtained as per the SEBI (Disclosure and Investors’ Protection) Guidelines, 2000 amended on 14th August 2003. II. At the time of opening of the issue, the prevailing rate on Government securities of same tenure that of the security to be issued, is considered. This can be the coupon rate of latest issue of the similar bond by GoI or Average of last 5 or so issues. III. Also the prevailing conditions of economy in general and in specific the condition of money market is also considered. The high liquidity is considered as favourable and also any policies of RBI or any announcements in the recent future or during the time of issue are also considered. IV. Also the Bank lending rate ( PLR) is considered 100
  • 102. Analysis of Fixed and Floating Interest Rates 2010 V. The coupon rate of other corporate bodies issues also impact the coupon rate determination of the present issue. VI. After the above factors are considered, the interest rate on GSec is taken as base rate and a spread is added to it. VII. Since the GSec issued by the government is considered as the safest and secured investment, a spread is to be added to its coupon rate based on the security and the rating of the bond. VIII. The spread is widely influenced by the factors like security on the bond, the credibility of the issuer, the market conditions, issues of other players etc. IX. In India, The FIMMDA ( The Fixed Income and Money Market Derivatives Association), a association to co-ordinate and also promote the Money market Instruments like Commercial papers, Certificate of Credit, Bonds, etc..., provides the spread for each kind of security and for each duration. X. Thus based on the tenure of the bonds and the rating on that bond, a spread is obtained. The spread published by the FIMMDA is already adjusted with all the factors affecting the interest rate. XI. Thus a range of interest rate is defined based on interest rate determined by adding spread to GSec rate. XII. The range may be defined by defining just the floor or ceiling rate and keeping the other end open. XIII. Usually the floor rate is kept open to take advantage of sudden change in economic conditions, where the issuer could be in a position to get a rate lower than the defined rate. And the ceiling rate is fixed to avoid more escalation of rate towards upper end. XIV. After the range is defined, by the process of bidding the coupon rate is determine and this rate is kept fixed for the whole tenure of the bond. The fixed interest rate has many benefits attached to it. Some of them are:  The payment towards interest rate is fixed and the issuer can prepare a budget well in advance. And also repayment schedule can be prepared.  It is preferred by the investors as a fixed income is promised every year and the risk of rates falling down can be avoided.  Also this kind of investments is preferred by the investors seeking for regular and non- fluctuating. These include the provident Funds, Pension Funds and Gratuity Funds, which form majority in the investors group.  For the issuer, there is indemnity of hike in rates due to unfavourable circumstances. Along with the aforesaid merits, there are some demerits attached to it like  In case of down turn in economy, there will be fall in all the interest rates and also the fall in performance of the business leading to unattractive cash flows. But even in this case the interest to be paid on the bonds remains at the same level.  The interest for the whole tenure is based on the conditions of money market and the economy at the time of issue. The later conditions are not reflected.  Even for the investor, there is scope of demerit if the security is issued at the time when the condition of economy was poor and the interest rate fixed was very low. And this will not 101
  • 103. Analysis of Fixed and Floating Interest Rates 2010 increase even though the general interest rate is increased due to improvement in the economic conditions.  The issuer may end up paying high debt obligation in case of fixed interest rate and cannot take the advantage of fluctuations and trends in other rates. Thus to avoid the demerits of the Fixed Intrest rate, some issuer go for the FRBs (Floating rate Bonds). Floating Intrest Rate It is clear from the term that, the interest rate is floating and not fixed. In this case the interest rate will be adjusted periodically based on the benchmark rate. In this case for every interest payment period the interest rate is determined based on the benchmark rates and a spread is added to it. Unlike Fixed interest rates where the coupon rate was determined at the time of issue, in this case it cannot be predetermined. The nomenclature in this kind will be GOI FLOATING RATE +0.14% 2014, this implies the bond is issued by the Government of India, will be matured in the year 2014 and the spread is +0.14%. This implies that 0.14% will be added to the benchmark rate for every reset period. The Benchmark rate and the reset period are determined by the issuer and are shared in their disclosure document. Usually the reset period is based on the frequency of interest payment. For instance, in the above case the reset period was 6 months because the interest is paid semi- annually. And the Benchmark rate was average yield of last 5 T-Bills (Treasury bills) issued by the Government preceding the reset date. As in case of fixed interest rate, the coupon rate was determined based on the bidding by the investor, in the case of floating rate, the spread is determined by the bidding process. A Benchmark or a Reference Rate is a rate that is an accurate measure of the market price. In the fixed income market, it is an interest rate that the market respects and closely watches. A benchmark rate should be from an unbiased source, be representative of the market, transparent, reliable and continuously available and most importantly be widely acceptable to the market as the benchmark rate Such benchmark rates issued by unbiased sources are the Treasury Bill (T-Bill) rate issued by the Government of India, the bank rate as decided by the Reserve Bank of India, the Mumbai Interbank Offering Rate (MIBOR) released by the National Stock Exchange of India and GOI Securities. Thus specifically for the Bonds the base rate can be any of the following:  Coupon rate of similar tenure GSec Bond issued preceding the reset date.  Average of Coupon rate of last 5 similar tenure GSec Bonds issued preceding the reset date.  Average yield of last 5 Treasury Bills of maturity of 364 days issued preceding the reset date. ( for annual interest payment)  Average yield of last 5 Treasury Bills of maturity of 180 days issued preceding the reset date. ( for semi annual interest payment) 102
  • 104. Analysis of Fixed and Floating Interest Rates 2010  Average of Yields of similar tenure GSec bonds for the last 12 months preceding the reset date.  Average of Yields of similar tenure GSec bonds for the last 6 months preceding the reset date. ( for semi annual interest payment)  Average daily yield of similar tenure GSec bonds for a month preceding the reset date.  Average Yield of 1 year GSec for the 3 days preceding the reset date. The above stated base rates are not exclusive and exhaustive. Different issuers take different base rates based on the structure of the repayment, the tenure of the bonds etc... The Reset Date is the date on which the interest rate is reset based on the base rate and the spread pre determined. The frequency of reset date could be quarterly, half yearly or even annually based on the interest payment date. Sometimes the reset date may be annually where as the interest is paid semi annually and vice versa. The determination of reset date depends on the issuers wish. And the Spread can be either negative or positive i.e... The interest rate can be less than the base rate or more than that. Usually it is positive signifying that the bonds must pay more interest than the GSec yield as there is risk attached to it. The spread is predetermined at the time of issue and remains same for the life of the bond. And the spread can be determined by the bidding by the investors participating. But the base range is estimated with the help of average spread as published by FIMMDA or the difference in base rate and the prevailing rate on similar bonds during the time of issue. Some of the benefits of Floating rate are:  The issuer can take advantage of movement in general interest rates and condition of market.  No matter whatever is the condition of economy during the issue, the later on interest rates are truly represented by the state of the economy.  The investors risk is minimised as the returns are based on the market conditions and the opportunity cost is negligible.  Also the floating rate minimises the fluctuation in prices. Floating Rate funds are protective funds and shield your investments from interest rate fluctuations. In a declining interest rate scenario older securities issued at higher coupon rates (interest paid on the face value of a debt instrument) appear much more attractive than the ones that are currently issued. Consequently older higher interest bearing securities would go at a premium. Thus long term income funds by virtue of their investments in longer maturing securities would see a rise in their Net Asset Values. However, when interest rates are on the rise newer securities appear more attractive than the ones that were issued earlier, as they offer higher coupons than their predecessors. The lesser paying older securities therefore will be sold at a discount. So the same income fund with a majority of investment in longer maturing securities, now start earning you lesser as newer securities continues to earn higher returns than the ones in the portfolio. 103
  • 105. Analysis of Fixed and Floating Interest Rates 2010 This bearish scenario lasts as long as interest rates continue to show an upward trend. It is during these times that floating rate funds offer the best utility. Some of the demerits are:  The investor is exposed to fluctuations in interest rates.  He cannot pre plan the expenses towards financial charges well in advance  Since the interest rates fluctuates, the investor class looking for fixed and regular income ( including PF Funds and gratuity fund) may not be attracted. Though both the methods have some merits and some demerits, it can be concluded on which method is to be used. Suitability of each mechanism is based on the tenure of bond, amount of interest to be paid, the market condition during the issue etc..... Indian Issuers going for FRBs Though most of the Indian issuers of Bonds go for the fixed coupon rate, there are few players who also go for Floating rate like Government of India issued few of its bonds under floating rate and also Power Finance Corporation of India, a NBFC to finance power project has also issued one of its bonds with floating rate. But one must observe that both the above mentioned issuers do not issue only floating rate but they also issue some of the bonds based on the tenure and condition of economy with floating rate option. Also the structure of repayment, the benchmark and its determination differ in each case. Some of the prominent issuers of FRBs and their issue structure are as follows: GOI Floating Rate Bonds As mentioned before the Government of India issues the floating rate bonds along with the fixed rate. It has issued its first FRB on 02nd of July, 2002 at a spread o =).34% (+3 basis points) over the yield of last 5 T-Bills issued preceding the Intrest payment date. The tenure of these bonds was 15 years, maturing on 02nd of July, 2017. As per NSE’s Monthly Trading history provided by its Wholesale Debt Segment, as on 31st March, 2010, there are 8 FRBs issued by Government active on the exchange. Each had different maturity and different spreads. But the interest on these is paid half yearly with reset period of 6 months. The benchmark for all the cases was Average yield on last 5- Treasury Bills of 364 Days maturity issued immediately preceding the Reset date. The summary of all those issues is as follows: Issue Description Spread Issue Dt. Mat Dt. Maturity Cpn Freq ( years) GOI FLOATING RATE +0.13% 2011 +0.13% 08-Aug-03 08-Aug-11 8 Half-Yearly GOI FLOATING RATE +0.09% 2012 +0.09% 10-Nov-03 10-Nov-12 9 Half-Yearly GOI FRB +0.45% 2013 +0.45% 10-Sep-04 10-Sep-13 9 Half-Yearly GOI FLOATING RATE +0.14% 2014 +0.14% 20-May-03 20-May-14 11 Half-Yearly GOI FLOATING RATE +0.19% 2015 +0.19% 02-Jul-04 02-Jul-15 11 Half-Yearly GOI FLOATING RATE +0.50% 2015 +0.50% 10-Aug-04 10-Aug-15 11 Half-Yearly 104
  • 106. Analysis of Fixed and Floating Interest Rates 2010 GOI FRB +0.04% 2016 +0.04% 07-May-04 07-May-16 12 Half-Yearly GOI FLOATING RATE +0.34% 2017 +0.34% 02-Jul-02 02-Jul-17 15 Half-Yearly 12 Table 20 FRBs by GOI Indian Railway Finance Corporation Limited (IRFCL) The Indian Railway Finance Corporation is a separate unit established for the purpose of finance the projects related to building and development and also maintenance of railway. The company is a Government of India undertaking. Along with the fixed coupon rate bonds, it also issues the floating rate bonds. The maturity o the bonds issued is 5 years. And in one case the bond series issued was in form of STRPP (Separately Transferable Redeemable, principal parts) which are redeemed in equal annual instalments. And the benchmark rate for these bonds is INBMK rate for relevant GSec of relevant maturity as published by The Reuters. Since the interest payment is semi-annual, the interest rate is reset in a period of six months. The summary of issues by this company, as provided by NSE (WDM) as on 31st march 2010 is: Issue Description Spread Issue Dt. Mat Dt. Maturity Redemption Reference Rate ( years) IRFC +0.37% 2010 +0.37% 22-Jun-05 22-Jun-10 5 Bullet INBMK of 5 Yr GSec (S- 49) IRFC -0.10% 2010 -0.10% 22-Jun-05 22-Jun-10 5 Bullet INBMK of 5 Yr GSec (SER-49) IRFC +5.60% 2010 +5.60% 25-Aug-5 25-Aug-10 5 Bullet (5 yr INBMK) – (1Yr (SERIES-50) INBMK) IRFC -0.10% 2020 -0.10% 22-Jun-05 22-Jun-20 15 STRPPs INBMK of GOI relevant (SER-49) Maturity for each STRPP 12 Table 21 FRBs by IRFC In the above table, for the series 50, the spread seems to be very high, but in this case the benchmark is determined as the difference between INBMK of 5 year GSec and INBMK of 1 year GSec. In other words the spread is added to the excess yield on 5 year GSec over the 1 year GSec. In case if the Floating rate turns out to be negative, no interest is paid. Also in case of Series 49 Option III (Maturity of 15 years); the redemption is in form of different STRPPs having different maturity. Thus in that case the interest is determined separately for each STRPP by taking Reference Rate as INBMK of similar maturity GSec for each STRPP. Power Finance Corporation Limited, PFC, a Government of India Undertaking, is a Non Banking Finance Company, established with the object of financing Power projects in the country. It also issues the bonds regularly and till date it has issued around 60 series of Bonds. Apart from issuing bonds under fixed coupon rate, it also issues its bonds as FRBs. The tenure of bonds range from 3 years to 10 years, and the reset period is six months for semi- annual Intrest payment and 12 months for annual interest payments. The reference rate is different 12 Source: www.nse-india.com/Debt/WDM 105
  • 107. Analysis of Fixed and Floating Interest Rates 2010 for each series. It is MIBOR (Mumbai Inter Bank Offer Rate), or YINCMT or even difference between 1 yr INBMK and 5 yr INBMK. The summary of the past FRBs by PFCL is as follows: Issue Description Spread Issue Dt. Mat Dt. Maturity Cpn Freq Reference Rate ( years) PFC +5.70% 2010 +5.70% 01-Sep-05 01-Sep-10 5 Half- 5 yr INBMK - 1Yr (S- XXIV) Yearly INBMK PFC MIB +2.15% 2011 +2.15% 29-May-08 29-May-11 3 Yearly MIBOR (S-XLVI) PFC 1YINCMT+1.35% 12 +1.35% 20-Nov-09 20-Nov-12 3 Yearly 1 YINCMT (S-60-A) PFC 1YINCMT+1.79% 19 +1.79% 20-Nov-09 20-Nov-19 10 Yearly 1 YINCMT (S-60-B) 13 Table 22 FRBs by PFC ICICI Bank ICICI Bank, the largest private sector bank in India, issues both the fixed and floating rate bonds. The summary of its issues is: Issue Description Spread Issue Dt. Mat Dt. Maturity Reference ( years) Rate ICICI BK +0.60%2010(S-DFE05FRB +0.60% 28-Feb-05 31-May-10 5 1 Yr INBMK ICICIBK+0.50% 2011(S-DJN05FRB) +0.50% 29-Jun-05 29-Apr-11 6 1 Yr INBMK 13 Table 23 FRBs by ICICI Bank Others Apart from the above mentioned, many other corporate issue the Floating rate Bonds. And the list includes:  UTI Bank,  IDFC (Infrastructure Development Finance Company Limited),  Kotak Mahindra Bank ,  EXIM Bank ( Export Import Bank of India),  IDBI ( Industrial Development Bank of India),  CITI Bank,  Sundaram Finance The issue details of some of the above mentioned issuers are as follows: Issue Description Spread Issue Dt. Mat Dt. Maturity Reference Rate ( years) EXIM BK +0.33% 2010 (SER-I03) +0.33% 09-Aug-05 09-Aug-10 5 Avg Yield on 1 Yr GSec for 3 days IDFC +1.50% 2017 (S-PP6/2008) +1.50% 16-May-07 16-May-17 10 MIBOR KOTAK MAH BK +0.55% 2012 (S- +0.55% 22-Aug-05 22-Aug-12 7 1 Yr INBMK I) 13 Table 24 FRBs by Others 13 Source: www.nse-india.com/Debt/WDM 106
  • 108. Analysis of Fixed and Floating Interest Rates 2010 The Debt Servicing for PGCIL’s Bonds The Power Grid Corporation of India Limited issues bonds with fixed coupon rate determined by the book building procedure. The average maturity of most of the bonds is 15 years (4 years of moratorium and then repayment of loan in 12 equal annual; instalments). Apart from this it has also issued different structure bonds of 6 years Maturity ( 1 year moratorium and 6 annual equal repayments), 12 years maturity ( 3 years moratorium and 10 equal annual repayments) etc... The details of all the bonds issued by PGCIL till date along with its repayment structure are attached in the appendix. The interest rate is determined based on the prevailing interest rate on 10 year GSec ( for a 15 year PG bond, since the average tenure turns up to be 9 years because of equally annual repayments) and a spread defined by FIMMDA for a AAA rated bond for 10 years is added to define a range for bidding by investors. Then the rate obtained by the book building process is taken as the coupon rate. Following chart depicts the relationship between the prevailing interest rates on GSec Securities and the Coupon rate of PGCIL Bonds. The blue line depicts the coupon rates of each issue of bonds and the green line depicts the coupon rate of GSec bonds issued immediately before the PGCIL bonds were issued and having same redemption year and also same maturity. The data is taken from the NSE website’s WDM segment and also from the Data published by RBI on the outstanding GSec. From the below chart we can see that for most of the issues the coupon rate on bonds of the company was more than the coupon rate of GSec of similar tenure issued before the issue of PGCIL’s bonds. Some of the points to be noticed are:  In case of XIV issue the Coupon Rate is very much close to the Coupon rate of GSec. The coupon rate of bond is 6.10% whereas the rate of GSec is 6.07%. This is mainly because of gap of one month. The GSec was issued on June 6th 2003 and was of Maturity of 15 years whereas the PGCIL bond was issued on 17th July, 2003 and was with maturity of 12 years. Since no GSec of 12 years was issued in the immediate past, this GSec is considered. Also the Coupon rate is set lower because of its lesser maturity than the GSec.  In case of X issue of PGCIL Bonds, the Coupon rate is lower than the GSec rate (highlighted by the circle). This is unusual in normal scenario. This was mainly because of excess borrowing by the government.  The gap between the blue and green line is spread. Over the years the spread is more or less constant and the average spread is 0.75%. In other words the Coupon rate on an average is set 75 basis points above the GSec rate. 107
  • 109. Analysis of Fixed and Floating Interest Rates 2010 Coupon Rate Vs Gsec Rate 14.00% 13.00% 12.00% 11.00% 10.00% 9.00% 8.00% 7.00% 6.00% 5.00% 4.00% 3.00% 2.00% 1.00% 0.00% Coupon Rate- PG Bonds Interest on Govt Securtiy 14 Figure 42 Coupon Rate of PG Vs GSec Rate From the following chart we study the behaviour of Coupon rates of each bond with the average yield on GSec. Here the Yield on GSec is the data published by RBI and is yield on all the GSec of all the maturities. The blue line which depicts the Coupon rate of each bond series is always more than the red line which represents the Average GSec yield for the year. Also the gap between them, termed as spread, is more or less constant and the movement is in tandem. Coupon Rate Vs Avg Gsec Yield 13.00% 12.00% 11.00% 10.00% 9.00% 8.00% 7.00% 6.00% 5.00% Rate P.A. Avg Yield of GS 15 Figure 43 Coupon Rate of PG Vs Avg GSec Yield 14 Source: http://www.rbi.org.in/scripts/PublicationsView.aspx?id=9483 ; www.nse-India.com (WDM Segment) 15 Source: www.Indiastat.com and www.nse-india.com 108
  • 110. Analysis of Fixed and Floating Interest Rates 2010 Floating Intrest for PGCIL’s Bonds As mentioned before the Power Grid Corporation of India Limited has issued till date 32 series of bonds and all at fixed coupon rate. Thus a study is being made to analyse the interest cost if the company has gone for the floating rate. Assumptions Some of the assumptions taken for the purpose of computation and analysis of Floating rate costs are as follows:  Though the Floating rate deemed to have some additional costs for the company in terms of arrangers’ fees, internal records maintenance, database for computing reference rate, etc... But after speaking to the concerned persons in the company, it has been found that there will not be any substantial additional expenses in case of floating rate.  It is assumed that the Arrangers, as usual will quote a 0% fees because of Ratings (highest rating) and also good credibility of the company.  The company already has the Reuters database and subscribed to the FIMMDA access, thus it need not incur additional expenses for determination of reference rate and spread.  For determining the spread in case of floating rate, as mentioned before usually the spread is determined by way of bidding or is determined by the merchant bankers and the issuer based on the market conditions. Since the calculations are made backward, thus the spread is computed based on the discussion with the Merchant banker16 on the actual industry practices of determining the spread.  For computing the floating rate for each period, three different reference rates are taken based on other company’s practices. Selection of Bonds For the purpose of comparison under fixed and floating rates, the bonds on which the interest has been made for 8 or more periods have been selected, so that a good study can be done. Also bonds of different tenure, different repayment structure and different coupon rates have been taken so that a comprehensive study for each kind of bond can be done. The details of Bonds selected are as follows: Bond Date of Loan Coupon Redemption Maturity Intrest Loan Repayment Description Drawn Rate Date (Yrs.) Payment Amount Structure (Rs. Crs) Bonds VIII 27-04-2000 10.35% 4/2014 14 Half-Yrly 20.00 5 Yr.Moratorium Issue + 10 Eq Ann.Inst Bonds IX 22-08-2000 12.25% 8/2012 12 Half-Yrly 576.50 3 Yr.Moratorium Issue + 10 Eq Ann.Inst Bonds X 21-06-2001 10.90% 6/2015 14 Annual 761.52 3 Yr.Moratorium Issue + 12 Eq Ann.Inst Bonds XIII- 31-07-2002 7.85% 07/2008 6 Annual 250.50 1 Yr.Moratorium Issue + 6 Eq Ann.Inst Bonds XIV- 17-07-2003 6.10% 07/2015 12 Annual 699.00 1 Yr.Moratorium Issue + 12 Eq Ann.Inst Table 25 List of Bonds selected for Analysis 16 Mr. Venkat Krishna, VP, ICICI Securities Primary Dealership Limited 109
  • 111. Analysis of Fixed and Floating Interest Rates 2010 The above list has each kind of bond:  Meagre loan Amount  Half Yearly Intrest Payment  Longer Maturity of 14 years  Shorter Maturity of 6 years  Low coupon rate Based on the above selection suitability of Fixed or Floating rate for each kind of bond can be studied. And as mentioned before, the bonds that are issued in the year 2000, 2001, 2002 and 2003 are selected because the interest is already paid on them under fixed rate and now study can be made under floating rate for the bonds. Selection of Reference Rate As mentioned before in case of a floating rate there is a Reference or Benchmark rate, based on which the floating interest rate is determined. For computation of floating rate following reference rates were considered. I. Average Monthly yield of 10 Year GSec preceding the reset month II. Average Yield of 10 year GSec for 12 months preceding the reset month. Average Yield of 10 year GSec for 6 months preceding the reset month ( for Semi Annual Intrest Payment) III. Average of 1 Year GSec for the past 3 days preceding the reset date. From the above three options, the option I, which is average of GSec yield for the month preceding reset month, will depict the market condition of only the month immediately preceding the reset month. But since the interest is paid for the 6 months or the 12 months, the base rate should truly reflect the conditions of those 6 or 12 months. In the Option II, this is Average Yield of 10 years GSec for the 12 months preceding the reset month for the Annual Intrest payment and 6 months for semi-annual interest payment. On an assumption that, the investor is a long term investor and has invested in the bonds for purpose of income and not trade, 10 years GSec is considered. Also all the above selected bonds except one have an average tenure of 9 years or 10 years, thus Yield on 10 years GSec is comparable. Following Graph will depict the annualised yields of 10 years GSec monthly and also the moving average from the period April 1998 to April 2010. 110
  • 112. Analysis of Fixed and Floating Interest Rates 2010 10 Year Gsec Yield 14.00 12.00 10.00 8.00 6.00 4.00 2.00 0.00 Sep-1998 Feb-1999 Jul-1999 Sep-2003 Feb-2004 Jul-2004 Sep-2008 Feb-2009 Jul-2009 Dec-1999 Dec-2004 Dec-2009 Apr-1998 May-2000 Aug-2001 Apr-2003 May-2005 Aug-2006 Apr-2008 Nov-2002 Nov-2007 Oct-2000 Mar-2001 Jan-2002 Jun-2002 Oct-2005 Mar-2006 Jan-2007 Jun-2007 CLOSE Moving Average ( 12 months) 17 Figure 44 Trend of 10 Yr GSec Yield From the above graph, it can be clearly seen that, if we take monthly data as base rate, there are lots of fluctuations and also the interest will get widely affected by the state of economy and market conditions of a particular month. But in the other case, if average of the 12 or 6 months is taken, the condition of market for the whole 12 or 6 months is taken care of. Thus Option I is not considered. And In the option III, which is yield on one year GSec for the preceding 3 days of reset date. Here the assumptions are  The investor is not a long term investor and is holding the security for a short term period. Thus for him the interest must be based on the one year GSec.  Also since the interest is paid for annual or semi-annual period, the base rate must also reflect the representation of the movements in Sort term Securities ( 1 year GSec) The following graph portrays the movement of Annualised yield of 1 year GSec on daily basis for the period between 01-01-1998 to 30-04-2010 IN1YT=RR 14.00 12.00 10.00 8.00 6.00 4.00 2.00 0.00 Jan-2007 Jan-1998 Jan-1999 Jan-2000 Jan-2001 Jan-2002 Jan-2003 Jan-2004 Jan-2005 Jan-2006 Jan-2008 Jan-2009 Jan-2010 Jul-2008 Jul-1998 Jul-1999 Jul-2000 Jul-2001 Jul-2002 Jul-2003 Jul-2004 Jul-2005 Jul-2006 Jul-2007 Jul-2009 Figure 45 Trend of 1Yr GSec Yield 17 Source: Reuters Database 111
  • 113. Analysis of Fixed and Floating Interest Rates 2010 From both the graphs showing trend of each 10 year and 1 year GSec Yield, it can be seen that, the yield is fluctuating over the period and the benefits of fluctuation can be taken. And if we analyse the Coupon rate of PGCIL Bonds Movement of the issues till date, the trend is as follows, PGBonds 12.00% 10.00% 8.00% 6.00% 4.00% 2.00% 0.00% Figure 46 Trend of Coupon Rates of PG Bonds The curve if compared with the GSec yield it can be seen that the movement in the line is in tandem with the movement of yield. Thus if the company goes for the floating instead of fixed, this can be justified by the following graph. 14.000% 1 Yr Gsec Yield Vs PG Bonds 12.000% 10.000% 8.000% 6.000% 4.000% 2.000% 0.000% IN1YT=RR PG Rate Figure 47 Rates of PG Bonds Vs 1 Yr GSec Yield 112
  • 114. Analysis of Fixed and Floating Interest Rates 2010 Some of the points to be mentioned are:  The Blue Circles and Rhombus represent the Coupon rate on the PGCIL Bonds and the red line depicts the daily yield on 1 year GSec Yield.  The Blue Circles represent the Coupon rate of Bonds selected for the study.  The blue circles are selected in such a case that they represent both at a low yield and also at a high yield.  From the period Jan 2009 onwards the yield has been very low when compared to the coupon rate.  And the gap between the Blue Dots and the red line is considered as the spread. The spread has been increasing by the fall in Yield from Jan-2008 onwards.  Also for first four issues, the corporate payment was half yearly. Thus the interest rate was annualised to have a better comparison with the annualised yield. Reset Period and Reference Period One of the three main parameters to be determined is the Reset period. It is the period at which the Intrest rate is reset as per the reference rate. In case of Floating rate, though it is termed as floating, but the Intrest rate does not change daily, it is reset and calculated at a predetermined period. In our case the reset date is 12 months in case of Annual interest payment and is 6 months for Semi- Annual Intrest payment. Though the interest rate is reset every 12/6 months, but the reference period is also to be determined. In simple words, the reference period implies, for the purpose of computation of base rate the data pertaining to which period shall be taken. In this case, following two situations are considered: 1. Data pertaining to the period preceding the coupon period. For Instance, in case of Semi annual interest payment falling due on 22nd August 2003, then the coupon period starts from 22nd February 2003. Thus Average yield of 6 months preceding the 22nd February 2003 will be considered. i.e... August 2002 to January 2003 will be considered. 2. The second option is, data pertaining to the period preceding the Intrest payment date. For Instance, in case of Semi annual interest payment falling due on 22nd August 2003, then the average yield of 6 months preceding the 22nd August 2003 will be considered. i.e... February 2003 to July 2003 will be considered. For the present study both the reference periods have been considered. Spread The last parameter to be determined in case of Floating rate is the spread. Depending upon the reference rate selected, the spreads will be different. And as mentioned before, the spread will remain constant for the whole tenure of the Bond. Thus it is very crucial thing to determine the spread. Usually in actual cases a range is to be determined, and the exact spread is determined based on the bidding process. But for the purpose of study, based on discussion with the 113
  • 115. Analysis of Fixed and Floating Interest Rates 2010 experienced persons and merchant bankers on the actual practice in the industry is understood and in consultation with them the spread is determined using relevant past data. For purpose of Option II ( 12/ 6 months average yield of 10 years GSec), the spread is taken as average spread for AAA Bonds for the tenure of 10 years for last 5 days preceding the date of issue. For the purpose of Option III (3 days average of yield on 1 year GSec), the spread is taken as difference between base rate as on date of issue and the coupon rate. The rationale behind this is, since the coupon rate is determined by adding the Spread to the prevailing interest rate on 10 years GSec, just the gap between the 1 year GSec and the Coupon rate can be taken as spread. Floating Rate under Reference Rate of Average yield of 1 Year GSec Bond VIII Date of Issue: 27th April, 2000 Intrest Payment: Semi Annually Coupon Rate: 10.35% Loan Amount: Rs. 20 Crores Repayment: 5 years Moratorium and 10 equal Instalments Maturity: 27th April, 2014 Determination of Spread Since the date of issue is 27th April, 2000, the average yields of 3 days preceding i.e... 24th, 25th and 26th April, 2000 is computed and the difference between the average and coupon rate is calculated and the difference turned up to be 1.036% or 103.6 basis points. The computation is as follows: Date Yield-1yr GSec Average yield Coupon Rate Spread 26-04-2000 9.291 25-04-2000 9.306 9.3140% 10.35% 1.03600% 24-04-2000 9.345 931.40% Table 26 Determination of Spread for PGVIII for 1 year GSec as Reference Rate Computation of Floating Rate Average Yield of 1 years GSec ( 3 days preceding Intrest rate) Intrest Floating Fixed Payment Reference Period Average Govt yield Spread rate rate 27-Oct-00 Oct- 23, 24, 25 10.39233% 1.036% 11.428% 10.35% Apr-01 Apr- 23, 24, 26 8.88833% 1.036% 9.924% 10.35% Oct-01 Oct- 23, 24, 25 6.89533% 1.036% 7.931% 10.35% Apr-02 Apr- 23, 24, 26 6.17367% 1.036% 7.210% 10.35% Oct-02 Oct- 23, 24, 25 5.64967% 1.036% 6.686% 10.35% Apr-03 Apr- 23, 24, 25 5.12000% 1.036% 6.156% 10.35% Oct-03 Oct- 22, 23, 24 4.71800% 1.036% 5.754% 10.35% Apr-04 Apr- 21, 22, 23 4.48700% 1.036% 5.523% 10.35% 114
  • 116. Analysis of Fixed and Floating Interest Rates 2010 Oct-04 Oct- 21, 25, 26 5.52533% 1.036% 6.561% 10.35% Apr-05 Apr- 21, 25, 26 5.68333% 1.036% 6.719% 10.35% Oct-05 Oct- 24, 25, 26 5.82767% 1.036% 6.864% 10.35% Apr-06 Apr- 24, 25, 26 6.22600% 1.036% 7.262% 10.35% Oct-06 Oct- 20, 23, 26 6.99133% 1.036% 8.027% 10.35% Apr-07 Apr- 24, 25, 26 7.86667% 1.036% 8.903% 10.35% Oct-07 Oct- 24, 25, 26 6.85867% 1.036% 7.895% 10.35% Apr-08 Apr- 23, 24, 25 7.85000% 1.036% 8.886% 10.35% Oct-08 Oct- 22, 23, 24 7.37800% 1.036% 8.414% 10.35% Apr-09 Apr- 22, 23, 24 4.07600% 1.036% 5.112% 10.35% Oct-09 Oct- 22, 23, 26 4.47700% 1.036% 5.513% 10.35% Apr-10 Apr- 22, 23, 26 4.92367% 1.036% 5.960% 10.35% Table 27 Floating rates for PGVIII for 1 year GSec as Reference Rate Notes:  Though the bond will mature in the year 2014, the interest payment till 27 th April 2010 can be compared because of unavailability of data.  In case of reference period, the three days preceding the interest payment date is considered. Thus in this case, since the interest is to be paid on 27th of August and April, the reference period should be 24th, 25th and 26th. But in case, if wither of 3 days is a holiday, and no trade has been taken place the working days preceding to the holiday is considered. Comparison of Intrest on Fixed and Floating Rate (Rs Crs.) Intrest Payment-Fixed Intrest Payment-Floating Opening Opening Year Balance Redemption Interest Year Balance Redemption Interest Oct-00 20 0 1.035 Oct-00 20 0 1.142833 Apr-01 20 0 1.035 Apr-01 20 0 0.992433 Oct-01 20 0 1.035 Oct-01 20 0 0.793133 Apr-02 20 0 1.035 Apr-02 20 0 0.720967 Oct-02 20 0 1.035 Oct-02 20 0 0.668567 Apr-03 20 0 1.035 Apr-03 20 0 0.6156 Oct-03 20 0 1.035 Oct-03 20 0 0.5754 Apr-04 20 0 1.035 Apr-04 20 0 0.5523 Oct-04 20 0 1.035 Oct-04 20 0 0.656133 Apr-05 20 2 1.035 Apr-05 20 2 0.671933 Oct-05 18 0 0.9315 Oct-05 18 0 0.61773 Apr-06 18 2 0.9315 Apr-06 18 2 0.65358 Oct-06 16 0 0.828 Oct-06 16 0 0.642187 Apr-07 16 2 0.828 Apr-07 16 2 0.712213 Oct-07 14 0 0.7245 Oct-07 14 0 0.552627 Apr-08 14 2 0.7245 Apr-08 14 2 0.62202 Oct-08 12 0 0.621 Oct-08 12 0 0.50484 Apr-09 12 2 0.621 Apr-09 12 2 0.30672 Oct-09 10 0 0.5175 Oct-09 10 0 0.27565 Apr-10 10 2 0.5175 Apr-10 10 2 0.297983 17.595 12.57485 Table 28 Intrest under Fixed and Floating rates for PGVIII for 1 year GSec as Reference Rate 115
  • 117. Analysis of Fixed and Floating Interest Rates 2010 VIII ( 1 Yr Gsec) 1.2 1 0.8 0.6 Intrest Payment-Fixed 0.4 0.2 Intrest Payment- 0 Floating Aug-01 Apr-03 Aug-06 Apr-08 Feb-04 Feb-09 Jun-02 Dec-04 Jun-07 Dec-09 Oct-00 Oct-05 Figure 48 Intrest Payments under Fixed and Floating Rate for PGVIII for 1 year GSec as Reference Rate From the above table and chart, it is clearly visible that, the company would have been able to save Rs. 5, 02,015,000 (Rs.50.2 Million) if it had issued the bond at floating rate. Also from the we can see that, during the moratorium period, during which the project is not yet operational, the interest payment in case of Floating rate ( as depicted by red line) is very less when compared to the same under fixed rate ( represented by the line blue). And the payment towards interest (if the principal payment is ignored) the amount towards debt obligation is always less in case of floating rate except the initial interest payment. Bond IX Date of Issue: 22nd August, 2000 Intrest Payment: Semi Annually Coupon Rate: 12.25% Loan Amount: Rs. 576.50 Crores Repayment: 3 years Moratorium and 10 equal Instalments Maturity: 22nd August, 2012 Determination of Spread Since the date of issue 22nd August, 2000, the average yield of 3 working days preceding i.e... 16 th, 17th and 18th August, 2000 is computed and the difference between the average and coupon rate is calculated and the difference turned up to be 1.52% or 152 basis points. The computation is as follows: Date Yield-1yr GSec Average yield Coupon rate Spread 18-08-2000 10.751 17-08-2000 10.839 10.730% 12.25% 1.5203300% 16-08-2000 10.599 10.72967 Table 29 Calculation of Spread for PGIX for 1 year GSec as Reference Rate 116
  • 118. Analysis of Fixed and Floating Interest Rates 2010 Computation of Floating Rate Average Yield of 1 years GSec ( 3 days preceding Intrest rate) Intrest Payment Reference Period Average Govt yield Spread Floating rate Fixed rate 22-Feb-01 Feb- 15, 16, 20 9.32% 1.520% 10.8393% 12.25% 22-Aug-01 Aug- 16, 17, 20 7.18% 1.520% 8.7040% 12.25% Feb-02 Feb- 19, 20, 21 6.37% 1.520% 7.8920% 12.25% Aug-02 Aug- 19, 20, 21 6.02% 1.520% 7.5433% 12.25% Feb-03 Feb- 19, 20, 21 5.92% 1.520% 7.4447% 12.25% Aug-03 Aug- 19, 20, 21 4.97% 1.520% 6.4947% 12.25% Feb-04 Feb- 17, 19, 20 4.56% 1.520% 6.0797% 12.25% Aug-04 Aug- 17, 18, 19 5.33% 1.520% 6.8503% 12.25% Feb-05 Feb- 17, 18, 20 5.74% 1.520% 7.2627% 12.25% Aug-05 Aug- 17, 18, 19 5.70% 1.520% 7.2180% 12.25% Feb-06 Feb- 17, 20, 21 6.89% 1.520% 8.4110% 12.25% Aug-06 Aug- 17, 18, 21 6.86% 1.520% 8.3820% 12.25% Feb-07 Feb- 19, 20, 21 7.62% 1.520% 9.1403% 12.25% Aug-07 Aug- 16, 17, 21 7.15% 1.520% 8.6723% 12.25% Feb-08 Feb- 19, 20, 21 7.55% 1.520% 9.0713% 12.25% Aug-08 Aug- 18, 20, 21 9.30% 1.520% 10.8230% 12.25% Feb-09 Feb- 17, 18, 19 4.80% 1.520% 6.3250% 12.25% Aug-09 Aug- 18, 20, 21 4.64% 1.520% 6.1567% 12.25% Feb-10 Feb- 17, 18, 19 5.04% 1.520% 6.5573% 12.25% Table 30 Floating Rates for PGIX for 1 year GSec as Reference Rate Comparison of Interest on Fixed and Floating Rate (Rs Crs.) Intrest Payment-Fixed Intrest Payment-Floating Opening Opening Year Balance Redemption Interest Year Balance Redemption Interest Feb-01 576.5 0 35.3106 Feb-01 576.5 0 31.24437 Aug-01 576.5 0 35.3106 Aug-01 576.5 0 25.08927 Feb-02 576.5 0 35.3106 Feb-02 576.5 0 22.74868 Aug-02 576.5 0 35.3106 Aug-02 576.5 0 21.74365 Feb-03 576.5 0 35.3106 Feb-03 576.5 0 21.45924 Aug-03 576.5 57.65 35.3106 Aug-03 576.5 57.65 18.72087 Feb-04 518.85 0 31.7796 Feb-04 518.85 0 15.77217 Aug-04 518.85 57.65 31.7796 Aug-04 518.85 57.65 17.77147 Feb-05 461.2 0 28.2485 Feb-05 461.2 0 16.7477 Aug-05 461.2 57.65 28.2485 Aug-05 461.2 57.65 16.6447 Feb-06 403.55 0 24.7174 Feb-06 403.55 0 16.97129 Aug-06 403.55 57.65 24.7174 Aug-06 403.55 57.65 16.91277 Feb-07 345.9 0 21.1864 Feb-07 345.9 0 15.8082 Aug-07 345.9 57.65 21.1864 Aug-07 345.9 57.65 14.99879 Feb-08 288.25 0 17.6553 Feb-08 288.25 0 13.07405 Aug-08 288.25 57.65 17.6553 Aug-08 288.25 57.65 15.59864 Feb-09 230.6 0 14.1243 Feb-09 230.6 0 7.292721 Aug-09 230.6 57.65 14.1243 Aug-09 230.6 57.65 7.098633 Feb-10 172.95 0 10.5932 Feb-10 172.95 0 5.670451 497.8798 321.3677 Table 31 Interest under Fixed and Floating Rates for PGIX for 1 year GSec as Reference Rate 117
  • 119. Analysis of Fixed and Floating Interest Rates 2010 IX ( 1 Yr Gsec) 40.0000 35.0000 30.0000 25.0000 20.0000 Intrest Payment-Fixed 15.0000 10.0000 Intrest Payment- Floating 5.0000 0.0000 Aug-03 Apr-05 Aug-08 Feb-01 Dec-01 Feb-06 Dec-06 Oct-02 Jun-04 Oct-07 Jun-09 Figure 49 Interest Payment under Fixed and Floating rates for PGIX for 1 year GSec as Reference Rate In this case the Intrest under floating rate is much lower than the fixed rate. The main reasons are  When this series was issued the market conditions were not favourable.  Due to hike in CRR, the Bank rates and GSec rates hiked up,  Most of the nationalised banks increased their PLR  60% of Annual borrowings by GoI during the current year amounting to approx. Rs.1,20,000 Crores is yet to be raised  All the above mentioned points may bring an upward pressure in GSec rates thus the coupon rate was fixed with the spread of 75 basis points over the prevailing rate of 10 years GSec. The company would have been able to save up to Rs.176, 51, 21,000 (Rs. 1.765 Billion) if it had issued the bond at floating rate. Also the amount towards debt obligation both in case of fixed and floating rate is falling over the period because of equal redemption towards principal. Bond X Date of Issue: 21st June, 2001 Intrest Payment: Annual Coupon Rate: 10.90% Loan Amount: Rs. 761.52 Crores Repayment: 3 years Moratorium and 12 equal Instalments Maturity: 21st June, 2015 118
  • 120. Analysis of Fixed and Floating Interest Rates 2010 Determination of Spread Since the date of issue 21st June, 2001, the average yield of 3 working days preceding i.e... 18th, 19th and 20th June, 2001 is computed and the difference between the average and coupon rate is calculated and the difference turned up to be 2.69% or 269 basis points. The computation is as follows: Date Yield-1yr GSec Average yield Coupon rate Spread 20-06-2001 8.151 19-06-2001 8.20 8.21% 10.90% 2.69% 18-06-2001 8.276 8.209 Table 32 Calculation of Spread for PGX for 1 year GSec as Reference Rate Computation of Floating Rate Average Yield of 1 years GSec ( 3 days preceding Interest rate) Interest Payment Reference Period Average Govt yield Spread Floating rate Fixed rate 21-Jun-02 June 20, 19, 18 6.756% 2.69% 9.447% 10.90% Jun-03 June 20, 19, 18 5.070% 2.69% 7.761% 10.90% 18 Jun-04 June 18, 17, 16 3.994% 2.69% 6.685% 10.90% 1 Jun-05 June 20, 17, 16 5.738% 2.69% 8.429% 10.90% 1 Jun-06 June 20, 19, 16 6.988% 2.69% 9.679% 10.90% Jun-07 June 20, 19, 18 7.863% 2.69% 10.554% 10.90% Jun-08 June 20, 19, 18 8.421% 2.69% 11.112% 10.90% 1 Jun-09 June 19, 18, 17 4.124% 2.69% 6.815% 10.90% Table 33 Floating rates for PGX for 1 year GSec as Reference Rate Comparison of Intrest on Fixed and Floating Rate (Rs Crs.) Interest Payment-Fixed Interest Payment-Floating Opening Opening Year Balance Redemption Interest Year Balance Redemption Interest Jun-02 761.52 0 83.00568 Jun-02 761.52 0 71.93826 Jun-03 761.52 0 83.00568 Jun-03 761.52 0 59.10157 Jun-04 761.52 63.46 83.00568 Jun-04 761.52 63.46 50.90761 Jun-05 698.06 63.46 76.08854 Jun-05 698.06 63.46 58.8418 Jun-06 634.6 63.46 69.1714 Jun-06 634.6 63.46 61.42293 Jun-07 571.14 63.46 62.25426 Jun-07 571.14 63.46 60.27812 Jun-08 507.68 63.46 55.33712 Jun-08 507.68 63.46 56.4134 Jun-09 444.22 63.46 48.41998 Jun-09 444.22 63.46 30.27359 560.2883 449.1773 Table 34 Interest under fixed and floating Rate for PGX for 1 year GSec as Reference Rate 18 Since one of the 3 days preceding the interest payment day was a holiday, the days preceding the holiday has been considered. 119
  • 121. Analysis of Fixed and Floating Interest Rates 2010 X ( 1 Yr Gsec) 90 80 70 60 50 Interest Payment- 40 Fixed 30 Interest Payment- 20 Floating 10 0 Figure 50 Interest Payment under Fixed and Floating Rates for PGX for 1 year GSec as Reference Rate The Bond series was issued during June 2001, which was characterised by favourable market condition. The coupon rate was fixed after considering the spread of 65 to 90 basis points above the GSec of similar maturity. Thus the company was able to issue its bonds at a coupon rate of 10.90%. But if the interest payment is compared with that of Floating rate there is a scope of savings of Rs.111,11,111,000 ( Approx Rs.1.1 Billion) Also if we see the interest rates, there has been a dip in the interest rate under floating rate in the year 2003, 2004 and 2009, leading to a huge gap between both the methods. Bond XIII- Opt II Date of Issue: 31st July, 2002 Intrest Payment: Annually Coupon Rate: 7.85% Loan Amount: Rs. 250.50 Crores Repayment: 1 year Moratorium and 6 equal Instalments Maturity: 31st July, 2008 Determination of Spread Since the date of issue 31st July, 2002, the average yield of 3 working days preceding i.e... 26th, 29th and 30th July, 2000 is computed and the difference between the average and coupon rate is calculated and the difference turned up to be 1.794% or approx 180 basis points. The computation is as follows: 120
  • 122. Analysis of Fixed and Floating Interest Rates 2010 Date Yield-1yr GSec Average yield Coupon rate Spread 30-07-2002 6.087 29-07-2002 6.091 6.056% 7.85% 1.79400% 26-07-2002 5.99 6.05600 Table 35 Calculation of Spread for PGXIII for 1 year GSec as Reference Rate Computation of Floating Rate Average Yield of 1 years GSec ( 3 days preceding Intrest rate) Interest Payment Reference Period Average Govt yield Spread Floating rate Fixed rate 31-Jul-03 Jul- 25, 28, 29 4.8430% 1.7940% 6.6370% 7.85% Jul-04 Jul- 28, 29, 30 4.8477% 1.7940% 6.6417% 7.85% Jul-05 Jul- 25, 26, 29 5.8010% 1.7940% 7.5950% 7.85% Jul-06 Jul- 26, 27, 28 6.9283% 1.7940% 8.7223% 7.85% Jul-07 Jul- 26, 27, 30 6.7923% 1.7940% 8.5863% 7.85% Jul-08 Jul- 28, 29, 30 9.4020% 1.7940% 11.1960% 7.85% Table 36 Floating Rates for PGXIII for 1 year GSec as Reference Rate Comparison of Intrest on Fixed and Floating Rate (Rs Crs.) Interest Payment-Fixed Interest Payment-Floating Opening Opening Year Balance Redemption Interest Year Balance Redemption Interest Jul-03 250.5 41.75 19.66425 Jul-03 250.5 41.75 16.62569 Jul-04 208.75 41.75 16.38688 Jul-04 208.75 41.75 13.86448 Jul-05 167 41.75 13.1095 Jul-05 167 41.75 12.68365 Jul-06 125.25 41.75 9.832125 Jul-06 125.25 41.75 10.92472 Jul-07 83.5 41.75 6.55475 Jul-07 83.5 41.75 7.169588 Jul-08 41.75 41.75 3.277375 Jul-08 41.75 41.75 4.67433 68.82488 65.94246 Table 37 Interest Under Fixed and Floating rates for PGXIII for 1 year GSec as Reference Rate XIII- Opt-II ( 1 Yr Gsec) 25 20 15 Interest Payment- 10 Fixed 5 Interest Payment- Floating 0 Figure 51 Interest Payments under Fixed and Floating Rates for PGXIII for 1 year GSec as Reference Rate 121
  • 123. Analysis of Fixed and Floating Interest Rates 2010 The bond was issued at the coupon rate of 7.85% and is one the lower rates among the all PGCIL Bonds. This is mainly because of its short tenure and also favourable market conditions. Since the bond is issued for a short duration of 6 years and also due to low coupon rate there is a nominal saving of Rs. 2,88,242,000 (Approx Rs. 28 Million). Also since the floating rate is pertaining to a small period, there have been not many fluctuations. Thus the pattern of outflows with respect to interest payment under both the methods viz fixed and floating is almost same. Bond XIV Date of Issue: 17th July, 2003 Intrest Payment: Annually Coupon Rate: 6.10% Loan Amount: Rs. 699 Crores Repayment: 1 year Moratorium and 12 equal Instalments Maturity: 17th July, 2015 Determination of Spread Since the date of issue 17th July, 2003, the average yield of 3 working days preceding i.e... 14th, 15th and 16th July, 2003 is computed and the difference between the average and coupon rate is calculated and the difference turned up to be 5.87% or approx 587 basis points. The computation is as follows: Date Yield-1yr GSec Average yield Coupon rate Spread 16-07-2003 5.028 15-07-2003 5.027 5.0273% 6.10% 1.072700% 14-07-2003 5.027 5.0273 Table 38 Calculation of Spread for PGXIV for 1 year GSec as Reference Rate Computation of Floating Rate Average Yield of 1 years GSec ( 3 days preceding Intrest rate) Interest Payment Reference Period Average Govt yield Spread Floating rate Fixed rate 17-Jul-04 Jul- 14, 15, 16 4.800% 1.073% 5.8724% 6.10% Jul-05 Jul- 13, 14, 15 5.844% 1.073% 6.9170% 6.10% Jul-06 Jul- 14, 13, 12 7.006% 1.073% 8.0790% 6.10% Jul-07 Jul- 16, 13, 12 6.972% 1.073% 8.0450% 6.10% Jul-08 Jul- 14, 15, 16 9.459% 1.073% 10.5317% 6.10% Jul-09 Jul- 14, 15, 16 3.948% 1.073% 5.0210% 6.10% Table 39 Floating Rates for PGXIV for 1 year GSec as Reference Rate 122
  • 124. Analysis of Fixed and Floating Interest Rates 2010 Comparison of Intrest on Fixed and Floating Rate (Rs Crs.) Interest Payment-Fixed Interest Payment-Floating Opening Opening Year Balance Redemption Interest Year Balance Redemption Interest Jul-04 761.52 0 46.45272 Jul-04 761.52 0 44.71925 Jul-05 761.52 0 46.45272 Jul-05 761.52 0 52.67459 Jul-06 761.52 63.46 46.45272 Jul-06 761.52 63.46 61.52345 Jul-07 698.06 63.46 42.58166 Jul-07 698.06 63.46 56.15916 Jul-08 634.6 63.46 38.7106 Jul-08 634.6 63.46 66.83417 Jul-09 571.14 63.46 34.83954 Jul-09 571.14 63.46 28.67713 255.49 310.5878 Table 40 Interests under Fixed and Floating rates for PGXIV for 1 year GSec as Reference Rate XIV (1 yr Gsec) 120 100 80 60 Interest Payment- Floating 40 Interest Payment- 20 Fixed 0 Figure 52 Interest Payments under Fixed and Floating Rate for PGXIV for 1 year GSec as Reference Rate At the time of the issue the yield in Govt Bonds dipped to lows. The interest rates on GSec also fell by around 115 basis points. The yield on the govt Bonds of 10 year maturity fell 5.75% indicating a 45 basis points fall. Thus the company was able to issue the bonds at a very low coupon rate of just 6.10% which is the lowest rate among all the series of bonds issued till date by the Power Grid Corporation of India Limited. Thus in this case it is highly beneficial for the firm to go for fixed rate. The company would have ended up paying excess of amount Rs. 55, 09, 77,000 (Approx 550 million) towards interest rate if it had gone for floating rate. 123
  • 125. Analysis of Fixed and Floating Interest Rates 2010 Floating Rate under Reference Rate of Average yield of 10 year GSec After analysing the costs under the floating rate with reference rate as INBMK 1 Year GSec Yield, the study has been done by taking reference rate as average yield of 10 year GSec for the 12 months. Most of the bonds has the repayment structure of 4 years of Moratorium Period and then followed by 12 annual equal repayment of the principle parts. Thus the average tenure turns up to 9 years. Since there is no GSec of tenure 9 years, 10 years GSec can be taken as benchmark. Intrest payment, floating rate and the total payment under both the cases Fixed and floating for each bond is explained in the following part. Also the reference period is yield of GSec for the 6 months preceding the coupon period for the semi-annual interest payments ( and 12 months for annual interest payments), and the rate will be determined at the beginning of coupon period. Bond VIII Determination of Spread In this case, since the spread was not available for the preceding 6 months of the month of issue, the spread of AAA Bonds over 10 year GSec Bond as published by FIMMDA ( Fixed Income and Monet Market Association) , for the days preceding the opening of offer has been taken as the spread. Though this spread is for the purpose of Fixed Coupon rate, the same spread is considered for the floating rate despite the fact that there is less risk for the investors in case of floating rate as the rate determined is truly reflected by the prevailing market conditions. During the issue of this series, Market expected a cut in CRR and a fall in GSec ate due to the cut in CRR. But the situation reversed and though the CR fell, but the rate on GSec 10 years papers increased. Of the total issue size just 10% was proclaimed. And though the Intrest rates on GSec increased to 10.70%, the coupon rate was fixed at 10.35% Though the spread was negative, the spread of 100 basis point (1%) has been taken as the principle of conservatism. Computation of Floating Rate Average Yield for 10Yrs GSec( 6 Months preceding Coupon period) Intrest Payment Reference Period Average Govt yield Spread Floating rate Fixed rate Oct-00 Oct 99 to Mar 00 11.03% 1.00% 12.026% 10.35% Apr-01 Apr 00 to Sep 00 11.11% 1.00% 12.108% 10.35% Oct-01 Oct 00 to Mar 01 10.78% 1.00% 11.777% 10.35% Apr-02 Apr 01 to Sep 01 9.49% 1.00% 10.493% 10.35% Oct-02 Oct 01 to Mar 02 7.86% 1.00% 8.863% 10.35% Apr-03 Apr 02 to Sep 02 7.37% 1.00% 8.369% 10.35% Oct-03 Oct 02 to Mar 03 6.28% 1.00% 7.280% 10.35% Apr-04 Apr 03 to Sep 03 5.57% 1.00% 6.574% 10.35% Oct-04 Oct 03 to Mar 04 5.17% 1.00% 6.174% 10.35% Apr-05 Apr 04 to Sep 04 5.79% 1.00% 6.793% 10.35% Oct-05 Oct 04 to Mar 05 6.77% 1.00% 7.772% 10.35% Apr-06 Apr 05 to Sep 05 7.07% 1.00% 8.075% 10.35% Oct-06 Oct 05 to Mar 06 7.27% 1.00% 8.268% 10.35% Apr-07 Apr 06 to Sep 06 7.82% 1.00% 8.824% 10.35% Oct-07 Oct 06 to Mar 07 7.73% 1.00% 8.732% 10.35% 124
  • 126. Analysis of Fixed and Floating Interest Rates 2010 Apr-08 Apr 07 to Sep 07 8.03% 1.00% 9.029% 10.35% Oct-08 Oct 07 to Mar 08 7.75% 1.00% 8.746% 10.35% Apr-09 Apr 08 to Sep 08 8.57% 1.00% 9.574% 10.35% Oct-09 Oct 08 to Mar 09 6.57% 1.00% 7.567% 10.35% Apr-10 Apr 09 to Sep 09 6.90% 1.00% 7.901% 10.35% Oct-10 Oct 09 to Mar 10 7.57% 1.00% 8.571% 10.35% Table 41 Floating Rates for PGVIII for 10 Year GSec Comparison of Intrest on Fixed and Floating Rate (Rs Crs.) Intrest Payment-Fixed Intrest Payment-Floating Opening Opening Year Balance Redemption Interest Year Balance Redemption Interest Oct-00 20 0 1.035 Oct-00 20 0 1.2026 Apr-01 20 0 1.035 Apr-01 20 0 1.210817 Oct-01 20 0 1.035 Oct-01 20 0 1.177733 Apr-02 20 0 1.035 Apr-02 20 0 1.049267 Oct-02 20 0 1.035 Oct-02 20 0 0.886317 Apr-03 20 0 1.035 Apr-03 20 0 0.83685 Oct-03 20 0 1.035 Oct-03 20 0 0.728 Apr-04 20 0 1.035 Apr-04 20 0 0.6574 Oct-04 20 0 1.035 Oct-04 20 0 0.617417 Apr-05 20 2 1.035 Apr-05 20 2 0.679317 Oct-05 18 0 0.9315 Oct-05 18 0 0.69948 Apr-06 18 2 0.9315 Apr-06 18 2 0.726705 Oct-06 16 0 0.828 Oct-06 16 0 0.661467 Apr-07 16 2 0.828 Apr-07 16 2 0.70588 Oct-07 14 0 0.7245 Oct-07 14 0 0.611205 Apr-08 14 2 0.7245 Apr-08 14 2 0.631995 Oct-08 12 0 0.621 Oct-08 12 0 0.52477 Apr-09 12 2 0.621 Apr-09 12 2 0.57446 Oct-09 10 0 0.5175 Oct-09 10 0 0.378325 Apr-10 10 2 0.5175 Apr-10 10 2 0.395067 Oct-10 8 0 0.414 Oct-10 8 0 0.34282 18.009 15.29789 Table 42 Interests under Fixed and Floating for PGVIII for 10 Year GSec Bond IX Determination of Spread In this case, the spread is calculated as the average spread for the 6 months preceding the issue month for AAA Bonds for 10 years Duration as published by FIMMDA. The Spread turns up at 0.75% or 75 basis points. The computation is as follows: Avg Spread for AAA Bonds for 10 Years Jul-00 74 Jun-00 77 May-00 72 Apr-00 80 125
  • 127. Analysis of Fixed and Floating Interest Rates 2010 Mar-00 70 Feb-00 75 Avg. 74.66667 19 Table 43 Calculation of Spread for PGX for 10 year GSec as Reference Rate Computation of Floating Rate Average Yield for 10Yrs GSec( 6 Months preceding Coupon period) Intrest Payment Reference Period Average Govt yield Spread Floating rate Fixed rate Feb-01 Feb-00 to Jul-00 10.79% 0.75% 11.5442% 12.25% Aug-01 Aug-00 to Jan-01 11.22% 0.75% 11.9663% 12.25% Feb-02 Feb-01 to Jul-01 9.86% 0.75% 10.6057% 12.25% Aug-02 Aug-01 to Jan-02 8.41% 0.75% 9.1612% 12.25% Feb-03 Feb-02 to Jul-02 7.47% 0.75% 8.2233% 12.25% Aug-03 Aug-02 to Jan-03 6.66% 0.75% 7.4127% 12.25% Feb-04 Feb-03 to Jul-03 5.84% 0.75% 6.5890% 12.25% Aug-04 Aug-03 to Jan-04 5.18% 0.75% 5.9262% 12.25% Feb-05 Feb-04 to Jul-04 5.47% 0.75% 6.2200% 12.25% Aug-05 Aug-04 to Jan-05 6.63% 0.75% 7.3803% 12.25% Feb-06 Feb-05 to Jul-05 6.91% 0.75% 7.6580% 12.25% Aug-06 Aug-05 to Jan-06 7.15% 0.75% 7.8960% 12.25% Feb-07 Feb-06 to Jul-06 7.73% 0.75% 8.4753% 12.25% Aug-07 Aug-06 to Jan-07 7.66% 0.75% 8.4125% 12.25% Feb-08 Feb-07 to Jul-07 8.04% 0.75% 8.7875% 12.25% Aug-08 Aug-07 to Jan-08 7.83% 0.75% 8.5817% 12.25% Feb-09 Feb-08 to Jul-08 8.24% 0.75% 8.9945% 12.25% Aug-09 Aug-08 to Jan-09 7.23% 0.75% 7.9823% 12.25% Feb-10 Feb-09 to Jul-09 6.72% 0.75% 7.4667% 12.25% Aug-10 Aug-09 to Jan-10 7.37% 0.75% 8.1248% 12.25% Table 44 Floating Rates for PGIX for 10 year GSec as Reference Rate Since the spread is very low because of Heavy borrowing by Government, the floating rate is very low and is always less than the fixed interest rate. Comparison of Intrest on Fixed and Floating Rate (Rs Crs.) Intrest Payment-Fixed Intrest Payment-Floating Opening Opening Year Balance Redemption Interest Year Balance Redemption Interest Feb-01 576.5 0 35.31063 Feb-01 576.5 0 33.27606 Aug-01 576.5 0 35.31063 Aug-01 576.5 0 34.49296 Feb-02 576.5 0 35.31063 Feb-02 576.5 0 30.57083 Aug-02 576.5 0 35.31063 Aug-02 576.5 0 26.40706 Feb-03 576.5 0 35.31063 Feb-03 576.5 0 23.70376 Aug-03 576.5 57.65 35.31063 Aug-03 576.5 57.65 21.36701 Feb-04 518.85 0 31.77956 Feb-04 518.85 0 17.09351 19 Source: www.fimmda.org 126
  • 128. Analysis of Fixed and Floating Interest Rates 2010 Aug-04 518.85 57.65 31.77956 Aug-04 518.85 57.65 15.37396 Feb-05 461.2 0 28.2485 Feb-05 461.2 0 14.34332 Aug-05 461.2 57.65 28.2485 Aug-05 461.2 57.65 17.01905 Feb-06 403.55 0 24.71744 Feb-06 403.55 0 15.45193 Aug-06 403.55 57.65 24.71744 Aug-06 403.55 57.65 15.93215 Feb-07 345.9 0 21.18638 Feb-07 345.9 0 14.65809 Aug-07 345.9 57.65 21.18638 Aug-07 345.9 57.65 14.54942 Feb-08 288.25 0 17.65531 Feb-08 288.25 0 12.66498 Aug-08 288.25 57.65 17.65531 Aug-08 288.25 57.65 12.36833 Feb-09 230.6 0 14.12425 Feb-09 230.6 0 10.37066 Aug-09 230.6 57.65 14.12425 Aug-09 230.6 57.65 9.20363 Feb-10 172.95 0 10.59319 Feb-10 172.95 0 6.4568 Aug-10 172.95 57.65 10.59319 Aug-10 172.95 57.65 7.02595 508.473 352.3295 Table 45 Interests under Fixed and Floating for PGIX for 10 Year GSec IX ( 10 Yrs Gsec) 40 35 30 25 20 Intrest Payment-Fixed 15 10 Intrest Payment- 5 Floating 0 May-03 May-06 May-09 Feb-01 Nov-01 Aug-02 Feb-04 Nov-04 Aug-05 Feb-07 Nov-07 Aug-08 Feb-10 Figure 53 Interest Payments under Fixed and Floating Rate for PGIX for 10 year GSec as Reference Rate Bond X Computation of Spread Avg Spread for AAA Bonds for 10 Years May-01 110 Apr-01 100 Mar-01 78 Feb-01 106 Jan-01 111 Dec-00 104 Avg. 101.5 Source: www.fimmda.org 127
  • 129. Analysis of Fixed and Floating Interest Rates 2010 Computation of Floating Rate Average Yield for 10Yrs GSec( 12 Months preceding Coupon period) Interest Payment Reference Period Average Govt yield Spread Floating rate Fixed rate Jun-02 Jun 00 - May 01 7.82% 1.015% 8.84% 10.90% Jun-03 Jun 01 - May 02 7.13% 1.015% 8.15% 10.90% Jun-04 Jun 02 - May 03 6.61% 1.015% 7.62% 10.90% Jun-05 Jun 03 - May 04 5.37% 1.015% 6.38% 10.90% Jun-06 Jun 04 - May 05 6.59% 1.015% 7.61% 10.90% Jun-07 Jun 05 - May 06 8.17% 1.015% 9.19% 10.90% Jun-08 Jun 06 - May 07 10.63% 1.015% 11.65% 10.90% Jun-09 Jun 07 - May 08 10.77% 1.015% 11.79% 10.90% Jun-10 Jun 08 - May 09 12.13% 1.015% 13.15% 10.90% Comparison of Intrest on Fixed and Floating Rate (Rs Crs.) Interest Payment-Fixed Interest Payment-Floating Opening Opening Year Balance Redemption Interest Year Balance Redemption Interest Jun-02 761.52 0 83.00568 Jun-02 761.52 0 67.30631 Jun-03 761.52 0 83.00568 Jun-03 761.52 0 62.0569 Jun-04 761.52 63.46 83.00568 Jun-04 761.52 63.46 58.05955 Jun-05 698.06 63.46 76.08854 Jun-05 698.06 63.46 44.54903 Jun-06 634.6 63.46 69.1714 Jun-06 634.6 63.46 48.27085 Jun-07 571.14 63.46 62.25426 Jun-07 571.14 63.46 52.46397 Jun-08 507.68 63.46 55.33712 Jun-08 507.68 63.46 59.12484 Jun-09 444.22 63.46 48.41998 Jun-09 444.22 63.46 52.35725 Jun-10 380.76 63.46 41.50284 Jun-10 380.76 63.46 50.05883 601.7912 494.2475 X ( 10 yr Gsec ) 90 80 70 60 50 Interest Payment- 40 Fixed 30 Interest Payment- 20 Floating 10 0 128
  • 130. Analysis of Fixed and Floating Interest Rates 2010 Bond XIII- Opt-II Computation of Spread Avg Spread for AAA Bonds for 10 Years Jun-02 138 May-02 127 Apr-02 173 Mar-02 200 Feb-02 198 Jan-02 159 Avg. 165.8333 Source: www.fimmda.org Computation of Floating Rate Average Yield for 10Yrs GSec( 12 Months preceding Coupon period) Interest Reference Payment Period Average Govt yield Spread Floating rate Fixed rate Jul-03 Jul 01 - Jun 02 8.11% 1.658% 9.77% 7.85% Jul-04 Jul 02 - Jun 03 6.39% 1.658% 8.05% 7.85% Jul-05 Jul 03 - Jun 04 5.28% 1.658% 6.94% 7.85% Jul-06 Jul 04 - Jun 05 6.70% 1.658% 8.36% 7.85% Jul-07 Jul 05 - Jun 06 7.33% 1.658% 8.99% 7.85% Jul-08 Jul 06 - Jun 07 7.88% 1.658% 9.54% 7.85% Comparison of Intrest on Fixed and Floating Rate (Rs Crs.) Interest Payment-Fixed Interest Payment-Floating Opening Opening Year Balance Redemption Interest Year Balance Redemption Interest Jul-03 250.5 41.75 19.66425 Jul-03 250.5 41.75 24.47293 Jul-04 208.75 41.75 16.38688 Jul-04 208.75 41.75 16.80431 Jul-05 167 41.75 13.1095 Jul-05 167 41.75 11.5839 Jul-06 125.25 41.75 9.832125 Jul-06 125.25 41.75 10.46606 Jul-07 83.5 41.75 6.55475 Jul-07 83.5 41.75 7.508501 Jul-08 41.75 41.75 3.277375 Jul-08 41.75 41.75 3.983458 68.82488 74.81915 129
  • 131. Analysis of Fixed and Floating Interest Rates 2010 XIII-Opt II ( 10 Yr Gsec) 30 25 20 Interest Payment- 15 Fixed 10 Interest Payment- Floating 5 0 Jan-03 Jan-04 Jan-05 Jan-06 Jan-07 Jan-08 Bond XIV Computation of Spread Avg Spread for AAA Bonds for 10 Years Jun-03 50 May-03 50 Apr-03 50 Mar-03 76 Feb-03 86 Jan-03 77 Avg. 64.83333 Source: www.fimmda.org Computation of Floating Rate Average Yield for 10Yrs GSec( 12 Months preceding Coupon period) Interest Reference Floating Fixed Payment Period Average Govt yield Spread rate rate Jul-04 Jul 02 - Jun 03 6.39% 0.648% 7.04% 6.10% Jul-05 Jul 03 - Jun 04 5.28% 0.648% 5.93% 6.10% Jul-06 Jul 04 - Jun 05 6.70% 0.648% 7.35% 6.10% Jul-07 Jul 05 - Jun 06 7.33% 0.648% 7.98% 6.10% Jul-08 Jul 06 - Jun 07 7.88% 0.648% 8.53% 6.10% Jul-09 Jul 07 - Jun 08 7.91% 0.648% 8.56% 6.10% Jul-10 Jul 08 - Jun 09 7.17% 0.648% 7.82% 6.10% 130
  • 132. Analysis of Fixed and Floating Interest Rates 2010 Comparison of Intrest on Fixed and Floating Rate (Rs Crs.) Interest Payment-Fixed Interest Payment-Floating Opening Opening Year Balance Redemption Interest Year Balance Redemption Interest Jul-04 761.52 0 46.45272 Jul-04 761.52 0 53.61075 Jul-05 761.52 0 46.45272 Jul-05 761.52 0 45.13123 Jul-06 761.52 63.46 46.45272 Jul-06 761.52 63.46 55.94227 Jul-07 698.06 63.46 42.58166 Jul-07 698.06 63.46 55.72066 Jul-08 634.6 63.46 38.7106 Jul-08 634.6 63.46 54.1391 Jul-09 571.14 63.46 34.83954 Jul-09 571.14 63.46 48.90415 Jul-10 507.68 63.46 30.96848 Jul-10 507.68 63.46 39.69068 286.4584 353.1388 XIV (10 Yr Gsec) 60 50 40 30 Interest Payment- Fixed 20 Interest Payment- 10 Floating 0 131
  • 133. Analysis of Fixed and Floating Interest Rates 2010 Floating Rate under Reference Rate of Average yield of 10 year GSec In the previous section, the reference period was taken a 6/12 months preceding the coupon period. But the interest payment in case of reference period of 6/12 months preceding the interest payment has also been calculated and analysed. The spread has determined by the same method as used in the previous section ( i.e. average spread of 6 months preceding the month of issue) as published by FIMMDA. The computation has been added to the online appendix. And the summary of total interest in each method is as follows: Average Yield for 10Yrs GSec( Preceding Interest Payment) (Rs. Crs) Bond Maturity Interest paid till Spread Under Under Fixed Floating VIII 14 Apr-10 1.000% 17.595 14.59242333 IX 12 Feb-10 0.750% 497.8798 334.674 X 14 Jun-09 1.015% 560.2883 464.861 XIII-Opt-II 6 Jul-08 1.658% 68.8249 71.826 XIV 12 Jul-09 0.648% 255.49 320.4026 Table 46 Total Intrest Under Fixed and Floating Rates for All Bonds under 10 Year GSec as Base Rate And the Intrest trends of each Bond are as follows: VIII ( 10 Yrs Gsec)* 1.4 1.2 1 0.8 Intrest Payment-Fixed 0.6 0.4 Intrest Payment- 0.2 Floating 0 Aug-01 Apr-03 Aug-06 Apr-08 Feb-04 Feb-09 Dec-04 Dec-09 Oct-00 Jun-02 Oct-05 Jun-07 132
  • 134. Analysis of Fixed and Floating Interest Rates 2010 IX ( 10 Yrs Gsec)* 40 35 30 25 20 Intrest Payment-Fixed 15 10 Intrest Payment- 5 Floating 0 May-09 May-03 Nov-04 May-06 Nov-01 Aug-02 Aug-05 Nov-07 Aug-08 Feb-01 Feb-04 Feb-07 Feb-10 X ( 10 Yr Gsec)* 90 80 70 60 50 Interest Payment- 40 Fixed 30 Interest Payment- 20 Floating 10 0 XIII- Opt II (10 yr Gsec)* 25 20 15 Interest Payment- Fixed 10 Interest Payment- Floating 5 0 Jan-03 Jan-04 Jan-05 Jan-06 Jan-07 Jan-08 133
  • 135. Analysis of Fixed and Floating Interest Rates 2010 XIV (10Yrs Gsec)* 70 60 50 40 Interest Payment- Fixed 30 Interest Payment- 20 Floating 10 0 Jan-04 Jan-05 Jan-06 Jan-07 Jan-08 Jan-09 Figure 54 Intrest Payments Under Fixed and Floating Rates for All Bonds for 10 year GSec as Base Rate 134
  • 136. Analysis of Fixed and Floating Interest Rates 2010 Floating Rate under Reference Rate of Average yield of 10 year GSec- Average Spread of last 12 months Alternate study of interest cost by taking different spread has also been done. In the previous case, where average spread of previous 6 months preceding the issue month was considered. But since the reference rate is calculated by taking the average yield of 10 yr GSec for preceding 12 months, the spread also need to be taken for the period of 12 months. Among the 5 issues selected namely, VIII, IX, X, XIII-Opt-II and XIV, the Intrest on the Issue Series VIII is paid half yearly, thus spread for 12 months need not be calculated. And for Series IX and X, due to unavailability of data, the spread has not been computed for 12 months preceding the issue month. Thus for issue Series XIII-Opt II and XIV, the spread as published by FIMMDA for AAA rated PSU Bonds with reference to 10 year GSec paper for the 12 months preceding the issue month has been considered. The costs under each case (fixed and floating) is summarised in the table. Summary of Each Base Rate The total interest payment till date under both fixed and floating rate for the selected 5 issues has been summarised in the following table. Average Yield for 10Yrs GSec( Preceding Interest Payment) (Rs. Crs) Interest paid Under Under Bond Maturity till Spread Fixed Floating Savings VIII 14 Apr-10 1.00% 18.009 15.29789 2.71111 IX 12 Feb-10 0.75% 497.8798 334.674 163.2059 X 14 Jun-09 1.015% 560.2883 464.8609 95.42745 1.658% 68.82488 71.82599 -3.00112 XIII-Opt-II 6 Jul-08 20 1.507% 68.82488 73.49 -4.66512 0.648% 255.49 320.3901 -64.9001 XIV 12 Jul-09 2 0.711% 255.49 323.0287 -67.5387 Table 47 Summary of Costs under 1 Year GSec as Base Rate Average Yield for 10Yrs GSec( Preceding Coupon period) (Rs. Crs) Interest paid Under Under Bond Maturity till Spread Fixed Floating Savings VIII 14 Apr-10 1.00% 17.59500 14.59242 3.002577 IX 12 Aug-10 0.75% 508.473 352.3925 156.0805 X 14 Jun-10 1.015% 601.7912 494.247 107.5442 1.658% 68.82488 74.81652 -5.99164 XIII-Opt-II 6 Jul-08 2 1.507% 68.82488 70.4959 -1.67103 0.648% 286.4584 353.1248 -66.6663 XIV 12 Jul-10 2 0.711% 286.4584 356.0833 -69.6249 Table 48 Summary of Costs under 10 Year GSec as Base Rate ( Coupon Period) 20 Spread is determined taking previous 12 months’ average of Spread as published by FIMMDA 135
  • 137. Analysis of Fixed and Floating Interest Rates 2010 Average Yield of 1 years GSec ( 3 days preceding Intrest rate) (Rs. Crs) Interest paid Under Under Bond Maturity till Spread Fixed Floating Savings VIII 14 Apr-10 1.04% 17.585 12.57485 5.01015 IX 12 Feb-10 1.52% 497.8798 321.3677 176.5121 X 14 Jun-09 2.690% 560.2883 449.1773 111.111 XIII- Opt-II 6 Jul-08 1.794% 68.82488 65.9424 2.882475 XIV 12 Jul-09 1.073% 255.49 310.5878 -55.0978 Table 49 Summary of Costs under 10 Year GSec as Base Rate ( Interest Payment Period) 136
  • 138. Analysis of Fixed and Floating Interest Rates 2010 Factors Effecting the Selection of Each Method From the above computation and comparison of Intrest payments under all the three benchmarks rates with different spreads for different kinds of bonds differing with each other on the basis of coupon rate, the quantum of loan and also the duration (Maturity). Some of the analysis that can be made is: The selection of different mechanism of paying interest Viz Fixed or Floating rate is influenced by some of the following factors. Term Term implies the tenure of the bond. It is the maturity of the bond, after which the whole principal is redeemed. For the bonds having short term maturity, the fixed coupon rate is suitable. This can be validated from the above summary of results, where Bond XII-Opt II, which has the tenure of 6 years, has interest payments under fixed coupon rate lower than that of payment under floating rate. The rationale behind the floating rate is, the fluctuations, both short terms as well as long term are normalised over the life of the bond. Thus in case of longer maturities, the fluctuations, both ups and downs, are covered, thus on an average the payments under floating rate is normalised. But in case of short duration bonds the floating rate may be either very low or very high based on the period it belongs to. PG XIII- 1Year Gsec PG XIII- 10Year Gsec 12.00% 12.00% 10.00% 10.00% 8.00% 8.00% 6.00% 6.00% 4.00% 4.00% 2.00% 2.00% 0.00% 0.00% 1 Year Gsec + Spread PGXIII 10 Year Gsec + Spread PGXIII In the above chart, depicting the floating and fixed rate for the Bond Series XIII which has the tenure of 6 Years, it can be seen that though the interest rate in case of floating rate was less than that of fixed in the initial years, . In this case, since the tenure of short term, the fluctuations of both Ups and downs are not covered within the period. Coupon Rate Coupon rate is the interest rate attached to the bond. The coupon rate exists only in case of fixed Intrest rate. Under floating rate, since the interest rate is reset after every period, thus a fixed 137
  • 139. Analysis of Fixed and Floating Interest Rates 2010 coupon rate cannot be determined. The coupon rate is one of the important factors that affect the decision of selecting fixed under floating rate. In case, if the company is able to issue at a lower coupon rate, it will be beneficial for the company to go for fixed rate. This is because, no matter whatever are the market conditions, in the future, the company will be needed to pay the low pre-determined rate. To explain, if we consider the Series XIV, which is issued at a coupon rate of 6.10%, the Floating rate turns up to be unfavourable. From the following chart, it can be seen that the security is issued when the Bond is issued just before the GSec rate was at its lowest. Thus the floating rate exceeds the fixed rate for the subsequent years. Thus when the GSec yield is at its lowest, it is preferable to go for fixed coupon rate. XIV- 1 Yr Gsec XIV- 10 Year Gsec 12.000% 12.00% 10.000% 10.00% 8.000% 8.00% 6.000% 6.00% 4.000% 4.00% 2.000% 2.00% 0.000% 0.00% 1Yr Gsec + Spread XIV 10 Yr Gsec + Spread XIV Market Condition But since the coupon rate is determined based on the market conditions at the time of the issue, the prevailing GSec rate and the spread, thus the market conditions during the time of issue is also an important factor to consider. If the market conditions are favourable, characterised, with adequate liquidity, low interest rates etc... The prevailing GSec rats will be low and also the spread will be low resulting in low coupon rate. And the benefit of this favourable condition can be enjoyed throughout the tenure of the bond. But in case if the market conditions are not favourable, downturn in the economy, high borrowings by the government, unfavourable policies by the RBI, would lead to high coupon rate. And though this unfavourable condition lasts just for a month or a year, but the effect of the same shall be beard over the long term. Also the spread is determined based on the prevailing market conditions, and under both the cases i.e... Fixed and floating the spread is kept fixed. But under floating rate, the reference rate keeps on adjusting and thus there shall be benefits of savings. 138
  • 140. Analysis of Fixed and Floating Interest Rates 2010 For instance, in case of IX issue, when this series was issued the market conditions were not favourable. Some of the events affecting the interest rates were  Due to hike in CRR, the Bank rates and GSec rates hiked up,  Most of the nationalised banks increased their PLR  60% of Annual borrowings by GoI during the current year amounting to approx. Rs.1,20,000 Crores is yet to be raised  All the above mentioned points may bring an upward pressure in GSec rates thus the coupon rate was fixed with the spread of 75 basis points over the prevailing rate of 10 years GSec. Thus, the rate determined was at 12.25%. And in this case, if the company had issued floating rate, the effect of unfavourable conditions had to be suffered only for a year or so, and there would have been savings under the floating rate. XII Issue 14.0000% 12.0000% 10.0000% 8.0000% 6.0000% Gsec+Spread 4.0000% XII 2.0000% 0.0000% 2001 2004 2000 2002 2003 2005 2006 2007 2008 2009 Figure 55 Comparison of Fixed and Floating in case of Adverse Market conditions From the graph, it can be commented that, floating rate is beneficial in case when market conditions are not favourable. From the date of issue to the last interest payment date, the floating rate is lower than the fixed coupon rate. Quantum of Loan The quantum of loan is also a component to be considered. For a loan of small amount, no matter whatever be the coupon rate and whatever be the tenure, there will be very less losses or gains in case of going to floating rate. Thus the company can be indifferent between fixed or floating rate. Thus, in case of Bond series VIII, the loan amount of Rs20 Crores at the coupon rate of 10.35%, very low saving of Rs.2 crores or Rs.5 crores depending upon different base rates can be seen, under the floating rate. Repayment Structure Repayment structure determines the schedule of repayment of the principal and payment of interest. Almost all the bonds of Power Grid Corporation of India Limited has initial moratorium 139
  • 141. Analysis of Fixed and Floating Interest Rates 2010 period followed by equal annual instalments for the principal payment. Thus the interest is paid for the whole amount initially and then the payment is done on the outstanding balance which keeps on reducing over the years. Thus in case of floating rate, if the market conditions are favourable at the time of issue and becomes adverse at the end, the company will get benefitted, as a low interest is paid on whole amount and a higher interest is paid on the less amount. But in case of a reverse condition, i.e... Market conditions being unfavourable at the initial years and then followed by the favourable scenario, the fixed coupon rate is advisable. Time of Issue The timing of issue is very crucial for deciding the method of interest rate. The scenario of market widely differs within a period of a month or so. If a month has scheduled government borrowings, any awaited policy announcements, liquidity conditions etc..., the interest rates on GSec will be high leading to the high coupon rate. 140
  • 142. Analysis of Fixed and Floating Interest Rates 2010 Chapter VI Findings and Recommendations  Critical Analysis of Alternatives  Recommendations 141
  • 143. Analysis of Fixed and Floating Interest Rates 2010 Critical Analysis of Alternatives Based on the above discussed calculations and their analysis, some of the alternatives for the purpose of issuing bonds are as follows: Fixed Coupon Interest Rate The company can go for the fixed coupon rate for some of its bonds based on the market conditions and the suitability of the rate. In this case the coupon rate fixed by the process of book-bidding will remain constant for throughout the life of the bond. The company can take benefits of the favourable market conditions at the time of the issue for the whole life of the bond. But there is also a risk attached to it, as it is highly skewed towards the market condition and the prevailing interest rates at the time of the issue, and the company may need to suffer if the market conditions are not favourable. Some of the merits of this mechanism are:  Since the interest rate is fixed at the time of issue, the company can easily forecast the interest obligations for the future and budget the same.  The zero variation in the income in way of interest attracts the client base belonging to Fixed Income group. In India majority of investors is comprised of Retirement funds like Provident Fund, Pension Plan, Superannuation funds etc. Thus this kind of plan can assure maximum acceptance.  This kind of mechanism is very beneficial, if the conditions of the market are favourable and are characterised with low interest rates. Thus the coupon rate fixed at the time of issue which remain fixed shall lead to lot of savings.  This is suitable for a company which is very conservative. Some of the Cons attached to this type of method are:  The company cannot take the advantage of fluctuations in the interest rates due to the shift in economic conditions and other favourable events.  The coupon rate determined at the time of issue does not reflect the market conditions of the subsequent years.  If the issue comes out at a period when the market conditions are adverse, the coupon rate determined will be very high because of high interest rates as well as high spreads. And the rate determined will remain constant for the whole tenure leading to heavy costs. Floating Rate As against the case of fixed Coupon rate where the interest rate is determined at the time of issue and is kept fixed, in case of Floating Interest Rate, the interest rate does not remain constant and is reset after every predetermined reset period. In this case the interest paid for the period is truly represented by the market conditions and the prevailing interest rates for that period. But there is risk of fluctuation of interest rates and these may be very low or very high. Thus this method can be used for few bonds based on the market situation, tenure of the bond and also the quantum of the loan. 142
  • 144. Analysis of Fixed and Floating Interest Rates 2010 The rate is determined based on the reference rate. And this reference rate can be yield on a Treasury bill, Yield on 1 year GSec paper, or 10 year GSec paper, or even Bank rates like MIBOR. The selection of either of the reference rates depend on the kind of security, its maturity, its features in terms of risk, raying etc. And also the decision is on the discretion of the issuer and the advice of merchant bankers. Some of the points in support of Floating rate are:  The company can take advantage of Intrest rate fluctuations, and pay the interest as per the prevailing interest rates in the economy.  In case if the market conditions are not favourable at the time of issue, the interest paid on the security for the subsequent years will not be much influenced by the market conditions of the issue period.  For the investor, this kind of securities are attractive and preferable by them, since the returns on the security are truly represented by the market conditions and are similar to the opportunity cost21 of the investment.  Since the interest paid for any period is truly represented by that period’s condition and also since the trading is allowed in the bonds, an investor can hold the security for short term and need not hold it till the maturity. Some of the points against this method are:  This method is characterised with fluctuations in Income for the investors, thus it may be less attractive for the Fixed and Regular Income class of the investors (Viz Retirement benefit Funds).  Also, since the interest payments for the future cannot be forecasted, the budgeting of funds cannot be done effectively. But this can be solved by maintain a provision account for some fixed coupon rate or as some margin added to the past floating rate on the outstanding balance.  For the companies which are very conservative and least prefers the variations in the expenses, this method is least attractive.  The benefit of favourable conditions at the time of issue vanishes in this method.  Though the interest rates are truly represented by the prevailing market conditions, but the spread is determined based on the prevailing spread at the time of issue. Thus there is some influence of market conditions at the time of issue. 21 The returns which he would have received in case of investing in any alternate avenues. 143
  • 145. Analysis of Fixed and Floating Interest Rates 2010 Fixed Coupon Rate with Option As mentioned before, one of the demerits of fixed coupon rate is, in case of high interest rates at the time of issue, the same coupon rate is paid for throughout the tenure even though the market has become favourable. This can be avoided if the bonds are issued with an option attached to it. The option is the Option for the option holder to execute his option of Buy or sell, and the other party is under obligation to fulfil the option. In this case the option holder has the option but he is not under obligation to exercise his option. The Option can be compared with the person holding the Ticket to a cinema. In this case the ticket holder has the right to watch the movie if he wishes to and the Theatre management cannot deny him from his right and is under obligation to show him the cinema. But also the Ticket holder is not at all under the obligation of watching the movie and the management cannot force him to watch the movie. The company can issue the Bonds with the Call Option with the company or Put option with the investor. The Call option implies that the Option holder has the right to buy the security in a predetermined period and at a predetermined price. And the other party is under obligation to sell them whenever the Call option is exercised. And the Put option implies that the Option holder has the right to sell the security at a predetermined price after a predetermined period. But he is not under obligation to exercise the right. But the other party is under obligation to buy the security in case if the holder exercises the Option. The Company can also attach the Option with the Bonds. If the company is expecting a fall in interest rates after a period of five years, or in case if the current interest rates are very high but the raising of loan cannot be postponed, in this case the Bonds can be issued with a Call Option with the company to buy the Bonds after a predetermined period. In case if the interest rates fall after the predetermined Hold-In period, the Company can call for the bonds and repay the bondholders and then can raise the fresh bonds at a low coupon rate. Some of the Merits attached to it are:  Apart from the merits in case of fixed coupon rate, the coupon rate if is set at a very high rate due to unfavourable market conditions, the company can redeem the bonds of high coupon rate and can swap the amount with a low coupon rate bonds by issuing the fresh bonds.  Also, since the Investors do not have the Put Option the uncertainty of Disbursements in case of sudden selling of bonds by investors is avoided. But since the put option is not provided to the investors, in case of rise in the interest rates than the coupon rate, the investor do not has the option of selling these bonds to the company and re-invest the funds in a better avenue. This makes the instrument less attractive. 144
  • 146. Analysis of Fixed and Floating Interest Rates 2010 Recommendation After comparing the interest costs under Fixed and Floating Rates for a array of bonds having different characteristics like  Meagre loan Amount  Half Yearly Intrest Payment  Longer Maturity of 14 years  Shorter Maturity of 6 years  Low coupon rate Though the behaviour and pattern of the yields of GSec papers are very fluctuation and do not follow a fixed pattern, very accurate recommendations could not be given. But based on the trend of last 10 years GSec yield trend, some of the recommendations that can be made on the suitability of each kind bond are:  The company can go for Fixed Intrest rate if the market conditions are favourable at the time of issue.  Also for the meagre loan amount, the company can be indifferent between the Fixed and the Floating rate.  If the bonds are issued for a very short term period, the behaviour of the GSec yield will influence the decision. If the issue is made at the period when the yield is high, the floating rate will be suitable because the yield curve would fall for the subsequent years and only the fall will be covered within the tenure because of short term maturity bond.  But in case if the curve is already at its low, fixed rate must be preferred for the short tenure bonds, because in case of floating rate, only the rise will be covered.  For a longer maturity bond, Fixed interest is to be preferred if the yield curve of the GSec is at its low, and the floating is to be preferred if the yield curve is at its high.  The method of interest determination is not affected by the frequency of interest payment. Be it half yearly or annually.  In case of recession, the yield of GSec, the interest rates are low; the investors become prudent and prioritise the security to the returns. Thus at such conditions, fixed coupon rate can be issued as the company will be able to attract investment at low coupon rate.  Also since as per CERC Guidelines, for the purpose of Tariff determination, the company shall provide the interest expenses, if the company goes for the floating rate, the interest payments will vary every year, thus a provision account can be maintained.  The company can also issue the Call Option Embedded Bonds if the market conditions are not favourable at the time of issue.  The Intrest rates on GSec paper and the Yield curve is affected by some of the economic events like announcement of budget, announcement of monetary policy by RBI etc... Thus in case of fixed coupon rates, the timing of the issue must be planned and thus the advantage of favourable market condition can be taken. 145
  • 147. Analysis of Fixed and Floating Interest Rates 2010 References Bond & Money Markets: Strategy, Trading, Analysis, First South Asian Edition, Moorad Choudhry Bond Markets, Analysis, and Strategies, Fifth Edition, Frank J. Fabozzi CORPORATE CREDIT RATINGS A Note on Methodology- by ICRA Financial Data from Company’s Annual report- 2008-09 http://en.wikipedia.org/wiki/Reverse_Greenshoe Visited on 11th April http://www.equitymaster.com/detail.asp?date=9/6/2003&story=2 Visited on 3rd April http://www.equitymaster.com/research-it/sector-info/power/ Visited on 3rd April http://www.investopedia.com/terms/g/greenshoe.asp Visited on 11th April http://www.jagoinvestor.com/2010/03/floating-rate-mutual-funds-%E2%80%93-how-when-and- why.html visited on 26th April, 2010 http://www.linkedin.com/answers/finance-accounting/corporate-debt/FIN_CDT/327845-24854458 Visited on 7th April http://www.powermin.nic.in/indian_electricity_scenario/introduction.htm Visited on 3rd April http://www.sundarandco.com/sebi03.htm Visited on 11th April http://www.youtube.com/watch?v=NV0S8pKvje8&feature=related Visited on 14th April http://www.youtube.com/watch?v=tJLR3se4Pa4 Visited on 14th April Offer Document of Power Grid Corporation of India Limited’s Bond series XII, IX, XXIX and XXXI. Offer Documents of FRBs of ICICI Limited, Power Finance Corporation of India Limited, Kotak Mahindra Limited, Indian Railway Finance Corporation of India Limited. Red Herring Prospectus of Power Grid Corporation of India Limited’s IPO of September, 2007. Securities and Exchange Board Of India (Disclosure And Investor Protection) Guidelines, 2000 Power Sector in India -White paper on Implementation Challenges and Opportunities” – KPMG Repos in corporate bonds under consideration, says Sebi”- Newswire18 / Mumbai September 11, 2009, Some of the data bases used are: Capitaline http://nse-india.com/ Reuters www.FIMMDA.org www.indiastat.com 146