SlideShare a Scribd company logo
BCG Matrix
Company's Portfolio
Portfolio : A business portfolio is a company’s set of
investments, holdings, products, businesses and
brands. A product portfolio is the product’s mix of market
segments. Marketing managers attempt to make a
product appeal to specific groups of people, called
segments. Examples of segments may be college
graduates, infant babies, men only , women only.
Strategic business units : The items in a business’s
portfolio may be called strategic business units, or
SBU's.
Having identified the business units that result from the
analysis, the company’s next task is to determine what
objectives, strategy and budget to assign to each
business unit.
MODELS FOR PORTFOLIO
ANALYSIS
Several models have been developed for use
when evaluating a company’s portfolio.Such
include :

Market share model,

the Growth share Matrix and

the multifactor portfoliomatrix.
Introduction
The Boston Consulting Group (BCG) is a global
management consulting firm with 82 offices in 46
countries founded in 1963.
The firm advises clients in the private, public, and
not-for-profit sectors around the world.
In the early 1970’s the Boston Consulting Group
(BCG) developed a model for managing a portfolio
of different strategic business units (SBUs) or
major product lines.
Bruce Henderson, CEO BCG
(1915 - 1992)
Why Need a model or BCG
Matrix ?
The chart is a graphical planning tool, where the
company’s products and services can be plotted
to help make key business decisions.
These decisions include whether to keep a
particular business unit, sell it or to invest more
in it. The y-axis of the graph represents rate of
market growth while the x-axis represents
market share.
A portfolio management tool based on product
life cycle theory.
BCG Growth Share Matrix
Structure
The BCG GrowthShare Matrix is a four cell (2 by
2) matrix used to perform business portfolio
analysis as a step in the strategic planning
process. The BCG Growth Share Matrix positions
the various SBUs/product lines based on Market
Growth Rate and Market Share relative to the
most important competitor.
FOUR CATEGORIES OF SBU’S
Market share ( X-axis )

Market share is the percentage of either
revenue or volume of sales that your
organization has of the total market.

In other words, the higher your market share,
the bigger the proportion of the market you
control and influence.

Relative market share is the firm’s or brands
market share is an index of its largest
competitor. In this way, relative market share
becomes a measure of competitive strength.
The formula for calculating relative market
share is as follows:
Market Growth ( Y- axis )

Market growth is the percentage growth
compared to the previous year. It is used as a
measure of how attractive a market is to
existing providers and potential new entrants.

High market growth creates an environment in
which it is relatively easy for organizations to
grow their profits, even if their market share
remains the same.

In contrast, if your product is in a low growth
market you will face intense competitive activity
and your organization will need to employ
significant effort just to retain its market share,
even if it is an established provider.
Cash Cows (high share, low
growth)

Cash cows: Cash cows are the leaders in the
marketplace and generate more cash than they
consume. These are business units or products
that have a high market share, but low growth
prospects. Cash cows provide the cash required
to turn question marks into market leaders, to
cover the administrative costs of the company,
to fund research and development, to service
the corporate debt, and to pay dividends to
shareholders. Companies are advised to invest
in cash cows to maintain the current level of
productivity, or to "milk" the gains passively.
So …...Cash Cows are
More Facts …
Cash cows are products or services that have
achieved market leader status, provide positive
cash flows and a return on assets (ROA) that
exceeds the market growth rate.
The return on assets (ROA) shows the
percentage of how profitable a company's
assets are in generating revenue.
The return on assets ratio, often called the
return on total assets, is a profitability ratio that
measures the net income produced by total
assets during a period by comparing net income
to the average total assets.
ROA can be computed as:
Stars ( High growth, High
Market Share)

Stars are leaders in business.

They also require heavy investment, to
maintain its large market share.

It leads to large amount cash consumption and
cash generation.

Attempts should be made to hold the market
share otherwise the star will become a CASH
COW.
Problem Child Or Question Mark
(low share, high growth)

A Question Mark has a low market share in a
fast-growing market. Whilst this type of product
is likely to generate some revenue it may not
be enough to sustain rapid growth and it may
become a net consumer of cash as it struggles
to retain its market share. Identifying those
Question Marks that have the potential to gain
sufficient market share to become a Star and
eventually a Cash Cow is critically important to
the future of any organization.

It is essential to define how much investment
the organization is prepared to allocate to a
Question Mark product in order to gain market
More facts ...
So the Question marks are products which may
give high returns but at the same time may also
flop and may have to be taken out of the
market. This uncertainty gives the quadrant the
name “Question Mark”. The major problem
associated with having Question marks is the
amount of investment which it might need and
whether the investment will give returns in the
end or whether it will be completely wasted.
Strategies for Question marks – As they are
new entry products with high growth rate, the
growth rate needs to be capitalized in such a
manner that question marks turn into high
Dogs (low share, low growth)
Product classified as dogs always have a weak
market share in a low growth market. These
products are very likely making a loss or a very
low profit at best. These products can be a big
drain on management time and resources.
The question for managers are whether the
investment currently being spent on keeping
these products alive, could be spent on making
something that would be more profitable. The
answer to this question is usually yes.
More facts ...
Strategies for Dogs – Depending on the
amount of cash which is already invested in this
quadrant, the company can either divest the
product altogether or it can revamp the product
through rebranding / innovation / adding
features etc.
However, moving a dog towards a star or a
cash cow is very difficult. It can be moved only
to the question mark region where again the
future of the product is unknown. Thus in cases
of Dog products, divestment strategy is used.
In General ..
Colgate since 1873
BCG Matrix
Colgate Products …
Final Cases ..
Sequences
Success Sequence in BCG Matrix – The Success
sequence of BCG matrix happens when a
question mark becomes a Star and finally it
becomes a cash cow. This is the best sequence
which really give a boost to the companies
profits and growth. The success sequence unlike
the disaster sequence is entirely dependent on
the right decision making.
Disaster sequence in BCG Matrix – Disaster
sequence of BCG matrix happens when a
product which is a cash cow, due to competitive
pressure might be moved to a star. It fails out
Maruti-Suzuki BCG Matrix
BCG Matrix presentation
THE AIM IS ….
• to keep the cows,
• sell the dogs to finance the question marks
• and work to turn the cows into stars
• before they turn into dogs
Thanks ...

More Related Content

PPTX
Corporate strategy
PDF
Kellogs - Extending the product life cycle - case study
PPT
Ge matrix
PPTX
Stability strategy abhishek prakash02
PPTX
Product Mix of ITC
PPTX
Chapter 3 grand strategy
PPTX
Conglomerate Diversification - ITC, Strategy formulation, 2013
PPTX
a comparative analysis of Sunfeast Yippee in comparison to others
Corporate strategy
Kellogs - Extending the product life cycle - case study
Ge matrix
Stability strategy abhishek prakash02
Product Mix of ITC
Chapter 3 grand strategy
Conglomerate Diversification - ITC, Strategy formulation, 2013
a comparative analysis of Sunfeast Yippee in comparison to others

What's hot (20)

PPTX
All Out case study
DOC
Report - Colgate Financial Analysis
PPTX
STRATEGIC PLAN OF INDIAN TOBACCO COMPANY (ITC)
PPTX
Mortein case study mARKETING bRAND pOSITIONING
PPTX
Blue Ocean Strategy
PDF
Case ans
PPTX
Mark strat simulation( firm presentation)
PPT
Ansoff matrix
PDF
Unit 3 Strategic Management Grand and Generic Strategies
PPTX
Product mix of reckitt benckiser
PPTX
Final Markstrat Marketing Plan
PPTX
PPTX
Expansion strategies
PPTX
Showrooming at best buy
DOCX
Strategic analysis on britannia
PPTX
AMUL BCG Matrix
PPTX
corporate level strategies
PDF
Emami Ltd. | Brand Analysis
PPTX
Ge9 final ppt
PPTX
Marketing presentation
All Out case study
Report - Colgate Financial Analysis
STRATEGIC PLAN OF INDIAN TOBACCO COMPANY (ITC)
Mortein case study mARKETING bRAND pOSITIONING
Blue Ocean Strategy
Case ans
Mark strat simulation( firm presentation)
Ansoff matrix
Unit 3 Strategic Management Grand and Generic Strategies
Product mix of reckitt benckiser
Final Markstrat Marketing Plan
Expansion strategies
Showrooming at best buy
Strategic analysis on britannia
AMUL BCG Matrix
corporate level strategies
Emami Ltd. | Brand Analysis
Ge9 final ppt
Marketing presentation
Ad

Similar to BCG Matrix presentation (20)

PPTX
Bcg matrix (boston consultancy group matrix)
DOCX
BCG matrix(word)
PPTX
Bcg powerpoint mba
PPTX
Information about BCG Matrix
PPTX
BCG matrix with example
PDF
BCG matrix.pdf
PPTX
Bcg matrix presentation made by priyansh kesarwani
PPTX
PPTX
BCG for recording hhhdyydhdydudhd(2).pptx
PPTX
BCG Matrix 2X2 Matrix porfolio management
PPT
Bcg matrix
PPTX
BCG Matrics of Google
PPTX
Bcg matrix ( international hrm )
 
PPTX
Bcg matrix - ( international hrm )
PPTX
Bcg matrix
DOCX
Boston consulting group
PPTX
bcg matrix.pptx
PPT
BCG Matrix.ppt
PPTX
BCG matrix power point presentation for students
Bcg matrix (boston consultancy group matrix)
BCG matrix(word)
Bcg powerpoint mba
Information about BCG Matrix
BCG matrix with example
BCG matrix.pdf
Bcg matrix presentation made by priyansh kesarwani
BCG for recording hhhdyydhdydudhd(2).pptx
BCG Matrix 2X2 Matrix porfolio management
Bcg matrix
BCG Matrics of Google
Bcg matrix ( international hrm )
 
Bcg matrix - ( international hrm )
Bcg matrix
Boston consulting group
bcg matrix.pptx
BCG Matrix.ppt
BCG matrix power point presentation for students
Ad

Recently uploaded (20)

DOCX
unit 1 COST ACCOUNTING AND COST SHEET
PPTX
Amazon (Business Studies) management studies
PPTX
Dragon_Fruit_Cultivation_in Nepal ppt.pptx
PDF
Unit 1 Cost Accounting - Cost sheet
PDF
Roadmap Map-digital Banking feature MB,IB,AB
PDF
Laughter Yoga Basic Learning Workshop Manual
PDF
MSPs in 10 Words - Created by US MSP Network
PDF
IFRS Notes in your pocket for study all the time
PDF
DOC-20250806-WA0002._20250806_112011_0000.pdf
PPTX
5 Stages of group development guide.pptx
PDF
Chapter 5_Foreign Exchange Market in .pdf
PPTX
Probability Distribution, binomial distribution, poisson distribution
PDF
BsN 7th Sem Course GridNNNNNNNN CCN.pdf
PDF
Stem Cell Market Report | Trends, Growth & Forecast 2025-2034
DOCX
Euro SEO Services 1st 3 General Updates.docx
DOCX
Business Management - unit 1 and 2
PPTX
ICG2025_ICG 6th steering committee 30-8-24.pptx
PDF
Dr. Enrique Segura Ense Group - A Self-Made Entrepreneur And Executive
PDF
Ôn tập tiếng anh trong kinh doanh nâng cao
PDF
Nidhal Samdaie CV - International Business Consultant
unit 1 COST ACCOUNTING AND COST SHEET
Amazon (Business Studies) management studies
Dragon_Fruit_Cultivation_in Nepal ppt.pptx
Unit 1 Cost Accounting - Cost sheet
Roadmap Map-digital Banking feature MB,IB,AB
Laughter Yoga Basic Learning Workshop Manual
MSPs in 10 Words - Created by US MSP Network
IFRS Notes in your pocket for study all the time
DOC-20250806-WA0002._20250806_112011_0000.pdf
5 Stages of group development guide.pptx
Chapter 5_Foreign Exchange Market in .pdf
Probability Distribution, binomial distribution, poisson distribution
BsN 7th Sem Course GridNNNNNNNN CCN.pdf
Stem Cell Market Report | Trends, Growth & Forecast 2025-2034
Euro SEO Services 1st 3 General Updates.docx
Business Management - unit 1 and 2
ICG2025_ICG 6th steering committee 30-8-24.pptx
Dr. Enrique Segura Ense Group - A Self-Made Entrepreneur And Executive
Ôn tập tiếng anh trong kinh doanh nâng cao
Nidhal Samdaie CV - International Business Consultant

BCG Matrix presentation

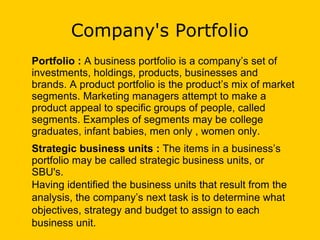
  • 2. Company's Portfolio Portfolio : A business portfolio is a company’s set of investments, holdings, products, businesses and brands. A product portfolio is the product’s mix of market segments. Marketing managers attempt to make a product appeal to specific groups of people, called segments. Examples of segments may be college graduates, infant babies, men only , women only. Strategic business units : The items in a business’s portfolio may be called strategic business units, or SBU's. Having identified the business units that result from the analysis, the company’s next task is to determine what objectives, strategy and budget to assign to each business unit.
  • 3. MODELS FOR PORTFOLIO ANALYSIS Several models have been developed for use when evaluating a company’s portfolio.Such include :  Market share model,  the Growth share Matrix and  the multifactor portfoliomatrix.
  • 4. Introduction The Boston Consulting Group (BCG) is a global management consulting firm with 82 offices in 46 countries founded in 1963. The firm advises clients in the private, public, and not-for-profit sectors around the world. In the early 1970’s the Boston Consulting Group (BCG) developed a model for managing a portfolio of different strategic business units (SBUs) or major product lines.
  • 5. Bruce Henderson, CEO BCG (1915 - 1992)
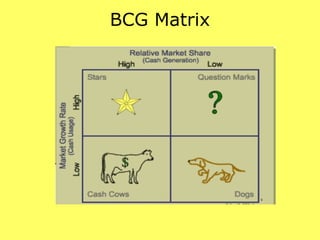
  • 6. Why Need a model or BCG Matrix ? The chart is a graphical planning tool, where the company’s products and services can be plotted to help make key business decisions. These decisions include whether to keep a particular business unit, sell it or to invest more in it. The y-axis of the graph represents rate of market growth while the x-axis represents market share. A portfolio management tool based on product life cycle theory.
  • 8. Structure The BCG GrowthShare Matrix is a four cell (2 by 2) matrix used to perform business portfolio analysis as a step in the strategic planning process. The BCG Growth Share Matrix positions the various SBUs/product lines based on Market Growth Rate and Market Share relative to the most important competitor.
  • 10. Market share ( X-axis )  Market share is the percentage of either revenue or volume of sales that your organization has of the total market.  In other words, the higher your market share, the bigger the proportion of the market you control and influence.  Relative market share is the firm’s or brands market share is an index of its largest competitor. In this way, relative market share becomes a measure of competitive strength. The formula for calculating relative market share is as follows:
  • 11. Market Growth ( Y- axis )  Market growth is the percentage growth compared to the previous year. It is used as a measure of how attractive a market is to existing providers and potential new entrants.  High market growth creates an environment in which it is relatively easy for organizations to grow their profits, even if their market share remains the same.  In contrast, if your product is in a low growth market you will face intense competitive activity and your organization will need to employ significant effort just to retain its market share, even if it is an established provider.
  • 12. Cash Cows (high share, low growth)  Cash cows: Cash cows are the leaders in the marketplace and generate more cash than they consume. These are business units or products that have a high market share, but low growth prospects. Cash cows provide the cash required to turn question marks into market leaders, to cover the administrative costs of the company, to fund research and development, to service the corporate debt, and to pay dividends to shareholders. Companies are advised to invest in cash cows to maintain the current level of productivity, or to "milk" the gains passively. So …...Cash Cows are
  • 13. More Facts … Cash cows are products or services that have achieved market leader status, provide positive cash flows and a return on assets (ROA) that exceeds the market growth rate. The return on assets (ROA) shows the percentage of how profitable a company's assets are in generating revenue. The return on assets ratio, often called the return on total assets, is a profitability ratio that measures the net income produced by total assets during a period by comparing net income to the average total assets. ROA can be computed as:
  • 14. Stars ( High growth, High Market Share)  Stars are leaders in business.  They also require heavy investment, to maintain its large market share.  It leads to large amount cash consumption and cash generation.  Attempts should be made to hold the market share otherwise the star will become a CASH COW.
  • 15. Problem Child Or Question Mark (low share, high growth)  A Question Mark has a low market share in a fast-growing market. Whilst this type of product is likely to generate some revenue it may not be enough to sustain rapid growth and it may become a net consumer of cash as it struggles to retain its market share. Identifying those Question Marks that have the potential to gain sufficient market share to become a Star and eventually a Cash Cow is critically important to the future of any organization.  It is essential to define how much investment the organization is prepared to allocate to a Question Mark product in order to gain market
  • 16. More facts ... So the Question marks are products which may give high returns but at the same time may also flop and may have to be taken out of the market. This uncertainty gives the quadrant the name “Question Mark”. The major problem associated with having Question marks is the amount of investment which it might need and whether the investment will give returns in the end or whether it will be completely wasted. Strategies for Question marks – As they are new entry products with high growth rate, the growth rate needs to be capitalized in such a manner that question marks turn into high
  • 17. Dogs (low share, low growth) Product classified as dogs always have a weak market share in a low growth market. These products are very likely making a loss or a very low profit at best. These products can be a big drain on management time and resources. The question for managers are whether the investment currently being spent on keeping these products alive, could be spent on making something that would be more profitable. The answer to this question is usually yes.
  • 18. More facts ... Strategies for Dogs – Depending on the amount of cash which is already invested in this quadrant, the company can either divest the product altogether or it can revamp the product through rebranding / innovation / adding features etc. However, moving a dog towards a star or a cash cow is very difficult. It can be moved only to the question mark region where again the future of the product is unknown. Thus in cases of Dog products, divestment strategy is used.
  • 23. Sequences Success Sequence in BCG Matrix – The Success sequence of BCG matrix happens when a question mark becomes a Star and finally it becomes a cash cow. This is the best sequence which really give a boost to the companies profits and growth. The success sequence unlike the disaster sequence is entirely dependent on the right decision making. Disaster sequence in BCG Matrix – Disaster sequence of BCG matrix happens when a product which is a cash cow, due to competitive pressure might be moved to a star. It fails out
  • 26. THE AIM IS …. • to keep the cows, • sell the dogs to finance the question marks • and work to turn the cows into stars • before they turn into dogs