SlideShare a Scribd company logo
SCC430
Modeling and Simulation
Chapter 03
Queueing Simulation
Dr. Ahmed Hagag
Faculty of Computers and Artificial Intelligence
Benha University
Fall 2020
‱ Introduction.
‱ Description of Queuing System.
‱ Simulating a Single-Server Queue.
✓ Example.
‱ Simulating a Queue with Multi-Servers.
✓ Example.
2
©Ahmed Hagag Modeling and Simulation
Chapter 3: Queueing Simulation
3
©Ahmed Hagag
Introduction (1/3)
Modeling and Simulation
Queueing Model:
‱ Simulation is often used in the analysis of queueing
models. In a simple but typical queueing model,
customers arrive from time to time and join a queue
(waiting line), are eventually served, and finally leave
the system.
4
©Ahmed Hagag
Introduction (2/3)
Modeling and Simulation
‱ Queueing models, whether solved mathematically or
analyzed through simulation, provide the analyst with a
powerful tool for designing and evaluating the
performance of queueing systems.
‱ Typical measures of system performance include server
utilization (percentage of time a server is busy), length of
waiting lines, and delays of customers.
5
©Ahmed Hagag
Introduction (3/3)
Modeling and Simulation
‱ Quite often, when designing to improve a queueing
system, the analyst (or decision maker) is involved in
tradeoffs between server utilization and customer
satisfaction in terms of line lengths and delays.
6
©Ahmed Hagag
Description of Queuing Sys (1/8)
Modeling and Simulation
‱ The key elements of a queueing system are the
customers and servers.
‱ The term customer can refer to people, machines, trucks,
mechanics, patients, airplanes, e-mail, cases, or orders—
anything that arrives at a facility and requires service.
‱ The term server might refer to receptionists, repair
personnel, mechanics, medical personnel, runways at an
airport, automatic packers, order pickers, or CPUs in a
computer—any resource (person, machine, etc.) that
provides the requested service.
7
©Ahmed Hagag
Description of Queuing Sys (2/8)
Modeling and Simulation
Queueing System:
1. The Calling Population.
2. System Capacity.
3. The Arrival Process.
4. Queue Behavior and Queue Discipline.
5. Service Times and the Service Mechanism.
8
©Ahmed Hagag
Description of Queuing Sys (3/8)
Modeling and Simulation
1. The Calling Population (1/3):
‱ Also called: Input source (source of customers).
‱ The population of potential customers, referred to as the
calling population, may be assumed to be finite or
infinite.
9
©Ahmed Hagag
Description of Queuing Sys (3/8)
Modeling and Simulation
1. The Calling Population (2/3):
‱ Infinite size:
➱ Simulation assumptions: If a unit leaves the calling
population and joins the waiting line or enters service,
there is no change in the arrival rate of other units that
may need service.
➱ Most simulated models.
‱ Finite size:
➱ Less common and complicates the simulation.
10
©Ahmed Hagag
Description of Queuing Sys (3/8)
Modeling and Simulation
1. The Calling Population (3/3):
‱ The main difference between finite and infinite
population models is how the arrival rate is defined. In
an infinite population model, the arrival rate (i.e., the
average number of arrivals per unit of time) is not
affected by the number of customers who have left the
calling population and joined the queueing system.
11
©Ahmed Hagag
Description of Queuing Sys (4/8)
Modeling and Simulation
2. System Capacity:
‱ Is the maximum number of units that can be
accommodated in the system.
‱ In many queueing systems, there is a limit to the
number of customers that may be in the waiting line or
system.
‱ It’s unlimited capacity if the system can accommodate
any number of units in the waiting line.
12
©Ahmed Hagag
Description of Queuing Sys (5/8)
Modeling and Simulation
3. The Arrival Process:
‱ The arrival process for infinite-population models is
usually characterized in terms of interarrival times of
successive customers. Arrivals may occur at scheduled
times or at random times. When at random times, the
interarrival times are usually characterized by a
probability distribution.
13
©Ahmed Hagag
Description of Queuing Sys (6/8)
Modeling and Simulation
4. Queue Behavior and Queue Discipline (1/2):
‱ Queue behavior refers to the actions of customers while
in a queue waiting for service to begin. In some
situations, there is a possibility that incoming customers
will balk (leave when they see that the line is too long),
renege (leave after being in the line when they see that
the line is moving too slowly), or jockey (move from
one line to another if they think they have chosen a slow
line).
14
©Ahmed Hagag
Description of Queuing Sys (6/8)
Modeling and Simulation
4. Queue Behavior and Queue Discipline (2/2):
‱ Queue discipline refers to the logical ordering of
customers in a queue and determines which customer
will be chosen for service when a server becomes free.
‱ Common queue disciplines include first-in-first-out
(FIFO), last-in-first-out (LIFO), service in random order
(SIRO), shortest processing time first (SPT), and
service according to priority (PR).
15
©Ahmed Hagag
Description of Queuing Sys (7/8)
Modeling and Simulation
5. Service Times and the Service Mechanism (1/3):
‱ The service times of successive arrivals are denoted by
𝑆1, 𝑆2, 𝑆3, . . . . They may be constant or of random
duration. In the latter case, {𝑆1, 𝑆2, 𝑆3, . . . } is usually
characterized as a sequence of independent and
identically distributed random variables.
‱ In addition, in some systems, service times depend upon
the time of day or upon the length of the waiting line.
16
©Ahmed Hagag
Description of Queuing Sys (7/8)
Modeling and Simulation
5. Service Times and the Service Mechanism (2/3):
‱ A queueing system consists of a
number of service centers and
interconnecting queues. Each
service center consists of some
number of servers, 𝑐, working in
parallel; that is, upon getting to
the head of the line, a customer
takes the first available server.
𝒄 = 𝟑
17
©Ahmed Hagag
Description of Queuing Sys (7/8)
Modeling and Simulation
5. Service Times and the Service Mechanism (3/3):
18
©Ahmed Hagag
Description of Queuing Sys (7/8)
Modeling and Simulation
A notational system for parallel server systems: A/B/c/N/K.
These letters represent the following system characteristics:
19
©Ahmed Hagag
Description of Queuing Sys (8/8)
Modeling and Simulation
Queuing System State (1/3):
‱ The quantities (variables) that collectively completely
describe the system at any given instant from the
viewpoint of the study objectives:
➱ Number of units in the system: How many units are
currently in the queue or being processed by the server.
➱ Status of server (idle, busy): Is the server(s) busy with
processing some units or idle waiting for a job.
20
©Ahmed Hagag
Description of Queuing Sys (8/8)
Modeling and Simulation
Queuing System State (2/3):
21
©Ahmed Hagag
Description of Queuing Sys (8/8)
Modeling and Simulation
Queuing System State (3/3):
22
©Ahmed Hagag
Sim. a Single-Server Queue (1/14)
Modeling and Simulation
Simulation Table (1/3):
‱ The following table was designed as a simulation table
specifically for a single-channel queue that serves
customers on a first-in–first-out (FIFO) basis.
23
©Ahmed Hagag
Sim. a Single-Server Queue (1/14)
Modeling and Simulation
Simulation Table (2/3):
24
©Ahmed Hagag
Sim. a Single-Server Queue (1/14)
Modeling and Simulation
Simulation Table (3/3):
25
©Ahmed Hagag
Sim. a Single-Server Queue (2/14)
Modeling and Simulation
Example1
The Grocery Checkout, a Single-Server Queue:
26
©Ahmed Hagag
Sim. a Single-Server Queue (3/14)
Modeling and Simulation
‱ A small grocery store has one
checkout counter. Customers
arrive at the checkout counter
at random times that range
from 1 to 8 minutes apart. We
assume that interarrival times
are integer-valued with each
of the 8 values having equal
probability; this is a discrete
uniform distribution.
27
©Ahmed Hagag
Sim. a Single-Server Queue (3/14)
Modeling and Simulation
‱ A small grocery store has one
checkout counter. Customers
arrive at the checkout counter
at random times that range
from 1 to 8 minutes apart. We
assume that interarrival times
are integer-valued with each
of the 8 values having equal
probability; this is a discrete
uniform distribution.
28
©Ahmed Hagag
Sim. a Single-Server Queue (3/14)
Modeling and Simulation
‱ A small grocery store has one
checkout counter. Customers
arrive at the checkout counter
at random times that range
from 1 to 8 minutes apart. We
assume that interarrival times
are integer-valued with each
of the 8 values having equal
probability; this is a discrete
uniform distribution.
29
©Ahmed Hagag
Sim. a Single-Server Queue (4/14)
Modeling and Simulation
Distribution of Time Between Arrivals
30
©Ahmed Hagag
Sim. a Single-Server Queue (5/14)
Modeling and Simulation
Time-Between-Arrivals Determination
31
©Ahmed Hagag
Sim. a Single-Server Queue (6/14)
Modeling and Simulation
‱ The service times vary from 1
to 6 minutes (also integer-
valued), with the probabilities
shown in the following table.
32
©Ahmed Hagag
Sim. a Single-Server Queue (7/14)
Modeling and Simulation
Service Time Distribution
33
©Ahmed Hagag
Sim. a Single-Server Queue (8/14)
Modeling and Simulation
Service Times Generated
34
©Ahmed Hagag
Sim. a Single-Server Queue (9/14)
Modeling and Simulation
Simulation Table for Queueing Problem (20 customers)
35
©Ahmed Hagag
Sim. a Single-Server Queue (9/14)
Modeling and Simulation
Simulation Table for Queueing Problem (20 customers)
36
©Ahmed Hagag
Sim. a Single-Server Queue (9/14)
Modeling and Simulation
Simulation Table for Queueing Problem (20 customers)
37
©Ahmed Hagag
Sim. a Single-Server Queue (9/14)
Modeling and Simulation
Simulation Table for Queueing Problem (20 customers)
38
©Ahmed Hagag
Sim. a Single-Server Queue (9/14)
Modeling and Simulation
Simulation Table for Queueing Problem (20 customers)
39
©Ahmed Hagag
Sim. a Single-Server Queue (9/14)
Modeling and Simulation
Simulation Table for Queueing Problem (20 customers)
40
©Ahmed Hagag
Sim. a Single-Server Queue (9/14)
Modeling and Simulation
Simulation Table for Queueing Problem (20 customers)
41
©Ahmed Hagag
Sim. a Single-Server Queue (9/14)
Modeling and Simulation
Simulation Table for Queueing Problem (20 customers)
42
©Ahmed Hagag
Sim. a Single-Server Queue (9/14)
Modeling and Simulation
Simulation Table for Queueing Problem (20 customers)
Total Run Time of
Simulation
43
©Ahmed Hagag
Sim. a Single-Server Queue (10/14)
Modeling and Simulation
Some of the findings from the simulation are as follows (1/7):
44
©Ahmed Hagag
Sim. a Single-Server Queue (10/14)
Modeling and Simulation
Some of the findings from the simulation are as follows (2/7):
45
©Ahmed Hagag
Sim. a Single-Server Queue (10/14)
Modeling and Simulation
Some of the findings from the simulation are as follows (3/7):
46
©Ahmed Hagag
Sim. a Single-Server Queue (10/14)
Modeling and Simulation
Some of the findings from the simulation are as follows (4/7):
This result can be compared with the expected service time by
finding the mean of the service-time distribution using the
equation:
47
©Ahmed Hagag
Sim. a Single-Server Queue (10/14)
Modeling and Simulation
Some of the findings from the simulation are as follows (5/7):
48
©Ahmed Hagag
Sim. a Single-Server Queue (10/14)
Modeling and Simulation
Some of the findings from the simulation are as follows (6/7):
49
©Ahmed Hagag
Sim. a Single-Server Queue (10/14)
Modeling and Simulation
Some of the findings from the simulation are as follows (7/7):
50
©Ahmed Hagag
Sim. a Single-Server Queue (11/14)
Modeling and Simulation
‱ Our objective is to analyze the system by simulating the
arrival and service of 100 customers and to compute a
variety of typical measures of performance for queueing
models.
➱ In actuality, 100 customers may be too small a sample size to
draw reliable conclusions. Depending on our objectives, the
accuracy of the results may be enhanced by increasing the
sample size (number of customers), or by running multiple
trials (or replications).
51
©Ahmed Hagag
Sim. a Single-Server Queue (12/14)
Modeling and Simulation
‱ Our objective is to analyze the system by simulating the
arrival and service of 100 customers and to compute a
variety of typical measures of performance for queueing
models.
➱ A second issue is that of initial conditions. A simulation of a
grocery store that starts with an empty system may or may not
be realistic unless the intention is to model the system from
startup or to model until steady-state operation is reached.
Here, to keep calculations simple, the starting conditions are
an empty grocery, and any concerns are overlooked.
52
©Ahmed Hagag
Sim. a Single-Server Queue (13/14)
Modeling and Simulation
Simulation Table for Queueing Problem (100 customers)
53
©Ahmed Hagag
Sim. a Single-Server Queue (14/14)
Modeling and Simulation
Some of the findings from the simulation are as follows (1/4):
54
©Ahmed Hagag
Sim. a Single-Server Queue (14/14)
Modeling and Simulation
Some of the findings from the simulation are as follows (1/4):
55
©Ahmed Hagag
Sim. a Single-Server Queue (14/14)
Modeling and Simulation
Some of the findings from the simulation are as follows (2/4):
Interval (0, 2]
56
©Ahmed Hagag
Sim. a Single-Server Queue (14/14)
Modeling and Simulation
Some of the findings from the simulation are as follows (2/4):
Interval (2, 4]
57
©Ahmed Hagag
Sim. a Single-Server Queue (14/14)
Modeling and Simulation
Some of the findings from the simulation are as follows (2/4):
58
©Ahmed Hagag
Sim. a Single-Server Queue (14/14)
Modeling and Simulation
‱ We are now interested in running an experiment to
address the question of how the average time in queue
for the first 100 customers varies from day to day.
‱ Running once with 100 customers corresponds to one
day. Running it 50 times corresponds to 50 days, where
each trial represents one day.
‱ The overall average waiting time over 50 trials was 1.32
minutes.
Some of the findings from the simulation are as follows (3/4):
59
©Ahmed Hagag
Sim. a Single-Server Queue (14/14)
Modeling and Simulation
Some of the findings from the simulation are as follows (4/4):
60
©Ahmed Hagag
Sim. a Single-Server Queue (14/14)
Modeling and Simulation
Some of the findings from the simulation are as follows (4/4):
Interval (0, 0.5]
61
©Ahmed Hagag
Sim. a Single-Server Queue (14/14)
Modeling and Simulation
Some of the findings from the simulation are as follows (4/4):
Interval (0.5, 1]
62
©Ahmed Hagag
Sim. a Single-Server Queue (14/14)
Modeling and Simulation
Some of the findings from the simulation are as follows (4/4):
Interval (1, 1.5]
63
©Ahmed Hagag
Sim. a Single-Server Queue (14/14)
Modeling and Simulation
Some of the findings from the simulation are as follows (4/4):
64
©Ahmed Hagag Modeling and Simulation
LAB
What have you learned in the LAB yet?
65
©Ahmed Hagag
Review Example (1/11)
Modeling and Simulation
Distribution of Time Between Arrivals
66
©Ahmed Hagag
Review Example (2/11)
Modeling and Simulation
Distribution of Time Between Arrivals (Answer)
67
©Ahmed Hagag
Review Example (3/11)
Modeling and Simulation
Service-Time Distribution
68
©Ahmed Hagag
Review Example (4/11)
Modeling and Simulation
Service-Time Distribution (Answer)
69
©Ahmed Hagag
Review Example (5/11)
Modeling and Simulation
Simulation Table
70
©Ahmed Hagag
Review Example (6/11)
Modeling and Simulation
Simulation Table (Answer)
71
©Ahmed Hagag
Review Example (7/11)
Modeling and Simulation
Simulation Table (Answer)
72
©Ahmed Hagag
Review Example (8/11)
Modeling and Simulation
Simulation Table
73
©Ahmed Hagag
Review Example (9/11)
Modeling and Simulation
Simulation Table (Answer)
74
©Ahmed Hagag
Review Example (10/11)
Modeling and Simulation
Simulation Table (Answer)
75
©Ahmed Hagag
Review Example (11/11)
Modeling and Simulation
Results (1/2):
76
©Ahmed Hagag
Review Example (11/11)
Modeling and Simulation
Results (2/2):
And compare with the expected service time
And compare with the expected interarrivals time
77
©Ahmed Hagag
Sim. a Multi-Server Queue (1/18)
Modeling and Simulation
Queueing Model:
‱ Suppose that there are c channels operating in parallel.
Arrivals will join a single queue and enter the first
available service channel.
78
©Ahmed Hagag
Sim. a Multi-Server Queue (2/18)
Modeling and Simulation
Example: Call Center:
79
©Ahmed Hagag
Sim. a Multi-Server Queue (2/18)
Modeling and Simulation
Example: Call Center:
‱ Consider a Call Center where technical personnel take
calls and provide service.
‱ Two technical support people (2 server) exists:
➱ Able more experienced, provides service faster,
➱ Baker newbie, provides service slower.
‱ Rule:
➱ Able gets call if both people are idle.
80
©Ahmed Hagag
Sim. a Multi-Server Queue (3/18)
Modeling and Simulation
Interarrival distribution of calls for technical support
81
©Ahmed Hagag
Sim. a Multi-Server Queue (3/18)
Modeling and Simulation
Interarrival distribution of calls for technical support
82
©Ahmed Hagag
Sim. a Multi-Server Queue (3/18)
Modeling and Simulation
Interarrival distribution of calls for technical support
83
©Ahmed Hagag
Sim. a Multi-Server Queue (4/18)
Modeling and Simulation
Service Distribution of Able
Service Distribution of Baker
84
©Ahmed Hagag
Sim. a Multi-Server Queue (5/18)
Modeling and Simulation
The simulation:
‱ The problem is to find how well the current arrangement
is working. To estimate the system measures of
performance, a simulation of 1 hour of operation is
made. A longer simulation would yield more reliable
results, but for purposes of illustration a l-hour period
has been selected.
85
©Ahmed Hagag
Sim. a Multi-Server Queue (6/18)
Modeling and Simulation
Simulation Table:
Customer
=
Call
86
©Ahmed Hagag
Sim. a Multi-Server Queue (6/18)
Modeling and Simulation
Simulation Table:
Interarrival
Time
87
©Ahmed Hagag
Sim. a Multi-Server Queue (6/18)
Modeling and Simulation
Simulation Table:
Time of
Arrival
88
©Ahmed Hagag
Sim. a Multi-Server Queue (6/18)
Modeling and Simulation
Simulation Table:
Service
Time
89
©Ahmed Hagag
Sim. a Multi-Server Queue (6/18)
Modeling and Simulation
Simulation Table:
Waiting
Time
90
©Ahmed Hagag
Sim. a Multi-Server Queue (7/18)
Modeling and Simulation
Simulation Table:
91
©Ahmed Hagag
Sim. a Multi-Server Queue (7/18)
Modeling and Simulation
Simulation Table:
Able
Baker
92
©Ahmed Hagag
Sim. a Multi-Server Queue (7/18)
Modeling and Simulation
Simulation Table:
Able
Baker
93
©Ahmed Hagag
Sim. a Multi-Server Queue (7/18)
Modeling and Simulation
Simulation Table:
Able
Baker
94
©Ahmed Hagag
Sim. a Multi-Server Queue (7/18)
Modeling and Simulation
Simulation Table:
Able
Baker
95
©Ahmed Hagag
Sim. a Multi-Server Queue (7/18)
Modeling and Simulation
Simulation Table:
96
©Ahmed Hagag
Sim. a Multi-Server Queue (8/18)
Modeling and Simulation
Simulation Table:
97
©Ahmed Hagag
Sim. a Multi-Server Queue (8/18)
Modeling and Simulation
Simulation Table:
98
©Ahmed Hagag
Sim. a Multi-Server Queue (8/18)
Modeling and Simulation
Simulation Table:
99
©Ahmed Hagag
Sim. a Multi-Server Queue (8/18)
Modeling and Simulation
Simulation Table:
100
©Ahmed Hagag
Sim. a Multi-Server Queue (8/18)
Modeling and Simulation
Simulation Table:
101
©Ahmed Hagag
Sim. a Multi-Server Queue (8/18)
Modeling and Simulation
Simulation Table:
102
©Ahmed Hagag
Sim. a Multi-Server Queue (8/18)
Modeling and Simulation
Simulation Table:
Able
Baker
103
©Ahmed Hagag
Sim. a Multi-Server Queue (8/18)
Modeling and Simulation
Simulation Table:
Able
Baker
104
©Ahmed Hagag
Sim. a Multi-Server Queue (8/18)
Modeling and Simulation
Simulation Table:
Able
Baker
105
©Ahmed Hagag
Sim. a Multi-Server Queue (8/18)
Modeling and Simulation
Simulation Table:
106
©Ahmed Hagag
Sim. a Multi-Server Queue (9/18)
Modeling and Simulation
Simulation Table:
107
©Ahmed Hagag
Sim. a Multi-Server Queue (10/18)
Modeling and Simulation
Simulation Table:
108
©Ahmed Hagag
Sim. a Multi-Server Queue (11/18)
Modeling and Simulation
Simulation Table:
109
©Ahmed Hagag
Sim. a Multi-Server Queue (12/18)
Modeling and Simulation
Simulation Table:
110
©Ahmed Hagag
Sim. a Multi-Server Queue (13/18)
Modeling and Simulation
Simulation Table (62 minutes)
111
©Ahmed Hagag
Sim. a Multi-Server Queue (13/18)
Modeling and Simulation
Simulation Table (62 minutes)
112
©Ahmed Hagag
Sim. a Multi-Server Queue (13/18)
Modeling and Simulation
Simulation Table (62 minutes)
113
©Ahmed Hagag
Sim. a Multi-Server Queue (13/18)
Modeling and Simulation
Simulation Table (62 minutes)
Able
Baker
114
©Ahmed Hagag
Sim. a Multi-Server Queue (13/18)
Modeling and Simulation
Simulation Table (62 minutes)
115
©Ahmed Hagag
Sim. a Multi-Server Queue (14/18)
Modeling and Simulation
The analysis of simulation table results in the following:
1. Over the 62-minute period Able was busy 90% of the
time.
2. Baker was busy only 69% of the time. The seniority
rule keeps Baker less busy (and gives Able more tips).
3. Nine of the 26 arrivals (about 35%) had to wait. The
average waiting time for all customers was only about
0.42 minute (25 seconds), which is very small.
116
©Ahmed Hagag
Sim. a Multi-Server Queue (15/18)
Modeling and Simulation
The analysis of simulation table results in the following:
4. Those nine who did have to wait only waited an
average of 1.22 minutes, which is quite low.
5. In summary, this system seems well balanced. One
server cannot handle all the calls, and three servers
would probably be too many. Adding an additional
server would surely reduce the waiting time to nearly
zero. However, the cost of waiting would have to be
quite high to justify an additional server.
117
©Ahmed Hagag
Sim. a Multi-Server Queue (16/18)
Modeling and Simulation
Simulation run for 100 calls:
‱ 62% of callers had no delay.
‱ 12% of callers had a delay
up to 2 minutes.
118
©Ahmed Hagag
Sim. a Multi-Server Queue (16/18)
Modeling and Simulation
Simulation run for 100 calls:
‱ 62% of callers had no delay.
‱ 12% of callers had a delay
up to 2 minutes.
For example:
Average waiting time
= 2 minutes
119
©Ahmed Hagag
Sim. a Multi-Server Queue (17/18)
Modeling and Simulation
400 simulation trials of 100 caller:
1. Average waiting time = 2 minutes.
2. Average waiting time = 1.7 minutes.
3. Average waiting time = 1.9 minutes.
4. Average waiting time = 2.5 minutes.
5. Average waiting time = 1.5 minutes.


400. Average waiting time = 2.7 minutes.
120
©Ahmed Hagag
Sim. a Multi-Server Queue (18/18)
Modeling and Simulation
400 simulation trials of 100 caller:
‱ 80.5% of callers had delay up to 1 minute.
‱ 19.5% of callers had delay more than 1 minute.
121
©Ahmed Hagag
Quiz 1 Question
Modeling and Simulation
Try other rules:
Baker gets call if both are idle
Due date:
Dr. Ahmed Hagag
ahagag@fci.bu.edu.eg

More Related Content

PPTX
Modeling_Simulation_ch3_lecture_1.pptx
PDF
4-Queuing-System-ioenotes.pdf
PDF
08_Queueing_Models.pdf
PPT
Queuing Theory by Dr. B. J. Mohite
DOCX
Chapter 18Waiting Lines© McGraw-Hill Education. All rights r
PPTX
supply chain management and its sheduling process
DOCX
Queuing theory
PDF
Solving Of Waiting Lines Models in the Bank Using Queuing Theory Model the Pr...
Modeling_Simulation_ch3_lecture_1.pptx
4-Queuing-System-ioenotes.pdf
08_Queueing_Models.pdf
Queuing Theory by Dr. B. J. Mohite
Chapter 18Waiting Lines© McGraw-Hill Education. All rights r
supply chain management and its sheduling process
Queuing theory
Solving Of Waiting Lines Models in the Bank Using Queuing Theory Model the Pr...

Similar to BU_FCAI_SCC430_Modeling&Simulation_Ch03.pdf (20)

PPTX
Queuing theory
PPTX
Waiting Lines.pptx
PDF
Algorithms Analysis.pdf
PPT
Management Course-314- Supply Chain Management
PPTX
Lesson-4-Queuing-Theory-Student-copy.pptx
PDF
Algo trading(Minor Project) strategy EMA with Ipython
PPT
Opersea report waiting lines and queuing theory
PPTX
chapter11 liner model programing.pptx
PDF
queueing problems in banking
PPTX
DES
PDF
Simulation chapter 4
PPTX
QUEUEING THEORY
PPTX
Lean in fishing net
PDF
A Case Study of Employing A Single Server Nonpreemptive Priority Queuing Mode...
PDF
Decision Sciences_SBS_9.pdf
PPT
Waiting Line Management
PDF
Operations Research_18ME735_module 4 - queuing systems.pdf
PDF
Modeling of assembly line balancing for optimized number of stations and time
PPTX
Queueing Theory and its BusinessS Applications
PPT
10 Waiting Lines Models in Queuing Theort
Queuing theory
Waiting Lines.pptx
Algorithms Analysis.pdf
Management Course-314- Supply Chain Management
Lesson-4-Queuing-Theory-Student-copy.pptx
Algo trading(Minor Project) strategy EMA with Ipython
Opersea report waiting lines and queuing theory
chapter11 liner model programing.pptx
queueing problems in banking
DES
Simulation chapter 4
QUEUEING THEORY
Lean in fishing net
A Case Study of Employing A Single Server Nonpreemptive Priority Queuing Mode...
Decision Sciences_SBS_9.pdf
Waiting Line Management
Operations Research_18ME735_module 4 - queuing systems.pdf
Modeling of assembly line balancing for optimized number of stations and time
Queueing Theory and its BusinessS Applications
10 Waiting Lines Models in Queuing Theort
Ad

More from MaiGaafar (11)

PPTX
Modeling&Simulation_Ch01_lecture 2.pptx
PPT
Lecture 01 - Introduction and Review.ppt
PPTX
Introduction to Time Series Analysis.pptx
PPTX
strategic-planning_chp (1).pptx
PPTX
BU_FCAI_SCC430_Modeling&Simulation_Ch05-P2.pptx
PPTX
HU200-Introduction-2020-2021.pptx
PPTX
sm-161216124538.pptx
PPTX
Modeling&Simulation_Ch01_part 3.pptx
PPTX
HU200-Supply-modified2020.pptx
PPTX
BU_FCAI_SCC430_Modeling&Simulation_Ch06.pptx
PPTX
Modeling&Simulation_Ch04 (1). part 2pptx.pptx
Modeling&Simulation_Ch01_lecture 2.pptx
Lecture 01 - Introduction and Review.ppt
Introduction to Time Series Analysis.pptx
strategic-planning_chp (1).pptx
BU_FCAI_SCC430_Modeling&Simulation_Ch05-P2.pptx
HU200-Introduction-2020-2021.pptx
sm-161216124538.pptx
Modeling&Simulation_Ch01_part 3.pptx
HU200-Supply-modified2020.pptx
BU_FCAI_SCC430_Modeling&Simulation_Ch06.pptx
Modeling&Simulation_Ch04 (1). part 2pptx.pptx
Ad

Recently uploaded (20)

PDF
PakistanCoinageAct-906.pdfdbnsshsjjsbsbb
PPT
Hypersensitivity Namisha1111111111-WPS.ppt
PDF
Maxon CINEMA 4D 2025 Crack Free Download Latest Version
PDF
ICT grade for 8. MATATAG curriculum .P2.pdf
PPTX
Unit-1.pptxgeyeuueueu7r7r7r77r7r7r7uriruru
PPTX
"Fundamentals of Digital Image Processing: A Visual Approach"
PPTX
Group 4 [BSIT-1C] Computer Network (1).pptx
DOCX
A PROPOSAL ON IoT climate sensor 2.docx
PPTX
Operating System Processes_Scheduler OSS
DOCX
fsdffdghjjgfxfdghjvhjvgfdfcbchghgghgcbjghf
PPTX
Clauses_Part1.hshshpjzjxnznxnxnndndndndndndndnndptx
PDF
ISS2022 present sdabhsa hsdhdfahasda ssdsd
PPTX
AIR BAG SYStYEM mechanical enginweering.pptx
PDF
Tcl Scripting for EDA.pdf
PPTX
Entre CHtzyshshshshshshshzhhzzhhz 4MSt.pptx
PPTX
5. MEASURE OF INTERIOR AND EXTERIOR- MATATAG CURRICULUM.pptx
PDF
Presented by ATHUL KRISHNA.S_20250813_191657_0000.pdf
PPTX
New professional education PROF-ED-7_103359.pptx
PDF
Printing Presentation to show beginners.
PPTX
Wireless and Mobile Backhaul Market.pptx
PakistanCoinageAct-906.pdfdbnsshsjjsbsbb
Hypersensitivity Namisha1111111111-WPS.ppt
Maxon CINEMA 4D 2025 Crack Free Download Latest Version
ICT grade for 8. MATATAG curriculum .P2.pdf
Unit-1.pptxgeyeuueueu7r7r7r77r7r7r7uriruru
"Fundamentals of Digital Image Processing: A Visual Approach"
Group 4 [BSIT-1C] Computer Network (1).pptx
A PROPOSAL ON IoT climate sensor 2.docx
Operating System Processes_Scheduler OSS
fsdffdghjjgfxfdghjvhjvgfdfcbchghgghgcbjghf
Clauses_Part1.hshshpjzjxnznxnxnndndndndndndndnndptx
ISS2022 present sdabhsa hsdhdfahasda ssdsd
AIR BAG SYStYEM mechanical enginweering.pptx
Tcl Scripting for EDA.pdf
Entre CHtzyshshshshshshshzhhzzhhz 4MSt.pptx
5. MEASURE OF INTERIOR AND EXTERIOR- MATATAG CURRICULUM.pptx
Presented by ATHUL KRISHNA.S_20250813_191657_0000.pdf
New professional education PROF-ED-7_103359.pptx
Printing Presentation to show beginners.
Wireless and Mobile Backhaul Market.pptx

BU_FCAI_SCC430_Modeling&Simulation_Ch03.pdf

  • 1. SCC430 Modeling and Simulation Chapter 03 Queueing Simulation Dr. Ahmed Hagag Faculty of Computers and Artificial Intelligence Benha University Fall 2020
  • 2. ‱ Introduction. ‱ Description of Queuing System. ‱ Simulating a Single-Server Queue. ✓ Example. ‱ Simulating a Queue with Multi-Servers. ✓ Example. 2 ©Ahmed Hagag Modeling and Simulation Chapter 3: Queueing Simulation
  • 3. 3 ©Ahmed Hagag Introduction (1/3) Modeling and Simulation Queueing Model: ‱ Simulation is often used in the analysis of queueing models. In a simple but typical queueing model, customers arrive from time to time and join a queue (waiting line), are eventually served, and finally leave the system.
  • 4. 4 ©Ahmed Hagag Introduction (2/3) Modeling and Simulation ‱ Queueing models, whether solved mathematically or analyzed through simulation, provide the analyst with a powerful tool for designing and evaluating the performance of queueing systems. ‱ Typical measures of system performance include server utilization (percentage of time a server is busy), length of waiting lines, and delays of customers.
  • 5. 5 ©Ahmed Hagag Introduction (3/3) Modeling and Simulation ‱ Quite often, when designing to improve a queueing system, the analyst (or decision maker) is involved in tradeoffs between server utilization and customer satisfaction in terms of line lengths and delays.
  • 6. 6 ©Ahmed Hagag Description of Queuing Sys (1/8) Modeling and Simulation ‱ The key elements of a queueing system are the customers and servers. ‱ The term customer can refer to people, machines, trucks, mechanics, patients, airplanes, e-mail, cases, or orders— anything that arrives at a facility and requires service. ‱ The term server might refer to receptionists, repair personnel, mechanics, medical personnel, runways at an airport, automatic packers, order pickers, or CPUs in a computer—any resource (person, machine, etc.) that provides the requested service.
  • 7. 7 ©Ahmed Hagag Description of Queuing Sys (2/8) Modeling and Simulation Queueing System: 1. The Calling Population. 2. System Capacity. 3. The Arrival Process. 4. Queue Behavior and Queue Discipline. 5. Service Times and the Service Mechanism.
  • 8. 8 ©Ahmed Hagag Description of Queuing Sys (3/8) Modeling and Simulation 1. The Calling Population (1/3): ‱ Also called: Input source (source of customers). ‱ The population of potential customers, referred to as the calling population, may be assumed to be finite or infinite.
  • 9. 9 ©Ahmed Hagag Description of Queuing Sys (3/8) Modeling and Simulation 1. The Calling Population (2/3): ‱ Infinite size: ➱ Simulation assumptions: If a unit leaves the calling population and joins the waiting line or enters service, there is no change in the arrival rate of other units that may need service. ➱ Most simulated models. ‱ Finite size: ➱ Less common and complicates the simulation.
  • 10. 10 ©Ahmed Hagag Description of Queuing Sys (3/8) Modeling and Simulation 1. The Calling Population (3/3): ‱ The main difference between finite and infinite population models is how the arrival rate is defined. In an infinite population model, the arrival rate (i.e., the average number of arrivals per unit of time) is not affected by the number of customers who have left the calling population and joined the queueing system.
  • 11. 11 ©Ahmed Hagag Description of Queuing Sys (4/8) Modeling and Simulation 2. System Capacity: ‱ Is the maximum number of units that can be accommodated in the system. ‱ In many queueing systems, there is a limit to the number of customers that may be in the waiting line or system. ‱ It’s unlimited capacity if the system can accommodate any number of units in the waiting line.
  • 12. 12 ©Ahmed Hagag Description of Queuing Sys (5/8) Modeling and Simulation 3. The Arrival Process: ‱ The arrival process for infinite-population models is usually characterized in terms of interarrival times of successive customers. Arrivals may occur at scheduled times or at random times. When at random times, the interarrival times are usually characterized by a probability distribution.
  • 13. 13 ©Ahmed Hagag Description of Queuing Sys (6/8) Modeling and Simulation 4. Queue Behavior and Queue Discipline (1/2): ‱ Queue behavior refers to the actions of customers while in a queue waiting for service to begin. In some situations, there is a possibility that incoming customers will balk (leave when they see that the line is too long), renege (leave after being in the line when they see that the line is moving too slowly), or jockey (move from one line to another if they think they have chosen a slow line).
  • 14. 14 ©Ahmed Hagag Description of Queuing Sys (6/8) Modeling and Simulation 4. Queue Behavior and Queue Discipline (2/2): ‱ Queue discipline refers to the logical ordering of customers in a queue and determines which customer will be chosen for service when a server becomes free. ‱ Common queue disciplines include first-in-first-out (FIFO), last-in-first-out (LIFO), service in random order (SIRO), shortest processing time first (SPT), and service according to priority (PR).
  • 15. 15 ©Ahmed Hagag Description of Queuing Sys (7/8) Modeling and Simulation 5. Service Times and the Service Mechanism (1/3): ‱ The service times of successive arrivals are denoted by 𝑆1, 𝑆2, 𝑆3, . . . . They may be constant or of random duration. In the latter case, {𝑆1, 𝑆2, 𝑆3, . . . } is usually characterized as a sequence of independent and identically distributed random variables. ‱ In addition, in some systems, service times depend upon the time of day or upon the length of the waiting line.
  • 16. 16 ©Ahmed Hagag Description of Queuing Sys (7/8) Modeling and Simulation 5. Service Times and the Service Mechanism (2/3): ‱ A queueing system consists of a number of service centers and interconnecting queues. Each service center consists of some number of servers, 𝑐, working in parallel; that is, upon getting to the head of the line, a customer takes the first available server. 𝒄 = 𝟑
  • 17. 17 ©Ahmed Hagag Description of Queuing Sys (7/8) Modeling and Simulation 5. Service Times and the Service Mechanism (3/3):
  • 18. 18 ©Ahmed Hagag Description of Queuing Sys (7/8) Modeling and Simulation A notational system for parallel server systems: A/B/c/N/K. These letters represent the following system characteristics:
  • 19. 19 ©Ahmed Hagag Description of Queuing Sys (8/8) Modeling and Simulation Queuing System State (1/3): ‱ The quantities (variables) that collectively completely describe the system at any given instant from the viewpoint of the study objectives: ➱ Number of units in the system: How many units are currently in the queue or being processed by the server. ➱ Status of server (idle, busy): Is the server(s) busy with processing some units or idle waiting for a job.
  • 20. 20 ©Ahmed Hagag Description of Queuing Sys (8/8) Modeling and Simulation Queuing System State (2/3):
  • 21. 21 ©Ahmed Hagag Description of Queuing Sys (8/8) Modeling and Simulation Queuing System State (3/3):
  • 22. 22 ©Ahmed Hagag Sim. a Single-Server Queue (1/14) Modeling and Simulation Simulation Table (1/3): ‱ The following table was designed as a simulation table specifically for a single-channel queue that serves customers on a first-in–first-out (FIFO) basis.
  • 23. 23 ©Ahmed Hagag Sim. a Single-Server Queue (1/14) Modeling and Simulation Simulation Table (2/3):
  • 24. 24 ©Ahmed Hagag Sim. a Single-Server Queue (1/14) Modeling and Simulation Simulation Table (3/3):
  • 25. 25 ©Ahmed Hagag Sim. a Single-Server Queue (2/14) Modeling and Simulation Example1 The Grocery Checkout, a Single-Server Queue:
  • 26. 26 ©Ahmed Hagag Sim. a Single-Server Queue (3/14) Modeling and Simulation ‱ A small grocery store has one checkout counter. Customers arrive at the checkout counter at random times that range from 1 to 8 minutes apart. We assume that interarrival times are integer-valued with each of the 8 values having equal probability; this is a discrete uniform distribution.
  • 27. 27 ©Ahmed Hagag Sim. a Single-Server Queue (3/14) Modeling and Simulation ‱ A small grocery store has one checkout counter. Customers arrive at the checkout counter at random times that range from 1 to 8 minutes apart. We assume that interarrival times are integer-valued with each of the 8 values having equal probability; this is a discrete uniform distribution.
  • 28. 28 ©Ahmed Hagag Sim. a Single-Server Queue (3/14) Modeling and Simulation ‱ A small grocery store has one checkout counter. Customers arrive at the checkout counter at random times that range from 1 to 8 minutes apart. We assume that interarrival times are integer-valued with each of the 8 values having equal probability; this is a discrete uniform distribution.
  • 29. 29 ©Ahmed Hagag Sim. a Single-Server Queue (4/14) Modeling and Simulation Distribution of Time Between Arrivals
  • 30. 30 ©Ahmed Hagag Sim. a Single-Server Queue (5/14) Modeling and Simulation Time-Between-Arrivals Determination
  • 31. 31 ©Ahmed Hagag Sim. a Single-Server Queue (6/14) Modeling and Simulation ‱ The service times vary from 1 to 6 minutes (also integer- valued), with the probabilities shown in the following table.
  • 32. 32 ©Ahmed Hagag Sim. a Single-Server Queue (7/14) Modeling and Simulation Service Time Distribution
  • 33. 33 ©Ahmed Hagag Sim. a Single-Server Queue (8/14) Modeling and Simulation Service Times Generated
  • 34. 34 ©Ahmed Hagag Sim. a Single-Server Queue (9/14) Modeling and Simulation Simulation Table for Queueing Problem (20 customers)
  • 35. 35 ©Ahmed Hagag Sim. a Single-Server Queue (9/14) Modeling and Simulation Simulation Table for Queueing Problem (20 customers)
  • 36. 36 ©Ahmed Hagag Sim. a Single-Server Queue (9/14) Modeling and Simulation Simulation Table for Queueing Problem (20 customers)
  • 37. 37 ©Ahmed Hagag Sim. a Single-Server Queue (9/14) Modeling and Simulation Simulation Table for Queueing Problem (20 customers)
  • 38. 38 ©Ahmed Hagag Sim. a Single-Server Queue (9/14) Modeling and Simulation Simulation Table for Queueing Problem (20 customers)
  • 39. 39 ©Ahmed Hagag Sim. a Single-Server Queue (9/14) Modeling and Simulation Simulation Table for Queueing Problem (20 customers)
  • 40. 40 ©Ahmed Hagag Sim. a Single-Server Queue (9/14) Modeling and Simulation Simulation Table for Queueing Problem (20 customers)
  • 41. 41 ©Ahmed Hagag Sim. a Single-Server Queue (9/14) Modeling and Simulation Simulation Table for Queueing Problem (20 customers)
  • 42. 42 ©Ahmed Hagag Sim. a Single-Server Queue (9/14) Modeling and Simulation Simulation Table for Queueing Problem (20 customers) Total Run Time of Simulation
  • 43. 43 ©Ahmed Hagag Sim. a Single-Server Queue (10/14) Modeling and Simulation Some of the findings from the simulation are as follows (1/7):
  • 44. 44 ©Ahmed Hagag Sim. a Single-Server Queue (10/14) Modeling and Simulation Some of the findings from the simulation are as follows (2/7):
  • 45. 45 ©Ahmed Hagag Sim. a Single-Server Queue (10/14) Modeling and Simulation Some of the findings from the simulation are as follows (3/7):
  • 46. 46 ©Ahmed Hagag Sim. a Single-Server Queue (10/14) Modeling and Simulation Some of the findings from the simulation are as follows (4/7): This result can be compared with the expected service time by finding the mean of the service-time distribution using the equation:
  • 47. 47 ©Ahmed Hagag Sim. a Single-Server Queue (10/14) Modeling and Simulation Some of the findings from the simulation are as follows (5/7):
  • 48. 48 ©Ahmed Hagag Sim. a Single-Server Queue (10/14) Modeling and Simulation Some of the findings from the simulation are as follows (6/7):
  • 49. 49 ©Ahmed Hagag Sim. a Single-Server Queue (10/14) Modeling and Simulation Some of the findings from the simulation are as follows (7/7):
  • 50. 50 ©Ahmed Hagag Sim. a Single-Server Queue (11/14) Modeling and Simulation ‱ Our objective is to analyze the system by simulating the arrival and service of 100 customers and to compute a variety of typical measures of performance for queueing models. ➱ In actuality, 100 customers may be too small a sample size to draw reliable conclusions. Depending on our objectives, the accuracy of the results may be enhanced by increasing the sample size (number of customers), or by running multiple trials (or replications).
  • 51. 51 ©Ahmed Hagag Sim. a Single-Server Queue (12/14) Modeling and Simulation ‱ Our objective is to analyze the system by simulating the arrival and service of 100 customers and to compute a variety of typical measures of performance for queueing models. ➱ A second issue is that of initial conditions. A simulation of a grocery store that starts with an empty system may or may not be realistic unless the intention is to model the system from startup or to model until steady-state operation is reached. Here, to keep calculations simple, the starting conditions are an empty grocery, and any concerns are overlooked.
  • 52. 52 ©Ahmed Hagag Sim. a Single-Server Queue (13/14) Modeling and Simulation Simulation Table for Queueing Problem (100 customers)
  • 53. 53 ©Ahmed Hagag Sim. a Single-Server Queue (14/14) Modeling and Simulation Some of the findings from the simulation are as follows (1/4):
  • 54. 54 ©Ahmed Hagag Sim. a Single-Server Queue (14/14) Modeling and Simulation Some of the findings from the simulation are as follows (1/4):
  • 55. 55 ©Ahmed Hagag Sim. a Single-Server Queue (14/14) Modeling and Simulation Some of the findings from the simulation are as follows (2/4): Interval (0, 2]
  • 56. 56 ©Ahmed Hagag Sim. a Single-Server Queue (14/14) Modeling and Simulation Some of the findings from the simulation are as follows (2/4): Interval (2, 4]
  • 57. 57 ©Ahmed Hagag Sim. a Single-Server Queue (14/14) Modeling and Simulation Some of the findings from the simulation are as follows (2/4):
  • 58. 58 ©Ahmed Hagag Sim. a Single-Server Queue (14/14) Modeling and Simulation ‱ We are now interested in running an experiment to address the question of how the average time in queue for the first 100 customers varies from day to day. ‱ Running once with 100 customers corresponds to one day. Running it 50 times corresponds to 50 days, where each trial represents one day. ‱ The overall average waiting time over 50 trials was 1.32 minutes. Some of the findings from the simulation are as follows (3/4):
  • 59. 59 ©Ahmed Hagag Sim. a Single-Server Queue (14/14) Modeling and Simulation Some of the findings from the simulation are as follows (4/4):
  • 60. 60 ©Ahmed Hagag Sim. a Single-Server Queue (14/14) Modeling and Simulation Some of the findings from the simulation are as follows (4/4): Interval (0, 0.5]
  • 61. 61 ©Ahmed Hagag Sim. a Single-Server Queue (14/14) Modeling and Simulation Some of the findings from the simulation are as follows (4/4): Interval (0.5, 1]
  • 62. 62 ©Ahmed Hagag Sim. a Single-Server Queue (14/14) Modeling and Simulation Some of the findings from the simulation are as follows (4/4): Interval (1, 1.5]
  • 63. 63 ©Ahmed Hagag Sim. a Single-Server Queue (14/14) Modeling and Simulation Some of the findings from the simulation are as follows (4/4):
  • 64. 64 ©Ahmed Hagag Modeling and Simulation LAB What have you learned in the LAB yet?
  • 65. 65 ©Ahmed Hagag Review Example (1/11) Modeling and Simulation Distribution of Time Between Arrivals
  • 66. 66 ©Ahmed Hagag Review Example (2/11) Modeling and Simulation Distribution of Time Between Arrivals (Answer)
  • 67. 67 ©Ahmed Hagag Review Example (3/11) Modeling and Simulation Service-Time Distribution
  • 68. 68 ©Ahmed Hagag Review Example (4/11) Modeling and Simulation Service-Time Distribution (Answer)
  • 69. 69 ©Ahmed Hagag Review Example (5/11) Modeling and Simulation Simulation Table
  • 70. 70 ©Ahmed Hagag Review Example (6/11) Modeling and Simulation Simulation Table (Answer)
  • 71. 71 ©Ahmed Hagag Review Example (7/11) Modeling and Simulation Simulation Table (Answer)
  • 72. 72 ©Ahmed Hagag Review Example (8/11) Modeling and Simulation Simulation Table
  • 73. 73 ©Ahmed Hagag Review Example (9/11) Modeling and Simulation Simulation Table (Answer)
  • 74. 74 ©Ahmed Hagag Review Example (10/11) Modeling and Simulation Simulation Table (Answer)
  • 75. 75 ©Ahmed Hagag Review Example (11/11) Modeling and Simulation Results (1/2):
  • 76. 76 ©Ahmed Hagag Review Example (11/11) Modeling and Simulation Results (2/2): And compare with the expected service time And compare with the expected interarrivals time
  • 77. 77 ©Ahmed Hagag Sim. a Multi-Server Queue (1/18) Modeling and Simulation Queueing Model: ‱ Suppose that there are c channels operating in parallel. Arrivals will join a single queue and enter the first available service channel.
  • 78. 78 ©Ahmed Hagag Sim. a Multi-Server Queue (2/18) Modeling and Simulation Example: Call Center:
  • 79. 79 ©Ahmed Hagag Sim. a Multi-Server Queue (2/18) Modeling and Simulation Example: Call Center: ‱ Consider a Call Center where technical personnel take calls and provide service. ‱ Two technical support people (2 server) exists: ➱ Able more experienced, provides service faster, ➱ Baker newbie, provides service slower. ‱ Rule: ➱ Able gets call if both people are idle.
  • 80. 80 ©Ahmed Hagag Sim. a Multi-Server Queue (3/18) Modeling and Simulation Interarrival distribution of calls for technical support
  • 81. 81 ©Ahmed Hagag Sim. a Multi-Server Queue (3/18) Modeling and Simulation Interarrival distribution of calls for technical support
  • 82. 82 ©Ahmed Hagag Sim. a Multi-Server Queue (3/18) Modeling and Simulation Interarrival distribution of calls for technical support
  • 83. 83 ©Ahmed Hagag Sim. a Multi-Server Queue (4/18) Modeling and Simulation Service Distribution of Able Service Distribution of Baker
  • 84. 84 ©Ahmed Hagag Sim. a Multi-Server Queue (5/18) Modeling and Simulation The simulation: ‱ The problem is to find how well the current arrangement is working. To estimate the system measures of performance, a simulation of 1 hour of operation is made. A longer simulation would yield more reliable results, but for purposes of illustration a l-hour period has been selected.
  • 85. 85 ©Ahmed Hagag Sim. a Multi-Server Queue (6/18) Modeling and Simulation Simulation Table: Customer = Call
  • 86. 86 ©Ahmed Hagag Sim. a Multi-Server Queue (6/18) Modeling and Simulation Simulation Table: Interarrival Time
  • 87. 87 ©Ahmed Hagag Sim. a Multi-Server Queue (6/18) Modeling and Simulation Simulation Table: Time of Arrival
  • 88. 88 ©Ahmed Hagag Sim. a Multi-Server Queue (6/18) Modeling and Simulation Simulation Table: Service Time
  • 89. 89 ©Ahmed Hagag Sim. a Multi-Server Queue (6/18) Modeling and Simulation Simulation Table: Waiting Time
  • 90. 90 ©Ahmed Hagag Sim. a Multi-Server Queue (7/18) Modeling and Simulation Simulation Table:
  • 91. 91 ©Ahmed Hagag Sim. a Multi-Server Queue (7/18) Modeling and Simulation Simulation Table: Able Baker
  • 92. 92 ©Ahmed Hagag Sim. a Multi-Server Queue (7/18) Modeling and Simulation Simulation Table: Able Baker
  • 93. 93 ©Ahmed Hagag Sim. a Multi-Server Queue (7/18) Modeling and Simulation Simulation Table: Able Baker
  • 94. 94 ©Ahmed Hagag Sim. a Multi-Server Queue (7/18) Modeling and Simulation Simulation Table: Able Baker
  • 95. 95 ©Ahmed Hagag Sim. a Multi-Server Queue (7/18) Modeling and Simulation Simulation Table:
  • 96. 96 ©Ahmed Hagag Sim. a Multi-Server Queue (8/18) Modeling and Simulation Simulation Table:
  • 97. 97 ©Ahmed Hagag Sim. a Multi-Server Queue (8/18) Modeling and Simulation Simulation Table:
  • 98. 98 ©Ahmed Hagag Sim. a Multi-Server Queue (8/18) Modeling and Simulation Simulation Table:
  • 99. 99 ©Ahmed Hagag Sim. a Multi-Server Queue (8/18) Modeling and Simulation Simulation Table:
  • 100. 100 ©Ahmed Hagag Sim. a Multi-Server Queue (8/18) Modeling and Simulation Simulation Table:
  • 101. 101 ©Ahmed Hagag Sim. a Multi-Server Queue (8/18) Modeling and Simulation Simulation Table:
  • 102. 102 ©Ahmed Hagag Sim. a Multi-Server Queue (8/18) Modeling and Simulation Simulation Table: Able Baker
  • 103. 103 ©Ahmed Hagag Sim. a Multi-Server Queue (8/18) Modeling and Simulation Simulation Table: Able Baker
  • 104. 104 ©Ahmed Hagag Sim. a Multi-Server Queue (8/18) Modeling and Simulation Simulation Table: Able Baker
  • 105. 105 ©Ahmed Hagag Sim. a Multi-Server Queue (8/18) Modeling and Simulation Simulation Table:
  • 106. 106 ©Ahmed Hagag Sim. a Multi-Server Queue (9/18) Modeling and Simulation Simulation Table:
  • 107. 107 ©Ahmed Hagag Sim. a Multi-Server Queue (10/18) Modeling and Simulation Simulation Table:
  • 108. 108 ©Ahmed Hagag Sim. a Multi-Server Queue (11/18) Modeling and Simulation Simulation Table:
  • 109. 109 ©Ahmed Hagag Sim. a Multi-Server Queue (12/18) Modeling and Simulation Simulation Table:
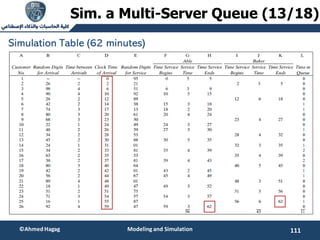
  • 110. 110 ©Ahmed Hagag Sim. a Multi-Server Queue (13/18) Modeling and Simulation Simulation Table (62 minutes)
  • 111. 111 ©Ahmed Hagag Sim. a Multi-Server Queue (13/18) Modeling and Simulation Simulation Table (62 minutes)
  • 112. 112 ©Ahmed Hagag Sim. a Multi-Server Queue (13/18) Modeling and Simulation Simulation Table (62 minutes)
  • 113. 113 ©Ahmed Hagag Sim. a Multi-Server Queue (13/18) Modeling and Simulation Simulation Table (62 minutes) Able Baker
  • 114. 114 ©Ahmed Hagag Sim. a Multi-Server Queue (13/18) Modeling and Simulation Simulation Table (62 minutes)
  • 115. 115 ©Ahmed Hagag Sim. a Multi-Server Queue (14/18) Modeling and Simulation The analysis of simulation table results in the following: 1. Over the 62-minute period Able was busy 90% of the time. 2. Baker was busy only 69% of the time. The seniority rule keeps Baker less busy (and gives Able more tips). 3. Nine of the 26 arrivals (about 35%) had to wait. The average waiting time for all customers was only about 0.42 minute (25 seconds), which is very small.
  • 116. 116 ©Ahmed Hagag Sim. a Multi-Server Queue (15/18) Modeling and Simulation The analysis of simulation table results in the following: 4. Those nine who did have to wait only waited an average of 1.22 minutes, which is quite low. 5. In summary, this system seems well balanced. One server cannot handle all the calls, and three servers would probably be too many. Adding an additional server would surely reduce the waiting time to nearly zero. However, the cost of waiting would have to be quite high to justify an additional server.
  • 117. 117 ©Ahmed Hagag Sim. a Multi-Server Queue (16/18) Modeling and Simulation Simulation run for 100 calls: ‱ 62% of callers had no delay. ‱ 12% of callers had a delay up to 2 minutes.
  • 118. 118 ©Ahmed Hagag Sim. a Multi-Server Queue (16/18) Modeling and Simulation Simulation run for 100 calls: ‱ 62% of callers had no delay. ‱ 12% of callers had a delay up to 2 minutes. For example: Average waiting time = 2 minutes
  • 119. 119 ©Ahmed Hagag Sim. a Multi-Server Queue (17/18) Modeling and Simulation 400 simulation trials of 100 caller: 1. Average waiting time = 2 minutes. 2. Average waiting time = 1.7 minutes. 3. Average waiting time = 1.9 minutes. 4. Average waiting time = 2.5 minutes. 5. Average waiting time = 1.5 minutes. 
 400. Average waiting time = 2.7 minutes.
  • 120. 120 ©Ahmed Hagag Sim. a Multi-Server Queue (18/18) Modeling and Simulation 400 simulation trials of 100 caller: ‱ 80.5% of callers had delay up to 1 minute. ‱ 19.5% of callers had delay more than 1 minute.
  • 121. 121 ©Ahmed Hagag Quiz 1 Question Modeling and Simulation Try other rules: Baker gets call if both are idle Due date: