


![
Formula:
X² = 𝑖=1
𝑛
[
𝑂𝑖 −𝐸𝑖 ²
𝐸𝑖
] Oi – observed value
Ei – expected value
i. - 1, 2, 3, …. n.
Alternative Formula:
X²=
N[ ad −bc ]²
𝐚+𝐜 𝐛+𝐝 𝐚+𝐛 [𝐜+𝐝]
N = [a + b + c + d]](https://image.slidesharecdn.com/chisquaretest-180622154959/85/Chi-square-test-28-320.jpg)


Chi square test
- 1. PG STUDENTS- DR YASMEEN CHAUDHARY DR DEEPAK WANI
- 2. History Introduction Chi Square distribution Goodness of fit test Pearson’s Chi square test of Independence Chi square test of Homogeneity Advantages of Chi square test Limitations of Chi square test Fischer Exact test Yate’s correction Contents
- 3. Chi Square Distribution…… First formulated by Friedrich Robert Helmert ( 1843 – 1917 ) Developed by Karl Pearson later in 1900 History
- 4. WHAT….. Simplest & most widely used statistical test Chi Square Test
- 5. Chi Square Test is used to test……. 1. Independence of attributes & 2. Goodness of fit of the distribution Used to estimate the statistical significance of population variance (Parametric X² test ) Why…..
- 6. Mostly used For discrete data Sample observations are independent of each other Constraints on cell frequencies should be linear Total frequency (N) should be greater than 50 The frequency in each cell should not be less than 5 If one of the cell frequencies is less than 5, it is mandatory to apply Yate’s correction When …..
- 7. How….. Define Null Hypothesis & Alternative Hypothesis Obtain expected frequencies Compute the values of X² test statistic Find out Degrees of freedom Obtain table value of X² Compare calculated X² with tabulated State & Interpret Result
- 8. Hypothesis Testing….. Tests a claim about a parameter using evidence ( data in a sample ) Association Random sample Summarizing the information Does the given information supports the hypothesis. Are we making any error? Decision Rule: Convert the research question to null & alternative hypothesis Where …..
- 9. Random sample data A sufficiently large sample size Adequate cell sizes Independent observations Non directional hypothesis Observations grouped in categories Assumptions Made…..
- 10. No negative values Mean is equal to degrees of freedom Standard deviation increases as degrees of freedom increases As the degrees of freedom become very large, the shape becomes very likely to the normal distribution Chi Square Distribution
- 11. e.g….. df = 3 df = 5 df = 10 c2
- 12. Denotes number of classes to which values can be arbitrarily assigned without breaching the imposed limitations Formula: ( df ) or ( n ) = ( n – k ) n = sample size OR k = no. of independent constrains ( df ) = ( c – 1 ) ( r – 1 ) c = no. of columns r = no. of rows Degrees of freedom
- 13. It gives distribution of values of Chi-square over a range of degrees of freedom and for different level of significance Chi Square table
- 14. Is the point which demarcates the acceptance region and the rejection region The area to the right of critical value is rejection region & the area to its left is acceptance region Critical Value
- 15. Used for Estimating the statistical significance of population variance Examines if a sample comes from a normal distribution with specified variance or a different variance Only applicable for samples drawn from populations that follow the normal distribution Chi square test of Variance
- 16. Formula: X² = s2 s (n – 1) s2 s - Sample variance s2 p s2 p - Population variance n - Sample size Steps: State the null & alternative hypothesis Calculate X2 value using formula Compare the calculated value of X² with tabulated value of X²
- 17. The haemoglobin levels ( in gm/dl ) of 8 patients are 10, 9, 11, 12, 8, 9, 7, & 10.test at 5% level of significance whether the variance of the haemoglobin levels of the population from which this sample was drawn is 11 gm/dl². Example
- 18. Chi Square goodness of fit test Pearson’s Chi Square test of independence Chi Square for Homogeneity Non Parametric c2 Tests
- 19. … it is positively skewed … it is non-negative … it is based on degrees of freedom …when the degrees of freedom change a new distribution is created …variance equals two times the number of degrees of freedom Characteristics of X² Test
- 20. Investigate the conformity of empirical distribution with a hypothesizes theoretical distribution It investigate conformity by comparing observed & expected frequency count Goodness of fit test
- 21. Calculate X² from given table & conclude whether there is any association between addiction of alcohol & liver cirrhosis. Example Addiction of Alcohol Liver Cirrhosis Total Present Absent No addiction 10 890 900 Drinking ≤ once a month 50 450 500 Drinking ≥ 2 to 5 times/month 80 320 400 Drinking 6 to 10 times a month 120 80 200 Total 260 1740 2000
- 22. Test the null hypothesis, that the row & column classification factor are independent Determines presence or absence of association between two attributes Does not measure the extent of association between attributes Pearson’s X² test of independence
- 23. Following table shows birth order of the child & congenital malformations seen. Comment whether there is any association between birth order & occurrence of congenital malformations. Example Birth order Babies with Congenital Malformations Babies without Congenital Malformations Total 1 10 490 500 2 20 480 500 3 30 470 500 4 40 460 500 5 50 450 500 6 60 440 500 Total 210 2790 3000
- 24. Determines whether two or more independent samples are drawn from the same populations or from different populations X² test of Homogeneity
- 25. A study was carried out on the relationship between migraine headaches in 96 subjects diagnosed with narcolepsy & 96 healthy controls. The results are shown in table, we wish to know if we may coclude on the basis of these data conclude that the narcolepsy population & healthy populations represented by the samples are not homogeneous with respect to migraine frequency Frequency of Migraine Headaches by Narcolepsy Status Example Reported Migraine Headaches Total Yes No Narcoleptic subjects 21 75 96 Healthy controls 19 77 96 Total 40 152 192
- 26. Difference X² test of Independence Tests the presence & absence of association between attributes Involves a single sample drawn from one population X² test of Homogeneity Tests whether two or more independent samples are drawn from the same population or not Involves two or more samples, perhaps drawn from the same or different population
- 27. Contingency ( 2x2 ) table is a two-way table with two rows & two columns Used to depict relationships between two attributes X² for 2x2 tables Total Variable-1 ( or control ) Yes No Total a b a + b c d c + d a + c b + d N Marginal totals Marginal totals Grand total
- 28. Formula: X² = 𝑖=1 𝑛 [ 𝑂𝑖 −𝐸𝑖 ² 𝐸𝑖 ] Oi – observed value Ei – expected value i. - 1, 2, 3, …. n. Alternative Formula: X²= N[ ad −bc ]² 𝐚+𝐜 𝐛+𝐝 𝐚+𝐛 [𝐜+𝐝] N = [a + b + c + d]
- 29. Researchers wanted to determine the impact of fall on lifestyle changes among Polio survivors. Table shows the results of a study of 233 polio survivors on whether fear of falling resulted in lifestyle changes….. Example Made Lifestyle Changes Because of Fear of Falling Total Yes No Fallers 131 52 183 Non Fallers 14 36 50 Total 145 88 233
- 30. Need: If the expected cell frequencies are below 5 If a 2 x 2 contingency table is being used Effect: This reduce chi-square value obtained and thus increases its ‘P’ values It prevents overestimation of statistical significance for small data Yate’s Correction
- 31. Formula for Yate’s Correction:
- 32. Yates correction may tend to overcorrect Fails to reject the null hypothesis when it should USES Used when at least one cell of 2x2 contingency table has an expected frequency less than 5 Limitations
- 33. Sternal surgical site infection after coronary artery bypass graft surgery is a complication. A study was carried out to examine two types of preoperative skin preparation before performing open heart surgery. These two preparations used aqueous iodine & insoluble iodine with the following results….. Example Comparison of Aqueous & Insoluble preparations Total Preparation group Infected Not Infected Aqueous iodine 14 94 108 Insoluble iodine 4 97 101 Total 18 191 209
- 34. The additive property of Chi-square Sum of Chi-square values will have a X² distribution with degrees of freedom equal to the sum of degrees of freedom of individual X² values Summation of values is suitable only if the sample are “independent” Additive property is valid only for uncorrected X² values Advantages of X² test
- 35. The chi-square test does not give us much information about the strength of the relationship. It only conveys the existence or nonexistence of the relationships between the variables investigated The chi-square test is sensitive to sample size The chi-square test is also sensitive to small expected frequencies. It can be used only when not more than 20% of the cells have an expected frequency of less than 5 Cannot be used when samples are related or matched Chi-square test is not valid for proportions Limitations of X² test
- 36. Why? Chi square test can not be used when sample size very small If any of expected frequency < 1 If > 20% of expected frequencies are < 5 Fischer’s exact test
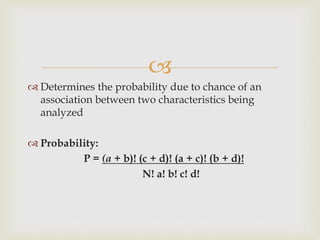
- 37. Determines the probability due to chance of an association between two characteristics being analyzed Probability: P = (a + b)! (c + d)! (a + c)! (b + d)! N! a! b! c! d!
- 38. The number of boys & girls who are regular in their physical exercises is distributed as given below…. Example Habit Boys Girls Total Exercise regularly 2 (a) 7 (b) 9 Do not exercise regularly 8 ( c ) 3 (d) 11 Total 10 10 20
- 39.
- 40. Thank you
- 41. J. Dixit, text book of Principles and Practice of Biostatistics, edition 7 pg. 135 to 145 W. Daniel, text book of basic concepts and methodology for the health sciences, edition 9th pg. 594 to 630 S. Kartikeyan, comprehensive text book of biostatistics & research methodology, 1st edition pg. 293 to 365 http://stattrek.com/chi-square-test/independence.aspx?Tutorial=AP http://math.hws.edu/javamath/ryan/ChiSquare.html http://www.ling.upenn.edu/~clight/chisquared.htm http://mathbench.umd.edu/modules/statistical- tests_chisquare_advanced/page14.htm https://www.zweigmedia.com/RealWorld/tutorialsf15e/frames7_5C.ht ml http://www.statisticssolutions.com/non-parametric-analysis-chi-square/ References
Editor's Notes
- #13: Degrees of freedom is nothing but the No. of independent observations which are used in statistic………
- #19: Since the value of chi square is derived from observations of sample of population, it is a statistic & not a parametric test…..
- #26: Narcolepsy is a disease involving disturbances of a sleep-wake cycle.
- #32: 2nd formula on board
- #33: This can result in a middle-of-the-road result that fails to reject the null hypothesis when it should…….
- #34: Use alternate formula…