SlideShare a Scribd company logo
Company
Marketing
Analysis Report
Your Company Name
This slide is 100% editable. Adapt
it to your needs and capture your
audience's attention.
About Us
01
This slide is 100% editable. Adapt
it to your needs and capture your
audience's attention.
Ideas For Success
02
This slide is 100% editable. Adapt
it to your needs and capture your
audience's attention.
Partnership Contract
03
This slide is 100% editable. Adapt
it to your needs and capture your
audience's attention.
Measuring Growth
04
This slide is 100% editable. Adapt
it to your needs and capture your
audience's attention.
Goals For 2017
05
This slide is 100% editable. Adapt
it to your needs and capture your
audience's attention.
Results
06
This is a representative image,
and should be replaced by your
own image. Just right click and
replace image.
Agenda
2
October 2017
SUN MON TUE WED THU FRI SAT
1
2
Blog Post Write e-
Book
3
Blog Post e-Book
5 Pitches
4
Blog Post Write e-
Book
5
Blog Post Write e-
Book
6
Blog Post Write e-
Book
7
8
9
Blog Post Write e-
Book
10
Write e- Book 10
Cold Calls
11
Blog Post Write e-
Book
12
Blog Post Write e-
Book
13
Write e- Book
14
15
16
Blog Post Edit e-
Book
17
Edit e Book 5
Pitches
18
Blog Post Format
e- Book
19
Format e- Book
20
Blog Post e-Book
Pre-Launch
21
22
23
E- Book Pre-
Launch 10 Cold
Calls
24
Blog Post e-Book
Pre- Launch
25
Blog Post Launch
e- Book
26
Promote e- Book
27
Blog Post Promote
e- Book
28
29 30
Promote e- Book
31
Blog Post Promote
e-Book
Monthly
Marketing
Calendar
This is a representative image,
and should be replaced by your
own image. Just right click and
replace image.
3
Sales Performance Reporting
0 40 80 120
Jacob
Emma
Michael
Isabella$10,132.00
$52,035.00
$15,432.00
$55,413.00
Top Sales Reps
8%
14%
12%
22%
58%
Plan1
Plan2
Plan3
Plan4
Plan5
Top Selling Plans
1,827 , 210%
New customers
0
5
10
15
20
25
30
35
Jan
Feb
Mar
Apr
May
Jun
Jul
Aug
Sep
Oct
Nov
Dec
New Customers
Company 1 $10,111.00
Company 2 $12,140.00
Company 3 $70,030.00
Company 4 $55,410.00
Company 5 $02,000.00
Company 6 $55,000.00
Company 7 $89,510.00
Company 8 $31,611.00
Company Value
Top Opportunities
Visitors (100%)
Leads (26%)
Repeat
Customer (13%)
Customer
(6%)
Sales Funnel Sales Goal YTD
0
100
50
Low
Medium
High
90%
4
Sales By Region
1
BRAZIL
4
AFRICA
14
RUSSIA
$134 BILLION
$106 BILLION
$665 BILLION
$540 BILLION
$106 BILLION
This slide is 100% editable. Adapt it to your needs and capture your audience's attention.
5
8
AUSTRALIA
2
USA
US Sales By Regions
80%
Higher Sales
This slide is 100% editable. Adapt
it to your needs and capture your
audience's attention.
75%
Medium Sales
This slide is 100% editable. Adapt
it to your needs and capture your
audience's attention.
30%
Lowest Sales
This slide is 100% editable. Adapt
it to your needs and capture your
audience's attention.
Washington
Montana
California
New
Mexico
Texas
Oklahoma
Kansas
Nebraska
South Dakota
North Dakota
Minnesota
Iowa
Missouri
Arkansas
Louisiana
Wisconsin
Illinois
Michigan
Ohio
6
35%
70%
95%
55%
This graph/chart is linked to excel,
and changes automatically based on
data. Just left click on it and select
“Edit Data”.
This graph/chart is linked to excel,
and changes automatically based
on data. Just left click on it and
select “Edit Data”.
This graph/chart is linked to excel,
and changes automatically based
on data. Just left click on it and
select “Edit Data”.
This graph/chart is linked to excel,
and changes automatically based
on data. Just left click on it and
select “Edit Data”.
Key
Financial
This slide is 100% editable.
Adapt it to your needs and
capture your audience's
attention.
7
Key Deliverables and Timeline
Week 1 Week 2 Week 3 Week4 Week 5 Week 6 Week 7
Catering Prep
Budget
Agenda
Everything
Reverts Prep
Invitation
Registration
Collateral
Prep
A/V
estimate
15/10/2017
Website
Registration Up
19/10/2017
Send
invitations in
20/10/2017
Keynote
Requirements
28/10/2017
Establish
Speakers
26/10/2017
18/10/2017
Engage production
company
22/10/2017
Evening event,
locations
23/10/2017
Final Agenda
27/10/2017
Initial Menu
23/10/2017
Venue Walk
Through
8
Return On Investment
Investment
Sales
Interest
calculation
Success
Capital
Return
ROI = Gain From Investment
Cost Of Investment
9
Product Wise Performance
This graph/chart is linked to excel, and changes automatically based on data. Just left click on it and select “Edit Data”.
0
2
4
6
8
10
12
14
16
Q1 Q2 Q3 Q4
AnnualRunRateIn
Percentage
Year 2017
Product 1 Product 2 Product 3 Product 4
Product Wise PerformanceProduct Wise Performance
Year 2017
1st Qtr 2nd Qtr 3rd Qtr 4th Qtr
25% 30%
20%25%
10
Marketing Roadmap
0% 10% 20% 30% 40% 50% 60% 70% 80% 90% 100%
Jan
Feb
Mar
Apr
May
Jun
Jul
Aug This slide is 100% editable.
This slide is 100% editable.
This slide is 100% editable.This slide is 100% editable.
This slide is 100% editable.
11
Website Performance Review
0
2
4
6
8
10
12
14
16
18
20
JAN FEB MAR APR MAY JUN JUL AUG SEP
Series 1
Series 2
Site Consumption -TrendTraffic sources
10%
13% 7%
15%
25%
30%
0
10
20
30
40
50
60
70
JAN FEB MAR APR MAY JUNE JULY AUG SEP OCT NOV DEC
Average Visit Time
0
20
40
60
80
100
J A N FE B MA R A P R MA Y J UN J UL A UG S E P
Product 01 Product 02
Organic BrandedOnline Transaction
0
100
50
Low
Medium
High
90%
12
Website Performance Review
Demanded de submission - auto (goal 1)
2.4
Demanded de submission - habit (goal 2) 3.5
Quills putt personnel (goal 3) 5.5
Quills budget personnel (goal 4) 6.3
Quill putt automobile (goal 5) 7.5
Visits
0
2
4
6
8
10
12
14
16
18
55%
Previous year
11%
Previous month
Tap Converting Goals
Visits
10%
13% 7%
15%
25%
30%
0
1
2
Category 01 Category 02 Category 03 Category 04
Conversion RateAverage Visit Value
0
100
50
Low
Medium
High
90%
13
Search Engine Rankings
Keyword- URL Benchmark
Aug-
16
Sep-
16
Oct-
16
Nov-
16
Dec-
16
Jan-
17
MOM BM
Text Here Text Here - - - - - - - 42 -
Text Here Text Here - - - - 34 26 22 23 -
Text Here Text Here - - - - - - 49 - -
Ranking by specific search engine and search term
Position /
month
Benchmark
Aug-
16
Sep-
16
Oct-
16
Nov-
16
Dec-
16
Jan-
17
MOM BM
Position 1 160 - 225 225 218 229 83 9% 55%
Position 2 34 55 63 60 55 62 52 -47% 104%
Position 3 45 16 38 37 37 48 27 Nc 35%
0
20
40
60
80
Jan Feb Mar Apr May
Series 3
Series 2
Series 1
Summary top 3 resultsSearch engine ranking
14
Monthly Traffic Source Overview
Sources Visits % Visits
(Direct) (none) 3,581 55.67%
Google (organic) 4,258 40.32%
Vine press. Net 360 2.10%
Yahoo (organic) 96 0.92%
Bing (organic) 56 0.99%
This graph/chart is linked to excel, and changes
automatically based on data. Just left click on it and
select “Edit Data”.
Top traffic sources
20%
35%
45%
✓ Direct traffic
✓ Referring sites
✓ Search engines
All traffic sources sent a total of 11,278 visits
Traffic sources overview
0
50
100
DecNovOctSepAugJulJunMayAprMarFebJan
InPercentage
Traffic
Converting Traffic
15
Organic Visits And Backlinks
12%
8%
15%
10%
20%
35%
Bing 6%
356 Visits
5,584 Visits
Google 85%
Yahoo 2%
91 Visits
Search 4%
76 Visits
Ask 2%
35 Visits
Other 4%
26 Visits
This graph/chart is linked to excel, and changes automatically based on data. Just left click on it and select “Edit Data”.
16
0
5
10
15
20
25
30
35
40
45
50
Rank Domain
authority
Backlinks
(Google)
Backlinks
(Yahoo)
6.2 45 1,584 3,853
New Customer By Source
15
25
35
45
55
65
85
0
10
20
30
40
50
60
70
80
90
100
Events SEO/PPC Direct Mail Website Email Social Adertising
17
Website Update Plan
Website Upgrade Strategy PowerPoint Slide Influencers
Loading..
18
Email Marketing Report
1099Opens
73.86%Click Rate
608Unopened
2.5%Bounces
40%
10%
20%
30%
19
This slide is 100% editable. Adapt it to your needs and capture your audience's attention.
Email Marketing Performance Chart
9.6
9 8.9
8.4
8
7.6
7.2
6
5.6
9
8.5
8
7.5
7
6.5
6
5.5
2.4
7.8
7.4
6.8
6.4
5.8
5.4
4.8
4.4
3.8
0
2
4
6
8
10
12
Clickthrough
Rate
Open Rate Delivery Rate Click Per Email Post-Click
Conversion
Rate
Click Per Link In
Email
Revenue Per
Email
Response By
List Segment
Social Sharing
Rate
Strategic Phase Transition Phase Trial Phase
20
Monthly Pipeline Summary
Discovery
Pre-Qualification
Qualification
Solution Design
Evaluation
Decision
Negotiation
Closed
Pricing Proposal Presented
Prospect Identified
Initial Contact Made
Opportunity Assessed
Complete Solution Defined
Active Solution Evaluation
Presented To Decision Makes
Revenue Recognition
21
Speaking
Webinar
Phone/video
Email
Search
Meeting
Networking
Cold Calls
Social Media
Print
Publications
Direct mail
Print
Advertising
Associations/
Trade Shows
Blogs
Publications
Online
Advertising
Online
Conferences
Lead Generation Activities 22
Web Traffic Insights
Traffic share in last 3 months
Traffic sources
7.88%
0.55%
0.75%
0.81%Text Here
Text Here
Text Here
Text Here
Subdomains
Global rank
68
Country rank
Text here
28
Category rank
Text here
48
Website ranks in June, 2017
Avg .Time on site
Text Here
00:06:25
Bounce rate
Text Here
29.54%
Avg . page views
6.23
Engagement in June, 2017
0.03%
10.84%
0.87%
20.33%Direct
MAIL
Search
Social
Weekly traffic reach in last 6 months
0
0.5
1
1.5
2
2.5
Jan-16 Feb-16 Mar-16 Apr-16 May-16 Jun-16
Share of internet users who visited the site in June, 2017
23
Marketing Reach By Channels 24
Email
Adapt it to your needs and capture
your audience's attention.
Influencer Marketing
Adapt it to your needs and capture
your audience's attention.
Organic Search
Adapt it to your needs and capture
your audience's attention.
Paid Search
Adapt it to your needs and capture
your audience's attention.
Affiliate Marketing
Adapt it to your needs and capture
your audience's attention.
Display Advertising
Adapt it to your needs and capture
your audience's attention.
Others
Adapt it to your needs and capture
your audience's attention.
10%
15%
15%
16%
15%
19%
10%
Social Media Metrics
Facebook
0
20
40
60
80
Previous Period Previous Year
Fans Count
28,546
0
20
40
60
Previous Period Previous Year
Engagement Rate
255.24%
Twitter
0
10
20
30
40
50
Previous Period Previous Year
Followers
543,643
0
20
40
60
80
Previous Period Previous Year
Mentions
5,234
0
20
40
60
80
100
Previous Period Previous Year
Subscribers
645
0
20
40
60
80
Previous Period Previous Year
Video Views
13
YouTube
0
20
40
60
80
Previous Period Previous Year
Followers
6,533
0
20
40
60
80
100
Previous Period Previous Year
Likes
332,524
Instagram
25
Paid Search Analytics
Budget
Conversions
Clicks
Impressions
This slide is 100% editable. Adapt it to your needs and capture your audience’s attention.Analysis:
CPA:$8.21
Conversion rate:18.26%
Ctr:3.56%
Budget 35.28%
Key StatusMarch ( Change Form February)
$1255.74 ( 8.99)
37,124 ( 9.59)
188 ( 6.84)
44 ( 38.18)
26
Organic Vs Paid Search Traffic-1
Sessions %New User Bounce Rate Goal 1 Completion
All Channels
61,473 81.4% 33.2% 2,893
709 12.4 12.6 2,893
Organic
Search Traffic
44,493 95,1% 73,2% 1,265
36,230 11.5 2.1 1,265
Paid Search
Traffic
6,900 99.3% 35.7% 33
45.000 8.7 15 33
27
Organic Vs Paid Search Traffic-2
59
30
0
10
20
30
40
50
60
70
2017
Organic Search Paid Search
Pages/Session
61
40
0
10
20
30
40
50
60
70
2018
Organic Search Paid Search
Bounce Rate
56
34
0
10
20
30
40
50
60
2016
Organic Search Paid Search
Avg. Session Duration
This graph/chart is linked to excel, and changes automatically based on data. Just left click on it and select “Edit Data”.
28
Last 30 Days Result
This slide is 100% editable.
1.3 Bn
+1.8%
This slide is 100% editable.
378 Bn
+35.0%
This slide is 100% editable.
3.2 Bn
+3.4%
This slide is 100% editable.
1.2 Bn
+3.6%
$
0.42 $
0.42
+10.6%
This slide is 100%
editable.
This slide is 100% editable. Adapt it to your needs and capture your audience's attention.
This slide is 100% editable. Adapt it
to your needs and capture your
audience's attention.
This slide is 100% editable. Adapt it
to your needs and capture your
audience's attention.
This slide is 100% editable. Adapt it
to your needs and capture your
audience's attention.
This slide is 100% editable. Adapt it
to your needs and capture your
audience's attention.
$
0.62BN
This slide is
100% editable.
29
Customers Sourced By Marketing
30
35
50
60
80
110
130
145
0
50
100
150
Week 1 Week 2 Week 3 Week 4 Week 5 Week 6 Week 7 Week 8
Customers Generated By Marketing(%)
Cumulative Frequency
This graph/chart is linked to excel, and changes automatically based on data. Just left click on it and select “Edit Data”.
30
Visitors To Lead Performance
30
45
50 55
65 70
85 90
0
50
100
150
Week 1 Week 2 Week 3 Week 4 Week 5 Week 6 Week 7 Week 8
Visit to Lead(%)
Cumulative Frequency
This graph/chart is linked to excel, and changes automatically based on data. Just left click on it and select “Edit Data”.
31
Leads To Customer Performance
20
30
44
35
60
48
77
61
0
10
20
30
40
50
60
70
80
90
Week 1 Week 2 Week 3 Week 4 Week 5 Week 6 Week 7 Week 8
Line Graph
This graph/chart is linked to excel, and changes automatically based on data. Just left click on it and select “Edit Data”.
32
Channel Partners
This slide is 100% editable. Adapt it
to your needs and capture your
audience's attention.
Partner 01
This slide is 100% editable. Adapt it
to your needs and capture your
audience's attention.
Partner 03
This slide is 100% editable. Adapt it
to your needs and capture your
audience's attention.
Partner 02
This slide is 100% editable. Adapt it
to your needs and capture your
audience's attention.
Partner 04
33
Top Channel Sales People
This slide is 100% editable. Adapt
it to your needs and capture your
audience's attention.
This slide is 100% editable. Adapt
it to your needs and capture your
audience's attention.
This slide is 100% editable. Adapt
it to your needs and capture your
audience's attention.
03
01
02
34
Top Marketing Campaigns
Campaign
Daily
Budget $
Max pub.
Cost $
Max
% Of budget
Margin%
(Goal = 25%)
Number of
days at or
above budget
Campaign 1 $3,000 $3,091.39 100% 30.9% 14
Campaign 2 $2,444 $1,530.50 125% 39.4% 8
Campaign 3 $233 $578.70 134% 34.1% 5
Campaign 4 $45 $40.67 116% 98.7% 5
35
Our Trade Show Calendar
2017 1 2 3 4 5 6 7 8 9 10 11 12 13 14 15 16 17 18 19 20 21 22 23 24 25 26 27 28 29 30 31
Jan
Feb
Mar
Apr
May
Jun
Jul
Aug
Sep
Oct
Nov
Dec
36
This slide is 100% editable.
Customer Service Benchmarking
Phases
10%
Very Poor
33%
Poor
50%
Okay
75%
Good
100%
Excellent
Phase 1
Phase 2
Phase 3
Phase 4
Phase 5
37
Direct Mail Campaigns
This icon is for display
purposes only and is
completely editable. You
can replace this with any
other icon from the
www.slideteam.net icons
section.
Point of
purchase
This icon is for display
purposes only and is
completely editable. You
can replace this with any
other icon from the
www.slideteam.net icons
section.
Public
relationship
This icon is for display
purposes only and is
completely editable. You
can replace this with any
other icon from the
www.slideteam.net icons
section.
Direct mail
campaign
This icon is for display
purposes only and is
completely editable. You
can replace this with any
other icon from the
www.slideteam.net icons
section.
Direct mail print
advertising
This icon is for display
purposes only and is
completely editable. You
can replace this with any
other icon from the
www.slideteam.net icons
section.
Broadcast
advertising
38
Direct Mail Plans
27%
10.00%
18.00%
51.70%
20.00%
30.00%
18.00%
11.00%
13.00%
47.30%
30%
15.00%
0%
10%
20%
30%
40%
50%
60%
Haven't Done/
Won't do
Cut Altogether Cut Down Stay The Same Increase a Little Increase a Lot
Direct Mail Plans for 2017 and 2018
Planned Use
Usage
39
Advertising Reviews-1
Advertising Review 1
Source
Opportunity
Qty
% Of Total Quote Qty Quote $ Sold Qty Sales $
Yellow
Page
6 9.09% 6 $1,521.47 0 $0.00
Referral 5 9.04% 5 $1,521.47 0 $0.00
Newspaper 2 4.55% 0 $0.00 2 $0.00
Mailing 8 50.00% 8 $5,037.43 4 $0.00
Product
Total
5 36.36% 2 $6,630.73 3 $4,561.87
40
Advertising Reviews-2
Advertising Review 2
Source
Opportunity
Qty
% Of Total Quote Qty Quote $ Sold Qty Sales $
Referral 4 33.33% 3 $1,002.62 0 $0.00
Newspaper 3 50.00% 2 $1,457.50 0 $0.00
Mailing 2 16.67% 1 $2,496.24 0 $0.00
Product
Total
9 10.67% 6 $4,973.36 0 $0.00
41
Advertising Spent On Different Mediums 42
OpportunityTime Spent Ad Spend
0
10
20
30
40
50
Print Radio T.V Internet Media
%OfTotalMediaConsumptionTime
OrAdvertisingSpending
21%
24%
15%
20%
31%
23%
25% 25%
37%
5%
Global Ad Spend By Medium (%)
0%
5%
10%
15%
20%
25%
30%
35%
40%
45%
Desktop
Internet
Mobile
Internet
Newspapers Magazines Outdoor Radio Cinema
Jul-17
Aug-17
43
This graph/chart is linked to excel, and changes automatically based on data. Just left click on it and select “Edit Data”.
Print Media Publication Report
Inbound Calls Connected
35%
Appointment Requested
44%
Appointment Results
22%
50
45
30
35
44
18
35
25
20
0
10
20
30
40
50
60
Dawn
News
The News Daily
Times
Express
Tribune
Business
Recorder
The Nation Pakistan
Today
Pakistan
Observer
Hindustan
Times
Appointment Results
Magazines
79%
Publications
21%
44
Telemarketing Report
0
10
20
30
40
50
60
70
80
90
100
Total Cost Cold- Calling Value
Proposition
Qualified Lead Audience
Acqusition
Contact
Discovery
Inpercentage
Use Of Telemarketing Within a Lead Generation Strategy
45
46Telemarketing Report
The Washington Post
25%
The New York Times
20%
The Wall Street Journal
35%
0
2
4
6
8
10
Sun Mon Tue Wed Thu Fri Sat
Total Calls Connected Calls
Competitive Intelligence
Task Item Competitors Markets Products Industries Vendors Customers
Item 1
Item 2
Item 3
Item 4
Item 5
Item 6
47
Competitive Intelligence
High
Low
SecondAttribute
HighFirst Attribute
✓ This slide is 100% editable. Adapt it to
your needs and capture your
audience's attention.
✓ This slide is 100% editable. Adapt it to
your needs and capture your
audience's attention.
✓ This slide is 100% editable. Adapt it to
your needs and capture your
audience's attention.
✓ This slide is 100% editable. Adapt it to
your needs and capture your
audience's attention.
48
This slide is 100%
editable. Adapt it to your
needs and capture your
audience's attention.
Regional
Events
This slide is 100%
editable. Adapt it to your
needs and capture your
audience's attention.
Press
Release
This slide is 100%
editable. Adapt it to your
needs and capture your
audience's attention.
Referral
Program
This slide is 100%
editable. Adapt it to your
needs and capture your
audience's attention.
Trade
Shows
This slide is 100%
editable. Adapt it to your
needs and capture your
audience's attention.
Buy Back
Program
Channel
Promotional Events
49
Case Study
This slide is 100% editable. Adapt
it to your needs and capture your
audience's attention.
Problems 01
This slide is 100% editable. Adapt
it to your needs and capture your
audience's attention.
Solutions 02
This slide is 100% editable. Adapt
it to your needs and capture your
audience's attention.
Benefits 03
50
Customer Testimonials
This slide is 100%
editable. Adapt it to your
needs and capture your
audience's attention.
PETER SMITH
Finance Manager
This slide is 100%
editable. Adapt it to your
needs and capture your
audience's attention.
ANITA SMITH
Product Manager
This slide is 100%
editable. Adapt it to your
needs and capture your
audience's attention.
MARRY SMITH
CEO & Founder
51
Marketing Plan
This slide is 100%
editable. Adapt it to
your needs and
capture your
audience's attention.
Plan 05
This slide is 100%
editable. Adapt it to
your needs and
capture your
audience's attention.
Plan 02
This slide is 100%
editable. Adapt it to
your needs and
capture your
audience's attention.
Plan 03
This slide is 100%
editable. Adapt it to
your needs and
capture your
audience's attention.
Plan 04
This slide is 100%
editable. Adapt it to
your needs and
capture your
audience's attention.
Plan 01
52
Monthly Advertising Plan
Advertising Plan
Years Jan Feb Mar Apr May Jun Jul Aug Sep Oct Nov Dec
2013
2014
2015
2016
2017
53
This slide is 100% editable.
✓ This slide is 100% editable. Adapt it to
your needs and capture your audience's
attention.
✓ This slide is 100% editable. Adapt it to
your needs and capture your audience's
attention.
✓ This slide is 100% editable. Adapt it to
your needs and capture your audience's
attention.
✓ This slide is 100% editable. Adapt it to
your needs and capture your audience's
attention.
Roadmap to
Monthly Plans
54
01
02
03 04
Marketing Activity Report Icons Set 55
Additional
Slides
56
Our Mission
Mission 01
This slide is 100% editable. Adapt it to your
needs and capture your audience's attention.
Mission 02
This slide is 100% editable. Adapt it to your
needs and capture your audience's attention.
Mission 03
This slide is 100% editable. Adapt it to your
needs and capture your audience's attention.
57
Meet Our Team
CEO & Founder
This slide is 100% editable. Adapt
it to your needs and capture your
audience's attention.
John Hill
Finance Manager
This slide is 100% editable. Adapt
it to your needs and capture your
audience's attention.
Julie Parker
Accountant
This slide is 100% editable. Adapt
it to your needs and capture your
audience's attention.
Lee Hester
Designer
This slide is 100% editable. Adapt
it to your needs and capture your
audience's attention.
Miller Bails
58
About Our Company
Target Audiences
This slide is 100% editable. Adapt it to
your needs and capture your audience's
attention.
Preferred by Many
This slide is 100% editable. Adapt it to
your needs and capture your audience's
attention.
Values Client
This slide is 100% editable. Adapt it to
your needs and capture your
audience's attention.
59
Our Goal
Goal 01
This slide is 100% editable.
Adapt it to your needs and
capture your audience's
attention.
Goal 02
This slide is 100% editable.
Adapt it to your needs and
capture your audience's
attention.
60
Comparison
40%
This slide is 100%
editable. Adapt it to your
needs and capture your
audience's attention.
85%
This slide is 100%
editable. Adapt it to your
needs and capture your
audience's attention.
61
Dashboard
This slide is 100% editable. Adapt
it to your needs and capture your
audience's attention.
Low
30%
This slide is 100% editable. Adapt
it to your needs and capture your
audience's attention.
Medium
45%
This slide is 100% editable. Adapt
it to your needs and capture your
audience's attention.
High
90%
62
Location
75%
22%
45%
32%
68%
North
America
This slide is
100% editable.
This slide is
100% editable.
South
America
This slide is
100% editable.
Africa
This slide is
100% editable.
Australia
This slide is
100% editable.
Asia
63
Timeline
Start
This slide is 100%
editable. Adapt it to your
needs and capture your
audience's attention.
Mar/23
This slide is 100%
editable. Adapt it to your
needs and capture your
audience's attention.
Aug/29
This slide is 100%
editable. Adapt it to your
needs and capture your
audience's attention.
Jan/13
This slide is 100%
editable. Adapt it to your
needs and capture your
audience's attention.
May/25
64
Timeline (continued…)
Finish
This slide is 100%
editable. Adapt it to your
needs and capture your
audience's attention.
Sep/10
This slide is 100%
editable. Adapt it to your
needs and capture your
audience's attention.
Nov/22
This slide is 100%
editable. Adapt it to your
needs and capture your
audience's attention.
Oct/30
This slide is 100%
editable. Adapt it to your
needs and capture your
audience's attention.
Dec/12
65
Our Target
This slide is 100% editable. Adapt it to your
needs and capture your audience's attention.
01
This slide is 100% editable. Adapt it to your
needs and capture your audience's attention.
02
This slide is 100% editable. Adapt it to your
needs and capture your audience's attention.
03
66
Information technology and business are
becoming inextricably interwoven. I don’t think
anybody can talk meaningfully about one without the
talking about the other.
-BILL GATES
67
Lego
This slide is 100% editable. Adapt it to your
needs and capture your audience's
attention.
This slide is 100% editable. Adapt it to your
needs and capture your audience's
attention.
This slide is 100% editable. Adapt it to your
needs and capture your audience's
attention.
This slide is 100% editable. Adapt it to your
needs and capture your audience's
attention.
This slide is 100% editable. Adapt it to your
needs and capture your audience's
attention.
68
Matrix
✓ This slide is 100% editable. Adapt it to your needs and
capture your audience's attention.
✓ This slide is 100% editable. Adapt it to your needs and
capture your audience's attention.
✓ This slide is 100% editable. Adapt it to your needs and
capture your audience's attention.
✓ This slide is 100% editable. Adapt it to your needs and
capture your audience's attention.
HIGH
LOW
HIGH
Stars Question Marks
Cash Cows Dogs
69
Silhouettes
This slide is 100%
editable. Adapt it to your needs
and capture your audience's
attention.
70
Important
Notes
This slide is 100% editable.
Adapt it to your needs and capture
your audience's attention.
This slide is 100%
editable. Adapt it to your
needs and capture your
audience's attention.
01 02 03 04
This slide is 100%
editable. Adapt it to your
needs and capture your
audience's attention.
This slide is 100%
editable. Adapt it to your
needs and capture your
audience's attention.
This slide is 100%
editable. Adapt it to your
needs and capture your
audience's attention.
71
This slide is 100%
editable Adapt it to your
needs and capture your
audience's attention.
Basic
$50
This slide is 100%
editable Adapt it to your
needs and capture your
audience's attention.
Standard
$17
This slide is 100%
editable Adapt it to your
needs and capture your
audience's attention.
Professional
$29
This slide is 100%
editable Adapt it to your
needs and capture your
audience's attention.
Enterprise
$59
Financial 72
Mind Map
This slide is 100% editable. Adapt
it to your needs and capture your
audience's attention.
This slide is 100% editable. Adapt
it to your needs and capture your
audience's attention.
This slide is 100% editable. Adapt
it to your needs and capture your
audience's attention.
This slide is 100% editable. Adapt
it to your needs and capture your
audience's attention.
This slide is 100% editable. Adapt
it to your needs and capture your
audience's attention.
73
SWOT
S W O T
Strength
This slide is 100% editable.
Adapt it to your needs and
capture your audience's
attention.
Weakness
This slide is 100% editable.
Adapt it to your needs and
capture your audience's
attention.
Opportunity
This slide is 100% editable.
Adapt it to your needs and
capture your audience's
attention.
Threat
This slide is 100% editable.
Adapt it to your needs and
capture your audience's
attention.
74
NEWS PAPER
This slide is 100% editable. Adapt it to your needs and
capture your audience's attention.
This slide is 100% editable. Adapt it to your needs and capture your
audience's attention. Adapt it to your needs and capture your audience's
attention. This slide is 100% editable. Adapt it to your needs and capture
your audience's attention. Adapt it to your needs and capture your
audience's attention.
This slide is 100% editable. Adapt it to your needs and capture your
audience's attention. This slide is 100% editable. Adapt it to your needs and
capture your audience's attention. This slide is 100% editable. Adapt it to
your needs and capture your audience's attention.
This slide is 100% editable. Adapt it to your
needs and capture your audience's
attention. Adapt it to your needs and
capture your audience's attention. This
slide is 100% editable. Adapt it to your
needs and capture your audience's
attention. Adapt it to your needs and
capture your audience's attention.
This slide is 100% editable. Adapt it to
your needs and capture your audience's
attention. Adapt it to your needs and
capture your audience's attention. This
slide is 100% editable. Adapt it to your
needs and capture your audience's
attention. Adapt it to your needs and
capture your audience's attention.
This slide is 100% editable. Adapt it to your needs and capture your audience's attention.
Project 01
This slide is 100% editable. Adapt it
to your needs and capture your
audience's attention.
Project 02
This slide is 100% editable. Adapt it
to your needs and capture your
audience's attention.
Newspaper 75
Hierarchy Chart
This slide is 100%
editable.
This slide is
100% editable.
This slide is
100% editable.
This slide is
100% editable.
This slide is
100% editable.
This slide is 100% editable. Adapt it to your needs and capture your audience's attention.
76
Venn
25%
75%
35%
This slide is 100% editable. Adapt
it to your needs and capture your
audience's attention.
This slide is 100% editable. Adapt
it to your needs and capture your
audience's attention.
This slide is 100% editable. Adapt
it to your needs and capture your
audience's attention.
77
0
10
20
30
40
50
60
70
80
90
100
FY '16 FY '17 FY '18
SalesinPercentage(%)
Product 01
This slide is 100% editable. Adapt it to your
needs and capture your audience's attention.
Product 02
This slide is 100% editable. Adapt it to your
needs and capture your audience's attention.
Product 03
This slide is 100% editable. Adapt it to your
needs and capture your audience's attention. This graph/chart is linked to excel, and changes automatically based on data. Just left click
on it and select “Edit Data”.
Bar
Graph
78
Magnifying
Glass
✓ This slide is 100% editable. Adapt it to your needs and
capture your audience's attention.
✓ This slide is 100% editable. Adapt it to your needs and
capture your audience's attention.
✓ This slide is 100% editable. Adapt it to your needs and
capture your audience's attention.
✓ This slide is 100% editable. Adapt it to your needs and
capture your audience's attention.
79
Thank
YouEmail Address:
emailaddress@123.com
Address
# street number, city, state
Contact Numbers:
0123456789

More Related Content

PDF
Mountain Man Brewing Company: Case Analysis
PPTX
Mountain man brewing company case analysis
PPTX
Marketing digital for fashion part 1
PDF
Integrated Marketing Communication Plan for Folli Follie
DOCX
Monthly Report Example
PDF
Brand Plan Workshop
PDF
Ideal Brand Plan
DOCX
IMC 610 Integrated Marketing Communication Plan for Kmart
Mountain Man Brewing Company: Case Analysis
Mountain man brewing company case analysis
Marketing digital for fashion part 1
Integrated Marketing Communication Plan for Folli Follie
Monthly Report Example
Brand Plan Workshop
Ideal Brand Plan
IMC 610 Integrated Marketing Communication Plan for Kmart

What's hot (20)

PPTX
Red Bull Cola Case Study
PDF
Mountain dew
PPTX
Mountain man brewing company: Bringing the Brand to Light
PPT
2007 - Brand Premium of Louis Vuitton Original Bag and Counterfeits
PPTX
Absolut Campaigns Through The Years
PPT
Strategic brand management by kevin lane keller
PDF
Brand Storytelling
PDF
How to Win in Marketplaces
PDF
What is Comms Planning?
PPTX
Starbucks Media Plan
DOCX
Brand Extention plan for Innocent Smoothies into Innocent beauty.
PPTX
Global supply chain case study team8_submit v2
PPTX
Business Strategy + Brand Strategy
PPTX
Mountain Man Brewing Company - Harvard Business School Case Study
PDF
Strategic Brand Management
PDF
Media in Focus
PDF
Brand Finance 101
PDF
Glossier Marketing Plan
PDF
Brand positioning model (Dove case study)
PDF
Super shampoo products and the indian mass market case study
Red Bull Cola Case Study
Mountain dew
Mountain man brewing company: Bringing the Brand to Light
2007 - Brand Premium of Louis Vuitton Original Bag and Counterfeits
Absolut Campaigns Through The Years
Strategic brand management by kevin lane keller
Brand Storytelling
How to Win in Marketplaces
What is Comms Planning?
Starbucks Media Plan
Brand Extention plan for Innocent Smoothies into Innocent beauty.
Global supply chain case study team8_submit v2
Business Strategy + Brand Strategy
Mountain Man Brewing Company - Harvard Business School Case Study
Strategic Brand Management
Media in Focus
Brand Finance 101
Glossier Marketing Plan
Brand positioning model (Dove case study)
Super shampoo products and the indian mass market case study
Ad

Similar to Company Marketing Analysis Report PowerPoint Presentation Slides (20)

PDF
Company Marketing Analysis Report Powerpoint Presentation Slides
PDF
Sales And Marketing Analysis Report PowerPoint Presentation Slide
PDF
Marketing Activity Report PowerPoint Presentation Slides
PDF
Target Based Sales Performance PowerPoint Presentation Slides
PDF
Achieving Sales Target Powerpoint Presentation Slides
PDF
Revenue Budget Powerpoint Presentation Slides
PDF
Digital Innovation Strategy PowerPoint Presentation Slides
PDF
Sales Management Powerpoint Presentation Slides
PDF
360 Degree View Of Customer Powerpoint Presentation Slides
PDF
Sales Management PowerPoint Presentation Slides
PDF
Business Sales Review PowerPoint Presentation Slides
PDF
Supply Chain Management Demand Forecasting PowerPoint Presentation Slides
PDF
Acquired Customer Relationship PowerPoint Presentation Slides
PDF
Sales Improvements PowerPoint Presentation Slides
PDF
Monthly Marketing Report Complete Powerpoint Deck With Slides
PDF
Monthly Marketing Report Complete PowerPoint Deck With Slides
PDF
Executive Summary PowerPoint Presentation Slides
PDF
CAC Ratio PowerPoint Presentation Slides
PDF
Strategic Workforce Planning Model Powerpoint Presentation Slides
PDF
Enterprise Digital Transformation Powerpoint Presentation Slides
Company Marketing Analysis Report Powerpoint Presentation Slides
Sales And Marketing Analysis Report PowerPoint Presentation Slide
Marketing Activity Report PowerPoint Presentation Slides
Target Based Sales Performance PowerPoint Presentation Slides
Achieving Sales Target Powerpoint Presentation Slides
Revenue Budget Powerpoint Presentation Slides
Digital Innovation Strategy PowerPoint Presentation Slides
Sales Management Powerpoint Presentation Slides
360 Degree View Of Customer Powerpoint Presentation Slides
Sales Management PowerPoint Presentation Slides
Business Sales Review PowerPoint Presentation Slides
Supply Chain Management Demand Forecasting PowerPoint Presentation Slides
Acquired Customer Relationship PowerPoint Presentation Slides
Sales Improvements PowerPoint Presentation Slides
Monthly Marketing Report Complete Powerpoint Deck With Slides
Monthly Marketing Report Complete PowerPoint Deck With Slides
Executive Summary PowerPoint Presentation Slides
CAC Ratio PowerPoint Presentation Slides
Strategic Workforce Planning Model Powerpoint Presentation Slides
Enterprise Digital Transformation Powerpoint Presentation Slides
Ad

More from SlideTeam (20)

PDF
Customer Support And Services Guide Powerpoint Presentation Slides
PDF
Word Of Mouth WOM Marketing Strategies To Build Brand Awareness Powerpoint Pr...
PDF
Strategic Staff Engagement Action Plan Powerpoint Presentation Slides
PDF
Traditional Marketing Channel Analysis Powerpoint Presentation Slides Mkt Cd
PDF
Integrating Asset Tracking System To Enhance Operational Effectiveness Comple...
PDF
Designing And Implementing Brand Leadership Strategy Powerpoint Presentation ...
PDF
How Amazon Generates Revenues Across Globe Powerpoint Presentation Slides Str...
PDF
Guide For Effective Event Marketing Powerpoint Presentation Slides Mkt Cd
PDF
Managing Business Customers Technology Powerpoint Presentation Slides
PDF
Unearthing Apples Billion Dollar Branding Secret Powerpoint Presentation Slid...
PDF
Developing Flexible Working Practices To Improve Employee Engagement Powerpoi...
PDF
Product Corporate And Umbrella Branding Powerpoint Presentation Slides Brandi...
PDF
Communication Channels And Strategies For Shareholder Engagement Powerpoint P...
PDF
Responsible Tech Playbook To Leverage Business Ethics Powerpoint Presentation...
PDF
Generating Leads Through Targeted Digital Marketing Campaign Powerpoint Prese...
PDF
Boosting Profits With New And Effective Sales Strategic Plan Powerpoint Prese...
PDF
ChatGPT IT Powerpoint Presentation Slides
PDF
Methods To Implement Traditional Marketing Powerpoint Presentation Slides Mkt Cd
PDF
Comprehensive Guide To Sports Marketing Strategy Powerpoint Presentation Slid...
PDF
Global Shift Towards Flexible Working Powerpoint Presentation Slides
Customer Support And Services Guide Powerpoint Presentation Slides
Word Of Mouth WOM Marketing Strategies To Build Brand Awareness Powerpoint Pr...
Strategic Staff Engagement Action Plan Powerpoint Presentation Slides
Traditional Marketing Channel Analysis Powerpoint Presentation Slides Mkt Cd
Integrating Asset Tracking System To Enhance Operational Effectiveness Comple...
Designing And Implementing Brand Leadership Strategy Powerpoint Presentation ...
How Amazon Generates Revenues Across Globe Powerpoint Presentation Slides Str...
Guide For Effective Event Marketing Powerpoint Presentation Slides Mkt Cd
Managing Business Customers Technology Powerpoint Presentation Slides
Unearthing Apples Billion Dollar Branding Secret Powerpoint Presentation Slid...
Developing Flexible Working Practices To Improve Employee Engagement Powerpoi...
Product Corporate And Umbrella Branding Powerpoint Presentation Slides Brandi...
Communication Channels And Strategies For Shareholder Engagement Powerpoint P...
Responsible Tech Playbook To Leverage Business Ethics Powerpoint Presentation...
Generating Leads Through Targeted Digital Marketing Campaign Powerpoint Prese...
Boosting Profits With New And Effective Sales Strategic Plan Powerpoint Prese...
ChatGPT IT Powerpoint Presentation Slides
Methods To Implement Traditional Marketing Powerpoint Presentation Slides Mkt Cd
Comprehensive Guide To Sports Marketing Strategy Powerpoint Presentation Slid...
Global Shift Towards Flexible Working Powerpoint Presentation Slides

Recently uploaded (20)

PDF
Keppel_Proposed Divestment of M1 Limited
PDF
How to Get Funding for Your Trucking Business
PPTX
Sales & Distribution Management , LOGISTICS, Distribution, Sales Managers
PDF
Module 3 - Functions of the Supervisor - Part 1 - Student Resource (1).pdf
PDF
Solaris Resources Presentation - Corporate August 2025.pdf
PPTX
Board-Reporting-Package-by-Umbrex-5-23-23.pptx
PDF
Nante Industrial Plug Factory: Engineering Quality for Modern Power Applications
PPT
Chapter four Project-Preparation material
PDF
Stem Cell Market Report | Trends, Growth & Forecast 2025-2034
PDF
Ôn tập tiếng anh trong kinh doanh nâng cao
PDF
Power and position in leadershipDOC-20250808-WA0011..pdf
PPTX
3. HISTORICAL PERSPECTIVE UNIIT 3^..pptx
PPTX
Probability Distribution, binomial distribution, poisson distribution
PDF
Hindu Circuler Economy - Model (Concept)
PPTX
2025 Product Deck V1.0.pptxCATALOGTCLCIA
PDF
Cours de Système d'information about ERP.pdf
PPTX
Business Ethics - An introduction and its overview.pptx
PDF
NewBase 12 August 2025 Energy News issue - 1812 by Khaled Al Awadi_compresse...
PPTX
CkgxkgxydkydyldylydlydyldlyddolydyoyyU2.pptx
PPTX
svnfcksanfskjcsnvvjknsnvsdscnsncxasxa saccacxsax
Keppel_Proposed Divestment of M1 Limited
How to Get Funding for Your Trucking Business
Sales & Distribution Management , LOGISTICS, Distribution, Sales Managers
Module 3 - Functions of the Supervisor - Part 1 - Student Resource (1).pdf
Solaris Resources Presentation - Corporate August 2025.pdf
Board-Reporting-Package-by-Umbrex-5-23-23.pptx
Nante Industrial Plug Factory: Engineering Quality for Modern Power Applications
Chapter four Project-Preparation material
Stem Cell Market Report | Trends, Growth & Forecast 2025-2034
Ôn tập tiếng anh trong kinh doanh nâng cao
Power and position in leadershipDOC-20250808-WA0011..pdf
3. HISTORICAL PERSPECTIVE UNIIT 3^..pptx
Probability Distribution, binomial distribution, poisson distribution
Hindu Circuler Economy - Model (Concept)
2025 Product Deck V1.0.pptxCATALOGTCLCIA
Cours de Système d'information about ERP.pdf
Business Ethics - An introduction and its overview.pptx
NewBase 12 August 2025 Energy News issue - 1812 by Khaled Al Awadi_compresse...
CkgxkgxydkydyldylydlydyldlyddolydyoyyU2.pptx
svnfcksanfskjcsnvvjknsnvsdscnsncxasxa saccacxsax

Company Marketing Analysis Report PowerPoint Presentation Slides

  • 2. This slide is 100% editable. Adapt it to your needs and capture your audience's attention. About Us 01 This slide is 100% editable. Adapt it to your needs and capture your audience's attention. Ideas For Success 02 This slide is 100% editable. Adapt it to your needs and capture your audience's attention. Partnership Contract 03 This slide is 100% editable. Adapt it to your needs and capture your audience's attention. Measuring Growth 04 This slide is 100% editable. Adapt it to your needs and capture your audience's attention. Goals For 2017 05 This slide is 100% editable. Adapt it to your needs and capture your audience's attention. Results 06 This is a representative image, and should be replaced by your own image. Just right click and replace image. Agenda 2
  • 3. October 2017 SUN MON TUE WED THU FRI SAT 1 2 Blog Post Write e- Book 3 Blog Post e-Book 5 Pitches 4 Blog Post Write e- Book 5 Blog Post Write e- Book 6 Blog Post Write e- Book 7 8 9 Blog Post Write e- Book 10 Write e- Book 10 Cold Calls 11 Blog Post Write e- Book 12 Blog Post Write e- Book 13 Write e- Book 14 15 16 Blog Post Edit e- Book 17 Edit e Book 5 Pitches 18 Blog Post Format e- Book 19 Format e- Book 20 Blog Post e-Book Pre-Launch 21 22 23 E- Book Pre- Launch 10 Cold Calls 24 Blog Post e-Book Pre- Launch 25 Blog Post Launch e- Book 26 Promote e- Book 27 Blog Post Promote e- Book 28 29 30 Promote e- Book 31 Blog Post Promote e-Book Monthly Marketing Calendar This is a representative image, and should be replaced by your own image. Just right click and replace image. 3
  • 4. Sales Performance Reporting 0 40 80 120 Jacob Emma Michael Isabella$10,132.00 $52,035.00 $15,432.00 $55,413.00 Top Sales Reps 8% 14% 12% 22% 58% Plan1 Plan2 Plan3 Plan4 Plan5 Top Selling Plans 1,827 , 210% New customers 0 5 10 15 20 25 30 35 Jan Feb Mar Apr May Jun Jul Aug Sep Oct Nov Dec New Customers Company 1 $10,111.00 Company 2 $12,140.00 Company 3 $70,030.00 Company 4 $55,410.00 Company 5 $02,000.00 Company 6 $55,000.00 Company 7 $89,510.00 Company 8 $31,611.00 Company Value Top Opportunities Visitors (100%) Leads (26%) Repeat Customer (13%) Customer (6%) Sales Funnel Sales Goal YTD 0 100 50 Low Medium High 90% 4
  • 5. Sales By Region 1 BRAZIL 4 AFRICA 14 RUSSIA $134 BILLION $106 BILLION $665 BILLION $540 BILLION $106 BILLION This slide is 100% editable. Adapt it to your needs and capture your audience's attention. 5 8 AUSTRALIA 2 USA
  • 6. US Sales By Regions 80% Higher Sales This slide is 100% editable. Adapt it to your needs and capture your audience's attention. 75% Medium Sales This slide is 100% editable. Adapt it to your needs and capture your audience's attention. 30% Lowest Sales This slide is 100% editable. Adapt it to your needs and capture your audience's attention. Washington Montana California New Mexico Texas Oklahoma Kansas Nebraska South Dakota North Dakota Minnesota Iowa Missouri Arkansas Louisiana Wisconsin Illinois Michigan Ohio 6
  • 7. 35% 70% 95% 55% This graph/chart is linked to excel, and changes automatically based on data. Just left click on it and select “Edit Data”. This graph/chart is linked to excel, and changes automatically based on data. Just left click on it and select “Edit Data”. This graph/chart is linked to excel, and changes automatically based on data. Just left click on it and select “Edit Data”. This graph/chart is linked to excel, and changes automatically based on data. Just left click on it and select “Edit Data”. Key Financial This slide is 100% editable. Adapt it to your needs and capture your audience's attention. 7
  • 8. Key Deliverables and Timeline Week 1 Week 2 Week 3 Week4 Week 5 Week 6 Week 7 Catering Prep Budget Agenda Everything Reverts Prep Invitation Registration Collateral Prep A/V estimate 15/10/2017 Website Registration Up 19/10/2017 Send invitations in 20/10/2017 Keynote Requirements 28/10/2017 Establish Speakers 26/10/2017 18/10/2017 Engage production company 22/10/2017 Evening event, locations 23/10/2017 Final Agenda 27/10/2017 Initial Menu 23/10/2017 Venue Walk Through 8
  • 10. Product Wise Performance This graph/chart is linked to excel, and changes automatically based on data. Just left click on it and select “Edit Data”. 0 2 4 6 8 10 12 14 16 Q1 Q2 Q3 Q4 AnnualRunRateIn Percentage Year 2017 Product 1 Product 2 Product 3 Product 4 Product Wise PerformanceProduct Wise Performance Year 2017 1st Qtr 2nd Qtr 3rd Qtr 4th Qtr 25% 30% 20%25% 10
  • 11. Marketing Roadmap 0% 10% 20% 30% 40% 50% 60% 70% 80% 90% 100% Jan Feb Mar Apr May Jun Jul Aug This slide is 100% editable. This slide is 100% editable. This slide is 100% editable. This slide is 100% editable. This slide is 100% editable. This slide is 100% editable. This slide is 100% editable. This slide is 100% editable.This slide is 100% editable. This slide is 100% editable. This slide is 100% editable. This slide is 100% editable. This slide is 100% editable. This slide is 100% editable. This slide is 100% editable. 11
  • 12. Website Performance Review 0 2 4 6 8 10 12 14 16 18 20 JAN FEB MAR APR MAY JUN JUL AUG SEP Series 1 Series 2 Site Consumption -TrendTraffic sources 10% 13% 7% 15% 25% 30% 0 10 20 30 40 50 60 70 JAN FEB MAR APR MAY JUNE JULY AUG SEP OCT NOV DEC Average Visit Time 0 20 40 60 80 100 J A N FE B MA R A P R MA Y J UN J UL A UG S E P Product 01 Product 02 Organic BrandedOnline Transaction 0 100 50 Low Medium High 90% 12
  • 13. Website Performance Review Demanded de submission - auto (goal 1) 2.4 Demanded de submission - habit (goal 2) 3.5 Quills putt personnel (goal 3) 5.5 Quills budget personnel (goal 4) 6.3 Quill putt automobile (goal 5) 7.5 Visits 0 2 4 6 8 10 12 14 16 18 55% Previous year 11% Previous month Tap Converting Goals Visits 10% 13% 7% 15% 25% 30% 0 1 2 Category 01 Category 02 Category 03 Category 04 Conversion RateAverage Visit Value 0 100 50 Low Medium High 90% 13
  • 14. Search Engine Rankings Keyword- URL Benchmark Aug- 16 Sep- 16 Oct- 16 Nov- 16 Dec- 16 Jan- 17 MOM BM Text Here Text Here - - - - - - - 42 - Text Here Text Here - - - - 34 26 22 23 - Text Here Text Here - - - - - - 49 - - Ranking by specific search engine and search term Position / month Benchmark Aug- 16 Sep- 16 Oct- 16 Nov- 16 Dec- 16 Jan- 17 MOM BM Position 1 160 - 225 225 218 229 83 9% 55% Position 2 34 55 63 60 55 62 52 -47% 104% Position 3 45 16 38 37 37 48 27 Nc 35% 0 20 40 60 80 Jan Feb Mar Apr May Series 3 Series 2 Series 1 Summary top 3 resultsSearch engine ranking 14
  • 15. Monthly Traffic Source Overview Sources Visits % Visits (Direct) (none) 3,581 55.67% Google (organic) 4,258 40.32% Vine press. Net 360 2.10% Yahoo (organic) 96 0.92% Bing (organic) 56 0.99% This graph/chart is linked to excel, and changes automatically based on data. Just left click on it and select “Edit Data”. Top traffic sources 20% 35% 45% ✓ Direct traffic ✓ Referring sites ✓ Search engines All traffic sources sent a total of 11,278 visits Traffic sources overview 0 50 100 DecNovOctSepAugJulJunMayAprMarFebJan InPercentage Traffic Converting Traffic 15
  • 16. Organic Visits And Backlinks 12% 8% 15% 10% 20% 35% Bing 6% 356 Visits 5,584 Visits Google 85% Yahoo 2% 91 Visits Search 4% 76 Visits Ask 2% 35 Visits Other 4% 26 Visits This graph/chart is linked to excel, and changes automatically based on data. Just left click on it and select “Edit Data”. 16 0 5 10 15 20 25 30 35 40 45 50 Rank Domain authority Backlinks (Google) Backlinks (Yahoo) 6.2 45 1,584 3,853
  • 17. New Customer By Source 15 25 35 45 55 65 85 0 10 20 30 40 50 60 70 80 90 100 Events SEO/PPC Direct Mail Website Email Social Adertising 17
  • 18. Website Update Plan Website Upgrade Strategy PowerPoint Slide Influencers Loading.. 18
  • 19. Email Marketing Report 1099Opens 73.86%Click Rate 608Unopened 2.5%Bounces 40% 10% 20% 30% 19 This slide is 100% editable. Adapt it to your needs and capture your audience's attention.
  • 20. Email Marketing Performance Chart 9.6 9 8.9 8.4 8 7.6 7.2 6 5.6 9 8.5 8 7.5 7 6.5 6 5.5 2.4 7.8 7.4 6.8 6.4 5.8 5.4 4.8 4.4 3.8 0 2 4 6 8 10 12 Clickthrough Rate Open Rate Delivery Rate Click Per Email Post-Click Conversion Rate Click Per Link In Email Revenue Per Email Response By List Segment Social Sharing Rate Strategic Phase Transition Phase Trial Phase 20
  • 21. Monthly Pipeline Summary Discovery Pre-Qualification Qualification Solution Design Evaluation Decision Negotiation Closed Pricing Proposal Presented Prospect Identified Initial Contact Made Opportunity Assessed Complete Solution Defined Active Solution Evaluation Presented To Decision Makes Revenue Recognition 21
  • 22. Speaking Webinar Phone/video Email Search Meeting Networking Cold Calls Social Media Print Publications Direct mail Print Advertising Associations/ Trade Shows Blogs Publications Online Advertising Online Conferences Lead Generation Activities 22
  • 23. Web Traffic Insights Traffic share in last 3 months Traffic sources 7.88% 0.55% 0.75% 0.81%Text Here Text Here Text Here Text Here Subdomains Global rank 68 Country rank Text here 28 Category rank Text here 48 Website ranks in June, 2017 Avg .Time on site Text Here 00:06:25 Bounce rate Text Here 29.54% Avg . page views 6.23 Engagement in June, 2017 0.03% 10.84% 0.87% 20.33%Direct MAIL Search Social Weekly traffic reach in last 6 months 0 0.5 1 1.5 2 2.5 Jan-16 Feb-16 Mar-16 Apr-16 May-16 Jun-16 Share of internet users who visited the site in June, 2017 23
  • 24. Marketing Reach By Channels 24 Email Adapt it to your needs and capture your audience's attention. Influencer Marketing Adapt it to your needs and capture your audience's attention. Organic Search Adapt it to your needs and capture your audience's attention. Paid Search Adapt it to your needs and capture your audience's attention. Affiliate Marketing Adapt it to your needs and capture your audience's attention. Display Advertising Adapt it to your needs and capture your audience's attention. Others Adapt it to your needs and capture your audience's attention. 10% 15% 15% 16% 15% 19% 10%
  • 25. Social Media Metrics Facebook 0 20 40 60 80 Previous Period Previous Year Fans Count 28,546 0 20 40 60 Previous Period Previous Year Engagement Rate 255.24% Twitter 0 10 20 30 40 50 Previous Period Previous Year Followers 543,643 0 20 40 60 80 Previous Period Previous Year Mentions 5,234 0 20 40 60 80 100 Previous Period Previous Year Subscribers 645 0 20 40 60 80 Previous Period Previous Year Video Views 13 YouTube 0 20 40 60 80 Previous Period Previous Year Followers 6,533 0 20 40 60 80 100 Previous Period Previous Year Likes 332,524 Instagram 25
  • 26. Paid Search Analytics Budget Conversions Clicks Impressions This slide is 100% editable. Adapt it to your needs and capture your audience’s attention.Analysis: CPA:$8.21 Conversion rate:18.26% Ctr:3.56% Budget 35.28% Key StatusMarch ( Change Form February) $1255.74 ( 8.99) 37,124 ( 9.59) 188 ( 6.84) 44 ( 38.18) 26
  • 27. Organic Vs Paid Search Traffic-1 Sessions %New User Bounce Rate Goal 1 Completion All Channels 61,473 81.4% 33.2% 2,893 709 12.4 12.6 2,893 Organic Search Traffic 44,493 95,1% 73,2% 1,265 36,230 11.5 2.1 1,265 Paid Search Traffic 6,900 99.3% 35.7% 33 45.000 8.7 15 33 27
  • 28. Organic Vs Paid Search Traffic-2 59 30 0 10 20 30 40 50 60 70 2017 Organic Search Paid Search Pages/Session 61 40 0 10 20 30 40 50 60 70 2018 Organic Search Paid Search Bounce Rate 56 34 0 10 20 30 40 50 60 2016 Organic Search Paid Search Avg. Session Duration This graph/chart is linked to excel, and changes automatically based on data. Just left click on it and select “Edit Data”. 28
  • 29. Last 30 Days Result This slide is 100% editable. 1.3 Bn +1.8% This slide is 100% editable. 378 Bn +35.0% This slide is 100% editable. 3.2 Bn +3.4% This slide is 100% editable. 1.2 Bn +3.6% $ 0.42 $ 0.42 +10.6% This slide is 100% editable. This slide is 100% editable. Adapt it to your needs and capture your audience's attention. This slide is 100% editable. Adapt it to your needs and capture your audience's attention. This slide is 100% editable. Adapt it to your needs and capture your audience's attention. This slide is 100% editable. Adapt it to your needs and capture your audience's attention. This slide is 100% editable. Adapt it to your needs and capture your audience's attention. $ 0.62BN This slide is 100% editable. 29
  • 30. Customers Sourced By Marketing 30 35 50 60 80 110 130 145 0 50 100 150 Week 1 Week 2 Week 3 Week 4 Week 5 Week 6 Week 7 Week 8 Customers Generated By Marketing(%) Cumulative Frequency This graph/chart is linked to excel, and changes automatically based on data. Just left click on it and select “Edit Data”. 30
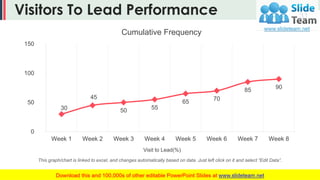
  • 31. Visitors To Lead Performance 30 45 50 55 65 70 85 90 0 50 100 150 Week 1 Week 2 Week 3 Week 4 Week 5 Week 6 Week 7 Week 8 Visit to Lead(%) Cumulative Frequency This graph/chart is linked to excel, and changes automatically based on data. Just left click on it and select “Edit Data”. 31
  • 32. Leads To Customer Performance 20 30 44 35 60 48 77 61 0 10 20 30 40 50 60 70 80 90 Week 1 Week 2 Week 3 Week 4 Week 5 Week 6 Week 7 Week 8 Line Graph This graph/chart is linked to excel, and changes automatically based on data. Just left click on it and select “Edit Data”. 32
  • 33. Channel Partners This slide is 100% editable. Adapt it to your needs and capture your audience's attention. Partner 01 This slide is 100% editable. Adapt it to your needs and capture your audience's attention. Partner 03 This slide is 100% editable. Adapt it to your needs and capture your audience's attention. Partner 02 This slide is 100% editable. Adapt it to your needs and capture your audience's attention. Partner 04 33
  • 34. Top Channel Sales People This slide is 100% editable. Adapt it to your needs and capture your audience's attention. This slide is 100% editable. Adapt it to your needs and capture your audience's attention. This slide is 100% editable. Adapt it to your needs and capture your audience's attention. 03 01 02 34
  • 35. Top Marketing Campaigns Campaign Daily Budget $ Max pub. Cost $ Max % Of budget Margin% (Goal = 25%) Number of days at or above budget Campaign 1 $3,000 $3,091.39 100% 30.9% 14 Campaign 2 $2,444 $1,530.50 125% 39.4% 8 Campaign 3 $233 $578.70 134% 34.1% 5 Campaign 4 $45 $40.67 116% 98.7% 5 35
  • 36. Our Trade Show Calendar 2017 1 2 3 4 5 6 7 8 9 10 11 12 13 14 15 16 17 18 19 20 21 22 23 24 25 26 27 28 29 30 31 Jan Feb Mar Apr May Jun Jul Aug Sep Oct Nov Dec 36 This slide is 100% editable. This slide is 100% editable. This slide is 100% editable. This slide is 100% editable. This slide is 100% editable. This slide is 100% editable.
  • 37. Customer Service Benchmarking Phases 10% Very Poor 33% Poor 50% Okay 75% Good 100% Excellent Phase 1 Phase 2 Phase 3 Phase 4 Phase 5 37
  • 38. Direct Mail Campaigns This icon is for display purposes only and is completely editable. You can replace this with any other icon from the www.slideteam.net icons section. Point of purchase This icon is for display purposes only and is completely editable. You can replace this with any other icon from the www.slideteam.net icons section. Public relationship This icon is for display purposes only and is completely editable. You can replace this with any other icon from the www.slideteam.net icons section. Direct mail campaign This icon is for display purposes only and is completely editable. You can replace this with any other icon from the www.slideteam.net icons section. Direct mail print advertising This icon is for display purposes only and is completely editable. You can replace this with any other icon from the www.slideteam.net icons section. Broadcast advertising 38
  • 39. Direct Mail Plans 27% 10.00% 18.00% 51.70% 20.00% 30.00% 18.00% 11.00% 13.00% 47.30% 30% 15.00% 0% 10% 20% 30% 40% 50% 60% Haven't Done/ Won't do Cut Altogether Cut Down Stay The Same Increase a Little Increase a Lot Direct Mail Plans for 2017 and 2018 Planned Use Usage 39
  • 40. Advertising Reviews-1 Advertising Review 1 Source Opportunity Qty % Of Total Quote Qty Quote $ Sold Qty Sales $ Yellow Page 6 9.09% 6 $1,521.47 0 $0.00 Referral 5 9.04% 5 $1,521.47 0 $0.00 Newspaper 2 4.55% 0 $0.00 2 $0.00 Mailing 8 50.00% 8 $5,037.43 4 $0.00 Product Total 5 36.36% 2 $6,630.73 3 $4,561.87 40
  • 41. Advertising Reviews-2 Advertising Review 2 Source Opportunity Qty % Of Total Quote Qty Quote $ Sold Qty Sales $ Referral 4 33.33% 3 $1,002.62 0 $0.00 Newspaper 3 50.00% 2 $1,457.50 0 $0.00 Mailing 2 16.67% 1 $2,496.24 0 $0.00 Product Total 9 10.67% 6 $4,973.36 0 $0.00 41
  • 42. Advertising Spent On Different Mediums 42 OpportunityTime Spent Ad Spend 0 10 20 30 40 50 Print Radio T.V Internet Media %OfTotalMediaConsumptionTime OrAdvertisingSpending 21% 24% 15% 20% 31% 23% 25% 25% 37% 5%
  • 43. Global Ad Spend By Medium (%) 0% 5% 10% 15% 20% 25% 30% 35% 40% 45% Desktop Internet Mobile Internet Newspapers Magazines Outdoor Radio Cinema Jul-17 Aug-17 43 This graph/chart is linked to excel, and changes automatically based on data. Just left click on it and select “Edit Data”.
  • 44. Print Media Publication Report Inbound Calls Connected 35% Appointment Requested 44% Appointment Results 22% 50 45 30 35 44 18 35 25 20 0 10 20 30 40 50 60 Dawn News The News Daily Times Express Tribune Business Recorder The Nation Pakistan Today Pakistan Observer Hindustan Times Appointment Results Magazines 79% Publications 21% 44
  • 45. Telemarketing Report 0 10 20 30 40 50 60 70 80 90 100 Total Cost Cold- Calling Value Proposition Qualified Lead Audience Acqusition Contact Discovery Inpercentage Use Of Telemarketing Within a Lead Generation Strategy 45
  • 46. 46Telemarketing Report The Washington Post 25% The New York Times 20% The Wall Street Journal 35% 0 2 4 6 8 10 Sun Mon Tue Wed Thu Fri Sat Total Calls Connected Calls
  • 47. Competitive Intelligence Task Item Competitors Markets Products Industries Vendors Customers Item 1 Item 2 Item 3 Item 4 Item 5 Item 6 47
  • 48. Competitive Intelligence High Low SecondAttribute HighFirst Attribute ✓ This slide is 100% editable. Adapt it to your needs and capture your audience's attention. ✓ This slide is 100% editable. Adapt it to your needs and capture your audience's attention. ✓ This slide is 100% editable. Adapt it to your needs and capture your audience's attention. ✓ This slide is 100% editable. Adapt it to your needs and capture your audience's attention. 48
  • 49. This slide is 100% editable. Adapt it to your needs and capture your audience's attention. Regional Events This slide is 100% editable. Adapt it to your needs and capture your audience's attention. Press Release This slide is 100% editable. Adapt it to your needs and capture your audience's attention. Referral Program This slide is 100% editable. Adapt it to your needs and capture your audience's attention. Trade Shows This slide is 100% editable. Adapt it to your needs and capture your audience's attention. Buy Back Program Channel Promotional Events 49
  • 50. Case Study This slide is 100% editable. Adapt it to your needs and capture your audience's attention. Problems 01 This slide is 100% editable. Adapt it to your needs and capture your audience's attention. Solutions 02 This slide is 100% editable. Adapt it to your needs and capture your audience's attention. Benefits 03 50
  • 51. Customer Testimonials This slide is 100% editable. Adapt it to your needs and capture your audience's attention. PETER SMITH Finance Manager This slide is 100% editable. Adapt it to your needs and capture your audience's attention. ANITA SMITH Product Manager This slide is 100% editable. Adapt it to your needs and capture your audience's attention. MARRY SMITH CEO & Founder 51
  • 52. Marketing Plan This slide is 100% editable. Adapt it to your needs and capture your audience's attention. Plan 05 This slide is 100% editable. Adapt it to your needs and capture your audience's attention. Plan 02 This slide is 100% editable. Adapt it to your needs and capture your audience's attention. Plan 03 This slide is 100% editable. Adapt it to your needs and capture your audience's attention. Plan 04 This slide is 100% editable. Adapt it to your needs and capture your audience's attention. Plan 01 52
  • 53. Monthly Advertising Plan Advertising Plan Years Jan Feb Mar Apr May Jun Jul Aug Sep Oct Nov Dec 2013 2014 2015 2016 2017 53 This slide is 100% editable. This slide is 100% editable. This slide is 100% editable. This slide is 100% editable. This slide is 100% editable.
  • 54. ✓ This slide is 100% editable. Adapt it to your needs and capture your audience's attention. ✓ This slide is 100% editable. Adapt it to your needs and capture your audience's attention. ✓ This slide is 100% editable. Adapt it to your needs and capture your audience's attention. ✓ This slide is 100% editable. Adapt it to your needs and capture your audience's attention. Roadmap to Monthly Plans 54 01 02 03 04
  • 57. Our Mission Mission 01 This slide is 100% editable. Adapt it to your needs and capture your audience's attention. Mission 02 This slide is 100% editable. Adapt it to your needs and capture your audience's attention. Mission 03 This slide is 100% editable. Adapt it to your needs and capture your audience's attention. 57
  • 58. Meet Our Team CEO & Founder This slide is 100% editable. Adapt it to your needs and capture your audience's attention. John Hill Finance Manager This slide is 100% editable. Adapt it to your needs and capture your audience's attention. Julie Parker Accountant This slide is 100% editable. Adapt it to your needs and capture your audience's attention. Lee Hester Designer This slide is 100% editable. Adapt it to your needs and capture your audience's attention. Miller Bails 58
  • 59. About Our Company Target Audiences This slide is 100% editable. Adapt it to your needs and capture your audience's attention. Preferred by Many This slide is 100% editable. Adapt it to your needs and capture your audience's attention. Values Client This slide is 100% editable. Adapt it to your needs and capture your audience's attention. 59
  • 60. Our Goal Goal 01 This slide is 100% editable. Adapt it to your needs and capture your audience's attention. Goal 02 This slide is 100% editable. Adapt it to your needs and capture your audience's attention. 60
  • 61. Comparison 40% This slide is 100% editable. Adapt it to your needs and capture your audience's attention. 85% This slide is 100% editable. Adapt it to your needs and capture your audience's attention. 61
  • 62. Dashboard This slide is 100% editable. Adapt it to your needs and capture your audience's attention. Low 30% This slide is 100% editable. Adapt it to your needs and capture your audience's attention. Medium 45% This slide is 100% editable. Adapt it to your needs and capture your audience's attention. High 90% 62
  • 63. Location 75% 22% 45% 32% 68% North America This slide is 100% editable. This slide is 100% editable. South America This slide is 100% editable. Africa This slide is 100% editable. Australia This slide is 100% editable. Asia 63
  • 64. Timeline Start This slide is 100% editable. Adapt it to your needs and capture your audience's attention. Mar/23 This slide is 100% editable. Adapt it to your needs and capture your audience's attention. Aug/29 This slide is 100% editable. Adapt it to your needs and capture your audience's attention. Jan/13 This slide is 100% editable. Adapt it to your needs and capture your audience's attention. May/25 64
  • 65. Timeline (continued…) Finish This slide is 100% editable. Adapt it to your needs and capture your audience's attention. Sep/10 This slide is 100% editable. Adapt it to your needs and capture your audience's attention. Nov/22 This slide is 100% editable. Adapt it to your needs and capture your audience's attention. Oct/30 This slide is 100% editable. Adapt it to your needs and capture your audience's attention. Dec/12 65
  • 66. Our Target This slide is 100% editable. Adapt it to your needs and capture your audience's attention. 01 This slide is 100% editable. Adapt it to your needs and capture your audience's attention. 02 This slide is 100% editable. Adapt it to your needs and capture your audience's attention. 03 66
  • 67. Information technology and business are becoming inextricably interwoven. I don’t think anybody can talk meaningfully about one without the talking about the other. -BILL GATES 67
  • 68. Lego This slide is 100% editable. Adapt it to your needs and capture your audience's attention. This slide is 100% editable. Adapt it to your needs and capture your audience's attention. This slide is 100% editable. Adapt it to your needs and capture your audience's attention. This slide is 100% editable. Adapt it to your needs and capture your audience's attention. This slide is 100% editable. Adapt it to your needs and capture your audience's attention. 68
  • 69. Matrix ✓ This slide is 100% editable. Adapt it to your needs and capture your audience's attention. ✓ This slide is 100% editable. Adapt it to your needs and capture your audience's attention. ✓ This slide is 100% editable. Adapt it to your needs and capture your audience's attention. ✓ This slide is 100% editable. Adapt it to your needs and capture your audience's attention. HIGH LOW HIGH Stars Question Marks Cash Cows Dogs 69
  • 70. Silhouettes This slide is 100% editable. Adapt it to your needs and capture your audience's attention. 70
  • 71. Important Notes This slide is 100% editable. Adapt it to your needs and capture your audience's attention. This slide is 100% editable. Adapt it to your needs and capture your audience's attention. 01 02 03 04 This slide is 100% editable. Adapt it to your needs and capture your audience's attention. This slide is 100% editable. Adapt it to your needs and capture your audience's attention. This slide is 100% editable. Adapt it to your needs and capture your audience's attention. 71
  • 72. This slide is 100% editable Adapt it to your needs and capture your audience's attention. Basic $50 This slide is 100% editable Adapt it to your needs and capture your audience's attention. Standard $17 This slide is 100% editable Adapt it to your needs and capture your audience's attention. Professional $29 This slide is 100% editable Adapt it to your needs and capture your audience's attention. Enterprise $59 Financial 72
  • 73. Mind Map This slide is 100% editable. Adapt it to your needs and capture your audience's attention. This slide is 100% editable. Adapt it to your needs and capture your audience's attention. This slide is 100% editable. Adapt it to your needs and capture your audience's attention. This slide is 100% editable. Adapt it to your needs and capture your audience's attention. This slide is 100% editable. Adapt it to your needs and capture your audience's attention. 73
  • 74. SWOT S W O T Strength This slide is 100% editable. Adapt it to your needs and capture your audience's attention. Weakness This slide is 100% editable. Adapt it to your needs and capture your audience's attention. Opportunity This slide is 100% editable. Adapt it to your needs and capture your audience's attention. Threat This slide is 100% editable. Adapt it to your needs and capture your audience's attention. 74
  • 75. NEWS PAPER This slide is 100% editable. Adapt it to your needs and capture your audience's attention. This slide is 100% editable. Adapt it to your needs and capture your audience's attention. Adapt it to your needs and capture your audience's attention. This slide is 100% editable. Adapt it to your needs and capture your audience's attention. Adapt it to your needs and capture your audience's attention. This slide is 100% editable. Adapt it to your needs and capture your audience's attention. This slide is 100% editable. Adapt it to your needs and capture your audience's attention. This slide is 100% editable. Adapt it to your needs and capture your audience's attention. This slide is 100% editable. Adapt it to your needs and capture your audience's attention. Adapt it to your needs and capture your audience's attention. This slide is 100% editable. Adapt it to your needs and capture your audience's attention. Adapt it to your needs and capture your audience's attention. This slide is 100% editable. Adapt it to your needs and capture your audience's attention. Adapt it to your needs and capture your audience's attention. This slide is 100% editable. Adapt it to your needs and capture your audience's attention. Adapt it to your needs and capture your audience's attention. This slide is 100% editable. Adapt it to your needs and capture your audience's attention. Project 01 This slide is 100% editable. Adapt it to your needs and capture your audience's attention. Project 02 This slide is 100% editable. Adapt it to your needs and capture your audience's attention. Newspaper 75
  • 76. Hierarchy Chart This slide is 100% editable. This slide is 100% editable. This slide is 100% editable. This slide is 100% editable. This slide is 100% editable. This slide is 100% editable. Adapt it to your needs and capture your audience's attention. 76
  • 77. Venn 25% 75% 35% This slide is 100% editable. Adapt it to your needs and capture your audience's attention. This slide is 100% editable. Adapt it to your needs and capture your audience's attention. This slide is 100% editable. Adapt it to your needs and capture your audience's attention. 77
  • 78. 0 10 20 30 40 50 60 70 80 90 100 FY '16 FY '17 FY '18 SalesinPercentage(%) Product 01 This slide is 100% editable. Adapt it to your needs and capture your audience's attention. Product 02 This slide is 100% editable. Adapt it to your needs and capture your audience's attention. Product 03 This slide is 100% editable. Adapt it to your needs and capture your audience's attention. This graph/chart is linked to excel, and changes automatically based on data. Just left click on it and select “Edit Data”. Bar Graph 78
  • 79. Magnifying Glass ✓ This slide is 100% editable. Adapt it to your needs and capture your audience's attention. ✓ This slide is 100% editable. Adapt it to your needs and capture your audience's attention. ✓ This slide is 100% editable. Adapt it to your needs and capture your audience's attention. ✓ This slide is 100% editable. Adapt it to your needs and capture your audience's attention. 79
  • 80. Thank YouEmail Address: emailaddress@123.com Address # street number, city, state Contact Numbers: 0123456789