SlideShare a Scribd company logo
IJRET: International Journal of Research in Engineering and Technology eISSN: 2319-1163 | pISSN: 2321-7308
__________________________________________________________________________________________
Volume: 02 Issue: 07 | Jul-2013, Available @ http://www.ijret.org 124
COMPARISON OF PERCENTAGE STEEL AND CONCRETE
QUANTITIES OF A R.C BUILDING IN DIFFERENT SEISMIC ZONES
Kiran Kumar1
, G. Papa Rao2
1
M. Tech Scholar, 2
Associate Professor, Department of Civil Engineering, GVP College of Engineering (A)
Visakhapatnam – 530 048, India, kirankumaradapa@gmail.com, gprao_74@yahoo.co.in
Abstract
This paper addresses the performance and variation of percentage steel and concrete quantities of R.C.C framed structure in different
seismic zones. One of the most frightening and destructive phenomena of a nature is a severe earthquake and it terrible after effect. It
is highly impossible to prevent an earth quake from occurring, but the damage to the buildings can be controlled through proper
design and detailing. Hence it is mandatory to do the seismic analysis and design to structures against collapse. Designing a structure
in such a way that reducing damage during an earthquake makes the structure quite uneconomical, as the earth quake might or might
not occur in its life time and is a rare phenomenon. The present IS code 1893:2002 doesn’t provide information about the variation of
concrete and percentage of steel from zone to zone. This study mainly focus on the comparison of percentage steel and concrete
quantities when the building is designed for gravity loads as per IS 456:2000 and when the building is designed for earthquake forces
in different seismic zones as per IS 1893:2002.
Keywords: Earthquakes, Reinforcement, Ductility, Damageability, STAAD-Pro.
--------------------------------------------------------------------***-------------------------------------------------------------------------
1. INTRODUCTION:
When planning a building against natural hazards like
earthquakes, we can design it to behave in one of the
following three limit states depending on the importance of
the structure:
• Serviceability limit state: In this case, the
structure will undergo little or no structural damage.
Important buildings such as hospitals, places of
assembly, atomic power plants, which are structures
affecting a community, should be designed for elastic
behaviour under expected earthquake forces. These
structures should be serviceable even after the
earthquake has taken place.
• Damage controlled (Damageability) limit state
(Damage threshold level): In this case, if an earthquake
occurs there can be some damage to the structure but it
can be repaired after the event and the structure can
again put to use. Most of the permanent buildings
should come under this category. For this purpose, the
structure should be designed for limited ductile
response only.
• Survival(Collapse threshold level) Limit state: In this
case, the structure may be allowed to be damaged in
the event of an earthquake, but the supports should
stand and be able to carry the permanent loads fully so
that in all cases there should be no caving in of the
structure and no loss of life.
Earthquakes produce large magnitude forces of short duration
that must be resisted by a structure without causing collapse
and preferably without significant damage to the structural
element. The lateral forces due to earthquakes have a major
impact on structural integrity. Lessons from past earthquakes
and research have provided technical solution that will
minimize loss of life and property damage associated with
earthquake. Special detailing is required, and for materials
without inherent ductility, such has concrete and masonry, a
critical part of the solution is to incorporate reinforcement in
the design and construction to assure a ductile responds to
lateral forces. The ductility of the building can be increased
by increasing the reinforcement in the structure. In the case of
Earthquake design, ductility is an essential attribute of a
structure that must respond to strong ground motions
(Andreas, 2001). So, the ductility is related to the control of
whether the structure is able to dissipate the given amount of
seismic energy considered in structural analysis (Pankaj
Agarwal, 2006). Ductility serves as the shock absorber in
building, for it reduces the transmitted force to one that is
sustainable. But the reinforcement plays an important role in
the economy of the structure. The present IS code 1893: 2002
provides information regarding the excess amount of
reinforcement to be used in the earthquake design but it does
not provide the information about the percentage of the steel
that should be increased in the earthquake resistant design
when compared with the normal design as per IS:456-2000.
This study mainly focus on the comparison of percentage
steel and concrete quantities when the building is designed for
gravity loads as per IS: 456-2000 and when the building is
IJRET: International Journal of Research in Engineering and Technology eISSN: 2319-1163 | pISSN: 2321-7308
__________________________________________________________________________________________
Volume: 02 Issue: 07 | Jul-2013, Available @ http://www.ijret.org 125
designed for earthquake forces in different earthquake zones
as per IS 1893:2002.This gives the approximate percentage in
the economy compared with normal design (H J Shah, 2008).
2. METHODOLOGY
Seismic analysis of the structures is carried out on the basis of
lateral force assumed to act along with the gravity loads. The
base shear which is the total horizontal force on the structure
is calculated on the basis of structure mass and fundamental
period of vibration and corresponding mode of shape. The
base shear is distributed along the height of the structure in
terms of lateral forces according to codal provisions
(Kazuhiro, 1987). In this study, a five (G+4) storied RC
building has been analyzed using the equivalent static method
in STAAD-Pro. The plan and elevation of the building taken
for analysis is shown in Fig.1 and Fig.2. The nomenclature of
columns is shown in Fig.3. Three Dimensional view of the
whole structure is shown in Fig.4. Fig.5 is showing the
structure subjecting to the vertical loading and Fig.6 & Fig.7
are showing the structure subjected to loading of earthquake
in “+X” and “+Z” directions.
In the earthquake analysis along with earthquake loads,
vertical loads are also applied. For the earthquake analysis, IS
1893-2002 code was used .The total design seismic base
shear (Vb) along any principal direction shall be determined
by multiplying the design horizontal acceleration in the
considered direction of vibration (Ah)and the seismic weight
of the building.
The Design base shear
(V A ∗ W
Ah = design horizontal acceleration in the considered
direction of vibration
= (Z/2)*(I/R)*(Sa /g)
W = total seismic value of the building
The design base shear (Vb) computed shall be distributed
along the height of the building as per the following
expression (BIS1893: 2000)
Qi =Vb*(Wi*hi2/ Wi*hi2)
Where,
Qi is the design lateral forces at floor i,
Wi is the seismic weights of the floor i, and
hi is the height of the floor i, measured from base
The lateral force on each storey is again distributed based on
the deflection and stiffness of the frame. The total lateral
load in proportion to the stiffness of each frame in all the four
zones (H M Salem, 2011) .The distributed lateral forces
shown in the Fig.6 and Fig.7.
IJRET: International Journal of Research in Engineering and Technology eISSN: 2319-1163 | pISSN: 2321-7308
__________________________________________________________________________________________
Volume: 02 Issue: 07 | Jul-2013, Available @ http://www.ijret.org 126
Fig. 4 3D view of the whole structure Fig. 5 Whole structure subjected to vertical loading
IJRET: International Journal of Research in Engineering and Technology eISSN: 2319-1163 | pISSN: 2321-7308
__________________________________________________________________________________________
Volume: 02 Issue: 07 | Jul-2013, Available @ http://www.ijret.org 127
Fig.6 Structure subjected to Earthquake loading in Fig. 7 Structure subjected to Earthquake loading in
+X direction +Z direction
2.1 Preliminary Data for the Problem Taken:
Table 1: Preliminary Data of the structure considered for seismic analysis
Type of the structure RCC Framed structure
Number of stories G+4
floor to floor height 3.6 m
Plinth height 0.6 m
Walls thickness 230 mm
Grade of concrete M 25
Grade of steel Fe 415
Earthquake load As per IS1893 (Part 1) : 2002
Size of the columns 0.4mx0.4m and 0.45mx0.45m
Size of the beams 0.23mx0.4m
Slab thickness 0.13m
SBC of soil taken 200kN/m²
Type of soil Hard rocky soil
Live load 3kN/m²
Floor finishes 1kN/m²
Seismic zones considered II,III,IV,V
Type of wall Brick masonry
IJRET: International Journal of Research in Engineering and Technology eISSN: 2319-1163 | pISSN: 2321-7308
__________________________________________________________________________________________
Volume: 02 Issue: 07 | Jul-2013, Available @ http://www.ijret.org 128
1.2 Loading Data:
1.2.1 Dead Load (DL)
1. Self weight of slab = 0.13x25 = 3.25kN/m2
2. Floor finishes = 1.00kN/m2
------------------------------
Total DL = 4.25kN/m2
--------------------------------
(Assume 130mm total depth of slab)
3. Weight of walls = 0.23x19x 3.6 = 15.73kN/m
1.2.2 Live Load (LL)
Live Load on each slab = 3.00kN/m2
1.2.3 Earth quake Load (EQL)
As per IS-1893 (Part 1): 2002
1.3 Load Combinations:
The following load combinations are used in the seismic
analysis, as mentioned in the code IS 1893(Part-1): 2002,
Clause no. 6.3.1.2.
1. 1.5(DL+LL)
2. 1.2(DL+LL+EQX)
3. 1.2(DL+LL- EQX)
4. 1.2(DL+LL+ EQZ)
5. 1.2(DL+LL- EQZ)
6. 1.5(DL+ EQX)
7. 1.5(DL- EQX)
8. 1.5(DL+ EQZ)
9. 1.5(DL-EQZ)
10. 0.9DL+ 1.5EQX
11. 0.9DL- 1.5EQX
12. 0.9DL+ 1.5EQZ
13. 0.9DL-1.5EQZ
Earthquake load was considered in +X,-X, +Z and –Z
directions. Thus a total of 13 load combinations are taken for
analysis. Since large amount of data is difficult to handle
manually (M.H. Arslan, 2007), all the load combinations are
analyzed using software STAAD Pro. All the load
combinations are mentioned above.
2. RESULTS:
The variation of support reactions at each location of the
columns and the percentage difference in different seismic
zones with respect to gravity loads is represented in the in
Table 2 and Fig.8. It is observed that in edge columns,
variations are 17.72, 28.35, 42.53, and 63.7% between gravity
load to seismic zones II, III, IV and V respectively. In
exterior columns, the variations are 11.59, 18.54, 27.81, and
41.71% between gravity load to seismic zones II, III, IV and
V respectively. The variation is very small in interior
columns.
Table 2 Comparison of support reactions in different seismic zones
Support Reaction in kN Percentage difference between
LOCATION
OF THE
COLUMNS
DUE TO
GRAVITY
LOAD
(GL)
IN
SEISMIC
ZONE-
II
IN
SEISMIC
ZONE-
III
IN
SEISMIC
ZONE-
IV
IN
SEISMIC
ZONE-
V
GL&
ZONE-
II
GL&
ZONE-
III
GL&
ZONE-
IV
GL&
ZONE-
V
EDGE
COLUMNS
543.40 640.20 698.04 775.13 890.78
17.72% 28.35% 42.53% 63.7%
EXTERIOR
COLUMNS
867.94 968.50 1028.84 1109.24 1129.97
11.59% 18.54% 27.81% 41.71%
INTERIOR
COLUMNS
1295.68 1309.92 1318.46 1329.84 1346.92
1.10% 1.76% 2.64% 3.95%
IJRET: International Journal of Research in Engineering and Technology eISSN: 2319-1163 | pISSN: 2321-7308
__________________________________________________________________________________________
Volume: 02 Issue: 07 | Jul-2013, Available @ http://www.ijret.org 129
Fig. 8 Variation of support reactions in different seismic zones
The variation of volume of concrete at each location of the
column footing and the increase in percentage difference in
different seismic zones with respect to gravity loads is
represented in the in Table 3 and Fig.9. It is observed that in
edge column footings, variations are 17.75, 17.75, 27.17 and
42.0% between gravity load to seismic zones II, III, IV and V
respectively. In exterior column footings, the variations are
21.51, 21.51, 45.15 and 57.77% between gravity load to
seismic zones II, III, IV and V respectively. Therefore, the
volume of concrete in footings is increasing in seismic zones
III, IV and V due to increase of support reactions due to
lateral forces. However the variation is very small in interior
column footings.
Table 3 Comparison of volume of concrete in footings in different seismic zones
Volume of concrete in footings (cu m) Percentage difference between
LOCATION
OF THE
COLUMN
FOOTING
DUE TO
GRAVITY
LOAD
(GL)
IN
SEISMIC
ZONE-
II
IN
SEISMIC
ZONE-
III
IN
SEISMIC
ZONE-
IV
IN
SEISMIC
ZONE-
V
GL&
ZONE-
II
GL&
ZONE-
III
GL&
ZONE-
IV
GL&
ZONE-
V
EDGE
COLUMN
FOOTING
2.186
2.574 2.574 2.78 3.1042 17.75% 17.75% 27.17% 42.00%
EXTERIOR
COLUMN
FOOTING
1.506
1.83 1.83 2.186 2.376 21.51% 21.51% 45.15% 57.77%
INTERIOR
COLUMN
FOOTING
3.291 3.291 3.291 3.40 3.40 0.00 0.00 3.51% 3.51%
0
200
400
600
800
1000
1200
1400
1600
GRAVITY ZONE II ZONE III ZONE IV ZONE V
SUPPORTREACTIONS(KN)
TYPE OF LOADING
EDGE COLUMNS
EXTERIOR COLUMNS
INTERIOR COLUMNS
IJRET: International Journal of Research in Engineering and Technology eISSN: 2319-1163 | pISSN: 2321-7308
__________________________________________________________________________________________
Volume: 02 Issue: 07 | Jul-2013, Available @ http://www.ijret.org 130
Fig .9 Variation of volume of concrete in footings in different seismic zones
The variation of weight of steel at each location of the column
footing and the percentage difference in different seismic
zones with respect to gravity loads is represented in the in
Table 4 and Fig.10. It is observed that in edge column
footings, variations are 0.0, 23.61, 47.92, and 98.96%
between gravity load to seismic zones II, III, IV and V
respectively. In exterior column footings, the variations are
38.17, 54.88, 70.79 and 91.04% between gravity loads to
seismic zones II, III, IV and V respectively. In the interior
columns footings, the variations are 22.07, 42.44, 56.03 and
67.91% between gravity loads to seismic zones II, III, IV and
V respectively.
Table 4 Comparison of weight of the steel in footings in different seismic zones
Weight of steel in footings(kg’s) Percentage difference between
LOCATION
OF THE
COLUMN
FOOTING
DUE TO
GRAVITY
LOAD
(GL)
IN
SEISMIC
ZONE-
II
IN
SEISMIC
ZONE-
III
IN
SEISMIC
ZONE-
IV
IN
SEISMIC
ZONE-
V
GL&
ZONE-
II
GL&
ZONE-
III
GL&
ZONE-
IV
GL&
ZONE-
V
EDGE
COLUMN
FOOTING
28.80 28.80 35.60 42.60 57.30 0.00 23.61% 47.92% 98.96%
EXTERIOR
COLUMN
FOOTING
46.90 64.8 72.64 80.10 89.60 38.17% 54.88% 70.79% 91.04%
INTERIOR
COLUMN
FOOTING
58.90 71.9 83.9 91.9 98.9 22.07% 42.44% 56.03% 67.91%
0
0.5
1
1.5
2
2.5
3
3.5
4
GRAVITY ZONE II ZONE III ZONE IV ZONE V
CONCRETEIN(CUM)
TYPE OF LOADING
EDGE FOOTINGS
EXTERIOR FOOTINGS
INTERIOR FOOTINGS
IJRET: International Journal of Research in Engineering and Technology eISSN: 2319-1163 | pISSN: 2321-7308
__________________________________________________________________________________________
Volume: 02 Issue: 07 | Jul-2013, Available @ http://www.ijret.org 131
Fig. 10 Variation of weight of steel in footings in different seismic zones
The variation of percentage of steel at each location of the
column in different seismic zones with respect to gravity
loads is represented in the in Table 5 and Fig.11. The
variation of percentage of steel in edge columns vary from
0.8% to 3%, exterior columns varying from 0.8% to 3.9% and
interior columns varying from 1.1% to 3.7% between gravity
loads to zone V. For the comparison purpose at each location,
the cross sectional dimension of column was kept same in all
the zones.
Table 5 Comparison of percentage of the steel in columns in different seismic zones
% of the steel reinforcement in columns
LOCATION
OF THE
COLUMN
DUE TO
GRAVITY
LOAD
IN SEISMIC
ZONE-
II
IN SEISMIC
ZONE-
III
IN
SEISMICZO
NE-
IV
IN SEISMIC
ZONE-
V
EDGE
COLUMN
0.8 0.9 1 1.5 3
EXTERIOR
COLUMN
0.8 0.9 1.5 2.3 3.9
INTERIOR
COLUMN
1.1 1.3 1.8 2.4 3.7
Note: For the comparison purpose at each location, the cross sectional dimension of column was kept same
in all the zones.
0.00
20.00
40.00
60.00
80.00
100.00
120.00
GRAVITY ZONE II ZONE III ZONE IV ZONE V
WEIGHTOFSTEELIN(KG'S)
TYPE OF LOADING
EDGE FOOTINGS
EXTERIOR FOOTINGS
INTERIOR FOOTINGS
IJRET: International Journal of Research in Engineering and Technology eISSN: 2319-1163 | pISSN: 2321-7308
__________________________________________________________________________________________
Volume: 02 Issue: 07 | Jul-2013, Available @ http://www.ijret.org 132
Fig. 11 Variation of percentage of steel in columns in different seismic zones
The variation of percentage of steel in beams in different
seismic zones with respect to gravity loads is represented in
the in Table 6 and Fig.12. The variation of percentage of steel
at supports, in external beams 0.54% to 1.23% and in internal
beams 0.78% to 1.4% varying from gravity loads to zone V.
At mid span locations of external and internal beams, the
percentage of reinforcement is same in all the zones.
Table 6 Comparison of percentage of the steel in beams in different seismic zones
LOCATION BEAMS
% of the steel reinforcement in beams
GRAVITY
LOAD
(G L)
IN
SEISMIC
ZONE-
II
IN
SEISMIC
ZONE-
III
IN
SEISMIC
ZONE-
IV
IN
SEISMIC
ZONE-
V
AT
SUPPORTS
EXTERNAL
BEAMS 0.54 0.64 0.75 0.93 1.23
INTERNAL
BEAMS 0.78 0.83 0.97 1.18 1.4
AT
MID SPAN
EXTERNAL
BEAMS 0.32 0.32 0.32 0.32 0.32
INTERNAL
BEAMS 0.42 0.42 0.42 0.42 0.42
Note: For the comparison purpose at each location, the cross sectional dimension of beams was kept
same in all the zones.
0
0.5
1
1.5
2
2.5
3
3.5
4
4.5
GRAVITY ZONE II ZONE III ZONE IV ZONE V
PERCENTAGEOFSTEEL
TYPE OF LOADING
EDGE COLUMNS
EXTERIOR COLUMNS
INTERIOR COUMNS
IJRET: International Journal of Research in Engineering and Technology eISSN: 2319-1163 | pISSN: 2321-7308
__________________________________________________________________________________________
Volume: 02 Issue: 07 | Jul-2013, Available @ http://www.ijret.org 133
Fig. 12 Percentage of steel in beams in different seismic zones
The variation of weight of steel at each location of the beams
and the percentage difference in different seismic zones with
respect to gravity loads is represented in the in Table 7 and
Fig.13. It is observed that in external beams, variations are
4.38, 13.8, 31.3, and 49.6% between gravity loads to seismic
zones II, III, IV and V respectively. In the internal beams, the
variations are 3.07, 15.3, 20.2 and 53.3% between gravity
loads to seismic zones II, III, IV and V respectively.
Table 7 Comparison of weight of the steel in beams in different seismic zones
Weight of the steel (kg’s)
% difference of weight of steel in
beams between
BEAMS
GRAVITY
LOAD
(G L)
ZONE
II
ZONE
III
ZONE
IV
ZONE
V
GL&
ZONE-
II
GL&
ZONE-
III
GL&
ZONE-
IV
GL&
ZONE-
V
EXTERNAL
BEAMS
137 143 156 180 205 4.38 13.8 31.3 49.6
INTERNAL
BEAMS
163 168 188 196 250 3.07 15.3 20.2 53.3
Note: For the comparison purpose at each location, the cross sectional dimension of beams was kept same in
all the zones.
0
0.2
0.4
0.6
0.8
1
1.2
1.4
1.6
GRAVITY ZONEII ZONE III ZONE IV ZONE V
PERCENTAGEOFSTEEL
TYPE OF LOADING
AT SUPPORTS EXTERNAL
BEAMS
AT SUPPORTS INTERNAL
BEAMS
AT MID SPAN INTERNAL
BEAMS
AT MID SPAN EXTERNAL
BEAMS
IJRET: International Journal of Research in Engineering and Technology eISSN: 2319-1163 | pISSN: 2321-7308
__________________________________________________________________________________________
Volume: 02 Issue: 07 | Jul-2013, Available @ http://www.ijret.org 134
Fig. 13 Variation of weight of steel in beams in different seismic zones
CONCLUSIONS
The following conclusions can be made based on the analysis
and design of RC school building designed for gravity loads
and earthquake forces in all the zones.
1. The variation of support reactions in exterior columns
increasing from 11.59% to 41.71% and in edge
columns increasing from 17.72% to 63.7% in seismic
Zones II to V. However the variation of support
reactions are very small in interior columns.
2. The volume of concrete in exterior and edge column
footings is increasing in seismic zones III, IV and V
due to increase of support reactions with the effect of
lateral forces. However the variation is very small in
interior column footings.
3. The variation of percentage of steel at support
sections in external beams is 0.54% to 1.23% and in
internal beams is 0.78% to 1.4%.
4. In the external and internal beams, the percentage of
bottom middle reinforcement is almost the same for
both earthquake and non earthquake designs.
REFERENCES:
[1] Andreas J. Kappos, Alireza Manafpour (2001), “Seismic
Design of R/C Buildings with the Aid of Advanced
Analytical Techniques”, Engineering Structures,
Elsevier, 23, 319-332.
[2] 2. BIS: 1893 (PART 1)-2002 “Criteria For Earthquake
Design Of Structures: General provisions and
buildings”(Fifth revision), Bureau of Indian Standards ,
New Delhi
[3] 3. IS 456(2000), “Plain and Reinforced Concrete-
Code of Practice”, Bureau of Indian standards, New
Delhi.
[4] 4. Design Aids for Reinforced concrete to IS: 456-
1978(SP-16), Bureau of Indian standards, New Delhi.
[5] 5. H. M. Salem, A. K. El-Fouly, H.S. Tagel-Din (2011),
“Toward an Economic Design of Reinforced Concrete
Structures Against Progressive Collapse”,
Engineering Structures, Elsevier, 33,3341-3350.
[6] 6. H.J. Shah and Sudhir K. Jain (2008), “Final Report:
A -Earthquake Codes IITK-GSDMA Project on
Building Codes (Design Example of a Six Storey
Building)”, IITK-GSDMA-EQ26-V3.0
[7] 7. Kazuhiro Kitayama, Shunsuke Otani and Hiroyuki
Aoyama (1987), “Earthquake Resistant Design Criteria
for Reinforced Concrete Interior Beam-column Joints”,
Published in the Proceedings, Pacific Conference on
Earthquake Engineering, Wairakei, New Zealand,
August, 5-8, 1,315-326.
[8] 8. M.H. Arslan, H.H. Korkmaz (2007), “What is to be
Learned from Damage and Failure of Reinforced
Concrete Structures during Recent Earthquakes in
Turkey?”, Engineering Failure Analysis, Elsevier, 14,1–
22.
[9] 9. Pankaj Agrawal and Manish Shrikhande (2006),
“Earthquake Resistance Design Of Structures”, ISBN
978- 81-203-3892-1, PHI Learning Private
Limited.
0
50
100
150
200
250
300
GRAVITY ZONE II ZONE III ZONE IV ZONE V
WEIGHTOFSTEELIN(KG'S)
TYPE OF LOADING
EXTERNAL BEAMS
INTERNAL BEAMS

More Related Content

PDF
Earthquake Analysis of Multi Storied Residential Building - A Case Study
PDF
Earth quake response of different shapes of mivan wall tall buildings
PDF
Dl3211461149
PDF
Analysis and connection designs of precast load bearing wall
PDF
Seismic evaluation & retrofit assessment of jlnm hospital, rainawari srinaga
PDF
IRJET- Effect of Different Soil Conditions on Seismic Response of Multi-Store...
PDF
Seismic Performance of Reinforced Cement Concrete Structures with and Without...
PDF
Seismic evaluation of masonry building a case study
Earthquake Analysis of Multi Storied Residential Building - A Case Study
Earth quake response of different shapes of mivan wall tall buildings
Dl3211461149
Analysis and connection designs of precast load bearing wall
Seismic evaluation & retrofit assessment of jlnm hospital, rainawari srinaga
IRJET- Effect of Different Soil Conditions on Seismic Response of Multi-Store...
Seismic Performance of Reinforced Cement Concrete Structures with and Without...
Seismic evaluation of masonry building a case study

What's hot (18)

PDF
E0344042054
PDF
IRJET- Seismic Analysis of Building Resting on Sloping Ground with Soil S...
PDF
Comparative Study of Response of Structures Subjected To Blast and Earthquake...
PDF
IRJET-Analysis of G+25 RCC Bare Framed Structure with Shear Wall Under the Ef...
PDF
20320140505010
PDF
IRJET- Comparative Study of Vertically Irregular Buildings Subjected to S...
PDF
IRJET- Seismic Behaviour of Buildings Resting on Sloping Ground
PDF
The optimum location of shear wall in high rise r.c bulidings under lateral l...
PDF
Review paper on seismic responses of multistored rcc building with mass irreg...
PDF
Optimization of a multistorey building by optimum
PDF
IRJET- Analysis and Design of Regular and Irregular Buildings
PDF
Earthquake Resistance Design-Impact On Cost Of Reinforced Concrete Builidings
PDF
Evaluation of Structural Implication of Incorporating Base Isolator as Earthq...
PDF
Seismic analysis of vertical irregular multistoried building
PDF
Lf3519191924
PDF
Dynamic Response of High Rise Structures Under The Influence of Shear Walls
PDF
Seismic Analysis of Regular and Irregular Buildings with Vertical Irregularit...
PDF
IRJET- Comparative Study on CFST and Steel Diagrid Structural System for High...
E0344042054
IRJET- Seismic Analysis of Building Resting on Sloping Ground with Soil S...
Comparative Study of Response of Structures Subjected To Blast and Earthquake...
IRJET-Analysis of G+25 RCC Bare Framed Structure with Shear Wall Under the Ef...
20320140505010
IRJET- Comparative Study of Vertically Irregular Buildings Subjected to S...
IRJET- Seismic Behaviour of Buildings Resting on Sloping Ground
The optimum location of shear wall in high rise r.c bulidings under lateral l...
Review paper on seismic responses of multistored rcc building with mass irreg...
Optimization of a multistorey building by optimum
IRJET- Analysis and Design of Regular and Irregular Buildings
Earthquake Resistance Design-Impact On Cost Of Reinforced Concrete Builidings
Evaluation of Structural Implication of Incorporating Base Isolator as Earthq...
Seismic analysis of vertical irregular multistoried building
Lf3519191924
Dynamic Response of High Rise Structures Under The Influence of Shear Walls
Seismic Analysis of Regular and Irregular Buildings with Vertical Irregularit...
IRJET- Comparative Study on CFST and Steel Diagrid Structural System for High...
Ad

Viewers also liked (20)

PDF
Partial encryption of compresed video
PDF
Fault model analysis by parasitic extraction method for embedded sram
PDF
An investigation of the design implications for openings
PDF
Experimental evaluation of performance of electrical
PDF
Moderate quality of voice transmission using 8 bit micro-controller through z...
PDF
A vm scheduling algorithm for reducing power consumption of a virtual machine...
PDF
Structural evaluation of low volume road pavements using pavement dynamic con...
PDF
Optimization of energy in public buildings
PDF
Technical engineering in industrial ippc as a key tool for ambient air qualit...
PDF
New approach for generalised unsharp masking alogorithm
PDF
Modeling and optimization of end milling machining process
PDF
Classification accuracy of sar images for various land
PDF
A case study on energy savings in air conditioning system by heat recovery us...
PDF
Assessment of physicochemical characterstics of
PDF
Testing of memory using franklin method
PDF
Power balancing optimal selective forwarding
PDF
Earthquake analysis on 2 d rc frames with different
PDF
Design and development of fall detector using fall
PDF
A heuristic approach for optimizing travel planning using genetics algorithm
PDF
Treatment of solid waste leachate by
Partial encryption of compresed video
Fault model analysis by parasitic extraction method for embedded sram
An investigation of the design implications for openings
Experimental evaluation of performance of electrical
Moderate quality of voice transmission using 8 bit micro-controller through z...
A vm scheduling algorithm for reducing power consumption of a virtual machine...
Structural evaluation of low volume road pavements using pavement dynamic con...
Optimization of energy in public buildings
Technical engineering in industrial ippc as a key tool for ambient air qualit...
New approach for generalised unsharp masking alogorithm
Modeling and optimization of end milling machining process
Classification accuracy of sar images for various land
A case study on energy savings in air conditioning system by heat recovery us...
Assessment of physicochemical characterstics of
Testing of memory using franklin method
Power balancing optimal selective forwarding
Earthquake analysis on 2 d rc frames with different
Design and development of fall detector using fall
A heuristic approach for optimizing travel planning using genetics algorithm
Treatment of solid waste leachate by
Ad

Similar to Comparison of percentage steel and concrete (20)

PPTX
presentation.pptx
PDF
IRJET- Study and Comparison of Seismic Assessment Parameters in Different...
PPT
OER_RC_1225_008
PDF
DESIGN AND ANALYSIS OF EARTH-QUAKE RESISTANT FOR MULTI-STORIED BUILDING ON A ...
PPTX
Analysis of g+3 rcc storied building
PDF
IRJET- Analysis of Design of Multistorey Framed Structures in Different S...
PDF
IRJET- Earthquake Resistant Design of Multistorey Building
PDF
A Comparative Seismic Evaluation of GFRP Reinforced and Steel Reinforced Conc...
PDF
Dg33646652
PDF
Dg33646652
PDF
A comparative study on force based design and direct displacement based desig...
PDF
Effect of steel bracing on vertically irregular r.c.c building frames under s...
PDF
Design and Analysis of a Multistory Reinforced Concrete Frame in Different Se...
PDF
Optimization of a multistorey building by optimum positioning of shear wall
PDF
IRJET - Study on Lateral Structural System on Different Height on Asymmet...
PDF
Seismic Analysis of Structures under Different Soil Conditions
PDF
IRJET- Comparative Study & Seismic Anyalysis of Regular and Irregular Geometr...
PDF
IRJET - Sesismic Analysis of Multistorey Building using ETABS
PDF
IRJET- Comparative Seismic Analysis of RC G+13 Multistorey Building Frame
PDF
A Study on the Impact of Seismic Performance on RCC Frames
presentation.pptx
IRJET- Study and Comparison of Seismic Assessment Parameters in Different...
OER_RC_1225_008
DESIGN AND ANALYSIS OF EARTH-QUAKE RESISTANT FOR MULTI-STORIED BUILDING ON A ...
Analysis of g+3 rcc storied building
IRJET- Analysis of Design of Multistorey Framed Structures in Different S...
IRJET- Earthquake Resistant Design of Multistorey Building
A Comparative Seismic Evaluation of GFRP Reinforced and Steel Reinforced Conc...
Dg33646652
Dg33646652
A comparative study on force based design and direct displacement based desig...
Effect of steel bracing on vertically irregular r.c.c building frames under s...
Design and Analysis of a Multistory Reinforced Concrete Frame in Different Se...
Optimization of a multistorey building by optimum positioning of shear wall
IRJET - Study on Lateral Structural System on Different Height on Asymmet...
Seismic Analysis of Structures under Different Soil Conditions
IRJET- Comparative Study & Seismic Anyalysis of Regular and Irregular Geometr...
IRJET - Sesismic Analysis of Multistorey Building using ETABS
IRJET- Comparative Seismic Analysis of RC G+13 Multistorey Building Frame
A Study on the Impact of Seismic Performance on RCC Frames

More from eSAT Publishing House (20)

PDF
Likely impacts of hudhud on the environment of visakhapatnam
PDF
Impact of flood disaster in a drought prone area – case study of alampur vill...
PDF
Hudhud cyclone – a severe disaster in visakhapatnam
PDF
Groundwater investigation using geophysical methods a case study of pydibhim...
PDF
Flood related disasters concerned to urban flooding in bangalore, india
PDF
Enhancing post disaster recovery by optimal infrastructure capacity building
PDF
Effect of lintel and lintel band on the global performance of reinforced conc...
PDF
Wind damage to trees in the gitam university campus at visakhapatnam by cyclo...
PDF
Wind damage to buildings, infrastrucuture and landscape elements along the be...
PDF
Shear strength of rc deep beam panels – a review
PDF
Role of voluntary teams of professional engineers in dissater management – ex...
PDF
Risk analysis and environmental hazard management
PDF
Review study on performance of seismically tested repaired shear walls
PDF
Monitoring and assessment of air quality with reference to dust particles (pm...
PDF
Low cost wireless sensor networks and smartphone applications for disaster ma...
PDF
Coastal zones – seismic vulnerability an analysis from east coast of india
PDF
Can fracture mechanics predict damage due disaster of structures
PDF
Assessment of seismic susceptibility of rc buildings
PDF
A geophysical insight of earthquake occurred on 21 st may 2014 off paradip, b...
PDF
Effect of hudhud cyclone on the development of visakhapatnam as smart and gre...
Likely impacts of hudhud on the environment of visakhapatnam
Impact of flood disaster in a drought prone area – case study of alampur vill...
Hudhud cyclone – a severe disaster in visakhapatnam
Groundwater investigation using geophysical methods a case study of pydibhim...
Flood related disasters concerned to urban flooding in bangalore, india
Enhancing post disaster recovery by optimal infrastructure capacity building
Effect of lintel and lintel band on the global performance of reinforced conc...
Wind damage to trees in the gitam university campus at visakhapatnam by cyclo...
Wind damage to buildings, infrastrucuture and landscape elements along the be...
Shear strength of rc deep beam panels – a review
Role of voluntary teams of professional engineers in dissater management – ex...
Risk analysis and environmental hazard management
Review study on performance of seismically tested repaired shear walls
Monitoring and assessment of air quality with reference to dust particles (pm...
Low cost wireless sensor networks and smartphone applications for disaster ma...
Coastal zones – seismic vulnerability an analysis from east coast of india
Can fracture mechanics predict damage due disaster of structures
Assessment of seismic susceptibility of rc buildings
A geophysical insight of earthquake occurred on 21 st may 2014 off paradip, b...
Effect of hudhud cyclone on the development of visakhapatnam as smart and gre...

Recently uploaded (20)

PPTX
Foundation to blockchain - A guide to Blockchain Tech
PPTX
Internet of Things (IOT) - A guide to understanding
PPTX
KTU 2019 -S7-MCN 401 MODULE 2-VINAY.pptx
PPTX
Sustainable Sites - Green Building Construction
PDF
Embodied AI: Ushering in the Next Era of Intelligent Systems
PPTX
MCN 401 KTU-2019-PPE KITS-MODULE 2.pptx
PPTX
Geodesy 1.pptx...............................................
PPT
Mechanical Engineering MATERIALS Selection
PDF
Digital Logic Computer Design lecture notes
PDF
Evaluating the Democratization of the Turkish Armed Forces from a Normative P...
PPTX
UNIT 4 Total Quality Management .pptx
DOCX
573137875-Attendance-Management-System-original
PDF
PPT on Performance Review to get promotions
PPTX
Welding lecture in detail for understanding
PDF
composite construction of structures.pdf
PPTX
Engineering Ethics, Safety and Environment [Autosaved] (1).pptx
PPTX
UNIT-1 - COAL BASED THERMAL POWER PLANTS
PPTX
additive manufacturing of ss316l using mig welding
PDF
Mitigating Risks through Effective Management for Enhancing Organizational Pe...
PPTX
Construction Project Organization Group 2.pptx
Foundation to blockchain - A guide to Blockchain Tech
Internet of Things (IOT) - A guide to understanding
KTU 2019 -S7-MCN 401 MODULE 2-VINAY.pptx
Sustainable Sites - Green Building Construction
Embodied AI: Ushering in the Next Era of Intelligent Systems
MCN 401 KTU-2019-PPE KITS-MODULE 2.pptx
Geodesy 1.pptx...............................................
Mechanical Engineering MATERIALS Selection
Digital Logic Computer Design lecture notes
Evaluating the Democratization of the Turkish Armed Forces from a Normative P...
UNIT 4 Total Quality Management .pptx
573137875-Attendance-Management-System-original
PPT on Performance Review to get promotions
Welding lecture in detail for understanding
composite construction of structures.pdf
Engineering Ethics, Safety and Environment [Autosaved] (1).pptx
UNIT-1 - COAL BASED THERMAL POWER PLANTS
additive manufacturing of ss316l using mig welding
Mitigating Risks through Effective Management for Enhancing Organizational Pe...
Construction Project Organization Group 2.pptx

Comparison of percentage steel and concrete

  • 1. IJRET: International Journal of Research in Engineering and Technology eISSN: 2319-1163 | pISSN: 2321-7308 __________________________________________________________________________________________ Volume: 02 Issue: 07 | Jul-2013, Available @ http://www.ijret.org 124 COMPARISON OF PERCENTAGE STEEL AND CONCRETE QUANTITIES OF A R.C BUILDING IN DIFFERENT SEISMIC ZONES Kiran Kumar1 , G. Papa Rao2 1 M. Tech Scholar, 2 Associate Professor, Department of Civil Engineering, GVP College of Engineering (A) Visakhapatnam – 530 048, India, kirankumaradapa@gmail.com, gprao_74@yahoo.co.in Abstract This paper addresses the performance and variation of percentage steel and concrete quantities of R.C.C framed structure in different seismic zones. One of the most frightening and destructive phenomena of a nature is a severe earthquake and it terrible after effect. It is highly impossible to prevent an earth quake from occurring, but the damage to the buildings can be controlled through proper design and detailing. Hence it is mandatory to do the seismic analysis and design to structures against collapse. Designing a structure in such a way that reducing damage during an earthquake makes the structure quite uneconomical, as the earth quake might or might not occur in its life time and is a rare phenomenon. The present IS code 1893:2002 doesn’t provide information about the variation of concrete and percentage of steel from zone to zone. This study mainly focus on the comparison of percentage steel and concrete quantities when the building is designed for gravity loads as per IS 456:2000 and when the building is designed for earthquake forces in different seismic zones as per IS 1893:2002. Keywords: Earthquakes, Reinforcement, Ductility, Damageability, STAAD-Pro. --------------------------------------------------------------------***------------------------------------------------------------------------- 1. INTRODUCTION: When planning a building against natural hazards like earthquakes, we can design it to behave in one of the following three limit states depending on the importance of the structure: • Serviceability limit state: In this case, the structure will undergo little or no structural damage. Important buildings such as hospitals, places of assembly, atomic power plants, which are structures affecting a community, should be designed for elastic behaviour under expected earthquake forces. These structures should be serviceable even after the earthquake has taken place. • Damage controlled (Damageability) limit state (Damage threshold level): In this case, if an earthquake occurs there can be some damage to the structure but it can be repaired after the event and the structure can again put to use. Most of the permanent buildings should come under this category. For this purpose, the structure should be designed for limited ductile response only. • Survival(Collapse threshold level) Limit state: In this case, the structure may be allowed to be damaged in the event of an earthquake, but the supports should stand and be able to carry the permanent loads fully so that in all cases there should be no caving in of the structure and no loss of life. Earthquakes produce large magnitude forces of short duration that must be resisted by a structure without causing collapse and preferably without significant damage to the structural element. The lateral forces due to earthquakes have a major impact on structural integrity. Lessons from past earthquakes and research have provided technical solution that will minimize loss of life and property damage associated with earthquake. Special detailing is required, and for materials without inherent ductility, such has concrete and masonry, a critical part of the solution is to incorporate reinforcement in the design and construction to assure a ductile responds to lateral forces. The ductility of the building can be increased by increasing the reinforcement in the structure. In the case of Earthquake design, ductility is an essential attribute of a structure that must respond to strong ground motions (Andreas, 2001). So, the ductility is related to the control of whether the structure is able to dissipate the given amount of seismic energy considered in structural analysis (Pankaj Agarwal, 2006). Ductility serves as the shock absorber in building, for it reduces the transmitted force to one that is sustainable. But the reinforcement plays an important role in the economy of the structure. The present IS code 1893: 2002 provides information regarding the excess amount of reinforcement to be used in the earthquake design but it does not provide the information about the percentage of the steel that should be increased in the earthquake resistant design when compared with the normal design as per IS:456-2000. This study mainly focus on the comparison of percentage steel and concrete quantities when the building is designed for gravity loads as per IS: 456-2000 and when the building is
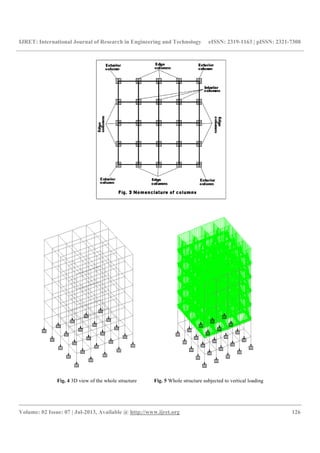
  • 2. IJRET: International Journal of Research in Engineering and Technology eISSN: 2319-1163 | pISSN: 2321-7308 __________________________________________________________________________________________ Volume: 02 Issue: 07 | Jul-2013, Available @ http://www.ijret.org 125 designed for earthquake forces in different earthquake zones as per IS 1893:2002.This gives the approximate percentage in the economy compared with normal design (H J Shah, 2008). 2. METHODOLOGY Seismic analysis of the structures is carried out on the basis of lateral force assumed to act along with the gravity loads. The base shear which is the total horizontal force on the structure is calculated on the basis of structure mass and fundamental period of vibration and corresponding mode of shape. The base shear is distributed along the height of the structure in terms of lateral forces according to codal provisions (Kazuhiro, 1987). In this study, a five (G+4) storied RC building has been analyzed using the equivalent static method in STAAD-Pro. The plan and elevation of the building taken for analysis is shown in Fig.1 and Fig.2. The nomenclature of columns is shown in Fig.3. Three Dimensional view of the whole structure is shown in Fig.4. Fig.5 is showing the structure subjecting to the vertical loading and Fig.6 & Fig.7 are showing the structure subjected to loading of earthquake in “+X” and “+Z” directions. In the earthquake analysis along with earthquake loads, vertical loads are also applied. For the earthquake analysis, IS 1893-2002 code was used .The total design seismic base shear (Vb) along any principal direction shall be determined by multiplying the design horizontal acceleration in the considered direction of vibration (Ah)and the seismic weight of the building. The Design base shear (V A ∗ W Ah = design horizontal acceleration in the considered direction of vibration = (Z/2)*(I/R)*(Sa /g) W = total seismic value of the building The design base shear (Vb) computed shall be distributed along the height of the building as per the following expression (BIS1893: 2000) Qi =Vb*(Wi*hi2/ Wi*hi2) Where, Qi is the design lateral forces at floor i, Wi is the seismic weights of the floor i, and hi is the height of the floor i, measured from base The lateral force on each storey is again distributed based on the deflection and stiffness of the frame. The total lateral load in proportion to the stiffness of each frame in all the four zones (H M Salem, 2011) .The distributed lateral forces shown in the Fig.6 and Fig.7.
  • 3. IJRET: International Journal of Research in Engineering and Technology eISSN: 2319-1163 | pISSN: 2321-7308 __________________________________________________________________________________________ Volume: 02 Issue: 07 | Jul-2013, Available @ http://www.ijret.org 126 Fig. 4 3D view of the whole structure Fig. 5 Whole structure subjected to vertical loading
  • 4. IJRET: International Journal of Research in Engineering and Technology eISSN: 2319-1163 | pISSN: 2321-7308 __________________________________________________________________________________________ Volume: 02 Issue: 07 | Jul-2013, Available @ http://www.ijret.org 127 Fig.6 Structure subjected to Earthquake loading in Fig. 7 Structure subjected to Earthquake loading in +X direction +Z direction 2.1 Preliminary Data for the Problem Taken: Table 1: Preliminary Data of the structure considered for seismic analysis Type of the structure RCC Framed structure Number of stories G+4 floor to floor height 3.6 m Plinth height 0.6 m Walls thickness 230 mm Grade of concrete M 25 Grade of steel Fe 415 Earthquake load As per IS1893 (Part 1) : 2002 Size of the columns 0.4mx0.4m and 0.45mx0.45m Size of the beams 0.23mx0.4m Slab thickness 0.13m SBC of soil taken 200kN/m² Type of soil Hard rocky soil Live load 3kN/m² Floor finishes 1kN/m² Seismic zones considered II,III,IV,V Type of wall Brick masonry
  • 5. IJRET: International Journal of Research in Engineering and Technology eISSN: 2319-1163 | pISSN: 2321-7308 __________________________________________________________________________________________ Volume: 02 Issue: 07 | Jul-2013, Available @ http://www.ijret.org 128 1.2 Loading Data: 1.2.1 Dead Load (DL) 1. Self weight of slab = 0.13x25 = 3.25kN/m2 2. Floor finishes = 1.00kN/m2 ------------------------------ Total DL = 4.25kN/m2 -------------------------------- (Assume 130mm total depth of slab) 3. Weight of walls = 0.23x19x 3.6 = 15.73kN/m 1.2.2 Live Load (LL) Live Load on each slab = 3.00kN/m2 1.2.3 Earth quake Load (EQL) As per IS-1893 (Part 1): 2002 1.3 Load Combinations: The following load combinations are used in the seismic analysis, as mentioned in the code IS 1893(Part-1): 2002, Clause no. 6.3.1.2. 1. 1.5(DL+LL) 2. 1.2(DL+LL+EQX) 3. 1.2(DL+LL- EQX) 4. 1.2(DL+LL+ EQZ) 5. 1.2(DL+LL- EQZ) 6. 1.5(DL+ EQX) 7. 1.5(DL- EQX) 8. 1.5(DL+ EQZ) 9. 1.5(DL-EQZ) 10. 0.9DL+ 1.5EQX 11. 0.9DL- 1.5EQX 12. 0.9DL+ 1.5EQZ 13. 0.9DL-1.5EQZ Earthquake load was considered in +X,-X, +Z and –Z directions. Thus a total of 13 load combinations are taken for analysis. Since large amount of data is difficult to handle manually (M.H. Arslan, 2007), all the load combinations are analyzed using software STAAD Pro. All the load combinations are mentioned above. 2. RESULTS: The variation of support reactions at each location of the columns and the percentage difference in different seismic zones with respect to gravity loads is represented in the in Table 2 and Fig.8. It is observed that in edge columns, variations are 17.72, 28.35, 42.53, and 63.7% between gravity load to seismic zones II, III, IV and V respectively. In exterior columns, the variations are 11.59, 18.54, 27.81, and 41.71% between gravity load to seismic zones II, III, IV and V respectively. The variation is very small in interior columns. Table 2 Comparison of support reactions in different seismic zones Support Reaction in kN Percentage difference between LOCATION OF THE COLUMNS DUE TO GRAVITY LOAD (GL) IN SEISMIC ZONE- II IN SEISMIC ZONE- III IN SEISMIC ZONE- IV IN SEISMIC ZONE- V GL& ZONE- II GL& ZONE- III GL& ZONE- IV GL& ZONE- V EDGE COLUMNS 543.40 640.20 698.04 775.13 890.78 17.72% 28.35% 42.53% 63.7% EXTERIOR COLUMNS 867.94 968.50 1028.84 1109.24 1129.97 11.59% 18.54% 27.81% 41.71% INTERIOR COLUMNS 1295.68 1309.92 1318.46 1329.84 1346.92 1.10% 1.76% 2.64% 3.95%
  • 6. IJRET: International Journal of Research in Engineering and Technology eISSN: 2319-1163 | pISSN: 2321-7308 __________________________________________________________________________________________ Volume: 02 Issue: 07 | Jul-2013, Available @ http://www.ijret.org 129 Fig. 8 Variation of support reactions in different seismic zones The variation of volume of concrete at each location of the column footing and the increase in percentage difference in different seismic zones with respect to gravity loads is represented in the in Table 3 and Fig.9. It is observed that in edge column footings, variations are 17.75, 17.75, 27.17 and 42.0% between gravity load to seismic zones II, III, IV and V respectively. In exterior column footings, the variations are 21.51, 21.51, 45.15 and 57.77% between gravity load to seismic zones II, III, IV and V respectively. Therefore, the volume of concrete in footings is increasing in seismic zones III, IV and V due to increase of support reactions due to lateral forces. However the variation is very small in interior column footings. Table 3 Comparison of volume of concrete in footings in different seismic zones Volume of concrete in footings (cu m) Percentage difference between LOCATION OF THE COLUMN FOOTING DUE TO GRAVITY LOAD (GL) IN SEISMIC ZONE- II IN SEISMIC ZONE- III IN SEISMIC ZONE- IV IN SEISMIC ZONE- V GL& ZONE- II GL& ZONE- III GL& ZONE- IV GL& ZONE- V EDGE COLUMN FOOTING 2.186 2.574 2.574 2.78 3.1042 17.75% 17.75% 27.17% 42.00% EXTERIOR COLUMN FOOTING 1.506 1.83 1.83 2.186 2.376 21.51% 21.51% 45.15% 57.77% INTERIOR COLUMN FOOTING 3.291 3.291 3.291 3.40 3.40 0.00 0.00 3.51% 3.51% 0 200 400 600 800 1000 1200 1400 1600 GRAVITY ZONE II ZONE III ZONE IV ZONE V SUPPORTREACTIONS(KN) TYPE OF LOADING EDGE COLUMNS EXTERIOR COLUMNS INTERIOR COLUMNS
  • 7. IJRET: International Journal of Research in Engineering and Technology eISSN: 2319-1163 | pISSN: 2321-7308 __________________________________________________________________________________________ Volume: 02 Issue: 07 | Jul-2013, Available @ http://www.ijret.org 130 Fig .9 Variation of volume of concrete in footings in different seismic zones The variation of weight of steel at each location of the column footing and the percentage difference in different seismic zones with respect to gravity loads is represented in the in Table 4 and Fig.10. It is observed that in edge column footings, variations are 0.0, 23.61, 47.92, and 98.96% between gravity load to seismic zones II, III, IV and V respectively. In exterior column footings, the variations are 38.17, 54.88, 70.79 and 91.04% between gravity loads to seismic zones II, III, IV and V respectively. In the interior columns footings, the variations are 22.07, 42.44, 56.03 and 67.91% between gravity loads to seismic zones II, III, IV and V respectively. Table 4 Comparison of weight of the steel in footings in different seismic zones Weight of steel in footings(kg’s) Percentage difference between LOCATION OF THE COLUMN FOOTING DUE TO GRAVITY LOAD (GL) IN SEISMIC ZONE- II IN SEISMIC ZONE- III IN SEISMIC ZONE- IV IN SEISMIC ZONE- V GL& ZONE- II GL& ZONE- III GL& ZONE- IV GL& ZONE- V EDGE COLUMN FOOTING 28.80 28.80 35.60 42.60 57.30 0.00 23.61% 47.92% 98.96% EXTERIOR COLUMN FOOTING 46.90 64.8 72.64 80.10 89.60 38.17% 54.88% 70.79% 91.04% INTERIOR COLUMN FOOTING 58.90 71.9 83.9 91.9 98.9 22.07% 42.44% 56.03% 67.91% 0 0.5 1 1.5 2 2.5 3 3.5 4 GRAVITY ZONE II ZONE III ZONE IV ZONE V CONCRETEIN(CUM) TYPE OF LOADING EDGE FOOTINGS EXTERIOR FOOTINGS INTERIOR FOOTINGS
  • 8. IJRET: International Journal of Research in Engineering and Technology eISSN: 2319-1163 | pISSN: 2321-7308 __________________________________________________________________________________________ Volume: 02 Issue: 07 | Jul-2013, Available @ http://www.ijret.org 131 Fig. 10 Variation of weight of steel in footings in different seismic zones The variation of percentage of steel at each location of the column in different seismic zones with respect to gravity loads is represented in the in Table 5 and Fig.11. The variation of percentage of steel in edge columns vary from 0.8% to 3%, exterior columns varying from 0.8% to 3.9% and interior columns varying from 1.1% to 3.7% between gravity loads to zone V. For the comparison purpose at each location, the cross sectional dimension of column was kept same in all the zones. Table 5 Comparison of percentage of the steel in columns in different seismic zones % of the steel reinforcement in columns LOCATION OF THE COLUMN DUE TO GRAVITY LOAD IN SEISMIC ZONE- II IN SEISMIC ZONE- III IN SEISMICZO NE- IV IN SEISMIC ZONE- V EDGE COLUMN 0.8 0.9 1 1.5 3 EXTERIOR COLUMN 0.8 0.9 1.5 2.3 3.9 INTERIOR COLUMN 1.1 1.3 1.8 2.4 3.7 Note: For the comparison purpose at each location, the cross sectional dimension of column was kept same in all the zones. 0.00 20.00 40.00 60.00 80.00 100.00 120.00 GRAVITY ZONE II ZONE III ZONE IV ZONE V WEIGHTOFSTEELIN(KG'S) TYPE OF LOADING EDGE FOOTINGS EXTERIOR FOOTINGS INTERIOR FOOTINGS
  • 9. IJRET: International Journal of Research in Engineering and Technology eISSN: 2319-1163 | pISSN: 2321-7308 __________________________________________________________________________________________ Volume: 02 Issue: 07 | Jul-2013, Available @ http://www.ijret.org 132 Fig. 11 Variation of percentage of steel in columns in different seismic zones The variation of percentage of steel in beams in different seismic zones with respect to gravity loads is represented in the in Table 6 and Fig.12. The variation of percentage of steel at supports, in external beams 0.54% to 1.23% and in internal beams 0.78% to 1.4% varying from gravity loads to zone V. At mid span locations of external and internal beams, the percentage of reinforcement is same in all the zones. Table 6 Comparison of percentage of the steel in beams in different seismic zones LOCATION BEAMS % of the steel reinforcement in beams GRAVITY LOAD (G L) IN SEISMIC ZONE- II IN SEISMIC ZONE- III IN SEISMIC ZONE- IV IN SEISMIC ZONE- V AT SUPPORTS EXTERNAL BEAMS 0.54 0.64 0.75 0.93 1.23 INTERNAL BEAMS 0.78 0.83 0.97 1.18 1.4 AT MID SPAN EXTERNAL BEAMS 0.32 0.32 0.32 0.32 0.32 INTERNAL BEAMS 0.42 0.42 0.42 0.42 0.42 Note: For the comparison purpose at each location, the cross sectional dimension of beams was kept same in all the zones. 0 0.5 1 1.5 2 2.5 3 3.5 4 4.5 GRAVITY ZONE II ZONE III ZONE IV ZONE V PERCENTAGEOFSTEEL TYPE OF LOADING EDGE COLUMNS EXTERIOR COLUMNS INTERIOR COUMNS
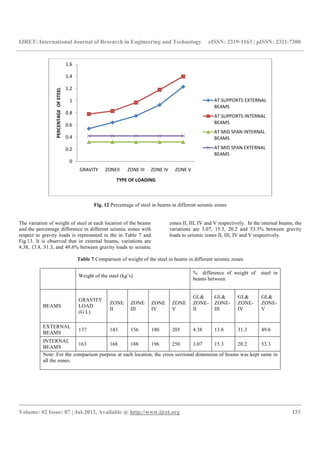
  • 10. IJRET: International Journal of Research in Engineering and Technology eISSN: 2319-1163 | pISSN: 2321-7308 __________________________________________________________________________________________ Volume: 02 Issue: 07 | Jul-2013, Available @ http://www.ijret.org 133 Fig. 12 Percentage of steel in beams in different seismic zones The variation of weight of steel at each location of the beams and the percentage difference in different seismic zones with respect to gravity loads is represented in the in Table 7 and Fig.13. It is observed that in external beams, variations are 4.38, 13.8, 31.3, and 49.6% between gravity loads to seismic zones II, III, IV and V respectively. In the internal beams, the variations are 3.07, 15.3, 20.2 and 53.3% between gravity loads to seismic zones II, III, IV and V respectively. Table 7 Comparison of weight of the steel in beams in different seismic zones Weight of the steel (kg’s) % difference of weight of steel in beams between BEAMS GRAVITY LOAD (G L) ZONE II ZONE III ZONE IV ZONE V GL& ZONE- II GL& ZONE- III GL& ZONE- IV GL& ZONE- V EXTERNAL BEAMS 137 143 156 180 205 4.38 13.8 31.3 49.6 INTERNAL BEAMS 163 168 188 196 250 3.07 15.3 20.2 53.3 Note: For the comparison purpose at each location, the cross sectional dimension of beams was kept same in all the zones. 0 0.2 0.4 0.6 0.8 1 1.2 1.4 1.6 GRAVITY ZONEII ZONE III ZONE IV ZONE V PERCENTAGEOFSTEEL TYPE OF LOADING AT SUPPORTS EXTERNAL BEAMS AT SUPPORTS INTERNAL BEAMS AT MID SPAN INTERNAL BEAMS AT MID SPAN EXTERNAL BEAMS
  • 11. IJRET: International Journal of Research in Engineering and Technology eISSN: 2319-1163 | pISSN: 2321-7308 __________________________________________________________________________________________ Volume: 02 Issue: 07 | Jul-2013, Available @ http://www.ijret.org 134 Fig. 13 Variation of weight of steel in beams in different seismic zones CONCLUSIONS The following conclusions can be made based on the analysis and design of RC school building designed for gravity loads and earthquake forces in all the zones. 1. The variation of support reactions in exterior columns increasing from 11.59% to 41.71% and in edge columns increasing from 17.72% to 63.7% in seismic Zones II to V. However the variation of support reactions are very small in interior columns. 2. The volume of concrete in exterior and edge column footings is increasing in seismic zones III, IV and V due to increase of support reactions with the effect of lateral forces. However the variation is very small in interior column footings. 3. The variation of percentage of steel at support sections in external beams is 0.54% to 1.23% and in internal beams is 0.78% to 1.4%. 4. In the external and internal beams, the percentage of bottom middle reinforcement is almost the same for both earthquake and non earthquake designs. REFERENCES: [1] Andreas J. Kappos, Alireza Manafpour (2001), “Seismic Design of R/C Buildings with the Aid of Advanced Analytical Techniques”, Engineering Structures, Elsevier, 23, 319-332. [2] 2. BIS: 1893 (PART 1)-2002 “Criteria For Earthquake Design Of Structures: General provisions and buildings”(Fifth revision), Bureau of Indian Standards , New Delhi [3] 3. IS 456(2000), “Plain and Reinforced Concrete- Code of Practice”, Bureau of Indian standards, New Delhi. [4] 4. Design Aids for Reinforced concrete to IS: 456- 1978(SP-16), Bureau of Indian standards, New Delhi. [5] 5. H. M. Salem, A. K. El-Fouly, H.S. Tagel-Din (2011), “Toward an Economic Design of Reinforced Concrete Structures Against Progressive Collapse”, Engineering Structures, Elsevier, 33,3341-3350. [6] 6. H.J. Shah and Sudhir K. Jain (2008), “Final Report: A -Earthquake Codes IITK-GSDMA Project on Building Codes (Design Example of a Six Storey Building)”, IITK-GSDMA-EQ26-V3.0 [7] 7. Kazuhiro Kitayama, Shunsuke Otani and Hiroyuki Aoyama (1987), “Earthquake Resistant Design Criteria for Reinforced Concrete Interior Beam-column Joints”, Published in the Proceedings, Pacific Conference on Earthquake Engineering, Wairakei, New Zealand, August, 5-8, 1,315-326. [8] 8. M.H. Arslan, H.H. Korkmaz (2007), “What is to be Learned from Damage and Failure of Reinforced Concrete Structures during Recent Earthquakes in Turkey?”, Engineering Failure Analysis, Elsevier, 14,1– 22. [9] 9. Pankaj Agrawal and Manish Shrikhande (2006), “Earthquake Resistance Design Of Structures”, ISBN 978- 81-203-3892-1, PHI Learning Private Limited. 0 50 100 150 200 250 300 GRAVITY ZONE II ZONE III ZONE IV ZONE V WEIGHTOFSTEELIN(KG'S) TYPE OF LOADING EXTERNAL BEAMS INTERNAL BEAMS