DataStructures in Pyhton Pandas and numpy.pptx
Download as PPTX, PDF0 likes17 views


![SERIES
A Pandas Series is like a column in a table.
It is a one-dimensional array holding data of any type.
Pip install pandas
import pandas as pd
a = [1, 3, 8,9,7]
myvar = pd.Series(a)
print(myvar)](https://image.slidesharecdn.com/datastructuresinpyhtonpandas-250802053859-e26430df/85/DataStructures-in-Pyhton-Pandas-and-numpy-pptx-3-320.jpg)
![INDEX
import pandas as pd
a = [1, 3, 2,’AVANTHI”]
myvar = pd.Series(a)
print(myvar[0])](https://image.slidesharecdn.com/datastructuresinpyhtonpandas-250802053859-e26430df/85/DataStructures-in-Pyhton-Pandas-and-numpy-pptx-4-320.jpg)
![CREATE LABELS
With the index argument, you can name your own labels.
import pandas as pd
a = [2, 8, 2]
myvar = pd.Series(a, index = ["x", "y", "z"])
print(myvar)
#print(myvar["y"])](https://image.slidesharecdn.com/datastructuresinpyhtonpandas-250802053859-e26430df/85/DataStructures-in-Pyhton-Pandas-and-numpy-pptx-5-320.jpg)

![RETRIEVE
To select only some of the items in the dictionary, use the index argument and
specify only the items you want to include in the Series.
import pandas as pd
marks = {"DEP": 80, "DBMS": 81, "ML":90}
myvar = pd.Series(marks, index = ["DEP", "ML"])
print(myvar)](https://image.slidesharecdn.com/datastructuresinpyhtonpandas-250802053859-e26430df/85/DataStructures-in-Pyhton-Pandas-and-numpy-pptx-7-320.jpg)
![FIND DATATYPE AND LENGTH
import numpy as np
import pandas as pd
a=pd.Series(data=[1,2,3,4])
b=pd.Series(data=[4.9,8.2,5.6],
index=['x','y','z'])
print(a.dtype)
print(a.itemsize)
print(b.dtype)
print(b.itemsize)](https://image.slidesharecdn.com/datastructuresinpyhtonpandas-250802053859-e26430df/85/DataStructures-in-Pyhton-Pandas-and-numpy-pptx-8-320.jpg)
![MAP
Pandas Series.map()
The main task of map() is used to map the values from two series that have a common column.
Syntax:
Series.map(arg, na_action=None)
import pandas as pd
import numpy as np
a=pd.Series(['Java','C','C++',np.nan])
a.map({'Java':'Core'})
s=a.map('I like {}'.format,na_action='ignore')
print(s)](https://image.slidesharecdn.com/datastructuresinpyhtonpandas-250802053859-e26430df/85/DataStructures-in-Pyhton-Pandas-and-numpy-pptx-9-320.jpg)
![STD()
Pandas Series.std()
The Pandas std() is defined as a function for calculating the standard deviation of
the given set of numbers, DataFrame, column, and rows
import pandas as pd
# calculate standard deviation
import numpy as np
print(np.std([4,7,2,1,6,3]))
print(np.std([6,9,15,2,-17,15,4]))](https://image.slidesharecdn.com/datastructuresinpyhtonpandas-250802053859-e26430df/85/DataStructures-in-Pyhton-Pandas-and-numpy-pptx-10-320.jpg)
![DATA FRAMES
A Pandas DataFrame is a 2 dimensional data structure, like a 2 dimensional array, or a table with
rows and columns.
import pandas as pd
import pandas as pd
data = {
"Marks": [80, 75, 90],
"Sub": ['Python', 'Java', 'Database']
}
#load data into a DataFrame object:
df = pd.DataFrame(data)
print(df)](https://image.slidesharecdn.com/datastructuresinpyhtonpandas-250802053859-e26430df/85/DataStructures-in-Pyhton-Pandas-and-numpy-pptx-11-320.jpg)
![Locate Row
As you can see from the result above, the DataFrame is like a table with rows and columns.
Pandas use the loc attribute to return one or more specified row(s)
import pandas as pd
data = {
"Marks": [80, 75, 90],
"Sub": ['Python', 'Java', 'Database']
}
#load data into a DataFrame object:
df = pd.DataFrame(data)
print(df.loc[0]) #print(df.loc[[0, 1]])](https://image.slidesharecdn.com/datastructuresinpyhtonpandas-250802053859-e26430df/85/DataStructures-in-Pyhton-Pandas-and-numpy-pptx-12-320.jpg)
![Named Index
import pandas as pd
data = {
"Marks": [80, 75, 90],
"Sub": ['Python', 'Java', 'Database']
}
#load data into a DataFrame object:
df = pd.DataFrame(data,index= ["day1","day2","day3"])
print(df)
Locate Named Indexes
Use the named index in the loc attribute to return the specified row(s).
Example
Return "day2":
#refer to the named index:
print(df.loc["day2"])](https://image.slidesharecdn.com/datastructuresinpyhtonpandas-250802053859-e26430df/85/DataStructures-in-Pyhton-Pandas-and-numpy-pptx-13-320.jpg)


![import pandas as pd
# making data frame from csv file
data = pd.read_csv("nba.csv", index_col ="Name")
# retrieving rows by iloc method
row2 = data.iloc[3]
print(row2)](https://image.slidesharecdn.com/datastructuresinpyhtonpandas-250802053859-e26430df/85/DataStructures-in-Pyhton-Pandas-and-numpy-pptx-19-320.jpg)
![# importing pandas as pd
import pandas as pd
# importing numpy as np
import numpy as np
# dictionary of lists
dict = {'First Score':[100, 90, np.nan, 95],
'Second Score': [30, np.nan, 45, 56],
'Third Score':[52, 40, 80, 98],
'Fourth Score':[np.nan, np.nan, np.nan, 65]}
# creating a dataframe from dictionary
df = pd.DataFrame(dict)
print(df)](https://image.slidesharecdn.com/datastructuresinpyhtonpandas-250802053859-e26430df/85/DataStructures-in-Pyhton-Pandas-and-numpy-pptx-20-320.jpg)
![Dropping missing values using dropna() :
In order to drop a null values from a dataframe, we used dropna() function this fuction drop Rows/Columns of datasets
with Null values in different ways.
import pandas as pd
import numpy as np
# Create a DataFrame with missing values
df = pd.DataFrame({
'A': [1, 2, np.nan, 4],
'B': [5, np.nan, 7, 8],
'C': [9, 10, 11, np.nan]
})
print("Original DataFrame:")
print(df)
# Drop rows with any missing values (default behavior)
df_dropped_rows = df.dropna()
print("nDataFrame after dropping rows with any NaN:")
print(df_dropped_rows)](https://image.slidesharecdn.com/datastructuresinpyhtonpandas-250802053859-e26430df/85/DataStructures-in-Pyhton-Pandas-and-numpy-pptx-21-320.jpg)

![# importing pandas as pd
import pandas as pd
# dictionary of lists
dict = {'name':["aparna", "pankaj", "sudhir", "Geeku"],
'degree': ["MBA", "BCA", "M.Tech", "MBA"],
'score':[90, 40, 80, 98]}
# creating a dataframe from a dictionary
df = pd.DataFrame(dict)
print(df)](https://image.slidesharecdn.com/datastructuresinpyhtonpandas-250802053859-e26430df/85/DataStructures-in-Pyhton-Pandas-and-numpy-pptx-23-320.jpg)
![Now we apply iterrows() function in order to get a each element of rows.
# importing pandas as pd
import pandas as pd
# dictionary of lists
dict = {'name':["aparna", "pankaj", "sudhir", "Geeku"],
'degree': ["MBA", "BCA", "M.Tech", "MBA"],
'score':[90, 40, 80, 98]}
# creating a dataframe from a dictionary
df = pd.DataFrame(dict)
# iterating over rows using iterrows() function
for i, j in df.iterrows():
print(i, j)
print()](https://image.slidesharecdn.com/datastructuresinpyhtonpandas-250802053859-e26430df/85/DataStructures-in-Pyhton-Pandas-and-numpy-pptx-24-320.jpg)
![Setting Index
We can set an existing column as the index using the set_index() method. For example,
import pandas as pd
# create dataframe
data = {'Name': ['John', 'Alice', 'Bob'],
'Age': [25, 28, 32],
'City': ['New York', 'London', 'Paris']}
df = pd.DataFrame(data)
# set the 'Name' column as index
df.set_index('Name', inplace=True)
print(df)
In this example, the Name column is set as the index, replacing the default integer index.
Here, the inplace=True parameter performs the operation directly on the object itself, without
creating a new object.When we specify inplace=True, the original object is modified, and the
changes are directly applied.](https://image.slidesharecdn.com/datastructuresinpyhtonpandas-250802053859-e26430df/85/DataStructures-in-Pyhton-Pandas-and-numpy-pptx-25-320.jpg)
![Creating a Range Index
We can create a range index with specific start and end values using the RangeIndex()
function. For example,
import pandas as pd
# create dataframe
data = {'Name': ['John', 'Alice', 'Bob'],
'Age': [25, 28, 32],
'City': ['New York', 'London', 'Paris']}
df = pd.DataFrame(data)
# create a range index
df = pd.DataFrame(data, index=pd.RangeIndex(5, 8, name='Index'))
print(df)](https://image.slidesharecdn.com/datastructuresinpyhtonpandas-250802053859-e26430df/85/DataStructures-in-Pyhton-Pandas-and-numpy-pptx-26-320.jpg)

![import pandas as pd
# create a dataframe
data = {'Name': ['John', 'Alice', 'Bob'],
'Age': [25, 28, 32],
'City': ['NewYork', 'London', 'Paris']}
df = pd.DataFrame(data)
# display original dataframe
print('Original DataFrame:')
print(df)
print()
# rename index
df.rename(index={0: 'A', 1: 'B', 2: 'C'}, inplace=True)
# display dataframe after index is renamed
print('Modified DataFrame')
print(df)](https://image.slidesharecdn.com/datastructuresinpyhtonpandas-250802053859-e26430df/85/DataStructures-in-Pyhton-Pandas-and-numpy-pptx-28-320.jpg)
![Resetting Index
We can reset the index to the default integer index using the reset_index() method. For example,
import pandas as pd
data = {'Name': ['John', 'Alice', 'Bob'], 'Age': [25, 28, 32], 'City': ['New York', 'London', 'Paris']}
# create a dataframe
df = pd.DataFrame(data)
# rename index
df.rename(index={0: 'A', 1: 'B', 2: 'C'}, inplace=True)
# display dataframe
print('Original DataFrame:')
print(df)
print('n’)
# reset index
df.reset_index(inplace=True)
# display dataframe after index is reset
print('Modified DataFrame:')
print(df)](https://image.slidesharecdn.com/datastructuresinpyhtonpandas-250802053859-e26430df/85/DataStructures-in-Pyhton-Pandas-and-numpy-pptx-29-320.jpg)
![Get DataFrame Index
We can access the DataFrame Index using the index attribute. For example,
import pandas as pd
# create a dataframe
data = {'Name': ['John', 'Alice', 'Bob'],
'Age': [25, 28, 32],
'City': ['NewYork', 'London', 'Paris']}
df = pd.DataFrame(data)
# return index object
print(df.index)
# return index values
print(df.index.values)
Here,
df.index - returns the index object
df.index.values - returns the index values as a list](https://image.slidesharecdn.com/datastructuresinpyhtonpandas-250802053859-e26430df/85/DataStructures-in-Pyhton-Pandas-and-numpy-pptx-30-320.jpg)
![Pandas Array
An array allows us to store a collection of multiple values in a single data structure.
Pandas array is designed to provide a more memory-efficient and performance-enhanced
alternative to Python's built-in lists, NumPy arrays, and other data structures for handling the
same type of data.
Create Array Using Python List
We can create a Pandas array using a Python List. For example,
import pandas as pd
# create a list named data
data = [2, 4, 6, 8]
# create Pandas array using data
array1 = pd.array(data)
print(array1)](https://image.slidesharecdn.com/datastructuresinpyhtonpandas-250802053859-e26430df/85/DataStructures-in-Pyhton-Pandas-and-numpy-pptx-31-320.jpg)
![Explicitly Specify Array Elements Data Type
In Pandas, we can explicitly specify the data type of array elements. For example,
import pandas as pd
# creating a pandas.array of integers
int_array = pd.array([1, 2, 3, 4, 5], dtype='int')
print(int_array)
print()
# creating a pandas.array of floating-point numbers
float_array = pd.array([1.1, 2.2, 3.3, 4.4, 5.5], dtype='float')
print(float_array)
print()
# creating a pandas.array of strings
string_array = pd.array(['apple', 'banana', 'cherry', 'date'], dtype='str')
print(string_array)
print()](https://image.slidesharecdn.com/datastructuresinpyhtonpandas-250802053859-e26430df/85/DataStructures-in-Pyhton-Pandas-and-numpy-pptx-32-320.jpg)
![# creating a pandas.array of boolean values
bool_array = pd.array([True, False,True, False], dtype='bool')
print(bool_array)
print()
• int_array - creates an array containing integers by specifying dtype = 'int'
• float_array - creates an array containing floating-point numbers by specifying dtype =
'float'
• string_array - creates an array containing strings by specifying dtype = 'str'
• bool_array - creates an array containing boolean values (True or False) by specifying
dtype = 'bool'](https://image.slidesharecdn.com/datastructuresinpyhtonpandas-250802053859-e26430df/85/DataStructures-in-Pyhton-Pandas-and-numpy-pptx-33-320.jpg)
![Create Series From Pandas Array
In Pandas, we can directly create Pandas Series from Pandas Array.
For that we use the Series() method. Let's look at an example.
import pandas as pd
# create a Pandas array
arr = pd.array([18, 20, 19, 21, 22])
# create a Pandas series from the Pandas array
arr_series = pd.Series(arr)
print(arr_series)](https://image.slidesharecdn.com/datastructuresinpyhtonpandas-250802053859-e26430df/85/DataStructures-in-Pyhton-Pandas-and-numpy-pptx-34-320.jpg)

![import pandas as pd
import numpy as np
d = {'First Score': [100, 90, np.nan, 95],
'Second Score': [30, 45, 56, np.nan],
'Third Score': [np.nan, 40, 80, 98]}
df = pd.DataFrame(d)
mv = df.isnull()
print(mv)](https://image.slidesharecdn.com/datastructuresinpyhtonpandas-250802053859-e26430df/85/DataStructures-in-Pyhton-Pandas-and-numpy-pptx-37-320.jpg)
![Filtering Data Based on MissingValues
• Here we used random Employee dataset.The isnull() function is used over the "Gender"
column in order to filter and print out rows containing missing gender data.
import pandas as pd
d = pd.read_csv("/content/employees.csv")
bool_series = pd.isnull(d["Gender"])
missing_gender_data = d[bool_series]
print(missing_gender_data)](https://image.slidesharecdn.com/datastructuresinpyhtonpandas-250802053859-e26430df/85/DataStructures-in-Pyhton-Pandas-and-numpy-pptx-38-320.jpg)
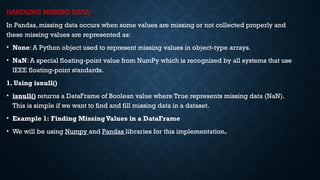
![2. Using isna()
• isna() returns a DataFrame of Boolean values where True indicates missing data (NaN). It is
used to detect missing values just like isnull().
• Example: Finding Missing Values in a DataFrame
import pandas as pd
import numpy as np
data = {'Name': ['Amit', 'Sita', np.nan, 'Raj'],
'Age': [25, np.nan, 22, 28]}
df = pd.DataFrame(data)
# Check for missing values using isna()
print(df.isna())](https://image.slidesharecdn.com/datastructuresinpyhtonpandas-250802053859-e26430df/85/DataStructures-in-Pyhton-Pandas-and-numpy-pptx-39-320.jpg)
![Checking for Non-MissingValues Using notnull()
notnull() function returns a DataFrame with Boolean values where True indicates non-missing
(valid) data.This function is useful when we want to focus only on the rows that have valid, non-
missing values.
import pandas as pd
import numpy as np
d = {'First Score': [100, 90, np.nan, 95],
'Second Score': [30, 45, 56, np.nan],
'Third Score': [np.nan, 40, 80, 98]}
df = pd.DataFrame(d)
nmv = df.notnull()
print(nmv)](https://image.slidesharecdn.com/datastructuresinpyhtonpandas-250802053859-e26430df/85/DataStructures-in-Pyhton-Pandas-and-numpy-pptx-40-320.jpg)
![Filtering Data with Non-MissingValues
notnull() function is used over the "Gender" column in order to filter
and print out rows containing missing gender data.
import pandas as pd
d = pd.read_csv("/content/employees.csv")
nmg = pd.notnull(d["Gender"])
nmgd= d[nmg]
display(nmgd)](https://image.slidesharecdn.com/datastructuresinpyhtonpandas-250802053859-e26430df/85/DataStructures-in-Pyhton-Pandas-and-numpy-pptx-41-320.jpg)
![Filling Missing Values in Pandas
Following functions allow us to replace missing values with a specified value or use interpolation methods to find the
missing data.
1. Using fillna()
fillna() used to replace missing values (NaN) with a given value. Lets see various example for this.
Example 1: Fill Missing Values with Zero
import pandas as pd
import numpy as np
d = {'First Score': [100, 90, np.nan, 95],
'Second Score': [30, 45, 56, np.nan],
'Third Score': [np.nan, 40, 80, 98]}
df = pd.DataFrame(d)
a=df.fillna(0)
print(a)](https://image.slidesharecdn.com/datastructuresinpyhtonpandas-250802053859-e26430df/85/DataStructures-in-Pyhton-Pandas-and-numpy-pptx-42-320.jpg)
![Fill with Previous Value (Forward Fill)
• The pad method is used to fill missing values with the previous value.
df.fillna(method='pad’)
Fill with Next Value (Backward Fill)
• The bfill function is used to fill it with the next value.
df.fillna(method='bfill’)
Fill NaN Values with 'No Gender’
import pandas as pd
import numpy as np
d = pd.read_csv("/content/employees.csv")
d[10:25]
d["Gender"].fillna('No Gender', inplace = True)
d[10:25]](https://image.slidesharecdn.com/datastructuresinpyhtonpandas-250802053859-e26430df/85/DataStructures-in-Pyhton-Pandas-and-numpy-pptx-43-320.jpg)
![Using replace()
• Use replace() function to replace NaN values with a specific value.
import pandas as pd
import numpy as np
data = pd.read_csv("/content/employees.csv")
data[10:25]
data.replace(to_replace=np.nan, value=-99)
Using interpolate()
• The interpolate() function fills missing values using interpolation techniques such as the linear
method.](https://image.slidesharecdn.com/datastructuresinpyhtonpandas-250802053859-e26430df/85/DataStructures-in-Pyhton-Pandas-and-numpy-pptx-44-320.jpg)
![import pandas as pd
df = pd.DataFrame({"A": [12, 4, 5, None, 1],
"B": [None, 2, 54, 3, None],
"C": [20, 16, None, 3, 8],
"D": [14, 3, None, None, 6]})
print(df)
df.interpolate(method ='linear', limit_direction ='forward')](https://image.slidesharecdn.com/datastructuresinpyhtonpandas-250802053859-e26430df/85/DataStructures-in-Pyhton-Pandas-and-numpy-pptx-45-320.jpg)
![Dropping Rows with At Least One Null Value
Remove rows that contain at least one missing value.
import pandas as pd
import numpy as np
dict = {'First Score': [100, 90, np.nan, 95],
'Second Score': [30, np.nan, 45, 56],
'Third Score': [52, 40, 80, 98],
'Fourth Score': [np.nan, np.nan, np.nan, 65]}
df = pd.DataFrame(dict)
df.dropna()](https://image.slidesharecdn.com/datastructuresinpyhtonpandas-250802053859-e26430df/85/DataStructures-in-Pyhton-Pandas-and-numpy-pptx-46-320.jpg)
![Dropping Rows with All Null Values
We can drop rows where all values are missing using dropna(how='all’).
dict = {'First Score': [100, np.nan, np.nan, 95],
'Second Score': [30, np.nan, 45, 56],
'Third Score': [52, np.nan, 80, 98],
'Fourth Score': [np.nan, np.nan, np.nan, 65]}
df = pd.DataFrame(dict)
df.dropna(how='all')](https://image.slidesharecdn.com/datastructuresinpyhtonpandas-250802053859-e26430df/85/DataStructures-in-Pyhton-Pandas-and-numpy-pptx-47-320.jpg)
![Dropping Columns with At Least One NullValue
To remove columns that contain at least one missing value we use dropna(axis=1).
dict = {'First Score': [100, np.nan, np.nan, 95],
'Second Score': [30, np.nan, 45, 56],
'Third Score': [52, np.nan, 80, 98],
'Fourth Score': [60, 67, 68, 65]}
df = pd.DataFrame(dict)
df.dropna(axis=1)](https://image.slidesharecdn.com/datastructuresinpyhtonpandas-250802053859-e26430df/85/DataStructures-in-Pyhton-Pandas-and-numpy-pptx-48-320.jpg)


DataStructures in Pyhton Pandas and numpy.pptx
- 1. PANDAS Pandas is an open-source library that uses for working with relational or labelled data both easily. It provides various data structures and operations for manipulating numerical data and time series. It offers a tool for cleaning and processes your data. It is the most popular Python library that is used for data analysis. Handling missing Data Reading data from files and writing data to files
- 2. BENEFITS OF PANDAS The following are the advantages of pandas overusing other languages: Representation of Data: Through its DataFrame and Series, it presents the data in a manner that is appropriate for data analysis. Clear code: Pandas' clear API lets you concentrate on the most important part of the code. In this way, it gives clear and brief code to the client. It supports two data structures: Series Dataframe
- 3. SERIES A Pandas Series is like a column in a table. It is a one-dimensional array holding data of any type. Pip install pandas import pandas as pd a = [1, 3, 8,9,7] myvar = pd.Series(a) print(myvar)
- 4. INDEX import pandas as pd a = [1, 3, 2,’AVANTHI”] myvar = pd.Series(a) print(myvar[0])
- 5. CREATE LABELS With the index argument, you can name your own labels. import pandas as pd a = [2, 8, 2] myvar = pd.Series(a, index = ["x", "y", "z"]) print(myvar) #print(myvar["y"])
- 6. KEY/VALUE OBJECTS AS SERIES You can also use a key/value object, like a dictionary, when creating a Series. import pandas as pd marks = {"DEP": 80, "DBMS": 81, "ML":90} myvar = pd.Series(marks) print(myvar)
- 7. RETRIEVE To select only some of the items in the dictionary, use the index argument and specify only the items you want to include in the Series. import pandas as pd marks = {"DEP": 80, "DBMS": 81, "ML":90} myvar = pd.Series(marks, index = ["DEP", "ML"]) print(myvar)
- 8. FIND DATATYPE AND LENGTH import numpy as np import pandas as pd a=pd.Series(data=[1,2,3,4]) b=pd.Series(data=[4.9,8.2,5.6], index=['x','y','z']) print(a.dtype) print(a.itemsize) print(b.dtype) print(b.itemsize)
- 9. MAP Pandas Series.map() The main task of map() is used to map the values from two series that have a common column. Syntax: Series.map(arg, na_action=None) import pandas as pd import numpy as np a=pd.Series(['Java','C','C++',np.nan]) a.map({'Java':'Core'}) s=a.map('I like {}'.format,na_action='ignore') print(s)
- 10. STD() Pandas Series.std() The Pandas std() is defined as a function for calculating the standard deviation of the given set of numbers, DataFrame, column, and rows import pandas as pd # calculate standard deviation import numpy as np print(np.std([4,7,2,1,6,3])) print(np.std([6,9,15,2,-17,15,4]))
- 11. DATA FRAMES A Pandas DataFrame is a 2 dimensional data structure, like a 2 dimensional array, or a table with rows and columns. import pandas as pd import pandas as pd data = { "Marks": [80, 75, 90], "Sub": ['Python', 'Java', 'Database'] } #load data into a DataFrame object: df = pd.DataFrame(data) print(df)
- 12. Locate Row As you can see from the result above, the DataFrame is like a table with rows and columns. Pandas use the loc attribute to return one or more specified row(s) import pandas as pd data = { "Marks": [80, 75, 90], "Sub": ['Python', 'Java', 'Database'] } #load data into a DataFrame object: df = pd.DataFrame(data) print(df.loc[0]) #print(df.loc[[0, 1]])
- 13. Named Index import pandas as pd data = { "Marks": [80, 75, 90], "Sub": ['Python', 'Java', 'Database'] } #load data into a DataFrame object: df = pd.DataFrame(data,index= ["day1","day2","day3"]) print(df) Locate Named Indexes Use the named index in the loc attribute to return the specified row(s). Example Return "day2": #refer to the named index: print(df.loc["day2"])
- 14. Load Files Into a DataFrame If your data sets are stored in a file, Pandas can load them into a DataFrame. import pandas as pd df = pd.read_csv('data.csv') print(df) import pandas as pd print(pd.options.display.max_rows)
- 15. Read JSON Big data sets are often stored, or extracted as JSON. JSON is plain text, but has the format of an object, and is well known in the world of programming, including Pandas. In our examples we will be using a JSON file called 'data.json’. use to_string() to print the entire DataFrame.
- 16. import pandas as pd data = {"Duration":{"0":60,"1":60,"2":60,"3":45,"4":45,"5":60}, "Pulse":{"0":110,"1":117,"2":103,"3":109,"4":117,"5":102}, "Maxpulse":{"0":130,"1":145,"2":135,"3":175,"4":148,"5":127}, "Calories":{"0":409,"1":479,"2":340,"3":282,"4":406,"5":300}} df = pd.DataFrame(data) print(df)
- 17. Viewing the Data One of the most used method for getting a quick overview of the DataFrame, is the head() method. The head() method returns the headers and a specified number of rows, starting from the top. import pandas as pd df = pd.read_csv('data.csv') print(df.head(10)) #Print the first 5 rows of the DataFrame:print(df.head())
- 18. There is also a tail() method for viewing the last rows of the DataFrame. The tail() method returns the headers and a specified number of rows, starting from the bottom. Example Print the last 5 rows of the DataFrame: print(df.tail())
- 19. import pandas as pd # making data frame from csv file data = pd.read_csv("nba.csv", index_col ="Name") # retrieving rows by iloc method row2 = data.iloc[3] print(row2)
- 20. # importing pandas as pd import pandas as pd # importing numpy as np import numpy as np # dictionary of lists dict = {'First Score':[100, 90, np.nan, 95], 'Second Score': [30, np.nan, 45, 56], 'Third Score':[52, 40, 80, 98], 'Fourth Score':[np.nan, np.nan, np.nan, 65]} # creating a dataframe from dictionary df = pd.DataFrame(dict) print(df)
- 21. Dropping missing values using dropna() : In order to drop a null values from a dataframe, we used dropna() function this fuction drop Rows/Columns of datasets with Null values in different ways. import pandas as pd import numpy as np # Create a DataFrame with missing values df = pd.DataFrame({ 'A': [1, 2, np.nan, 4], 'B': [5, np.nan, 7, 8], 'C': [9, 10, 11, np.nan] }) print("Original DataFrame:") print(df) # Drop rows with any missing values (default behavior) df_dropped_rows = df.dropna() print("nDataFrame after dropping rows with any NaN:") print(df_dropped_rows)
- 22. Iterating over rows and columns Iteration is a general term for taking each item of something, one after another. Pandas DataFrame consists of rows and columns so, in order to iterate over dataframe, we have to iterate a dataframe like a dictionary. Iterating over rows : In order to iterate over rows, we can use three function iteritems(), iterrows(), itertuples() . These three function will help in iteration over rows.
- 23. # importing pandas as pd import pandas as pd # dictionary of lists dict = {'name':["aparna", "pankaj", "sudhir", "Geeku"], 'degree': ["MBA", "BCA", "M.Tech", "MBA"], 'score':[90, 40, 80, 98]} # creating a dataframe from a dictionary df = pd.DataFrame(dict) print(df)
- 24. Now we apply iterrows() function in order to get a each element of rows. # importing pandas as pd import pandas as pd # dictionary of lists dict = {'name':["aparna", "pankaj", "sudhir", "Geeku"], 'degree': ["MBA", "BCA", "M.Tech", "MBA"], 'score':[90, 40, 80, 98]} # creating a dataframe from a dictionary df = pd.DataFrame(dict) # iterating over rows using iterrows() function for i, j in df.iterrows(): print(i, j) print()
- 25. Setting Index We can set an existing column as the index using the set_index() method. For example, import pandas as pd # create dataframe data = {'Name': ['John', 'Alice', 'Bob'], 'Age': [25, 28, 32], 'City': ['New York', 'London', 'Paris']} df = pd.DataFrame(data) # set the 'Name' column as index df.set_index('Name', inplace=True) print(df) In this example, the Name column is set as the index, replacing the default integer index. Here, the inplace=True parameter performs the operation directly on the object itself, without creating a new object.When we specify inplace=True, the original object is modified, and the changes are directly applied.
- 26. Creating a Range Index We can create a range index with specific start and end values using the RangeIndex() function. For example, import pandas as pd # create dataframe data = {'Name': ['John', 'Alice', 'Bob'], 'Age': [25, 28, 32], 'City': ['New York', 'London', 'Paris']} df = pd.DataFrame(data) # create a range index df = pd.DataFrame(data, index=pd.RangeIndex(5, 8, name='Index')) print(df)
- 27. Modifying Indexes in Pandas Pandas allows us to make changes to indexes easily. Some common modification operations are: Renaming Index Resetting Index Renaming Index: We can rename an index using the rename() method. For example,
- 28. import pandas as pd # create a dataframe data = {'Name': ['John', 'Alice', 'Bob'], 'Age': [25, 28, 32], 'City': ['NewYork', 'London', 'Paris']} df = pd.DataFrame(data) # display original dataframe print('Original DataFrame:') print(df) print() # rename index df.rename(index={0: 'A', 1: 'B', 2: 'C'}, inplace=True) # display dataframe after index is renamed print('Modified DataFrame') print(df)
- 29. Resetting Index We can reset the index to the default integer index using the reset_index() method. For example, import pandas as pd data = {'Name': ['John', 'Alice', 'Bob'], 'Age': [25, 28, 32], 'City': ['New York', 'London', 'Paris']} # create a dataframe df = pd.DataFrame(data) # rename index df.rename(index={0: 'A', 1: 'B', 2: 'C'}, inplace=True) # display dataframe print('Original DataFrame:') print(df) print('n’) # reset index df.reset_index(inplace=True) # display dataframe after index is reset print('Modified DataFrame:') print(df)
- 30. Get DataFrame Index We can access the DataFrame Index using the index attribute. For example, import pandas as pd # create a dataframe data = {'Name': ['John', 'Alice', 'Bob'], 'Age': [25, 28, 32], 'City': ['NewYork', 'London', 'Paris']} df = pd.DataFrame(data) # return index object print(df.index) # return index values print(df.index.values) Here, df.index - returns the index object df.index.values - returns the index values as a list
- 31. Pandas Array An array allows us to store a collection of multiple values in a single data structure. Pandas array is designed to provide a more memory-efficient and performance-enhanced alternative to Python's built-in lists, NumPy arrays, and other data structures for handling the same type of data. Create Array Using Python List We can create a Pandas array using a Python List. For example, import pandas as pd # create a list named data data = [2, 4, 6, 8] # create Pandas array using data array1 = pd.array(data) print(array1)
- 32. Explicitly Specify Array Elements Data Type In Pandas, we can explicitly specify the data type of array elements. For example, import pandas as pd # creating a pandas.array of integers int_array = pd.array([1, 2, 3, 4, 5], dtype='int') print(int_array) print() # creating a pandas.array of floating-point numbers float_array = pd.array([1.1, 2.2, 3.3, 4.4, 5.5], dtype='float') print(float_array) print() # creating a pandas.array of strings string_array = pd.array(['apple', 'banana', 'cherry', 'date'], dtype='str') print(string_array) print()
- 33. # creating a pandas.array of boolean values bool_array = pd.array([True, False,True, False], dtype='bool') print(bool_array) print() • int_array - creates an array containing integers by specifying dtype = 'int' • float_array - creates an array containing floating-point numbers by specifying dtype = 'float' • string_array - creates an array containing strings by specifying dtype = 'str' • bool_array - creates an array containing boolean values (True or False) by specifying dtype = 'bool'
- 34. Create Series From Pandas Array In Pandas, we can directly create Pandas Series from Pandas Array. For that we use the Series() method. Let's look at an example. import pandas as pd # create a Pandas array arr = pd.array([18, 20, 19, 21, 22]) # create a Pandas series from the Pandas array arr_series = pd.Series(arr) print(arr_series)
- 35. • Here, we have used pd.Series(arr) to create a Series from Pandas array named arr. In the output, • 1.The left column represents the index of the Series.The default index is a sequence of integers starting from 0. • 2.The right column represents the values of the Series, which correspond to the values of the Pandas array arr.
- 36. HANDLING MISSING DATA: In Pandas, missing data occurs when some values are missing or not collected properly and these missing values are represented as: • None: A Python object used to represent missing values in object-type arrays. • NaN: A special floating-point value from NumPy which is recognized by all systems that use IEEE floating-point standards. 1. Using isnull() • isnull() returns a DataFrame of Boolean value where True represents missing data (NaN). This is simple if we want to find and fill missing data in a dataset. • Example 1: Finding MissingValues in a DataFrame • We will be using Numpy and Pandas libraries for this implementation.
- 37. import pandas as pd import numpy as np d = {'First Score': [100, 90, np.nan, 95], 'Second Score': [30, 45, 56, np.nan], 'Third Score': [np.nan, 40, 80, 98]} df = pd.DataFrame(d) mv = df.isnull() print(mv)
- 38. Filtering Data Based on MissingValues • Here we used random Employee dataset.The isnull() function is used over the "Gender" column in order to filter and print out rows containing missing gender data. import pandas as pd d = pd.read_csv("/content/employees.csv") bool_series = pd.isnull(d["Gender"]) missing_gender_data = d[bool_series] print(missing_gender_data)
- 39. 2. Using isna() • isna() returns a DataFrame of Boolean values where True indicates missing data (NaN). It is used to detect missing values just like isnull(). • Example: Finding Missing Values in a DataFrame import pandas as pd import numpy as np data = {'Name': ['Amit', 'Sita', np.nan, 'Raj'], 'Age': [25, np.nan, 22, 28]} df = pd.DataFrame(data) # Check for missing values using isna() print(df.isna())
- 40. Checking for Non-MissingValues Using notnull() notnull() function returns a DataFrame with Boolean values where True indicates non-missing (valid) data.This function is useful when we want to focus only on the rows that have valid, non- missing values. import pandas as pd import numpy as np d = {'First Score': [100, 90, np.nan, 95], 'Second Score': [30, 45, 56, np.nan], 'Third Score': [np.nan, 40, 80, 98]} df = pd.DataFrame(d) nmv = df.notnull() print(nmv)
- 41. Filtering Data with Non-MissingValues notnull() function is used over the "Gender" column in order to filter and print out rows containing missing gender data. import pandas as pd d = pd.read_csv("/content/employees.csv") nmg = pd.notnull(d["Gender"]) nmgd= d[nmg] display(nmgd)
- 42. Filling Missing Values in Pandas Following functions allow us to replace missing values with a specified value or use interpolation methods to find the missing data. 1. Using fillna() fillna() used to replace missing values (NaN) with a given value. Lets see various example for this. Example 1: Fill Missing Values with Zero import pandas as pd import numpy as np d = {'First Score': [100, 90, np.nan, 95], 'Second Score': [30, 45, 56, np.nan], 'Third Score': [np.nan, 40, 80, 98]} df = pd.DataFrame(d) a=df.fillna(0) print(a)
- 43. Fill with Previous Value (Forward Fill) • The pad method is used to fill missing values with the previous value. df.fillna(method='pad’) Fill with Next Value (Backward Fill) • The bfill function is used to fill it with the next value. df.fillna(method='bfill’) Fill NaN Values with 'No Gender’ import pandas as pd import numpy as np d = pd.read_csv("/content/employees.csv") d[10:25] d["Gender"].fillna('No Gender', inplace = True) d[10:25]
- 44. Using replace() • Use replace() function to replace NaN values with a specific value. import pandas as pd import numpy as np data = pd.read_csv("/content/employees.csv") data[10:25] data.replace(to_replace=np.nan, value=-99) Using interpolate() • The interpolate() function fills missing values using interpolation techniques such as the linear method.
- 45. import pandas as pd df = pd.DataFrame({"A": [12, 4, 5, None, 1], "B": [None, 2, 54, 3, None], "C": [20, 16, None, 3, 8], "D": [14, 3, None, None, 6]}) print(df) df.interpolate(method ='linear', limit_direction ='forward')
- 46. Dropping Rows with At Least One Null Value Remove rows that contain at least one missing value. import pandas as pd import numpy as np dict = {'First Score': [100, 90, np.nan, 95], 'Second Score': [30, np.nan, 45, 56], 'Third Score': [52, 40, 80, 98], 'Fourth Score': [np.nan, np.nan, np.nan, 65]} df = pd.DataFrame(dict) df.dropna()
- 47. Dropping Rows with All Null Values We can drop rows where all values are missing using dropna(how='all’). dict = {'First Score': [100, np.nan, np.nan, 95], 'Second Score': [30, np.nan, 45, 56], 'Third Score': [52, np.nan, 80, 98], 'Fourth Score': [np.nan, np.nan, np.nan, 65]} df = pd.DataFrame(dict) df.dropna(how='all')
- 48. Dropping Columns with At Least One NullValue To remove columns that contain at least one missing value we use dropna(axis=1). dict = {'First Score': [100, np.nan, np.nan, 95], 'Second Score': [30, np.nan, 45, 56], 'Third Score': [52, np.nan, 80, 98], 'Fourth Score': [60, 67, 68, 65]} df = pd.DataFrame(dict) df.dropna(axis=1)
- 49. Dropping Rows with MissingValues in CSV Files When working with CSV files, we can drop rows with missing values using dropna(). import pandas as pd d = pd.read_csv("/content/employees.csv") nd = d.dropna(axis=0, how='any') print("Old data frame length:", len(d)) print("New data frame length:", len(nd)) print("Rows with at least one missing value:", (len(d) - len(nd)))