![How to Unlock Value in Data Using
Data Visualizations[#VIZ]
Chaitanya Sagar “CS”
cs@perceptive-analytics.com
646.583.0001](https://image.slidesharecdn.com/unlockvaluefromdatavisualizationsv1-140612083459-phpapp02/85/How-to-Unlock-Value-in-Analytics-Using-Data-Visualization-1-320.jpg)


How to Unlock Value in Analytics Using Data Visualization?
- 1. How to Unlock Value in Data Using Data Visualizations[#VIZ] Chaitanya Sagar “CS” cs@perceptive-analytics.com 646.583.0001
- 2. Data Analytics Spreadsheet Solutions| 2 New York HyderabadSan Bruno Boston
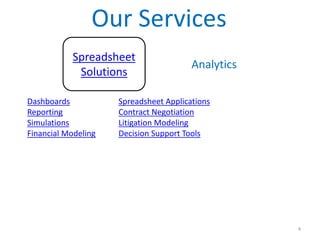
- 3. Analytics Spreadsheet Solutions Data Visualizations Marketing Marketing Mix Modeling Price Promotion Analysis Catalogue Optimization Segmentation Web Analytics Churn Analysis Risk Management Credit Risk Management Liquidity Risk Management Capital Allocation Analysis Collateral Management Fraud Detection Supply Chain Inventory Optimization Demand Analytics Distribution Network Optimization Sourcing Analytics Freight Lane Analytics Verticals Consumer Packaged Goods Retail Healthcare Our Services 3
- 4. Analytics Spreadsheet Solutions Our Services 4 Spreadsheet Applications Contract Negotiation Litigation Modeling Decision Support Tools Dashboards Reporting Simulations Financial Modeling
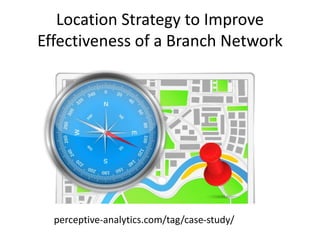
- 5. Location Strategy to Improve Effectiveness of a Branch Network perceptive-analytics.com/tag/case-study/
- 6. Reinventing Coupons: Strategies for Successful Coupon Campaign perceptive-analytics.com/tag/case-study/
- 7. Questions? Use ask-a-question feature in GoToWebinar cs@perceptive-analytics.com 646.583.0001 #VIZ 8
- 8. Which industry do you work in? • Retail and Consumer Packaged Goods • Health Care • Banking, Financial Services and Insurance • Information Technology / Consulting/Others cs@perceptive-analytics.com 646.583.0001 #VIZ 9
- 9. Which Function Do You Work In? • Analytics • BI • Sales and Marketing • IT • Finance/Operations / Human Resources cs@perceptive-analytics.com 646.583.0001 #VIZ 10
- 10. Overview PicyHoriaVarlan cs@perceptive-analytics.com 646.583.0001 #VIZ 11 The need for visualizations How visualizations help unlock value How to build visualizations -Purpose -Design Tools Q&A
- 11. The Need for Visualizations cs@perceptive-analytics.com 646.583.0001 #VIZ
- 12. Our Needs Outgrew Charts More data! high dimensional ˠ cs@perceptive-analytics.com 646.583.0001 #VIZ
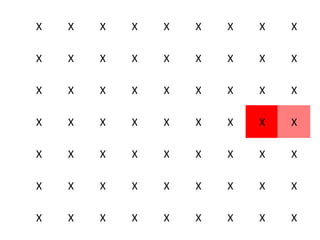
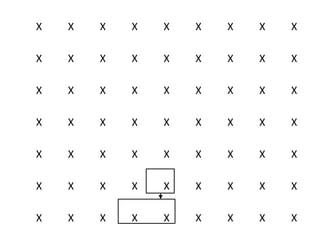
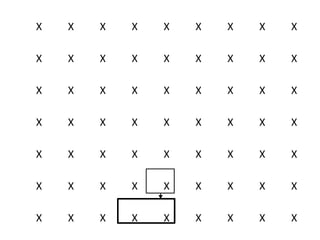
- 13. Humans are Visual Brain can absorb large amounts of information and find patterns (and deviations!) PicbyDanFoy cs@perceptive-analytics.com 646.583.0001 #VIZ
- 14. ●
- 15. X X X X X X X X X X X X X X X X X X X X X X X X X X X X X X X X X X X X X X X X X X X X X X X X X X X X X X X X X X X X X X X
- 16. X X X X X X X X X X X X X X X X X X X X X X X X X X X X X X X X X X X X X X X X X X X X X X X X X X X X X X X X X X X X X X X
- 17. X X X X X X X X X X X X X X X X X X X X X X X X X X X X X X X X X X X X X X X X X X X X X X X X X X X X X X X X X X X X X X X
- 18. X X X X X X X X X X X X X X X X X X X X X X X X X X X X X X X X X X X X X X X X X X X X X X X X X X X X X X X X X X X X X X X
- 19. X X X X X X X X X X X X X X X X X X X X X X X X X X X X X X X X X X X X X X X X X X X X X X X X X X X X X X X X X X X X X X X
- 20. X X X X X X X X X X X X X X X X X X X X X X X X X X X X X X X X X X X X X X X X X X X X X X X X X X X X X X X X X X X X X X X
- 21. “Mind is a Pattern-Matching Machine” Edward De Bono Mechanism of the Mind (1969) cs@perceptive-analytics.com 646.583.0001 #VIZ
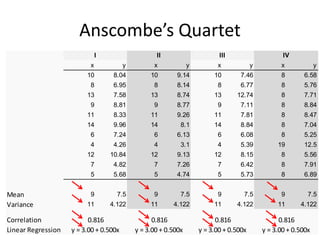
- 23. x y x y x y x y 10 8.04 10 9.14 10 7.46 8 6.58 8 6.95 8 8.14 8 6.77 8 5.76 13 7.58 13 8.74 13 12.74 8 7.71 9 8.81 9 8.77 9 7.11 8 8.84 11 8.33 11 9.26 11 7.81 8 8.47 14 9.96 14 8.1 14 8.84 8 7.04 6 7.24 6 6.13 6 6.08 8 5.25 4 4.26 4 3.1 4 5.39 19 12.5 12 10.84 12 9.13 12 8.15 8 5.56 7 4.82 7 7.26 7 6.42 8 7.91 5 5.68 5 4.74 5 5.73 8 6.89 Mean 9 7.5 9 7.5 9 7.5 9 7.5 Variance 11 4.122 11 4.122 11 4.122 11 4.122 Correlation Linear Regression y = 3.00 + 0.500x y = 3.00 + 0.500x y = 3.00 + 0.500x y = 3.00 + 0.500x Anscombe's Quartet I II III IV 0.816 0.816 0.816 0.816 Anscombe’s Quartet
- 24. How are the Data Sets Different? • All four data sets are identical • Distribution is different • Median and Mode could be different • Not Sure cs@perceptive-analytics.com 646.583.0001 #VIZ
- 25. Statistics May Hide Something cs@perceptive-analytics.com 646.583.0001 #VIZ
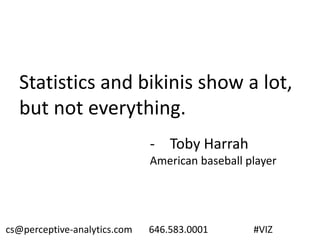
- 26. Statistics and bikinis show a lot, but not everything. - Toby Harrah American baseball player cs@perceptive-analytics.com 646.583.0001 #VIZ
- 27. Where do Data Visualizations Fit in Data Analytics Process? cs@perceptive-analytics.com 646.583.0001 #VIZ
- 28. Acquire Data Clean Data Explore Data Data Modeling Insights Communicate Where does Data Visualization Fit in Data Analytics Process? cs@perceptive-analytics.com 646.583.0001 #VIZ
- 29. How Visualizations Help Unlock Value cs@perceptive-analytics.com 646.583.0001 #VIZ
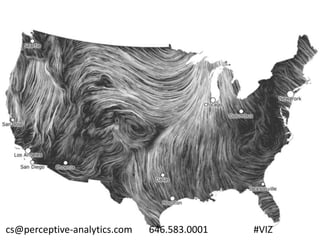
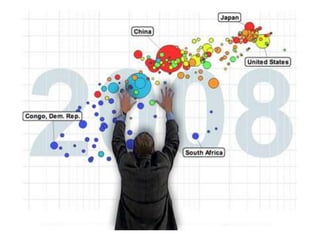
- 30. Make Sense of Vast Data Quickly cs@perceptive-analytics.com 646.583.0001 #VIZ
- 31. Make Sense of Vast Data Quickly cs@perceptive-analytics.com 646.583.0001 #VIZ
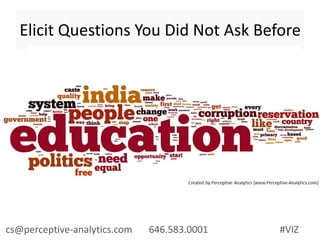
- 32. Elicit Questions You Did Not Ask Before cs@perceptive-analytics.com 646.583.0001 #VIZ
- 33. What should we do to make India a land of equal opportunity for all, free of prejudice and discrimination? - Ratan Tata cs@perceptive-analytics.com 646.583.0001 #VIZ
- 34. Sample Responses • @RNTata2000 in all democracies there is a gap on what ple want and what politicians r delivering,they r not doing the right thing, lobbying? • @bangaarm @RNTata2000 Budget 2012: This year is Tax Holiday. No income tax on your earnings. This is to bring back all the black money to India • @sri_v22 @RNTata2000 1. Kill corruption 2. Electoral reforms so that honest ple can get into politics 3. Media & activists should increase their role • @joseaaa @RNTata2000 Can't be articulated with 140 characters. Quality education for the masses is magic potion that can address most of the problem. • @dharmeshsharma8 @RNTata2000 Could we have your view on this topic? cs@perceptive-analytics.com 646.583.0001 #VIZ
- 35. Elicit Questions You Did Not Ask Before cs@perceptive-analytics.com 646.583.0001 #VIZ
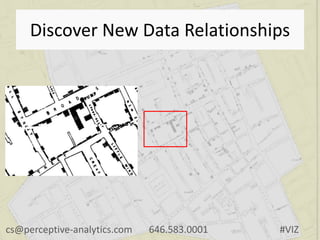
- 36. Discover New Data Relationships cs@perceptive-analytics.com 646.583.0001 #VIZ
- 37. Discover New Data Relationships cs@perceptive-analytics.com 646.583.0001 #VIZ
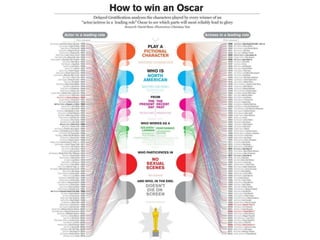
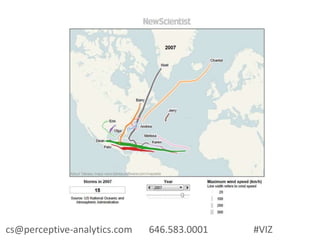
- 38. Show Others What You See cs@perceptive-analytics.com 646.583.0001 #VIZ
- 40. Show Others What You See http://guns.periscopic.com
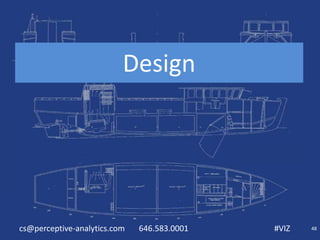
- 41. How to Create Visualizations cs@perceptive-analytics.com 646.583.0001 #VIZ
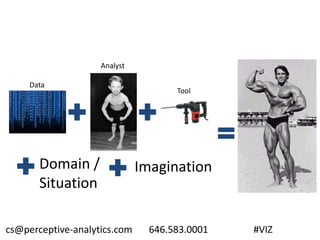
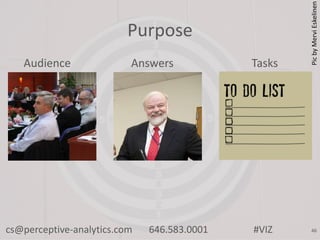
- 45. Purpose PicbyMerviEskelinen TasksAudience Answers cs@perceptive-analytics.com 646.583.0001 #VIZ 46
- 46. Guidelines • Understand your goals • Determine the most important dimensions of your data • Determine key data relationships • Show data close to reality e.g. maps, time lines etc. • Choose encoding wisely “Function first, suave next” • What questions do you want answered? cs@perceptive-analytics.com 646.583.0001 #VIZ
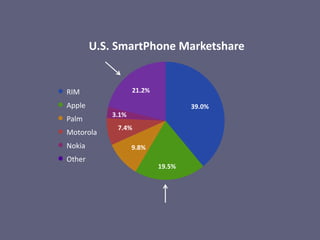
- 51. What Do You Think About This Chart? cs@perceptive-analytics.com 646.583.0001 #VIZ
- 52. What’s Wrong with this Chart? • Too Big • Poor colors • Nothing wrong, looks good • It’s just wrong • No comment cs@perceptive-analytics.com 646.583.0001 #VIZ 53
- 53. 39.0% 19.5% 9.8% 7.4% 3.1% 21.2% U.S. SmartPhone Marketshare RIM Apple Palm Motorola Nokia Other
- 55. $450 $650 $850 Jan Feb Mar Apr May Jun Jul Aug Sep Oct Nov Dec Monthly Revenue 470 900 700 550 800 600 473 610 600 300 500 450 $0 $200 $400 $600 $800 $1,000 Jan Feb Mar Apr May Jun Jul Aug Sep Oct Nov Dec Monthly Revenue ThousandsThousands
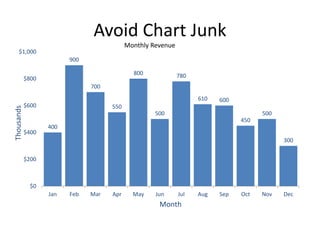
- 56. Avoid Chart Junk $0 $200 $400 $600 $800 $1,000 Jan Feb Mar Apr May Jun Jul Aug Sep Oct Nov Dec Month Monthly Revenue Thousands
- 57. 400 900 700 550 800 500 780 610 600 450 500 300 $0 $200 $400 $600 $800 $1,000 Jan Feb Mar Apr May Jun Jul Aug Sep Oct Nov Dec Month Monthly Revenue Avoid Chart Junk Thousands
- 58. Maximize Data Ink Ratio Data-ink/Total ink used Maximize Data Density (# entries in data matrix)/(area of graphic)
- 60. Colors cs@perceptive-analytics.com 646.583.0001 #VIZ 61 Create Color Harmony
- 61. ColorBrewer2.org
- 65. Resources Designing Data Visualizations (Noah Iliinsky, Julie Steele) Visual Encoding complexdiagrams.com/properties richardbrath.wordpress.com Edward Tufte edwardtufte.com D3JS.org Processing.org Principles of Visualization Design D3 Visualizations cs@perceptive-analytics.com 646.583.0001 #VIZ
- 67. Your Feedback on this Webinar • Below Expectations • Met Expectations • Above Expectations cs@perceptive-analytics.com 646.583.0001 #VIZ 70
Editor's Notes
- #66: http://www.tableausoftware.com/public/gallery/new-jersey-test-score-analysis-visualization http://www.tableausoftware.com/public/gallery/geography-diabetes http://www.tableausoftware.com/public/gallery/beautiful-and-dangerous-history http://bl.ocks.org/tjdecke/5558084 http://mbostock.github.io/d3/talk/20111116/pack-hierarchy.html
- #68: http://www.nytimes.com/interactive/2012/02/13/us/politics/2013-budget-proposal-graphic.html