


![The UNIVERSITY Database
• Consider a UNIVERSITY database that keeps track of students and
their majors, transcripts, and registration as well as of the university’s
course offerings. The database also keeps track of the sponsored
research projects of faculty and graduate students.
• For each person, the database maintains information on the person’s
Name [Name], social security number [Ssn], address [Address], sex
[Sex], and birth date [BDate]. PERSON can be classified as FACULTY
and STUDENT. Specific attributes of FACULTY are rank (assistant,
associate, adjunct, research, visiting, etc.), office [FOffice], office phone
[FPhone], and salary [Salary]. All faculty members are related to the
academic department(s) with which they are affiliated (a faculty member
can be associated with several departments).
• A specific attribute of STUDENT is Class. Each student is also related to
his or her major and minor departments, if known ([MAJOR] and
[MINOR]), to the course sections he or she is currently attending
[REGISTERED], and to the courses completed [TRANSCRIPT]. Each
transcript instance includes the grade the student received in the
course section.](https://image.slidesharecdn.com/introductionereer-120305102251-phpapp02/85/Introduction-er-eer-55-320.jpg)
![• GRAD_STUDENT is a subclass of STUDENT, with the defining predicate
Class = 5. For each graduate student, we keep a list of previous degrees
[Degrees]. We also relate the graduate student to a faculty advisor
[ADVISOR] and to a thesis committee [COMMITTEE], if one exists.
• An academic department has the attributes name [DName], telephone
[DPhone], and office number [Office] and is related to the faculty member
who is its chairperson [CHAIRS] and to the college to which it belongs
[CD]. Each college has attributes college name [CName], office number
[COffice], and the name of its dean [Dean].
• A course has attributes course number [C#], course name [Cname], and
course description [CDesc]. Several sections of each course are offered,
with each section having the attributes section number [Sec#] and the
year and quarter in which the section was offered ([Year] and [Qtr]).
Section numbers uniquely identify each section. The sections being
offered during the current quarter are in a subclass
CURRENT_SECTION of SECTION, with the defining predicate Qtr =
CurrentQtr and Year = CurrentYear. Each section is related to the
instructor who taught or is teaching it ([TEACH]), if that instructor is in the
database.](https://image.slidesharecdn.com/introductionereer-120305102251-phpapp02/85/Introduction-er-eer-56-320.jpg)
![• The category INSTRUCTOR_RESEARCHER is a subset of the
union of FACULTY and GRAD_STUDENT and includes all faculty,
as well as graduate students who are supported by teaching or
research. Finally, the entity type GRANT keeps track of research
grants and contracts awarded to the university. Each grant has
attributes grant title [Title], grant number [No], the awarding agency
[Agency], and the starting date [StDate]. A grant is related to one
principal investigator [PI] and to all researchers it supports
[SUPPORT]. Each instance of support has as attributes the starting
date of support [Start], the ending date of the support (if known)
[End], and the percentage of time being spent on the project [Time]
by the researcher being supported
3753 X1](https://image.slidesharecdn.com/introductionereer-120305102251-phpapp02/85/Introduction-er-eer-57-320.jpg)

![Private Airport Database
• An EER diagram for a small private airport database that is used to
keep track of airplanes, their owners, airport employees, and pilots.
From the requirements for this database, the following information
was collected: Each AIRPLANE has a registration number [Reg#], is
of a particular plane type [OF_TYPE], and is stored in a particular
hangar [STORED_IN]. Each PLANE_TYPE has a model number
[Model], a capacity [Capacity], and a weight [Weight]. Each
HANGAR has a number [Number], a capacity [Capacity], and a
location [Location].
• The database also keeps track of the OWNERs of each plane
[OWNS] and the EMPLOYEEs who have maintained the plane
[MAINTAIN]. Each relationship instance in OWNS relates an
airplane to an owner and includes the purchase date [Pdate]. Each
relationship instance in MAINTAIN relates an employee to a service
record [SERVICE].](https://image.slidesharecdn.com/introductionereer-120305102251-phpapp02/85/Introduction-er-eer-59-320.jpg)
![• Each plane undergoes service many times; hence, it is related by
[PLANE_SERVICE] to a number of service records. A service record
includes as attributes the date of maintenance [Date], the number of
hours spent on the work [Hours], and the type of work done
[Workcode]. We use an entity type [SERVICE] to represent airplane
service, because the airplane registration number is used to identify
a service record. An owner is either a person or a corporation.
person [PERSON] entity type can be classified as pilots [PILOT]
and employees [EMPLOYEE].
• Each pilot has specific attributes license number [Lic_Num] and
• restrictions [Restr]; each employee has specific attributes salary
[Salary] and shift worked [Shift].
• All PERSON entities in the database have data kept on their social
security number [Ssn], name [Name], address [Address], and
telephone number [Phone].
• For CORPORATION entities, the data kept includes name [Name],
address[Address], and telephone number [Phone].
• The database also keeps track of the types of planes each pilot is
authorized to fly [FLIES] and the types of planes each employee can
do maintenance work on [WORKS_ON].](https://image.slidesharecdn.com/introductionereer-120305102251-phpapp02/85/Introduction-er-eer-60-320.jpg)


Introduction er & eer
- 1. Database Management Systems: Basic Concepts
- 2. Definitions • Data: known facts that can be recorded • Database: a collection of data • represents some aspect of the real world • logically coherent collection (not a random collection) • designed, built & populated for a specific purpose • Database Management System: the software that manages the data
- 3. DBMSs provide... • Facilities to: – Define – specify data types, structures & constraints for the data to be stored in the database – Construct – store the data – Manipulate – pose queries to retrieve specific data, update data or generate reports based on the data
- 4. Popular Examples • Company Databases – employees, departments, projects … • Airline Reservation Systems – flights, fares, customers, reservations .. • Library Databases – authors, titles, publishers, videos … • Bank Databases – accounts, customers ...
- 5. Schemas & Instances • Important to distinguish between – database schema: the description of the database – database: the stored data
- 6. Financial Records (Company, Type, Name, Date, Amt, NumShares, Broker) Company Type Name Date Amt NumShares Broker Trimark Mutual Trimark 01/01/84 49.75 100 C. Harris Fund Fund AGF Mutual Foreign 01/01/94 62.25 1000 C. Harris Fund Equity
- 7. Database States • Empty State -- database is empty when we first define the database schema • Initial State -- database is first populated or loaded with data • Current State -- snapshot in time 3753 7
- 8. DBMS Languages • DDL: Data Definition Language – used to define/change the structure of the database • DML: Data Manipulation Language – used to query the database, insert data, change data or delete data 3753 8
- 9. Classification of DBMSs • Data Model Classification – relational, network, hierarchical, object- oriented … • Number of users – single user or multi-user • Number of Sites – centralized vs distributed • Cost of the DBMS 3753 9
- 10. Data Model • A collection of concepts that can be used to define the structure (data, data types, relations and constraints) of a database. • Examples: – Entity Relationship model – Relational Model – hierarchical & network models – object-data models
- 12. Entity-Relationship Model • Most popular conceptual model for database design • Basis for many other models • Describes the data in a system and how that data is related • Describes data as entities, attributes and relationships 3753 X1
- 13. Database requirements • We must convert the written database requirements into an E-R diagram • Need to determine the entities, attributes and relationships. – nouns = entities – adjectives = attributes – verbs = relationships 3753 X1
- 14. The Pieces • Objects – Entity (including weak entities) – Attribute – Relationship • “Structural” Constraints – Cardinality – Participation 3753 X1
- 15. Entities • Entity – basic object of the E-R model – Represents a “thing” with an independent existence – Can exist physically or conceptually • a professor, a student, a course • Entity type – used to define a set of entities with the same properties. 3753 X1
- 16. Entity and Entity Types Name Number Topic Entity Type Course Number: 3753 Entity Name: Database Management Systems Topic: Introduction to DBMSs 3753 X1
- 17. Attributes • Each entity has a set of associated properties that describes the entity. These properties are known as attributes. • Attributes can be: – Simple or Composite – Single or Multi-valued – Stored or Derived – NULL 3753 X1
- 18. Attributes (cont’d) Simple Professor Start Date First Professor Composite Name Last 3753 X1
- 19. Attributes (cont’d) Single Professor Employee ID# Multi-Valued Professor Email 3753 X1
- 20. Attributes (cont’d) Stored Professor Start Date Derived Professor Years Teaching 3753 X1
- 21. Attributes (cont’d) • NULL attributes have no value – not 0 (zero) – not a blank string • Attributes can be “nullable” where a null value is allowed, or “not nullable” where they must have a value. 3753 X1
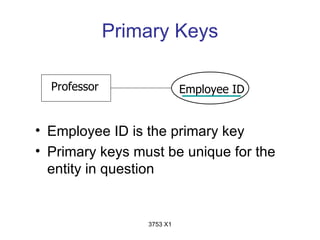
- 22. Primary Keys Professor Employee ID • Employee ID is the primary key • Primary keys must be unique for the entity in question 3753 X1
- 23. Relationships • defines a set of associations between various entities • can have attributes to define them • are limited by: – Participation – Cardinality Ratio 3753 X1
- 24. Relationships (cont’d) Section part of Course 3753 X1
- 25. Participation • Defines if the existence of an entity depends on it being related to another entity with a relationship type. – Partial – Total Section part of Course 3753 X1
- 26. Cardinality • The number of relationships that an entity may participate in. – 1:1, 1:N, N:M, M:1 N 1 Section part of Course 3753 X1
- 27. Weak entity • Weak entities do not have key attributes of their own. • Weak entities cannot exist without another a relationship to another entity. • A partial key is the portion of the key that comes from the weak entity. The rest of the key comes from the other entity in the relationship. • Weak entities always have total participation as they cannot exist without the identifying relationship. 3753 X1
- 28. Weak Entity (cont’d) Section ID Section Descriminator Identifying Relationship part of Number Course 3753 X1
- 29. Acadia Teaching Database Design an E-R schema for a database to store info about professors, courses and course sections indicating the following: • The name and employee ID number of each professor • The salary and email address(es) for each professor • How long each professor has been at the university • The course sections each professor teaches • The name, number and topic for each course offered • The section and room number for each course section • Each course section must have only one professor • Each course can have multiple sections 3753 X1
- 30. Visual View of the Database Employee ID Start Date Years Teaching Section ID Room 1 N Professor teaches Section Email N Salary First Name Part of Last 1 Number Course Topic Name
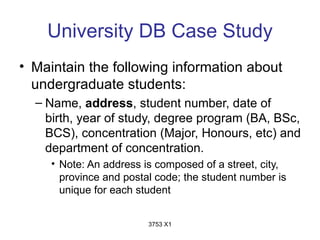
- 31. University DB Case Study • Maintain the following information about undergraduate students: – Name, address, student number, date of birth, year of study, degree program (BA, BSc, BCS), concentration (Major, Honours, etc) and department of concentration. • Note: An address is composed of a street, city, province and postal code; the student number is unique for each student 3753 X1
- 32. University Case Study (cont’d) • Maintain information about departments – Name, code (CS, Phy), office phone, and faculty members • Maintain information about courses: – Course number (3753), title, description, prerequisites. • Maintain information about course sections: – Section (A, B, C), term (X1), slot #, instructor 3753 X1
- 33. University Case Study (cont’d) • Maintain information about faculty: – Name, rank, employee number, salary, office number, phone number and email address. – Note: employee number is unique • Maintain a program of study for the current year for each student: – i.e. courses that each student is enrolled in 3753 X1
- 34. Address Street Number N M Section Enrolled Student Number City Term Name Province Slot N N 1 Teaches DOB Postal Code Has Salary Name 1 N Faculty Number Number Prereq Office 1 N Title Course M Phone Start Date Head Member Description Email 1 1 End Date Code Rank N 1 Name Offer Dept Phone
- 35. Extended E-R Model • E-R model is sufficient for traditional database applications • Nontraditional applications (CAD, multimedia) have more complex requirements • Can extend traditional E-R diagrams with semantic data modeling concepts 3753 X1
- 36. IS-A Relationship Name Employee S.S.N. IS-A Staff Faculty Teaching Assistant Position Rank Student # 3753 X1
- 37. Specialization & Generalization • Specialization – process of taking an entity and creating several specialized subclasses • Generalization – process of taking several related entities and creating a general superclass • We will talk mainly of specialization, but most information will also apply to generalization 3753 X1
- 38. Specialization constraints • Specializations can be predicate-defined or attribute-defined or user-defined • Disjointness constraint – specialization is disjoint or overlapping • Completeness constraint – specialization is total or partial 3753 X1
- 39. Predicate-defined subclass • An attribute value is used to determine the members of a subclass • Not all members of every subclass can be determined by the attribute value • In the following example, the Pension Plan type can be used to determine faculty from staff, but has no effect on students or those who opted out of the pension plan. 3753 X1
- 40. Predicate-defined subclass Pension Person S.S.N. Plan Type Note: not all d employees included Staff Faculty Position Rank 3753 X1
- 41. Attribute-defined subclass • There is one defining attribute for all subclasses • Each member of the superclass can be assigned to the appropriate subclass based on this one attribute 3753 X1
- 42. Attribute-defined subclass Jobtype Employee S.S.N. Jobtype d “Faculty” “Staff” “Student” Staff Students Faculty Rank Year Rank 3753 X1
- 43. User-defined subclass • When there is no condition to automatically determine membership in a subclass, it must be done at the discretion of the user. 3753 X1
- 44. Disjointness constraint • Specifies that an entity can be a member of at most one subclass • There can be no overlap between the subclasses • We use the notation of a d in a circle to symbolize that the subclasses are disjoint 3753 X1
- 45. Disjoint constraint Name Employee S.S.N. d Staff Teaching Assistant Faculty Position Rank Student # 3753 X1
- 46. Overlap • Entities are able to belong to more than one subclass • Notation is an o inside of a circle 3753 X1
- 47. Overlap Jobtype Employee S.S.N. A staff member may o also be a student Staff Students Faculty Rank Year Rank 3753 X1
- 48. Completeness Constraint • May be total or partial • for total, every entity in the superclass must belong to a subclass • for partial, entities in the superclass do not need to be part of any subclass • notation for total and partial are the same as in a regular E-R diagram – single and double lines 3753 X1
- 49. Partial Pension Person S.S.N. Plan Type d Staff Faculty Rank Rank 3753 X1
- 50. Total Jobtype Employee S.I.N. o Staff Students Faculty Rank Year Rank 3753 X1
- 51. Hierarchies and Lattices • Hierarchies – a tree-like structure where each subclass belongs to only one superclass • Lattices – a graph-like structure where a subclass can belong to more than one superclass 3753 X1
- 52. Lattice name Person o student # Employee Student salary Teaching Assistant course 3753 X1
- 53. 3753 X1
- 54. Union Types and Lattice • Lattice – Subset of the Intersection of the superclasses. – A shared subclass (Teaching Assistant) is the subclass in two distinct superclass relatioships • Union Types – Subset of the unoin of distinct Entity Types 3753 X1
- 55. The UNIVERSITY Database • Consider a UNIVERSITY database that keeps track of students and their majors, transcripts, and registration as well as of the university’s course offerings. The database also keeps track of the sponsored research projects of faculty and graduate students. • For each person, the database maintains information on the person’s Name [Name], social security number [Ssn], address [Address], sex [Sex], and birth date [BDate]. PERSON can be classified as FACULTY and STUDENT. Specific attributes of FACULTY are rank (assistant, associate, adjunct, research, visiting, etc.), office [FOffice], office phone [FPhone], and salary [Salary]. All faculty members are related to the academic department(s) with which they are affiliated (a faculty member can be associated with several departments). • A specific attribute of STUDENT is Class. Each student is also related to his or her major and minor departments, if known ([MAJOR] and [MINOR]), to the course sections he or she is currently attending [REGISTERED], and to the courses completed [TRANSCRIPT]. Each transcript instance includes the grade the student received in the course section.
- 56. • GRAD_STUDENT is a subclass of STUDENT, with the defining predicate Class = 5. For each graduate student, we keep a list of previous degrees [Degrees]. We also relate the graduate student to a faculty advisor [ADVISOR] and to a thesis committee [COMMITTEE], if one exists. • An academic department has the attributes name [DName], telephone [DPhone], and office number [Office] and is related to the faculty member who is its chairperson [CHAIRS] and to the college to which it belongs [CD]. Each college has attributes college name [CName], office number [COffice], and the name of its dean [Dean]. • A course has attributes course number [C#], course name [Cname], and course description [CDesc]. Several sections of each course are offered, with each section having the attributes section number [Sec#] and the year and quarter in which the section was offered ([Year] and [Qtr]). Section numbers uniquely identify each section. The sections being offered during the current quarter are in a subclass CURRENT_SECTION of SECTION, with the defining predicate Qtr = CurrentQtr and Year = CurrentYear. Each section is related to the instructor who taught or is teaching it ([TEACH]), if that instructor is in the database.
- 57. • The category INSTRUCTOR_RESEARCHER is a subset of the union of FACULTY and GRAD_STUDENT and includes all faculty, as well as graduate students who are supported by teaching or research. Finally, the entity type GRANT keeps track of research grants and contracts awarded to the university. Each grant has attributes grant title [Title], grant number [No], the awarding agency [Agency], and the starting date [StDate]. A grant is related to one principal investigator [PI] and to all researchers it supports [SUPPORT]. Each instance of support has as attributes the starting date of support [Start], the ending date of the support (if known) [End], and the percentage of time being spent on the project [Time] by the researcher being supported 3753 X1
- 58. 3753 X1
- 59. Private Airport Database • An EER diagram for a small private airport database that is used to keep track of airplanes, their owners, airport employees, and pilots. From the requirements for this database, the following information was collected: Each AIRPLANE has a registration number [Reg#], is of a particular plane type [OF_TYPE], and is stored in a particular hangar [STORED_IN]. Each PLANE_TYPE has a model number [Model], a capacity [Capacity], and a weight [Weight]. Each HANGAR has a number [Number], a capacity [Capacity], and a location [Location]. • The database also keeps track of the OWNERs of each plane [OWNS] and the EMPLOYEEs who have maintained the plane [MAINTAIN]. Each relationship instance in OWNS relates an airplane to an owner and includes the purchase date [Pdate]. Each relationship instance in MAINTAIN relates an employee to a service record [SERVICE].
- 60. • Each plane undergoes service many times; hence, it is related by [PLANE_SERVICE] to a number of service records. A service record includes as attributes the date of maintenance [Date], the number of hours spent on the work [Hours], and the type of work done [Workcode]. We use an entity type [SERVICE] to represent airplane service, because the airplane registration number is used to identify a service record. An owner is either a person or a corporation. person [PERSON] entity type can be classified as pilots [PILOT] and employees [EMPLOYEE]. • Each pilot has specific attributes license number [Lic_Num] and • restrictions [Restr]; each employee has specific attributes salary [Salary] and shift worked [Shift]. • All PERSON entities in the database have data kept on their social security number [Ssn], name [Name], address [Address], and telephone number [Phone]. • For CORPORATION entities, the data kept includes name [Name], address[Address], and telephone number [Phone]. • The database also keeps track of the types of planes each pilot is authorized to fly [FLIES] and the types of planes each employee can do maintenance work on [WORKS_ON].
- 61. 3753 X1
- 62. Relationships of Higher Degree q Relationship types of degree 2 are called binary q Relationship types of degree 3 are called ternary and of degree n are called n-ary q In general, an n-ary relationship is not equivalent to n binary relationships Chapter 3-62
- 63. TERNARY RELATIONSHIPS © The Benjamin/Cummings Publishing Company, Inc. 1994, Elmasri/Navathe, Fundamentals of Database Systems, Second Edition Chapter 3-63
- 64. TERNARY RELATIONSHIP- Instance Diagram SUPPLIER SUPPLY PROJECT s1 q r1 j q 1 s2 q r2 j q 2 r3 PART r4 j q 3 r5 p1 q p2 q r6 p3 q r7 Chapter 3-64
- 65. Problem with constraints on higher order relationship types m n p What does it mean to put m:n:p on the three arms of the relationship ? It is essentially meaningless. Chapter 3-65
- 66. TERNARY VS. BINARY RELATIONSHIPS © The Benjamin/Cummings Publishing Company, Inc. 1994, Elmasri/Navathe, Fundamentals of Database Systems, Second Edition Chapter 3-66
- 67. The (min,max) notation for higher order relationship type constraints (1,2) (1,3) (1,5) A Teacher can offer min 1 and max 2 Offerings A Course may have 1 to 3 Offerings A Student may enroll in from 1 to 5 Offerings Chapter 3-67