SlideShare a Scribd company logo
Statistics 2Dr. Ning DINGIBS I.007n.ding@pl.hanze.nl
Table of ContentReview of Chapter 5Sampling DistributionSPSS
Quiz AnswerIn 2003, 1.4 millionstudentstook the SATs. The mean of SAT score is 1026 and the standarddeviation is 209. Whatproportion of all students had SAT scores of lessthan820?b. Whatproportion of all students had SAT scores of more than820?QuizReviewSampling DistributionSPSSz = (820-1026)/209 =-0.99P=0.3389P=0.5-0.3389=0.1611P=0.5+0.3389=0.8389
Quiz AnswerIt was foundthat the probability of Americansspendingtheirleisure time fortwo weeks is 0.45; one week is 0.10, and 0.20 forthreeor more weeks.  Suppose we have surveyed 20 Americans, What is the probabilitythat 8 have 2 weeks of vacation of time?What is the probabilitythatonlyone American has one week of vacation time?What is the probabilitythat at most 2 of the workers have threeor more weeks of vacation time?QuizReviewSampling DistributionSPSSn=20, p=0.45  P=0.1623n=20, p=0.10 P=0.2702n=20, p=0.20 P=0.0115+0.0576+0.1369=0.2060
ReviewBionomialDistributionPoissonDistributionNormalDistributionQuizReviewSampling DistributionSPSSDiscretewithin a rangecontinuousDiscretewith meann!r ! (n-r) !Probability of r successes in n trials =λ: meanprqn-rA-3A-13A-1
Chapter 5, No. 5-37 P.270ReviewQuizReviewSampling DistributionSPSS1. Visualization is veryuseful !5-37 Normal Distribution, μ=6.4  σ=2.7(a).  P(4<X<5)=?Z1=(4-6.4)/2.7=-0.52P0.52=0.1985Z2=(5-6.4)/2.7=-0.89P0.89=0.3133P(4<X<5)=0.3133-0.1985=0.1148
Chapter 5, No. 5-38 P.270ReviewQuizReviewSampling DistributionSPSS2. FromBinomial Distribution to NormalApproximation5-38 NormalapproximationN=50   p=0.25(a). P(x>10)=?
ReviewBionomialDistributionNormalDistributionQuizReviewSampling DistributionSPSSDiscretewithin a rangecontinuousStep 1: Is itallowed?When n*p>=5 AND n*q>=5Step 2: μ =n*pσ =√n*p*qStep 3: Find CCF (ContinuityCorrection Factor)
ReviewBionomialDistributionNormalDistributionQuizReviewSampling DistributionSPSSDiscretewithin a rangecontinuousStep 3: Find CCF (ContinuityCorrection Factor)X<3X=<3X>3X>=3Discrete:  1         2         3         4         5         6         7        8CCF X>3.5CCF X>2.5CCF X<2.5CCF X<3.5Continuous:  1         2         3         4         5         6         7        8
Chapter 5, No. 5-38 P.270ReviewQuizReviewSampling DistributionSPSS2. FromBinomial Distribution to NormalApproximation5-38 NormalapproximationN=50   p=0.25(a). P(x>10)=?Step 1: n*p=50*0.25=12.5   >5AND n*q=50*0.75=37.5     >5Yes, it is allowed. Step 2: n*p=50*0.25=12.5   =μσ=√n*p*q= √50*0.25*0.75=3.062Step 3: CCF X=10.5P(x>10.5)=?z=(10.5-12.5)/3.062 =0.65
Chapter 5, No. 5-38 P.270ReviewQuizReviewSampling DistributionSPSS2. FromBinomial Distribution to NormalApproximation5-38 NormalapproximationN=50   p=0.25(a). P(x>10)=?Step 3: CCF X=10.5P(x>10.5)=?z=(10.5-12.5)/3.062 =0.65Step 4: VisualizationP0.65=0.2422P(x>10)=0.2422+0.5=0.7422
Chapter 5, No. 5-39 P.270ReviewQuizReviewSampling DistributionSPSS3. If P is known, butcannotbefound in the table, it is allowed to use the closestone. 5-39 Normal Distribution     σ=5.0 X=21 P=0.14(a). μ=?(b). X1?  P(X<X1)= 4%VisualizationPz=0.50-0.14=0.36   z=1.08(21-μ)/5.0=1.08μ=15.6Pz=0.5-0.04=0.46 z=1.75(X1-15.6)/5.0=-1.75X1=6.85
Chapter 5, No. 5-41 P.270Review5-41 μ=100, P(X<115)=0.9(a). σ=?QuizReviewSampling DistributionSPSSVisualizationz =1.28z =1.28=(115-100)/σσ=11.72
Chapter 5, No. 5-41 P.270Review5-41 μ=100, P(X<115)=0.9(a). σ=11.72(b). Stock at least ___?QuizReviewSampling DistributionSPSSVisualization(X-100)11.72=1.645   z =1.645  X=119.28Therefore, we’dbetter stock at least 120 tubes.
The Normal DistributionMolly earned a score of 940 on a national achievement test. The mean test score was 850 with a standard deviation of 100. What proportion of students had a higher score than Molly? (A) 0.10 (B) 0.18 (C) 0.50 (D) 0.82 (E) 0.90 Group DiscussionQuizReviewSampling DistributionSPSS
Self-PracticeChapter 5, No. 5-37 P.270QuizReviewSampling DistributionSPSSGiven that a random variable, X, has a normal distribution with mean 6.4 and standard deviation 2.7, findQ1. P (4.0<x<5.0)Q2. P(x>20)Q3. P(x<7.2)Q4. P((x<3.0) or (x>9.0))
Chapter 5, No. 5-37 P.270QuizReviewSampling DistributionSPSSGiven that a random variable, X, has a normal distribution with mean 6.4 and standard deviation 2.7, findQ1. P (4.0<x<5.0)Q2. P(x>20)Q3. P(x<7.2)Q4. P((x<3.0) or (x>9.0))Self-Practice
Sampling and Sampling DistributionQuizReviewSampling DistributionSPSSPopulationSample= all items chosen for study= a portion chosen from the populationParameterStatistic Greek or capital letters Lowercase Roman letters
Standard ErrorPopulation Range=80~240QuizReviewSampling DistributionSPSSµ = 100σ = 25=95Sample Range=90~120=106=101Standard Error of meanStandard Deviation of population____
Standard ErrorQuizReviewSampling DistributionSPSSSample size Dispersion of meansStandard Error
The Normal DistributionSPSS Tip: Descriptive StatisticsThe data can be downloaded from:Blackboard – Inductive Statsitics STA2—SPSS--Week 2 Creating Graphs.sav
SPSS Tip: Descriptive StatisticsQuizSamplingRandom SamplingExperiment DesignSampling DistributionMore about SamplingType data into SPSS	- Gender	- Age	- Satisfaction with STA21                     2                         3                       4                  5Hate it -------- Not like it --------- So so------------Like it-----Addicted to it
SPSS Tip: Descriptive StatisticsQuizSamplingRandom SamplingExperiment DesignSampling DistributionMore about SamplingType data into SPSS	- Gender	- Age	- Satisfactionwith STA22. Click on “Values” to define variablese.g. 0=male; 1=female1                     2                         3                       4                  5Hate it -------- Not like it --------- So so------------Like it-----Addicted to it1. Use the Variable View Tab
SPSS Tip: Descriptive StatisticsQuizSamplingRandom SamplingExperiment DesignSampling DistributionMore about SamplingType data into SPSS	- Gender	- Age	- Satisfaction with STA24. Input data intoeach column3. Use the Data View Tab
SPSS Tip: Descriptive StatisticsQuizSamplingRandom SamplingExperiment DesignSampling DistributionMore about SamplingType data into SPSS	- Gender	- Age	- Satisfaction with STA25. Don’tforget to choose the measurement level. * . Youcanedit the variables again.
6. Analyze—descriptivestatistics--DescriptiveSPSS Tip: Descriptive StatisticsQuizSamplingRandom SamplingExperiment DesignSampling DistributionMore about Sampling
SPSS Tip: Descriptive StatisticsNowyougetit!QuizSamplingRandom SamplingExperiment DesignSampling DistributionMore about Sampling
7. Analyze—descriptivestatistics--FrequenciesSPSS Tip: Descriptive StatisticsQuizSamplingRandom SamplingExperiment DesignSampling DistributionMore about Sampling
8. Choose the variableyouneed to analyzeSPSS Tip: Descriptive StatisticsQuizSamplingRandom SamplingExperiment DesignSampling DistributionMore about Sampling9. Click “Statistcs” to choose more
SPSS Tip: Descriptive StatisticsQuizSamplingRandom SamplingExperiment DesignSampling DistributionMore about SamplingNowyougetit!
SummaryReview of Chapter 5Sampling DistributionSPSS

More Related Content

PPTX
Statistics and inferences review - bootcamp
PPT
Math533 finalexamreviewfeb13
DOC
Math533 final exam_study_guide
DOCX
Psyc354 homework 55 complete solutions correct answers key
PPTX
What is the Mode?
PPT
Lesson 03 chapter 6 sampling
PPT
Lesson 06 chapter 9 two samples test and Chapter 11 chi square test
PPTX
Week3 Quiz Live Lecture 2010
Statistics and inferences review - bootcamp
Math533 finalexamreviewfeb13
Math533 final exam_study_guide
Psyc354 homework 55 complete solutions correct answers key
What is the Mode?
Lesson 03 chapter 6 sampling
Lesson 06 chapter 9 two samples test and Chapter 11 chi square test
Week3 Quiz Live Lecture 2010

Viewers also liked (10)

PPT
Lesson 04 chapter 7 estimation
PDF
Cómo elegir un posgrado webinar
PPSX
Lesson 2
PPT
Lesson 05 chapter 8 hypothesis testing
PDF
BQC College Quiz elims
PPTX
Marketing quiz
PPT
Sampling Design
PDF
Taglines that were most influential
PPTX
Marketing quiz (with answers)
Lesson 04 chapter 7 estimation
Cómo elegir un posgrado webinar
Lesson 2
Lesson 05 chapter 8 hypothesis testing
BQC College Quiz elims
Marketing quiz
Sampling Design
Taglines that were most influential
Marketing quiz (with answers)
Ad

Similar to Lesson 02 class practices (20)

PPTX
Final examexamplesapr2013
PPTX
Week8finalexamlivelecture2011 mt
PPTX
data-analytic-unit-ii-new-1basic data methods.pptx
PPT
Exploratory Data Analysis EFA Factor analysis
PPTX
Week8finalexamlivelecture2011
PPTX
Week8 finalexamlivelecture 2010december
PPTX
Week8 finalexamlivelecture 2010june
PPT
lecture6.ppt
PPT
continuous probability distributions.ppt
PPTX
Week8finalexamlivelecture dec2012
PPTX
Week8finalexamlivelecture april2012
PDF
SIM Mathematics 10 Measures of Position
DOCX
Missing Parts I don’t think you understood the assignment.docx
PPTX
Standard error and sample size
PPTX
Topic 8a Basic Statistics
PPT
PPTX
Overview of Machine Learning Part-2.pptx
PDF
Probability
PDF
Questions for R language.pdf
PPTX
01_(Chapter_One_-_Section_1)_QDA_1006_1.pptx
Final examexamplesapr2013
Week8finalexamlivelecture2011 mt
data-analytic-unit-ii-new-1basic data methods.pptx
Exploratory Data Analysis EFA Factor analysis
Week8finalexamlivelecture2011
Week8 finalexamlivelecture 2010december
Week8 finalexamlivelecture 2010june
lecture6.ppt
continuous probability distributions.ppt
Week8finalexamlivelecture dec2012
Week8finalexamlivelecture april2012
SIM Mathematics 10 Measures of Position
Missing Parts I don’t think you understood the assignment.docx
Standard error and sample size
Topic 8a Basic Statistics
Overview of Machine Learning Part-2.pptx
Probability
Questions for R language.pdf
01_(Chapter_One_-_Section_1)_QDA_1006_1.pptx
Ad

More from Ning Ding (20)

PPTX
Victor Yuan: interpretation of the economic data in China
PPSX
Lesson 6
PPSX
Lesson 5
PPSX
Lesson 4
PPSX
Lesson 3
PPSX
Lesson 1
PPT
Oct11 college 5
PPT
Sept27 college 3
PPT
Sept19 college 2
PPT
Sept13 2011 college 1
PPTX
Lesson01
PPTX
Lesson06
PPTX
Lesson05
PPTX
Lesson04
PPTX
Lesson03
PPTX
Lesson02
PPTX
Lesson07
PPT
Lesson 1 Chapter 5 probability
PPT
PPT
Victor Yuan: interpretation of the economic data in China
Lesson 6
Lesson 5
Lesson 4
Lesson 3
Lesson 1
Oct11 college 5
Sept27 college 3
Sept19 college 2
Sept13 2011 college 1
Lesson01
Lesson06
Lesson05
Lesson04
Lesson03
Lesson02
Lesson07
Lesson 1 Chapter 5 probability

Recently uploaded (20)

PPTX
Renaissance Architecture: A Journey from Faith to Humanism
PDF
Microbial disease of the cardiovascular and lymphatic systems
PDF
VCE English Exam - Section C Student Revision Booklet
PDF
Chapter 2 Heredity, Prenatal Development, and Birth.pdf
PPTX
Cell Types and Its function , kingdom of life
PDF
ANTIBIOTICS.pptx.pdf………………… xxxxxxxxxxxxx
PPTX
Lesson notes of climatology university.
PPTX
Cell Structure & Organelles in detailed.
PPTX
Microbial diseases, their pathogenesis and prophylaxis
PDF
Physiotherapy_for_Respiratory_and_Cardiac_Problems WEBBER.pdf
PDF
Module 4: Burden of Disease Tutorial Slides S2 2025
PPTX
1st Inaugural Professorial Lecture held on 19th February 2020 (Governance and...
PDF
Classroom Observation Tools for Teachers
PPTX
PPT- ENG7_QUARTER1_LESSON1_WEEK1. IMAGERY -DESCRIPTIONS pptx.pptx
PDF
O5-L3 Freight Transport Ops (International) V1.pdf
PDF
Saundersa Comprehensive Review for the NCLEX-RN Examination.pdf
PPTX
school management -TNTEU- B.Ed., Semester II Unit 1.pptx
PPTX
master seminar digital applications in india
PDF
RMMM.pdf make it easy to upload and study
PDF
Basic Mud Logging Guide for educational purpose
Renaissance Architecture: A Journey from Faith to Humanism
Microbial disease of the cardiovascular and lymphatic systems
VCE English Exam - Section C Student Revision Booklet
Chapter 2 Heredity, Prenatal Development, and Birth.pdf
Cell Types and Its function , kingdom of life
ANTIBIOTICS.pptx.pdf………………… xxxxxxxxxxxxx
Lesson notes of climatology university.
Cell Structure & Organelles in detailed.
Microbial diseases, their pathogenesis and prophylaxis
Physiotherapy_for_Respiratory_and_Cardiac_Problems WEBBER.pdf
Module 4: Burden of Disease Tutorial Slides S2 2025
1st Inaugural Professorial Lecture held on 19th February 2020 (Governance and...
Classroom Observation Tools for Teachers
PPT- ENG7_QUARTER1_LESSON1_WEEK1. IMAGERY -DESCRIPTIONS pptx.pptx
O5-L3 Freight Transport Ops (International) V1.pdf
Saundersa Comprehensive Review for the NCLEX-RN Examination.pdf
school management -TNTEU- B.Ed., Semester II Unit 1.pptx
master seminar digital applications in india
RMMM.pdf make it easy to upload and study
Basic Mud Logging Guide for educational purpose

Lesson 02 class practices

  • 1. Statistics 2Dr. Ning DINGIBS I.007n.ding@pl.hanze.nl
  • 2. Table of ContentReview of Chapter 5Sampling DistributionSPSS
  • 3. Quiz AnswerIn 2003, 1.4 millionstudentstook the SATs. The mean of SAT score is 1026 and the standarddeviation is 209. Whatproportion of all students had SAT scores of lessthan820?b. Whatproportion of all students had SAT scores of more than820?QuizReviewSampling DistributionSPSSz = (820-1026)/209 =-0.99P=0.3389P=0.5-0.3389=0.1611P=0.5+0.3389=0.8389
  • 4. Quiz AnswerIt was foundthat the probability of Americansspendingtheirleisure time fortwo weeks is 0.45; one week is 0.10, and 0.20 forthreeor more weeks. Suppose we have surveyed 20 Americans, What is the probabilitythat 8 have 2 weeks of vacation of time?What is the probabilitythatonlyone American has one week of vacation time?What is the probabilitythat at most 2 of the workers have threeor more weeks of vacation time?QuizReviewSampling DistributionSPSSn=20, p=0.45 P=0.1623n=20, p=0.10 P=0.2702n=20, p=0.20 P=0.0115+0.0576+0.1369=0.2060
  • 5. ReviewBionomialDistributionPoissonDistributionNormalDistributionQuizReviewSampling DistributionSPSSDiscretewithin a rangecontinuousDiscretewith meann!r ! (n-r) !Probability of r successes in n trials =λ: meanprqn-rA-3A-13A-1
  • 6. Chapter 5, No. 5-37 P.270ReviewQuizReviewSampling DistributionSPSS1. Visualization is veryuseful !5-37 Normal Distribution, μ=6.4 σ=2.7(a). P(4<X<5)=?Z1=(4-6.4)/2.7=-0.52P0.52=0.1985Z2=(5-6.4)/2.7=-0.89P0.89=0.3133P(4<X<5)=0.3133-0.1985=0.1148
  • 7. Chapter 5, No. 5-38 P.270ReviewQuizReviewSampling DistributionSPSS2. FromBinomial Distribution to NormalApproximation5-38 NormalapproximationN=50 p=0.25(a). P(x>10)=?
  • 8. ReviewBionomialDistributionNormalDistributionQuizReviewSampling DistributionSPSSDiscretewithin a rangecontinuousStep 1: Is itallowed?When n*p>=5 AND n*q>=5Step 2: μ =n*pσ =√n*p*qStep 3: Find CCF (ContinuityCorrection Factor)
  • 9. ReviewBionomialDistributionNormalDistributionQuizReviewSampling DistributionSPSSDiscretewithin a rangecontinuousStep 3: Find CCF (ContinuityCorrection Factor)X<3X=<3X>3X>=3Discrete: 1 2 3 4 5 6 7 8CCF X>3.5CCF X>2.5CCF X<2.5CCF X<3.5Continuous: 1 2 3 4 5 6 7 8
  • 10. Chapter 5, No. 5-38 P.270ReviewQuizReviewSampling DistributionSPSS2. FromBinomial Distribution to NormalApproximation5-38 NormalapproximationN=50 p=0.25(a). P(x>10)=?Step 1: n*p=50*0.25=12.5 >5AND n*q=50*0.75=37.5 >5Yes, it is allowed. Step 2: n*p=50*0.25=12.5 =μσ=√n*p*q= √50*0.25*0.75=3.062Step 3: CCF X=10.5P(x>10.5)=?z=(10.5-12.5)/3.062 =0.65
  • 11. Chapter 5, No. 5-38 P.270ReviewQuizReviewSampling DistributionSPSS2. FromBinomial Distribution to NormalApproximation5-38 NormalapproximationN=50 p=0.25(a). P(x>10)=?Step 3: CCF X=10.5P(x>10.5)=?z=(10.5-12.5)/3.062 =0.65Step 4: VisualizationP0.65=0.2422P(x>10)=0.2422+0.5=0.7422
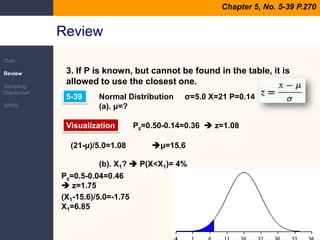
  • 12. Chapter 5, No. 5-39 P.270ReviewQuizReviewSampling DistributionSPSS3. If P is known, butcannotbefound in the table, it is allowed to use the closestone. 5-39 Normal Distribution σ=5.0 X=21 P=0.14(a). μ=?(b). X1?  P(X<X1)= 4%VisualizationPz=0.50-0.14=0.36  z=1.08(21-μ)/5.0=1.08μ=15.6Pz=0.5-0.04=0.46 z=1.75(X1-15.6)/5.0=-1.75X1=6.85
  • 13. Chapter 5, No. 5-41 P.270Review5-41 μ=100, P(X<115)=0.9(a). σ=?QuizReviewSampling DistributionSPSSVisualizationz =1.28z =1.28=(115-100)/σσ=11.72
  • 14. Chapter 5, No. 5-41 P.270Review5-41 μ=100, P(X<115)=0.9(a). σ=11.72(b). Stock at least ___?QuizReviewSampling DistributionSPSSVisualization(X-100)11.72=1.645  z =1.645  X=119.28Therefore, we’dbetter stock at least 120 tubes.
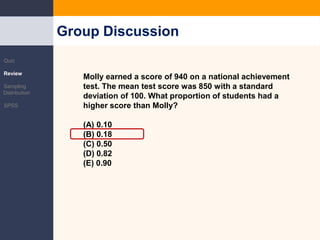
  • 15. The Normal DistributionMolly earned a score of 940 on a national achievement test. The mean test score was 850 with a standard deviation of 100. What proportion of students had a higher score than Molly? (A) 0.10 (B) 0.18 (C) 0.50 (D) 0.82 (E) 0.90 Group DiscussionQuizReviewSampling DistributionSPSS
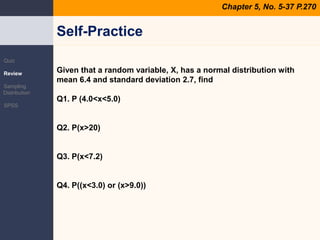
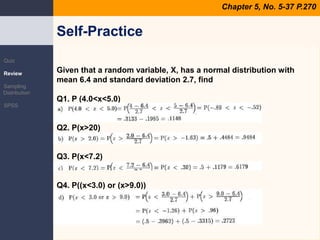
  • 16. Self-PracticeChapter 5, No. 5-37 P.270QuizReviewSampling DistributionSPSSGiven that a random variable, X, has a normal distribution with mean 6.4 and standard deviation 2.7, findQ1. P (4.0<x<5.0)Q2. P(x>20)Q3. P(x<7.2)Q4. P((x<3.0) or (x>9.0))
  • 17. Chapter 5, No. 5-37 P.270QuizReviewSampling DistributionSPSSGiven that a random variable, X, has a normal distribution with mean 6.4 and standard deviation 2.7, findQ1. P (4.0<x<5.0)Q2. P(x>20)Q3. P(x<7.2)Q4. P((x<3.0) or (x>9.0))Self-Practice
  • 18. Sampling and Sampling DistributionQuizReviewSampling DistributionSPSSPopulationSample= all items chosen for study= a portion chosen from the populationParameterStatistic Greek or capital letters Lowercase Roman letters
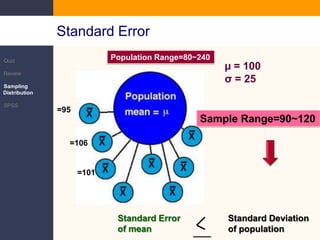
  • 19. Standard ErrorPopulation Range=80~240QuizReviewSampling DistributionSPSSµ = 100σ = 25=95Sample Range=90~120=106=101Standard Error of meanStandard Deviation of population____
  • 20. Standard ErrorQuizReviewSampling DistributionSPSSSample size Dispersion of meansStandard Error
  • 21. The Normal DistributionSPSS Tip: Descriptive StatisticsThe data can be downloaded from:Blackboard – Inductive Statsitics STA2—SPSS--Week 2 Creating Graphs.sav
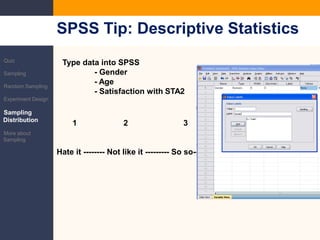
  • 22. SPSS Tip: Descriptive StatisticsQuizSamplingRandom SamplingExperiment DesignSampling DistributionMore about SamplingType data into SPSS - Gender - Age - Satisfaction with STA21 2 3 4 5Hate it -------- Not like it --------- So so------------Like it-----Addicted to it
  • 23. SPSS Tip: Descriptive StatisticsQuizSamplingRandom SamplingExperiment DesignSampling DistributionMore about SamplingType data into SPSS - Gender - Age - Satisfactionwith STA22. Click on “Values” to define variablese.g. 0=male; 1=female1 2 3 4 5Hate it -------- Not like it --------- So so------------Like it-----Addicted to it1. Use the Variable View Tab
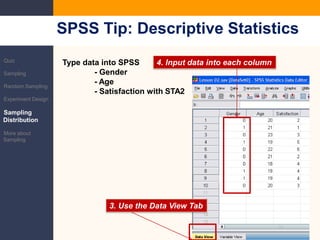
  • 24. SPSS Tip: Descriptive StatisticsQuizSamplingRandom SamplingExperiment DesignSampling DistributionMore about SamplingType data into SPSS - Gender - Age - Satisfaction with STA24. Input data intoeach column3. Use the Data View Tab
  • 25. SPSS Tip: Descriptive StatisticsQuizSamplingRandom SamplingExperiment DesignSampling DistributionMore about SamplingType data into SPSS - Gender - Age - Satisfaction with STA25. Don’tforget to choose the measurement level. * . Youcanedit the variables again.
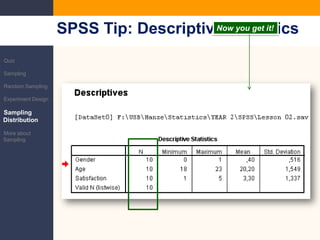
  • 26. 6. Analyze—descriptivestatistics--DescriptiveSPSS Tip: Descriptive StatisticsQuizSamplingRandom SamplingExperiment DesignSampling DistributionMore about Sampling
  • 27. SPSS Tip: Descriptive StatisticsNowyougetit!QuizSamplingRandom SamplingExperiment DesignSampling DistributionMore about Sampling
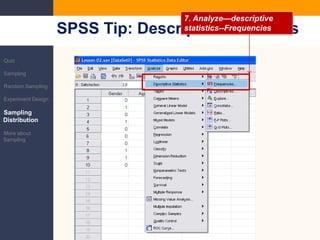
  • 28. 7. Analyze—descriptivestatistics--FrequenciesSPSS Tip: Descriptive StatisticsQuizSamplingRandom SamplingExperiment DesignSampling DistributionMore about Sampling
  • 29. 8. Choose the variableyouneed to analyzeSPSS Tip: Descriptive StatisticsQuizSamplingRandom SamplingExperiment DesignSampling DistributionMore about Sampling9. Click “Statistcs” to choose more
  • 30. SPSS Tip: Descriptive StatisticsQuizSamplingRandom SamplingExperiment DesignSampling DistributionMore about SamplingNowyougetit!
  • 31. SummaryReview of Chapter 5Sampling DistributionSPSS