SlideShare a Scribd company logo
Leveraging Python Telemetry, Azure Application
Logging, and Performance Testing in Production for
Enhanced Application Performance
In today's fast-paced digital landscape, ensuring the reliability, performance, and
observability of applications is crucial. This involves leveraging tools and techniques such as
Python telemetry, Azure application logging, and performance testing in production. These
practices help in monitoring application health, diagnosing issues, and optimizing
performance, ultimately leading to a better user experience and more robust applications. In
this article, we'll explore these concepts in detail and understand how they can be effectively
implemented.
Understanding Python Telemetry
Python telemetry refers to the collection, processing, and analysis of data from Python
applications to monitor their performance and behavior. This data includes metrics, logs,
traces, and other relevant information that provides insights into the application's internal
state. Telemetry is essential for identifying performance bottlenecks, detecting anomalies,
and ensuring the overall health of an application.
Implementing Python Telemetry
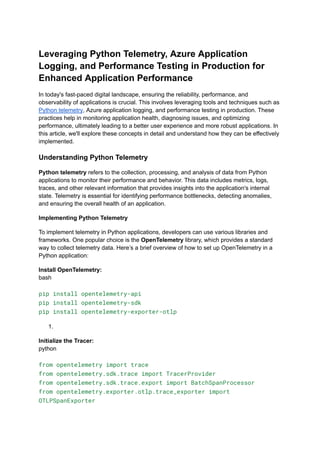
To implement telemetry in Python applications, developers can use various libraries and
frameworks. One popular choice is the OpenTelemetry library, which provides a standard
way to collect telemetry data. Here’s a brief overview of how to set up OpenTelemetry in a
Python application:
Install OpenTelemetry:
bash
pip install opentelemetry-api
pip install opentelemetry-sdk
pip install opentelemetry-exporter-otlp
1.
Initialize the Tracer:
python
from opentelemetry import trace
from opentelemetry.sdk.trace import TracerProvider
from opentelemetry.sdk.trace.export import BatchSpanProcessor
from opentelemetry.exporter.otlp.trace_exporter import
OTLPSpanExporter
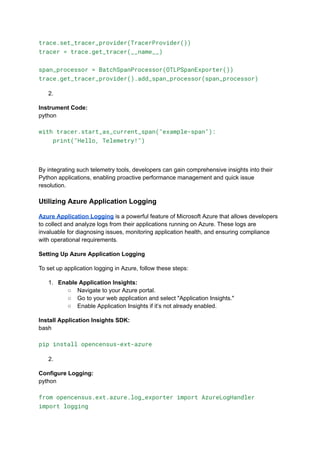
trace.set_tracer_provider(TracerProvider())
tracer = trace.get_tracer(__name__)
span_processor = BatchSpanProcessor(OTLPSpanExporter())
trace.get_tracer_provider().add_span_processor(span_processor)
2.
Instrument Code:
python
with tracer.start_as_current_span("example-span"):
print("Hello, Telemetry!")
By integrating such telemetry tools, developers can gain comprehensive insights into their
Python applications, enabling proactive performance management and quick issue
resolution.
Utilizing Azure Application Logging
Azure Application Logging is a powerful feature of Microsoft Azure that allows developers
to collect and analyze logs from their applications running on Azure. These logs are
invaluable for diagnosing issues, monitoring application health, and ensuring compliance
with operational requirements.
Setting Up Azure Application Logging
To set up application logging in Azure, follow these steps:
1. Enable Application Insights:
○ Navigate to your Azure portal.
○ Go to your web application and select "Application Insights."
○ Enable Application Insights if it’s not already enabled.
Install Application Insights SDK:
bash
pip install opencensus-ext-azure
2.
Configure Logging:
python
from opencensus.ext.azure.log_exporter import AzureLogHandler
import logging
logger = logging.getLogger(__name__)
logger.addHandler(AzureLogHandler(
connection_string='InstrumentationKey=your_instrumentation_key'))
logger.warning('This is a warning message.')
3. View Logs in Azure Portal:
○ Once the logging is configured, you can view and analyze the logs in the
Azure portal under Application Insights.
Azure Application Logging provides rich insights into application performance and behavior,
helping developers identify and fix issues quickly and efficiently.
Performance Testing in Production
Performance testing in production is a practice where applications are tested for
performance issues in a live environment. This approach helps in identifying real-world
performance bottlenecks and ensuring that the application can handle actual user load.
Best Practices for Performance Testing in Production
1. Use Realistic Load:
○ Simulate realistic user traffic to understand how the application performs
under actual load conditions.
2. Monitor Key Metrics:
○ Track important performance metrics such as response time, throughput,
error rates, and resource utilization.
3. Automate Testing:
○ Use automation tools to regularly perform performance tests. Tools like
JMeter, Locust, and Gatling can be used for this purpose.
4. Analyze Results:
○ Analyze the test results to identify performance bottlenecks and areas for
improvement.
5. Implement Continuous Testing:
○ Integrate performance testing into the CI/CD pipeline to ensure that
performance is continuously monitored and optimized.
Example: Performance Testing with Locust
Locust is an open-source load testing tool that allows developers to define user behavior in
Python code. Here’s a simple example of how to use Locust for performance testing:
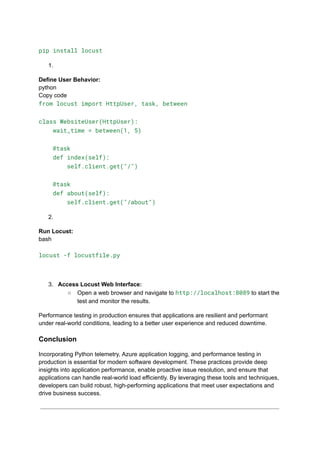
Install Locust:
bash
pip install locust
1.
Define User Behavior:
python
Copy code
from locust import HttpUser, task, between
class WebsiteUser(HttpUser):
wait_time = between(1, 5)
@task
def index(self):
self.client.get("/")
@task
def about(self):
self.client.get("/about")
2.
Run Locust:
bash
locust -f locustfile.py
3. Access Locust Web Interface:
○ Open a web browser and navigate to http://localhost:8089 to start the
test and monitor the results.
Performance testing in production ensures that applications are resilient and performant
under real-world conditions, leading to a better user experience and reduced downtime.
Conclusion
Incorporating Python telemetry, Azure application logging, and performance testing in
production is essential for modern software development. These practices provide deep
insights into application performance, enable proactive issue resolution, and ensure that
applications can handle real-world load efficiently. By leveraging these tools and techniques,
developers can build robust, high-performing applications that meet user expectations and
drive business success.
By following the guidelines and examples provided in this article, developers can effectively
implement these practices in their projects, leading to improved application performance and
reliability.

More Related Content

PDF
Python performance profiling
PDF
Application Insights and Jupyter Notebook(Opensource) combo to analyze large ...
PPTX
Aprenda mais sobre sua aplicação e seus usuários com Application Insights (DN...
PDF
Design and Monitoring Performance of Digital Properties
PDF
Ensuring Effective Performance Testing in Web Applications.pdf
PDF
Comprehensive Performance Testing: From Early Dev to Live Production
PPTX
Deep-Dive to Application Insights
PPTX
DevOps > CI + CD. A web developer's introduction to Application Insights
Python performance profiling
Application Insights and Jupyter Notebook(Opensource) combo to analyze large ...
Aprenda mais sobre sua aplicação e seus usuários com Application Insights (DN...
Design and Monitoring Performance of Digital Properties
Ensuring Effective Performance Testing in Web Applications.pdf
Comprehensive Performance Testing: From Early Dev to Live Production
Deep-Dive to Application Insights
DevOps > CI + CD. A web developer's introduction to Application Insights

Similar to Leveraging Python Telemetry, Azure Application Logging, and Performance Testing in Production for Enhanced Application Performance.pdf (20)

PDF
Enterprise-Ready FastAPI: Beyond the Basics
PDF
What is Performance Testing? - A Comprehensive Guide
PDF
Software Analytics: Data Analytics for Software Engineering
PPTX
Load testing with Visual Studio and Azure - Andrew Siemer
PDF
Elevating Your Application's Performance_ Observability Best Practices and Py...
PPTX
Performance on a budget
PDF
Using microsoft application insights to implement a build, measure, learn loop
PPTX
What is going on - Application diagnostics on Azure - TechDays Finland
PDF
stackconf 2022: Optimize Performance with Continuous Production Profiling
PPTX
1,2,3 … Testing : Is this thing on(line)? with Mike Martin
PDF
Continuous Performance Testing: The New Standard
PDF
Unveiling the Inner Workings_ Telemetry vs. Observability, Java Tracing, and ...
PDF
A Three-Tier Load Testing Program Saved Our Bacon
PDF
AZ - 400 olih orcle Implementing Microsoft DevOps (1).pdf
PDF
Azure Monitoring Overview
PPTX
Debugging and Interacting with Production Applications - MS Online Tech Forum
PDF
Mastering performance testing_ a comprehensive guide to optimizing applicatio...
PPTX
Training - What is Performance ?
PPTX
Azure development
PDF
Building Elastic And Resilient Cloud Applications Jeremi Bourgault
Enterprise-Ready FastAPI: Beyond the Basics
What is Performance Testing? - A Comprehensive Guide
Software Analytics: Data Analytics for Software Engineering
Load testing with Visual Studio and Azure - Andrew Siemer
Elevating Your Application's Performance_ Observability Best Practices and Py...
Performance on a budget
Using microsoft application insights to implement a build, measure, learn loop
What is going on - Application diagnostics on Azure - TechDays Finland
stackconf 2022: Optimize Performance with Continuous Production Profiling
1,2,3 … Testing : Is this thing on(line)? with Mike Martin
Continuous Performance Testing: The New Standard
Unveiling the Inner Workings_ Telemetry vs. Observability, Java Tracing, and ...
A Three-Tier Load Testing Program Saved Our Bacon
AZ - 400 olih orcle Implementing Microsoft DevOps (1).pdf
Azure Monitoring Overview
Debugging and Interacting with Production Applications - MS Online Tech Forum
Mastering performance testing_ a comprehensive guide to optimizing applicatio...
Training - What is Performance ?
Azure development
Building Elastic And Resilient Cloud Applications Jeremi Bourgault
Ad

More from Stackify (7)

PDF
Demystifying Distributed Tracing for Microservices in .NET.pdf
PDF
Optimizing Development_ Leveraging OOP Principles and Paired Programming for ...
PDF
Mastering Software Development_ Unveiling Abstraction, Try-Except in Python, ...
PDF
Mastering Modern Java_ Dependency Injection, Streams in Java 8, and Applicati...
PDF
APM vs. Observability_ Demystifying OpenTelemetry and the Role of Telemetry i...
PDF
Maximizing Performance_ Python Logging in AWS Lambda, Observability Stack, an...
PDF
How to Enhance Application Health_ Troubleshooting Lambda Functions with Obse...
Demystifying Distributed Tracing for Microservices in .NET.pdf
Optimizing Development_ Leveraging OOP Principles and Paired Programming for ...
Mastering Software Development_ Unveiling Abstraction, Try-Except in Python, ...
Mastering Modern Java_ Dependency Injection, Streams in Java 8, and Applicati...
APM vs. Observability_ Demystifying OpenTelemetry and the Role of Telemetry i...
Maximizing Performance_ Python Logging in AWS Lambda, Observability Stack, an...
How to Enhance Application Health_ Troubleshooting Lambda Functions with Obse...
Ad

Recently uploaded (20)

PDF
Architecting across the Boundaries of two Complex Domains - Healthcare & Tech...
PPTX
20250228 LYD VKU AI Blended-Learning.pptx
PDF
Per capita expenditure prediction using model stacking based on satellite ima...
PPTX
Spectroscopy.pptx food analysis technology
PPTX
sap open course for s4hana steps from ECC to s4
PDF
MIND Revenue Release Quarter 2 2025 Press Release
PDF
Diabetes mellitus diagnosis method based random forest with bat algorithm
PPTX
Understanding_Digital_Forensics_Presentation.pptx
PDF
Chapter 3 Spatial Domain Image Processing.pdf
PPTX
ACSFv1EN-58255 AWS Academy Cloud Security Foundations.pptx
PDF
KodekX | Application Modernization Development
PDF
Blue Purple Modern Animated Computer Science Presentation.pdf.pdf
PDF
Profit Center Accounting in SAP S/4HANA, S4F28 Col11
PDF
Mobile App Security Testing_ A Comprehensive Guide.pdf
PDF
Electronic commerce courselecture one. Pdf
DOCX
The AUB Centre for AI in Media Proposal.docx
PPTX
Programs and apps: productivity, graphics, security and other tools
PDF
Dropbox Q2 2025 Financial Results & Investor Presentation
PPT
Teaching material agriculture food technology
PDF
Review of recent advances in non-invasive hemoglobin estimation
Architecting across the Boundaries of two Complex Domains - Healthcare & Tech...
20250228 LYD VKU AI Blended-Learning.pptx
Per capita expenditure prediction using model stacking based on satellite ima...
Spectroscopy.pptx food analysis technology
sap open course for s4hana steps from ECC to s4
MIND Revenue Release Quarter 2 2025 Press Release
Diabetes mellitus diagnosis method based random forest with bat algorithm
Understanding_Digital_Forensics_Presentation.pptx
Chapter 3 Spatial Domain Image Processing.pdf
ACSFv1EN-58255 AWS Academy Cloud Security Foundations.pptx
KodekX | Application Modernization Development
Blue Purple Modern Animated Computer Science Presentation.pdf.pdf
Profit Center Accounting in SAP S/4HANA, S4F28 Col11
Mobile App Security Testing_ A Comprehensive Guide.pdf
Electronic commerce courselecture one. Pdf
The AUB Centre for AI in Media Proposal.docx
Programs and apps: productivity, graphics, security and other tools
Dropbox Q2 2025 Financial Results & Investor Presentation
Teaching material agriculture food technology
Review of recent advances in non-invasive hemoglobin estimation

Leveraging Python Telemetry, Azure Application Logging, and Performance Testing in Production for Enhanced Application Performance.pdf

  • 1. Leveraging Python Telemetry, Azure Application Logging, and Performance Testing in Production for Enhanced Application Performance In today's fast-paced digital landscape, ensuring the reliability, performance, and observability of applications is crucial. This involves leveraging tools and techniques such as Python telemetry, Azure application logging, and performance testing in production. These practices help in monitoring application health, diagnosing issues, and optimizing performance, ultimately leading to a better user experience and more robust applications. In this article, we'll explore these concepts in detail and understand how they can be effectively implemented. Understanding Python Telemetry Python telemetry refers to the collection, processing, and analysis of data from Python applications to monitor their performance and behavior. This data includes metrics, logs, traces, and other relevant information that provides insights into the application's internal state. Telemetry is essential for identifying performance bottlenecks, detecting anomalies, and ensuring the overall health of an application. Implementing Python Telemetry To implement telemetry in Python applications, developers can use various libraries and frameworks. One popular choice is the OpenTelemetry library, which provides a standard way to collect telemetry data. Here’s a brief overview of how to set up OpenTelemetry in a Python application: Install OpenTelemetry: bash pip install opentelemetry-api pip install opentelemetry-sdk pip install opentelemetry-exporter-otlp 1. Initialize the Tracer: python from opentelemetry import trace from opentelemetry.sdk.trace import TracerProvider from opentelemetry.sdk.trace.export import BatchSpanProcessor from opentelemetry.exporter.otlp.trace_exporter import OTLPSpanExporter
  • 2. trace.set_tracer_provider(TracerProvider()) tracer = trace.get_tracer(__name__) span_processor = BatchSpanProcessor(OTLPSpanExporter()) trace.get_tracer_provider().add_span_processor(span_processor) 2. Instrument Code: python with tracer.start_as_current_span("example-span"): print("Hello, Telemetry!") By integrating such telemetry tools, developers can gain comprehensive insights into their Python applications, enabling proactive performance management and quick issue resolution. Utilizing Azure Application Logging Azure Application Logging is a powerful feature of Microsoft Azure that allows developers to collect and analyze logs from their applications running on Azure. These logs are invaluable for diagnosing issues, monitoring application health, and ensuring compliance with operational requirements. Setting Up Azure Application Logging To set up application logging in Azure, follow these steps: 1. Enable Application Insights: ○ Navigate to your Azure portal. ○ Go to your web application and select "Application Insights." ○ Enable Application Insights if it’s not already enabled. Install Application Insights SDK: bash pip install opencensus-ext-azure 2. Configure Logging: python from opencensus.ext.azure.log_exporter import AzureLogHandler import logging
  • 3. logger = logging.getLogger(__name__) logger.addHandler(AzureLogHandler( connection_string='InstrumentationKey=your_instrumentation_key')) logger.warning('This is a warning message.') 3. View Logs in Azure Portal: ○ Once the logging is configured, you can view and analyze the logs in the Azure portal under Application Insights. Azure Application Logging provides rich insights into application performance and behavior, helping developers identify and fix issues quickly and efficiently. Performance Testing in Production Performance testing in production is a practice where applications are tested for performance issues in a live environment. This approach helps in identifying real-world performance bottlenecks and ensuring that the application can handle actual user load. Best Practices for Performance Testing in Production 1. Use Realistic Load: ○ Simulate realistic user traffic to understand how the application performs under actual load conditions. 2. Monitor Key Metrics: ○ Track important performance metrics such as response time, throughput, error rates, and resource utilization. 3. Automate Testing: ○ Use automation tools to regularly perform performance tests. Tools like JMeter, Locust, and Gatling can be used for this purpose. 4. Analyze Results: ○ Analyze the test results to identify performance bottlenecks and areas for improvement. 5. Implement Continuous Testing: ○ Integrate performance testing into the CI/CD pipeline to ensure that performance is continuously monitored and optimized. Example: Performance Testing with Locust Locust is an open-source load testing tool that allows developers to define user behavior in Python code. Here’s a simple example of how to use Locust for performance testing: Install Locust: bash
  • 4. pip install locust 1. Define User Behavior: python Copy code from locust import HttpUser, task, between class WebsiteUser(HttpUser): wait_time = between(1, 5) @task def index(self): self.client.get("/") @task def about(self): self.client.get("/about") 2. Run Locust: bash locust -f locustfile.py 3. Access Locust Web Interface: ○ Open a web browser and navigate to http://localhost:8089 to start the test and monitor the results. Performance testing in production ensures that applications are resilient and performant under real-world conditions, leading to a better user experience and reduced downtime. Conclusion Incorporating Python telemetry, Azure application logging, and performance testing in production is essential for modern software development. These practices provide deep insights into application performance, enable proactive issue resolution, and ensure that applications can handle real-world load efficiently. By leveraging these tools and techniques, developers can build robust, high-performing applications that meet user expectations and drive business success.
  • 5. By following the guidelines and examples provided in this article, developers can effectively implement these practices in their projects, leading to improved application performance and reliability.