


![DTrace is the perfect tool
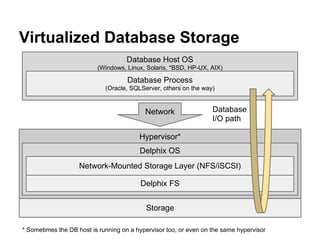
● To split results on a variable, collect the
variable and use it as an additional key in
your aggregations.
● To narrow down a variable, add a condition.
// Pseudocode alert!
0. probe {@latency = quantize(start - timestamp)}
1. probe {@latency[ip] = quantize(start - timestamp)}
2. probe /ip == "187..."/ {
@latency[operation] = quantize(start - timestamp);
}
3. probe /ip == "187..." && operation == "write"/ {
@latency[synchronous] = quantize(start - timestamp);
}](https://image.slidesharecdn.com/lspe-buildingamonitoringframeworkusingdtraceandmongodb-130530111032-phpapp01/85/lspe-Building-a-Monitoring-Framework-using-DTrace-and-MongoDB-10-320.jpg)


#lspe Building a Monitoring Framework using DTrace and MongoDB
- 1. Building a Monitoring Framework Using DTrace and MongoDB Dan Kimmel Software Engineer, Delphix dan.kimmel@delphix.com
- 2. Background ● Building a performance monitoring framework on illumos using DTrace ● It's monitoring our data virtualization engine ○ That means "database storage virtualization and rigorous administration automation" for those who didn't have time to study up on our marketing lingo ● Our users are mostly DBAs ● The monitoring framework itself is not released yet
- 3. ● DBAs have one performance metric they care about for their database storage ○ I/O latency, because it translates to database I/O latency, which translates to end-user happiness ● But to make the performance data actionable, they usually need more than that single measurement ○ Luckily, DTrace always has more data What to collect?
- 4. Virtualized Database Storage* Database Process (Oracle, SQLServer, others on the way) Storage Appliance (the Delphix Engine) * as most people imagine it Database I/O path Network
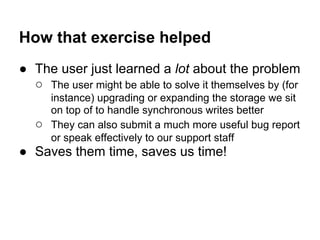
- 5. Hypervisor* Delphix OS Database Host OS (Windows, Linux, Solaris, *BSD, HP-UX, AIX) Virtualized Database Storage Database Process (Oracle, SQLServer, others on the way) Network-Mounted Storage Layer (NFS/iSCSI) Network Delphix FS Storage Database I/O path * Sometimes the DB host is running on a hypervisor too, or even on the same hypervisor
- 6. Hypervisor Delphix OS Database Host OS (Windows, Linux, Solaris, *BSD, HP-UX, AIX) Latency can come from anywhere Database Process (Oracle, SQLServer, others on the way) Network-Mounted Storage Layer (NFS/iSCSI) Network Delphix FS Storage Out of memory? Out of CPU? Out of bandwidth? Out of memory? Out of CPU? Out of memory? Out of CPU? Out of IOPS? Out of bandwidth? NFS client latency Network latency Queuing latency FS latency Device latency Database I/O path Bottlenecks on the left Sources of latency on the right
- 7. Investigation Requirements Want users to be able to dig deeper during a performance investigation. ● Show many different sources of latency and show many possible bottlenecks ○ i.e. collect data from all levels of the I/O stack ○ This is something that we're still working on, and sadly, not all levels of the stack have DTrace ● Allow users to narrow down the cause within one layer ○ Concepts were inspired by other DTrace-based analytics tools from Sun and Joyent
- 8. Narrowing down the cause After looking at a high level view of the layers, a user sees NFS server latency has some slow outliers. 1. NFS latency by client IP address ○ The client at 187.124.26.12 looks slowest 2. NFS latency for 187... by operation ○ Writes look like the slow operation 3. NFS write latency for 187... by synchronous ○ Synchronous writes are slower than normal
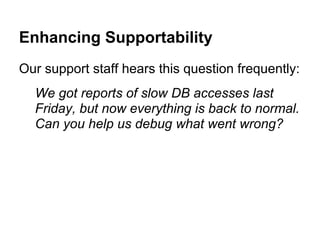
- 9. How that exercise helped ● The user just learned a lot about the problem ○ The user might be able to solve it themselves by (for instance) upgrading or expanding the storage we sit on top of to handle synchronous writes better ○ They can also submit a much more useful bug report or speak effectively to our support staff ● Saves them time, saves us time!
- 10. DTrace is the perfect tool ● To split results on a variable, collect the variable and use it as an additional key in your aggregations. ● To narrow down a variable, add a condition. // Pseudocode alert! 0. probe {@latency = quantize(start - timestamp)} 1. probe {@latency[ip] = quantize(start - timestamp)} 2. probe /ip == "187..."/ { @latency[operation] = quantize(start - timestamp); } 3. probe /ip == "187..." && operation == "write"/ { @latency[synchronous] = quantize(start - timestamp); }
- 11. How we built "narrowing down" ● Templated D scripts for collecting data internal to Delphix OS ● Allow the user to specify constraints on variables in each template ○ Translate these into DTrace conditions ● Allow the user to specify which variables they want to display ● Fill out a template and run the resulting script
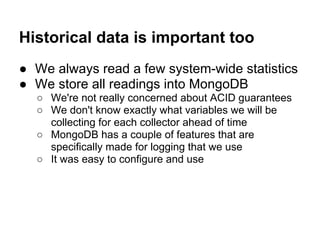
- 12. Enhancing Supportability Our support staff hears this question frequently: We got reports of slow DB accesses last Friday, but now everything is back to normal. Can you help us debug what went wrong?
- 13. Historical data is important too ● We always read a few system-wide statistics ● We store all readings into MongoDB ○ We're not really concerned about ACID guarantees ○ We don't know exactly what variables we will be collecting for each collector ahead of time ○ MongoDB has a couple of features that are specifically made for logging that we use ○ It was easy to configure and use
- 14. Storing (lots of) historical data The collected data piles up quickly! ● Don't collect data too frequently ● Compress readings into larger and larger time intervals as the readings age ○ We implemented this in the caller, but could have used MongoDB's MapReduce as well ● Eventually, delete them (after ~2 weeks) ○ We used MongoDB's "time-to-live indexes" to handle this automatically; they work nicely
- 15. Dealing with the Edge Cases ● If an investigation is ongoing, performance data could be compressed or deleted if the investigating takes too long ● Users can prevent data from being compressed or deleted by explicitly saving it
- 16. Summary ● We used DTrace to allow customers to dig deeper on performance issues ○ Customers will love it* ○ Our support staff will love it* * at least, that's the hope!
- 17. Thanks!