


![22 perforce.com
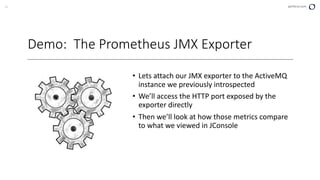
• In [ACTIVEMQ_ROOT]/bin/activemq, we will update the ACTIVEMQ_OPTS variable to include a refence to our JMX
exporter and config files, which we have copied into our base ActiveMQ directory
• The update will be as follows:
"$ACTIVEMQ_OPTS_MEMORY -javaagent:$ACTIVEMQ_BASE/jmx_prometheus_javaagent-0.12.0.jar=8080:/
$ACTIVEMQ_BASE/conf/jmx-export-config.yml -Djava.util.logging.config.file=logging.properties -Djava.security.
auth.login.config=$ACTIVEMQ_CONF/login.config”
• Upon restarting the broker, JMX metrics will be properly exposed
Demo Solution](https://image.slidesharecdn.com/monitoringjavaapplicationswithprometheusandgrafana-v1-190822181717/85/Monitoring-Java-Applications-with-Prometheus-and-Grafana-22-320.jpg)


![42 perforce.com
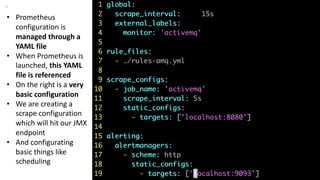
Prometheus configuration global:
scrape_interval: 15s
external_labels:
monitor: 'activemq'
rule_files:
- ./rules-amq.yml
scrape_configs:
- job_name: 'activemq'
scrape_interval: 5s
static_configs:
- targets: ['localhost:8080']
alerting:
alertmanagers:
- scheme: http
static_configs:
- targets: ['localhost:9093']
• Now all that is left is to
configure Prometheus to push
alert events into AlertManager
• We’ll update our prom-
amq.yml configuration file from
earlier to integrate with our
newly configured AlertManager
instance
• Upon restarting Prometheus,
we should see our alerts in the
Prometheus dashboard](https://image.slidesharecdn.com/monitoringjavaapplicationswithprometheusandgrafana-v1-190822181717/85/Monitoring-Java-Applications-with-Prometheus-and-Grafana-42-320.jpg)


Monitoring Java Applications with Prometheus and Grafana
- 1. Monitoring Java Applications with Prometheus and Grafana JUSTIN REOCK – CHIEF ARCHITECT – OPENLOGIC BY PERFORCE
- 2. Who is this nerd?
- 3. 3 perforce.com Justin Reock Chief Architect OpenLogic by Perforce Presenter Justin has over 20 years’ experience working in various software roles and is an outspoken free software evangelist, delivering enterprise solutions and community education on databases, integration work, architecture, and technical leadership. He is currently the Chief Architect at OpenLogic by Perforce.
- 5. 5 perforce.com Companion Blog Series • https://www.openlogic.com/blog/mo nitoring-java-applications- prometheus-and-grafana-part-1 • Three part series detailing the same steps and demos we will visit in this session
- 6. 6 perforce.com Demo Files • https://github.com/jre ock/monitoring-java- apps-prometheus- grafana • Just the configuration files and JMX exporter, basically everything that we changed from the stock community distribution
- 7. 7 perforce.com What are we going to solve today? 1 2 3 4 5 Export JMX metrics from a Java application to Prometheus Import those metrics into Prometheus Visualize the metrics in Grafana Set up Prometheus’s AlertManager Create Thresholds and Alerts in AlertManager
- 8. Why are we doing this?
- 9. 9 perforce.com The case for open source enterprise monitoring • We live in an increasingly digitally transformed world • Supporting this new landscape are patterns and technologies built to handle problems at a scale unimaginable just a few years ago • Microservices, meshes, highly distributed compute environments, etc, have created a need for a new kind of monitoring • The sheer amount of metric and diagnostic data generated by modern systems has already outpaced more legacy monitoring solutions • Open source monitoring projects such as Prometheus have arisen to approach the idea of enterprise monitoring in a way that makes sense for modern scale • Successful enterprises who wish to take advantage of these emerging patterns must adopt modern strategies for observing and maintaining complex and federated systems, and a healthy enterprise monitoring strategy is one of those
- 11. 11 perforce.com Prometheus, bringer of the … er … metrics! • Prometheus is, at core, what a modern distributed metrics gathering platform should be – a timeseries database • Originally conceived at SoundCloud in 2012, and soon after picked up by communities like Docker • Prometheus ultimately became the second incubated project by CNCF, after Kubernetes, in 2016 • It has become the de-facto metrics gathering platform for K8s • But, it has evolved into a fully functional enterprise monitoring solution supporting many frameworks and platforms • Today, we will focus specifically on Prometheus’s ability to gather Java JMX metrics from Java applications
- 12. 12 perforce.com Prometheus is very active… * https://www.openhub.net/p/prometheus-tsdb
- 13. 13 perforce.com The big picture…
- 14. 14 perforce.com A few words on JMX • In the previous picture, you see that Prometheus is fed metrics from our Java app using the Prometheus JMX Exporter • JMX, or the Java Management eXtensions, is a Java-native specification that allows developers to expose application metrics in a standard, object-oriented way • A full overview can be read here: https://docs.oracle.com/javase/tutorial/jmx/overview/index.html • In essence, developers can create special Java objects called mBeans, which are arranged into a standard hierarchy and exposed to systems via a special TCP port provided by the JVM • Users can make use of JMX Clients to connect to this port and introspect these objects, for the purpose of monitoring or observing application behavior • Well-written Java applications will expose tons of metrics to ensure that as much transparency is possible when it comes to application health • Every mainstream enterprise-class Java application will expose these metrics: Kafka, ActiveMQ, Camel, Tomcat, Wildfly, etc..
- 15. 15 perforce.com
- 16. 16 perforce.com Demo: Viewing mBeans in JConsole • We’ll fire up an instance of ActiveMQ, an Apache message oriented middleware solution that is written in Java • ActiveMQ, like any good enterprise-class Java application, exposes a lot of metrics using JMX • We’ll connect to an instance of it and view those metrics in JConsole
- 17. 17 perforce.com The Prometheus JMX Exporter • Within the Prometheus ecosystem, there are a number of “exporters” that will expose metrics about a piece of software in a way that can be scraped by Prometheus • In our case, we’ll be using a generic exporter that exposes all Java JMX mBeans over a web port, which Prometheus will then turn around and scrape • And, it’s very easy to configure using Java’s native JavaAgent functionality • This function allows a custom agent process to run directly within the JVM, and exposes the agent via an HTTP port • So all we need to do is obtain the Prometheus agent .jar file, and tell our Java process to start using it as an agent!
- 18. 18 perforce.com Revisiting the big picture…
- 19. 19 perforce.com • So, we just need to retrieve the .jar file for the exporter from the Git repository • https://github.com/prometheus/jmx_exporter • Then we just follow the instructions listed on the Git readme – reference the .jar file and provide a configuration! Running the Prometheus JMX Exporter
- 20. 20 perforce.com • We won’t get too in-depth with the contents of this file • We’ll start with a very simple configuration • Note that this file can be used to strictly control the mBeans that are exposed by the exporter, among other tweaks and bits of functionality • The config file is well-documented on the project’s GitHub – ours will be very basic: The Prometheus JMX Exporter Configuration File --- startDelaySeconds: 0 ssl: false lowercaseOutputName: false lowercaseOutputLabelNames: false
- 21. 21 perforce.com Demo: The Prometheus JMX Exporter • Lets attach our JMX exporter to the ActiveMQ instance we previously introspected • We’ll access the HTTP port exposed by the exporter directly • Then we’ll look at how those metrics compare to what we viewed in JConsole
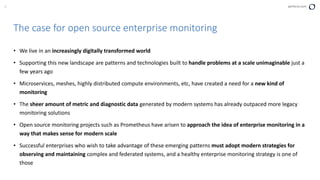
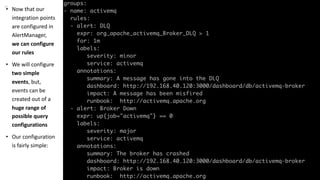
- 22. 22 perforce.com • In [ACTIVEMQ_ROOT]/bin/activemq, we will update the ACTIVEMQ_OPTS variable to include a refence to our JMX exporter and config files, which we have copied into our base ActiveMQ directory • The update will be as follows: "$ACTIVEMQ_OPTS_MEMORY -javaagent:$ACTIVEMQ_BASE/jmx_prometheus_javaagent-0.12.0.jar=8080:/ $ACTIVEMQ_BASE/conf/jmx-export-config.yml -Djava.util.logging.config.file=logging.properties -Djava.security. auth.login.config=$ACTIVEMQ_CONF/login.config” • Upon restarting the broker, JMX metrics will be properly exposed Demo Solution
- 23. 23 perforce.com Consuming metrics in Prometheus • Great! We now have an instance of ActiveMQ that is exposing JMX metrics in a way that Prometheus can consume • So now, we just need to configure Prometheus to start scraping and storing these metrics • To do so, we’ll first need to obtain Prometheus, which we can do from the project site here: • https://prometheus.io/download/ • Just extract it on your Unix-like system of choice (or Windows if you absolutely have to) • We’ll then just create a Prometheus configuration file, in this case called prom-amq.yml, and direct Prometheus to start using it
- 24. 24 perforce.com • Prometheus configuration is managed through a YAML file • When Prometheus is launched, this YAML file is referenced • On the right is a very basic configuration • We are creating a scrape configuration which will hit our JMX endpoint • And configurating basic things like scheduling
- 25. 25 perforce.com Demo: Consuming JMX Metrics in Prometheus • Download and configure an instance of Prometheus to consume metrics from our ActiveMQ instance • Start Prometheus and view some of the captured metrics • Create some messages in ActiveMQ and watch as the metrics update in Prometheus
- 26. 26 perforce.com • So, we’ve seen that Prometheus is a time series database ideal for capturing a large amount of simple metric data • It is extensible through its Push Gateway as well as its myriad exporters • We explored the Prometheus JMX exporter, and showed how to move data into Prometheus using it • But, Prometheus’s visualization capabilities are limited • There isn’t much in the way of dashboarding • And we have only very limited graphing capabilities • So lets move on and talk about Grafana, which will allow us to better manage and visualize the metrics we are capturing in Prometheus Prometheus Wrap-up
- 27. Gettin’ Pretty with Grafana
- 28. 28 perforce.com The Grafana Dashboarding Project • Originally started as a project at Orbitz by Torkel Ödegaard who is still the chief maintainer: • https://github.com/tork elo • Has 915 contributors as of August of 2019, and can be considered a highly active project https://www.openhub.net/p/grafana
- 29. 29 perforce.com Another big picture view…
- 30. 30 perforce.com Integrating Grafana with Prometheus • Integrating with Prometheus is nearly effortless • Prometheus is a natively supported data store for Grafana • Just download and run Grafana, and attach it to a running Prometheus instance via a GUI!
- 31. 31 perforce.com Demo: Dashboarding with Grafana • It’s easiest to just step through some of Grafana’s features together rather than explain them • After all, Grafana is a visualization tool, so a visual approach is best! • We will attach Grafana to our Prometheus instance • And then create a dashboard for ActiveMQ together
- 32. 32 perforce.com • At this point, we almost have a full enterprise monitoring solution! • We are capturing metrics from our application, and we are visualizing those metrics in a comfortable way • Grafana allows us to easily attach to our Prometheus instance and start putting together attractive and useful dashboards which we can share and collaborate on • But, no enterprise monitoring solution is complete without an alerting mechanism • After all, what good is capturing all those metrics if they can’t proactively alert us when things go wrong? • In this final section, we’ll introduce the Prometheus AlertManager and show how it can be used to provide proactive alerting to your teams in the event of unexpected behavior Grafana Wrap-Up
- 33. A tree falls in the middle of the woods…
- 34. 34 perforce.com • We’ve seen that well written Java applications will provide a lot of information via JMX which can be captured by a monitoring platform like Prometheus • This allows us quite a bit of power and proactivity when we have properly configured our monitoring solution to recognize and react to certain conditions • For instance, with Java, we might want to know when our heap memory has passed a certain threshold • Or maybe we want to be made aware of aberrant garbage collection behavior • And of course there are more obvious scenarios, such as when our applications simply crash • All of these conditions can be trapped within Prometheus and cascaded to alerting systems like PagerDuty and Slack via the AlertManager gateway The final piece, alerting!
- 35. 35 perforce.com Introducing AlertManager • AlertManager is a standalone solution that runs alongside Prometheus • When alert conditions are recognized by Prometheus, alert events are pushed into AlertManager • AlertManager then cascades those alerts down to third-party services • Lots of different conditions can be recognized • And alert content can be routed to various systems based on differing conditions, as we’ll see in a moment • Standard things such as muting and/or inhibiting alerts, downtime windows, etc, can all be configured as well
- 36. 36 perforce.com Big Picture, final look…
- 37. 37 perforce.com • In general, getting AlertManager going is a matter of: 1. Standing up an instance of AlertManager 2. Configuring Prometheus to use AlertManager 3. Creating Alert Rules in Prometheus • Start by obtaining AlertManager from the Prometheus download page, extracting it, and creating a new config: • https://prometheus.io/download/ Incorporating AlertManager
- 38. 38 perforce.com • As discussed, AlertManager integrates with a number of 3rd-party notification services • We’ll edit YAML configuration files to configure these integration endpoints • In this session, we’ll allow AlertManager to send notifications into Slack when certain conditions are met • We’ll get into creating the conditions and rules momentarily, but for now let’s integrate with the Slack module for Prometheus • https://prometheus.io/docs/alerting/configuration/#slack_config • A common pattern in Slack is to use a Webhook for integration, which is how this will work • Information on creating a WebHook for Slack can be found here: https://api.slack.com/incoming-webhooks • Once we have it, we just need to configure it within a new configuration file, which we’ll call demo-config.yml Slack Integration
- 39. 39 perforce.com AlertManager Rules • AlertManager rules are conceptualized as routes, giving you the ability to write sophisticated sets of rules to determine where notifications should end up • A default receiver should be configured for every notification, and then additional services can be configured through child routes which will match certain conditions A full configuration reference is available here: https://prometheus.io/docs/alerting/configuration/
- 40. 40 perforce.com • Our config YAML file will be responsible for setting up routing rules that will determine how events are triaged • As mentioned before, all events should start with a default receiver, called default-receiver, which will be the starting point for any route • From there, any number of sub-receivers can be configured • In this case, we’ve configured one called ‘slack’ which will be invoked when the ”service” tag of the event that has been triggered matches “activemq” • We’ll look at configuring the service labels in a moment • Once the routes have been configured, we just need to configure our receivers • Note that our Slack receiver config will contain our WebHook into Slack
- 41. 41 perforce.com • Now that our integration points are configured in AlertManager, we can configure our rules • We will configure two simple events, but, events can be created out of a huge range of possible query configurations • Our configuration is fairly simple:
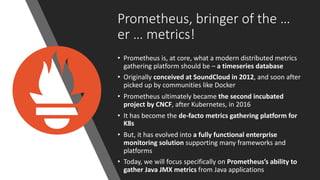
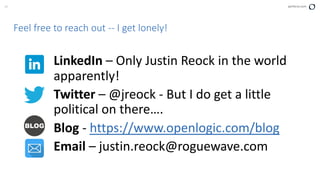
- 42. 42 perforce.com Prometheus configuration global: scrape_interval: 15s external_labels: monitor: 'activemq' rule_files: - ./rules-amq.yml scrape_configs: - job_name: 'activemq' scrape_interval: 5s static_configs: - targets: ['localhost:8080'] alerting: alertmanagers: - scheme: http static_configs: - targets: ['localhost:9093'] • Now all that is left is to configure Prometheus to push alert events into AlertManager • We’ll update our prom- amq.yml configuration file from earlier to integrate with our newly configured AlertManager instance • Upon restarting Prometheus, we should see our alerts in the Prometheus dashboard
- 43. 43 perforce.com
- 44. 44 perforce.com Demo: Alerts in AlertManager • Let’s configure AlertManager to react by sending a Slack notification when conditions are met within ActiveMQ • We’ll trigger alerts when messages flow to the dead letter queue, and when the broker goes down altogether • AlertManager will process the alerts • And we’ll watch them flow into Slack
- 46. 46 perforce.com • Legacy enterprise monitoring solutions have served us well in the past • But we’re simply creating too much data these days for many of these solutions to adequately keep up • We need a platform that can handle large amounts of data, integrate easily with many disparate systems, and provide useful visibility and alerting • Working in concert, Prometheus, Grafana, and AlertManager can provide a robust enterprise monitoring platform • I’d encourage you to learn more about how rules can be configured in AlertManager, including configuring things like alert muting and inhibition • And we’ve barely scraped the surface of the amount of plugins, queries, widgets, etc, that are available to us with Grafana! • But at this point you should have a clear understanding of getting a basic end-to-end monitor with alerts set up using these technologies, and can continue to learn! Final thoughts
- 47. 47 perforce.com Feel free to reach out -- I get lonely! LinkedIn – Only Justin Reock in the world apparently! Twitter – @jreock - But I do get a little political on there…. Blog - https://www.openlogic.com/blog Email – justin.reock@roguewave.com
- 48. Questions?