SlideShare a Scribd company logo
Multi-State
Collaborative To
Advance Quality
Student Learning
Proudly sponsored by:
2
Today’s Moderator & Speakers
Catherine Wehlburg Julie Carnahan Terrel Rhodes
Proudly brought to you by
Purpose of Today
Preview “30,000 foot” initial results from the Multi-State
Collaborative Demonstration Year using the LEAP Value Rubrics
to inform teaching and learning.
Provide examples of detailed results to be released with full
report in January 2017
3
These slides summarize results from the
demonstration study involving 48 institutions in twelve
states using common rubrics to assess more than 8,000
student work products. The sample of student work in
the pilot represented the near-graduation students
across the participating institutions in the twelve states
only; therefore, the results are not generalizable for all
students in each participating state or nationwide.
4
VALUE Rubric Approach Assumptions
Learning is a process that occurs over time
Student work is best representation of motivated learning
Focus on what student does in key learning outcomes
Faculty & educator expert judgment
Results are useful & actionable for learning (& accountability)
5
Minnesota
Collaborative
Great Lakes
Colleges
Association
Multi-State
Collaborative
The current VALUE initiative
Purpose
Sea change in
assessment
Reliability
Validity
Local value
Policy debate = learning
The Multi-State Collaborative
• States committed to the importance of learning
outcomes and quality of a degree
• Mindful of students contribution to the states in
which they live
• Respectful that teaching & learning is
prerogative of faculty
• Focus is on improvement of student learning not
ranking states or institutions
7
The MSC Challenge: Scaling Direct Assessment
8,308
Demonstration Year: Taking the vision
to scale from 9 to 12 states
Steering Committee
Point person from each
state and reps from
SHEEO & AAC&U
Institution Point
Persons
From each campus in
each state
p
OR
UT
TX
HI
MN
MO
IN
KY
ME
MA
RI
CT
Goals
Root assessment of learning
in authentic work & the
expertise of faculty
Establish benchmarks for
essential learning outcomes
Develop transparency of
shared standards of learning
to assist with transfer
OR
UT
TX
HI
MN
MO
IN
KY
ME
MA
RI
CT
Demonstration Year: Taking the vision
to scale from 9 to 12 states
Multi-State Collaborative To
Advance Learning Outcomes
Assessment
Preview of Demonstration Year (2016) Results
MSC Demonstration Year
by the Numbers
48 public
institutions
uploaded
artifacts
By sector
29 four-year,
including 8
research
institutions
19 two-year
OR
UT
MN
MO
IN
KY
MA
RI
CT
OR
UT
TX
MN
MO
IN
KY
ME
HI
These results are not generalizable across participating states or the nation in any way. Please use appropriately.
MSC Demonstration Year
by the Numbers
8,308
assignments
were submitted*
pieces of
student work
were
submitted
1886
These results are not generalizable across participating states or the nation in any way. Please use appropriately.
MSC Demonstration Year Profile of VALUE Scorers
940
632
978
60
2,419
1,008
2,271
- 1,000 2,000 3,000 4,000
Civic Engagement
Critical Thinking
Quantitative Literacy
Written Communication
MSC 2-Year MSC 4-Year
Artifacts Scored Per Outcome
These results are not generalizable across participating states or the nation in any way. Please use appropriately.
Profile of Scorers by Discipline
and/or Institutional Role
68
41
32
23
10
Arts and Humanities
Natural and Applied/Formal Sciences
Professions
Social Sciences
Administrative
MSC Demonstration Year Profile of VALUE Scorers
These results are not generalizable across participating states or the nation in any way. Please use appropriately.
For full text of AAC&U VALUE Rubric for Critical Thinking, see: https://www.aacu.org/value/rubrics/critical-thinking.
Critical Thinking Rubric Dimensions
Capstone
4
Milestones
3 2
Benchmark
1
Explanation of issues Issue/problem to be considered
critically is stated clearly and
described comprehensively,
delivering all relevant information
necessary for full understanding.
Issue/problem to be considered
critically is stated, described, and
clarified so that understanding is
not seriously impeded by omissions.
Issue/problem to be considered
critically is stated but description
leaves some terms undefined,
ambiguities unexplored, boundaries
undetermined, and/or backgrounds
unknown.
Issue/problem to be considered
critically is stated without
clarification or description.
Evidence
Selecting and using information to
investigate a point of view or
conclusion
Information is taken from source(s)
with enough
interpretation/evaluation to
develop a comprehensive analysis
or synthesis.
Viewpoints of experts are
questioned thoroughly.
Information is taken from source(s)
with enough
interpretation/evaluation to
develop a coherent analysis or
synthesis.
Viewpoints of experts are subject to
questioning.
Information is taken from source(s)
with some
interpretation/evaluation, but not
enough to develop a coherent
analysis or synthesis.
Viewpoints of experts are taken as
mostly fact, with little questioning.
Information is taken from source(s)
without any
interpretation/evaluation.
Viewpoints of experts are taken as
fact, without question.
Influence of context and
assumptions
Thoroughly (systematically and
methodically) analyzes own and
others' assumptions and carefully
evaluates the relevance of contexts
when presenting a position.
Identifies own and others'
assumptions and several relevant
contexts when presenting a
position.
Questions some assumptions.
Identifies several relevant contexts
when presenting a position. May be
more aware of others' assumptions
than one's own (or vice versa).
Shows an emerging awareness of
present assumptions (sometimes
labels assertions as assumptions).
Begins to identify some contexts
when presenting a position.
Student's position (perspective,
thesis/hypothesis)
Specific position (perspective,
thesis/hypothesis) is imaginative,
taking into account the complexities
of an issue.
Limits of position (perspective,
thesis/hypothesis) are
acknowledged.
Others' points of view are
synthesized within position
(perspective, thesis/hypothesis).
Specific position (perspective,
thesis/hypothesis) takes into
account the complexities of an
issue.
Others' points of view are
acknowledged within position
(perspective, thesis/hypothesis).
Specific position (perspective,
thesis/hypothesis) acknowledges
different sides of an issue.
Specific position (perspective,
thesis/hypothesis) is stated, but is
simplistic and obvious.
Conclusions and related outcomes
(implications and consequences)
Conclusions and related outcomes
(consequences and implications) are
logical and reflect student’s
informed evaluation and ability to
place evidence and perspectives
discussed in priority order.
Conclusion is logically tied to a
range of information, including
opposing viewpoints; related
outcomes (consequences and
implications) are identified clearly.
Conclusion is logically tied to
information (because information is
chosen to fit the desired
conclusion); some related outcomes
(consequences and implications) are
identified clearly.
Conclusion is inconsistently tied to
some of the information discussed;
related outcomes (consequences
and implications) are oversimplified.
4 3 2 1 0
0
5
10
15
20
25
30
35
40
45
50
Explanation of issues Evidence Context / Assumptions Student's Position Conclusions / Outcomes
Preview of MSC Demonstration Year (2016) Results
Critical Thinking Dimension
2-Year Institutional Score Distribution
% of student work products scored 4-0 by faculty scorers
These results are not generalizable across participating states or the nation in any way. Please use appropriately.
For full text of AAC&U VALUE Rubric for Quantitative Literacy, see: https://www.aacu.org/value/rubrics/quantitative-literacy
Quantitative Literacy Rubric Dimensions
Capstone
4
Milestones
3 2
Benchmark
1
Interpretation
Ability to explain information presented
in mathematical forms (e.g., equations,
graphs, diagrams, tables, words)
Provides accurate explanations of
information presented in mathematical
forms. Makes appropriate inferences
based on that information. For example,
accurately explains the trend data shown
in a graph and makes reasonable
predictions regarding what the data
suggest about future events.
Provides accurate explanations of
information presented in mathematical
forms. For instance, accurately explains
the trend data shown in a graph.
Provides somewhat accurate
explanations of information presented in
mathematical forms, but occasionally
makes minor errors related to
computations or units. For instance,
accurately explains trend data shown in
a graph, but may miscalculate the slope
of the trend line.
Attempts to explain information
presented in mathematical forms, but
draws incorrect conclusions about what
the information means. For example,
attempts to explain the trend data
shown in a graph, but will frequently
misinterpret the nature of that trend,
perhaps by confusing positive and
negative trends.
Representation
Ability to convert relevant information
into various mathematical forms (e.g.,
equations, graphs, diagrams, tables,
words)
Skillfully converts relevant information
into an insightful mathematical portrayal
in a way that contributes to a further or
deeper understanding.
Competently converts relevant
information into an appropriate and
desired mathematical portrayal.
Completes conversion of information but
resulting mathematical portrayal is only
partially appropriate or accurate.
Completes conversion of information but
resulting mathematical portrayal is
inappropriate or inaccurate.
Calculation Calculations attempted are essentially all
successful and sufficiently
comprehensive to solve the problem.
Calculations are also presented elegantly
(clearly, concisely, etc.)
Calculations attempted are essentially all
successful and sufficiently
comprehensive to solve the problem.
Calculations attempted are either
unsuccessful or
represent only a portion of the
calculations required to comprehensively
solve the problem. 
Calculations are attempted but are both
unsuccessful and are not
comprehensive.
Application / Analysis
Ability to make judgments and draw
appropriate conclusions based on the
quantitative analysis of data, while
recognizing the limits of this analysis
Uses the quantitative analysis of data as
the basis for deep and thoughtful
judgments, drawing insightful, carefully
qualified conclusions from this work.
Uses the quantitative analysis of data as
the basis for competent judgments,
drawing reasonable and appropriately
qualified conclusions from this work.
Uses the quantitative analysis of data as
the basis for workmanlike (without
inspiration or nuance, ordinary)
judgments, drawing plausible
conclusions from this work.
Uses the quantitative analysis of data as
the basis for tentative, basic judgments,
although is hesitant or uncertain about
drawing conclusions from this work.
Assumptions
Ability to make and evaluate important
assumptions in estimation, modeling,
and data analysis
Explicitly describes assumptions and
provides compelling rationale for why
each assumption is appropriate. Shows
awareness that confidence in final
conclusions is limited by the accuracy of
the assumptions.
Explicitly describes assumptions and
provides compelling rationale for why
assumptions are appropriate.
Explicitly describes assumptions. Attempts to describe assumptions.
Communication
Expressing quantitative evidence in
support of the argument or purpose of
the work (in terms of what evidence is
used and how it is formatted, presented,
and contextualized)
Uses quantitative information in
connection with the argument or
purpose of the work, presents it in an
effective format, and explicates it with
consistently high quality.
Uses quantitative information in
connection with the argument or
purpose of the work, though data may
be presented in a less than completely
effective format or some parts of the
explication may be uneven.
Uses quantitative information, but does
not effectively connect it to the
argument or purpose of the work.
Presents an argument for which
quantitative evidence is pertinent, but
does not provide adequate explicit
numerical support. (May use quasi-
quantitative words such as "many,"
"few," "increasing," "small," and the like
in place of actual quantities.)
4 3 2 1 0
0
5
10
15
20
25
30
35
40
45
Interpretation Representation Calculation Application / Analysis Assumptions Communication
Preview of MSC Demonstration Year (2016) Results
Quantitative Literacy Dimension
4-Year Institutional Score Distribution
% of student work products scored 4-0 by faculty scorers
These results are not generalizable across participating states or the nation in any way. Please use appropriately.
Questions?
Potential to disaggregate by
demographic characteristics
1.0
1.5
2.0
2.5
Asian Black Hispanic White
Critical Thinking scores by race
2 year 4 year
These results are not generalizable across participating states or the nation in any way. Please use appropriately.
Asian Black Hispanic White
Critical Thinking scores by Pell eligibility
1.0
1.5
2.0
2.5
These results are not generalizable across participating states or the nation in any way. Please use appropriately.
2 year 4 year
Not Eligible Pell Eligible Not Eligible Pell Eligible
State Level Results
Potential to Inform State Level Policy
• Transfer & Articulation
• Equity
• Increase resources to support professional
development
• Inform policy leaders about the learning
outcomes students in state are demonstrating
24
MSC Criterion State Level Score Distribution
4 4 4 4 4 43 3 3 3 3 32 2 2 2 2 21 1 1 1 1 10 0 0 0 0 0
0
10
20
30
40
50
60
70
Interpretation Representation Calculation Application/Analysis Assumptions Communication
Quantitative Literacy Dimension (State)
2-Year Institutional Score Distribution
% of student work products scored 4-0 by faculty scorers
26
4 43 32 21 10 0
0
5
10
15
20
25
30
35
40
Project - Context/Assumptions State - Context/Assumptions
Preview of MSC Demonstration Year (2016) Results
Quantitative Literacy (Context/Assumptions)
2-Year State vs. Project Score Distribution
% of student work products scored 4-0 by faculty scorers
27
Institution-Level Results
28
Institution-Level Results
Questions?
Inherent Challenge for VALUE
Navigating Methodological Complexity
Establishing the validity &
reliability of VALUE is a key priority
Nature & implications of complexity
Reality Check
There is no large-scale model for what we are doing.
The very variables other assessment approaches
“control” or “eliminate” VALUE embraces.
Purpose =
Discuss validity
& reliability in
relation to
inherent
complexity of
VALUE
Scores
(rubrics)
AssignmentsScorers
Methodological
Philosophical/
Pedagogical
A careful balancing act
VALUE & Validity
Faculty & staff saw the VALUE rubrics as valid.
Percent of scorers who reported Strongly Agree or Agree with each aspect of rubric use
75%
80%
83%
86%
89%
Encompassed meaning of outcome
Descriptors were relevant
Descriptors were understandable
Scoring levels provided sufficient range
Useful for evaluating student work
These results are not generalizable across participating states or the nation in any way. Please use appropriately.
Lessons Learned
• Actionable data about student achievement and improvement of key
learning outcomes on specific key dimensions of these important
learning outcomes can be generated via a common rubric-based
assessment approach.
• Faculty can effectively use common rubrics to evaluate student work
products—even those produced for courses outside their area of
expertise.
• Following training, faculty members can produce reliable results using
a rubric-based assessment approach.
• Faculty report that the VALUE Rubrics used in the study do encompass
key elements of each learning outcome studied, and were very useful
for assessing student work and for improving assignments.
• A web-based platform can create an easily usable framework for
uploading student work products and facilitating their assessment.
Next Steps
• 13 states, five with representative samples for the state
• 20,000 artifacts collected and uploaded
• Establishment of inter-state “SWAT” teams
• Increased focus on evaluation – panel of data scientists
• Increased focus on equity
• Explore feasibility of sub-study following students into the
workforce
MSC Refinement year (year three)
Virginia
joins as
13th state.
39
OR
UT
TX
HI
MN
MO
IN
KY
ME
MA
RI
CT
VA
Questions?
Julie Carnahan
JCarnahan@sheeo.org
Terrel Rhodes
rhodes@aacu.org
Taskstream.com/Aqua
events@taskstream.com
41
Contact Us!

More Related Content

PPT
It Takes More Than A Major: Employer Priorities for College Learning and Stu...
PDF
Key Findings from Focus Groups with College Students
PPTX
Optimistic About the Future, But How Well Prepared? College Students' Views o...
PDF
Optimistic About the Future, But How Well Prepared? College Students' Views o...
PPT
Introduction to LEAP
PPTX
Falling Short? College Learning and Career Success
PPT
Recent Trends in General Education Design, Learning Outcomes, and Teaching Ap...
PPT
Credit Flexibility Presentation by Sarah Luchs
It Takes More Than A Major: Employer Priorities for College Learning and Stu...
Key Findings from Focus Groups with College Students
Optimistic About the Future, But How Well Prepared? College Students' Views o...
Introduction to LEAP
Falling Short? College Learning and Career Success
Recent Trends in General Education Design, Learning Outcomes, and Teaching Ap...
Credit Flexibility Presentation by Sarah Luchs

What's hot (20)

PPT
Grant Writing Workshop for HBCUs 071210
PPT
IES Grant Writing Workshop for HBCUs 071210
PPT
Changing Student Employer Attitudes
PDF
Tom Lowe & Liz Dunne
PPTX
Reflection, Integration, Identity, and Institutional Change
PPT
At d & data presentation
PPT
Comparative and non-comparative evaluation in Educational technology
PPT
Holistic Admissions
PDF
PISA Report 2012 - World
PPTX
Education and Skills Online - General Information
PDF
Txt 4 Success: Utilizing personalized text messages to promote college access...
PDF
Sivakumaran, thillainatarajan hiring agents’ expectations for new teacher por...
PPTX
Measuring Adult Student Gains and Satisfaction After Earning an Undergraduate...
PPTX
PIAAC Session at COABE 2015_Jill Castek Presentation
PDF
Common core-e guide
PPTX
Unfinished: Insights From Ongoing Work to Accelerate Outcomes for Students Wi...
PDF
Adult Student Gains Degree, Demographic, and Motivational Insights
PDF
Hugh Mannerings & Jonathan Neves
PPT
Comparative and Non-Comparative Evaluation Studies
PPT
Comparative and non-comparative evaluation in educational technology
Grant Writing Workshop for HBCUs 071210
IES Grant Writing Workshop for HBCUs 071210
Changing Student Employer Attitudes
Tom Lowe & Liz Dunne
Reflection, Integration, Identity, and Institutional Change
At d & data presentation
Comparative and non-comparative evaluation in Educational technology
Holistic Admissions
PISA Report 2012 - World
Education and Skills Online - General Information
Txt 4 Success: Utilizing personalized text messages to promote college access...
Sivakumaran, thillainatarajan hiring agents’ expectations for new teacher por...
Measuring Adult Student Gains and Satisfaction After Earning an Undergraduate...
PIAAC Session at COABE 2015_Jill Castek Presentation
Common core-e guide
Unfinished: Insights From Ongoing Work to Accelerate Outcomes for Students Wi...
Adult Student Gains Degree, Demographic, and Motivational Insights
Hugh Mannerings & Jonathan Neves
Comparative and Non-Comparative Evaluation Studies
Comparative and non-comparative evaluation in educational technology
Ad

Viewers also liked (11)

PPTX
AAC&U Members on Trends in Learning Outcomes Assessment
PDF
Employer Priorities for Most Important College Learning Outcomes
PDF
The Quality Imperative: Match Ambitious Goals for College Attainment with an ...
PPT
Liberal Education & Civic Capacity: We Are Only Half-Way There
PPTX
Bringing Equity and Quality Learning Together: Institutional Priorities for T...
PPT
The Civic Case for Liberal Education
PPTX
LEAP States Summit Visuals
PPT
The Economic Case for Liberal Education
PDF
Meaningful Play. Getting »Gamification« Right.
PDF
James johnson ppt
PDF
My Portfolio
AAC&U Members on Trends in Learning Outcomes Assessment
Employer Priorities for Most Important College Learning Outcomes
The Quality Imperative: Match Ambitious Goals for College Attainment with an ...
Liberal Education & Civic Capacity: We Are Only Half-Way There
Bringing Equity and Quality Learning Together: Institutional Priorities for T...
The Civic Case for Liberal Education
LEAP States Summit Visuals
The Economic Case for Liberal Education
Meaningful Play. Getting »Gamification« Right.
James johnson ppt
My Portfolio
Ad

Similar to Multi-State Collaborative To Advance Quality Student Learning (20)

PPTX
Using Rubrics in the Implementation of 21st Century Learning Outcomes Across ...
PPTX
Re envisioning gt pathways ppt
PPTX
Community College Conference on Learning Assessment - Spring 2015
PPT
Tesol08 Learning Outcomes
PPT
DU CTLAT Presentation Assessing Student Learning Outcomes Educational Program...
DOCX
SMALL GROUP LESSON
DOCX
SMALL GROUP LESSON .docx
PPT
MnSCU Core Outcomes Study
PPT
“Reinventing” Teaching - Tony Wagner
PPT
Tony Wagner's Keynote Presentation
PPTX
2010 ohio tif meeting creating a comprehensive teacher effectiveness system
PPTX
Coherence cas cop assess share
PPTX
Terry Rhodes: Show Me the Learning: Valid Assessment of Learning in Undergrad...
PDF
Miller Guidance Assessment Hierarchy
PPT
PPTX
Ldp presentation -assessment
PPTX
Update on Student Learning Outcomes Assessment
PPTX
Minnevate: Bridging the gap between vision and funding
PPT
Student Assessment
PPT
Students Evaluation and Examination Methods
Using Rubrics in the Implementation of 21st Century Learning Outcomes Across ...
Re envisioning gt pathways ppt
Community College Conference on Learning Assessment - Spring 2015
Tesol08 Learning Outcomes
DU CTLAT Presentation Assessing Student Learning Outcomes Educational Program...
SMALL GROUP LESSON
SMALL GROUP LESSON .docx
MnSCU Core Outcomes Study
“Reinventing” Teaching - Tony Wagner
Tony Wagner's Keynote Presentation
2010 ohio tif meeting creating a comprehensive teacher effectiveness system
Coherence cas cop assess share
Terry Rhodes: Show Me the Learning: Valid Assessment of Learning in Undergrad...
Miller Guidance Assessment Hierarchy
Ldp presentation -assessment
Update on Student Learning Outcomes Assessment
Minnevate: Bridging the gap between vision and funding
Student Assessment
Students Evaluation and Examination Methods

More from Robert Kelly (11)

PPTX
Fulfilling the American Dream: Liberal Education and the Future of Work
PPT
Beyond the "A" Word: Assessment that Empowers Faculty to Take Risks with Peda...
PPSX
Stockton pt show
PPTX
Stockton University
PPTX
Michigan LEAP States Visual
PPTX
Michigan LEAP State Summit 2016 Visual
PPTX
Kentucky LEAP State Summit 2016 visual
PDF
Connecting College Learning and America's Global Future
PDF
Connecting College Learning and Career Success
PPT
Liberal Education: Our Students' Best Preparation for Work and Citizenship – ...
PPT
The Economic Value of Liberal Education
Fulfilling the American Dream: Liberal Education and the Future of Work
Beyond the "A" Word: Assessment that Empowers Faculty to Take Risks with Peda...
Stockton pt show
Stockton University
Michigan LEAP States Visual
Michigan LEAP State Summit 2016 Visual
Kentucky LEAP State Summit 2016 visual
Connecting College Learning and America's Global Future
Connecting College Learning and Career Success
Liberal Education: Our Students' Best Preparation for Work and Citizenship – ...
The Economic Value of Liberal Education

Recently uploaded (20)

PDF
Τίμαιος είναι φιλοσοφικός διάλογος του Πλάτωνα
PDF
RTP_AR_KS1_Tutor's Guide_English [FOR REPRODUCTION].pdf
PDF
What if we spent less time fighting change, and more time building what’s rig...
PPTX
Introduction to Building Materials
PDF
احياء السادس العلمي - الفصل الثالث (التكاثر) منهج متميزين/كلية بغداد/موهوبين
PPTX
202450812 BayCHI UCSC-SV 20250812 v17.pptx
PDF
Hazard Identification & Risk Assessment .pdf
PDF
My India Quiz Book_20210205121199924.pdf
PDF
Practical Manual AGRO-233 Principles and Practices of Natural Farming
PDF
Indian roads congress 037 - 2012 Flexible pavement
PDF
David L Page_DCI Research Study Journey_how Methodology can inform one's prac...
PPTX
Introduction to pro and eukaryotes and differences.pptx
PDF
ChatGPT for Dummies - Pam Baker Ccesa007.pdf
PDF
A GUIDE TO GENETICS FOR UNDERGRADUATE MEDICAL STUDENTS
PPTX
TNA_Presentation-1-Final(SAVE)) (1).pptx
PPTX
History, Philosophy and sociology of education (1).pptx
PPTX
ELIAS-SEZIURE AND EPilepsy semmioan session.pptx
PPTX
Virtual and Augmented Reality in Current Scenario
PDF
FORM 1 BIOLOGY MIND MAPS and their schemes
PDF
BP 704 T. NOVEL DRUG DELIVERY SYSTEMS (UNIT 1)
Τίμαιος είναι φιλοσοφικός διάλογος του Πλάτωνα
RTP_AR_KS1_Tutor's Guide_English [FOR REPRODUCTION].pdf
What if we spent less time fighting change, and more time building what’s rig...
Introduction to Building Materials
احياء السادس العلمي - الفصل الثالث (التكاثر) منهج متميزين/كلية بغداد/موهوبين
202450812 BayCHI UCSC-SV 20250812 v17.pptx
Hazard Identification & Risk Assessment .pdf
My India Quiz Book_20210205121199924.pdf
Practical Manual AGRO-233 Principles and Practices of Natural Farming
Indian roads congress 037 - 2012 Flexible pavement
David L Page_DCI Research Study Journey_how Methodology can inform one's prac...
Introduction to pro and eukaryotes and differences.pptx
ChatGPT for Dummies - Pam Baker Ccesa007.pdf
A GUIDE TO GENETICS FOR UNDERGRADUATE MEDICAL STUDENTS
TNA_Presentation-1-Final(SAVE)) (1).pptx
History, Philosophy and sociology of education (1).pptx
ELIAS-SEZIURE AND EPilepsy semmioan session.pptx
Virtual and Augmented Reality in Current Scenario
FORM 1 BIOLOGY MIND MAPS and their schemes
BP 704 T. NOVEL DRUG DELIVERY SYSTEMS (UNIT 1)

Multi-State Collaborative To Advance Quality Student Learning

  • 2. 2 Today’s Moderator & Speakers Catherine Wehlburg Julie Carnahan Terrel Rhodes Proudly brought to you by
  • 3. Purpose of Today Preview “30,000 foot” initial results from the Multi-State Collaborative Demonstration Year using the LEAP Value Rubrics to inform teaching and learning. Provide examples of detailed results to be released with full report in January 2017 3
  • 4. These slides summarize results from the demonstration study involving 48 institutions in twelve states using common rubrics to assess more than 8,000 student work products. The sample of student work in the pilot represented the near-graduation students across the participating institutions in the twelve states only; therefore, the results are not generalizable for all students in each participating state or nationwide. 4
  • 5. VALUE Rubric Approach Assumptions Learning is a process that occurs over time Student work is best representation of motivated learning Focus on what student does in key learning outcomes Faculty & educator expert judgment Results are useful & actionable for learning (& accountability) 5
  • 6. Minnesota Collaborative Great Lakes Colleges Association Multi-State Collaborative The current VALUE initiative Purpose Sea change in assessment Reliability Validity Local value Policy debate = learning
  • 7. The Multi-State Collaborative • States committed to the importance of learning outcomes and quality of a degree • Mindful of students contribution to the states in which they live • Respectful that teaching & learning is prerogative of faculty • Focus is on improvement of student learning not ranking states or institutions 7
  • 8. The MSC Challenge: Scaling Direct Assessment 8,308
  • 9. Demonstration Year: Taking the vision to scale from 9 to 12 states Steering Committee Point person from each state and reps from SHEEO & AAC&U Institution Point Persons From each campus in each state p OR UT TX HI MN MO IN KY ME MA RI CT
  • 10. Goals Root assessment of learning in authentic work & the expertise of faculty Establish benchmarks for essential learning outcomes Develop transparency of shared standards of learning to assist with transfer OR UT TX HI MN MO IN KY ME MA RI CT Demonstration Year: Taking the vision to scale from 9 to 12 states
  • 11. Multi-State Collaborative To Advance Learning Outcomes Assessment Preview of Demonstration Year (2016) Results
  • 12. MSC Demonstration Year by the Numbers 48 public institutions uploaded artifacts By sector 29 four-year, including 8 research institutions 19 two-year OR UT MN MO IN KY MA RI CT OR UT TX MN MO IN KY ME HI These results are not generalizable across participating states or the nation in any way. Please use appropriately.
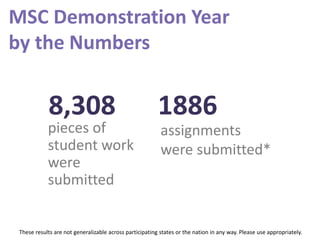
  • 13. MSC Demonstration Year by the Numbers 8,308 assignments were submitted* pieces of student work were submitted 1886 These results are not generalizable across participating states or the nation in any way. Please use appropriately.
  • 14. MSC Demonstration Year Profile of VALUE Scorers 940 632 978 60 2,419 1,008 2,271 - 1,000 2,000 3,000 4,000 Civic Engagement Critical Thinking Quantitative Literacy Written Communication MSC 2-Year MSC 4-Year Artifacts Scored Per Outcome These results are not generalizable across participating states or the nation in any way. Please use appropriately.
  • 15. Profile of Scorers by Discipline and/or Institutional Role 68 41 32 23 10 Arts and Humanities Natural and Applied/Formal Sciences Professions Social Sciences Administrative MSC Demonstration Year Profile of VALUE Scorers These results are not generalizable across participating states or the nation in any way. Please use appropriately.
  • 16. For full text of AAC&U VALUE Rubric for Critical Thinking, see: https://www.aacu.org/value/rubrics/critical-thinking. Critical Thinking Rubric Dimensions Capstone 4 Milestones 3 2 Benchmark 1 Explanation of issues Issue/problem to be considered critically is stated clearly and described comprehensively, delivering all relevant information necessary for full understanding. Issue/problem to be considered critically is stated, described, and clarified so that understanding is not seriously impeded by omissions. Issue/problem to be considered critically is stated but description leaves some terms undefined, ambiguities unexplored, boundaries undetermined, and/or backgrounds unknown. Issue/problem to be considered critically is stated without clarification or description. Evidence Selecting and using information to investigate a point of view or conclusion Information is taken from source(s) with enough interpretation/evaluation to develop a comprehensive analysis or synthesis. Viewpoints of experts are questioned thoroughly. Information is taken from source(s) with enough interpretation/evaluation to develop a coherent analysis or synthesis. Viewpoints of experts are subject to questioning. Information is taken from source(s) with some interpretation/evaluation, but not enough to develop a coherent analysis or synthesis. Viewpoints of experts are taken as mostly fact, with little questioning. Information is taken from source(s) without any interpretation/evaluation. Viewpoints of experts are taken as fact, without question. Influence of context and assumptions Thoroughly (systematically and methodically) analyzes own and others' assumptions and carefully evaluates the relevance of contexts when presenting a position. Identifies own and others' assumptions and several relevant contexts when presenting a position. Questions some assumptions. Identifies several relevant contexts when presenting a position. May be more aware of others' assumptions than one's own (or vice versa). Shows an emerging awareness of present assumptions (sometimes labels assertions as assumptions). Begins to identify some contexts when presenting a position. Student's position (perspective, thesis/hypothesis) Specific position (perspective, thesis/hypothesis) is imaginative, taking into account the complexities of an issue. Limits of position (perspective, thesis/hypothesis) are acknowledged. Others' points of view are synthesized within position (perspective, thesis/hypothesis). Specific position (perspective, thesis/hypothesis) takes into account the complexities of an issue. Others' points of view are acknowledged within position (perspective, thesis/hypothesis). Specific position (perspective, thesis/hypothesis) acknowledges different sides of an issue. Specific position (perspective, thesis/hypothesis) is stated, but is simplistic and obvious. Conclusions and related outcomes (implications and consequences) Conclusions and related outcomes (consequences and implications) are logical and reflect student’s informed evaluation and ability to place evidence and perspectives discussed in priority order. Conclusion is logically tied to a range of information, including opposing viewpoints; related outcomes (consequences and implications) are identified clearly. Conclusion is logically tied to information (because information is chosen to fit the desired conclusion); some related outcomes (consequences and implications) are identified clearly. Conclusion is inconsistently tied to some of the information discussed; related outcomes (consequences and implications) are oversimplified.
  • 17. 4 3 2 1 0 0 5 10 15 20 25 30 35 40 45 50 Explanation of issues Evidence Context / Assumptions Student's Position Conclusions / Outcomes Preview of MSC Demonstration Year (2016) Results Critical Thinking Dimension 2-Year Institutional Score Distribution % of student work products scored 4-0 by faculty scorers These results are not generalizable across participating states or the nation in any way. Please use appropriately.
  • 18. For full text of AAC&U VALUE Rubric for Quantitative Literacy, see: https://www.aacu.org/value/rubrics/quantitative-literacy Quantitative Literacy Rubric Dimensions Capstone 4 Milestones 3 2 Benchmark 1 Interpretation Ability to explain information presented in mathematical forms (e.g., equations, graphs, diagrams, tables, words) Provides accurate explanations of information presented in mathematical forms. Makes appropriate inferences based on that information. For example, accurately explains the trend data shown in a graph and makes reasonable predictions regarding what the data suggest about future events. Provides accurate explanations of information presented in mathematical forms. For instance, accurately explains the trend data shown in a graph. Provides somewhat accurate explanations of information presented in mathematical forms, but occasionally makes minor errors related to computations or units. For instance, accurately explains trend data shown in a graph, but may miscalculate the slope of the trend line. Attempts to explain information presented in mathematical forms, but draws incorrect conclusions about what the information means. For example, attempts to explain the trend data shown in a graph, but will frequently misinterpret the nature of that trend, perhaps by confusing positive and negative trends. Representation Ability to convert relevant information into various mathematical forms (e.g., equations, graphs, diagrams, tables, words) Skillfully converts relevant information into an insightful mathematical portrayal in a way that contributes to a further or deeper understanding. Competently converts relevant information into an appropriate and desired mathematical portrayal. Completes conversion of information but resulting mathematical portrayal is only partially appropriate or accurate. Completes conversion of information but resulting mathematical portrayal is inappropriate or inaccurate. Calculation Calculations attempted are essentially all successful and sufficiently comprehensive to solve the problem. Calculations are also presented elegantly (clearly, concisely, etc.) Calculations attempted are essentially all successful and sufficiently comprehensive to solve the problem. Calculations attempted are either unsuccessful or represent only a portion of the calculations required to comprehensively solve the problem.  Calculations are attempted but are both unsuccessful and are not comprehensive. Application / Analysis Ability to make judgments and draw appropriate conclusions based on the quantitative analysis of data, while recognizing the limits of this analysis Uses the quantitative analysis of data as the basis for deep and thoughtful judgments, drawing insightful, carefully qualified conclusions from this work. Uses the quantitative analysis of data as the basis for competent judgments, drawing reasonable and appropriately qualified conclusions from this work. Uses the quantitative analysis of data as the basis for workmanlike (without inspiration or nuance, ordinary) judgments, drawing plausible conclusions from this work. Uses the quantitative analysis of data as the basis for tentative, basic judgments, although is hesitant or uncertain about drawing conclusions from this work. Assumptions Ability to make and evaluate important assumptions in estimation, modeling, and data analysis Explicitly describes assumptions and provides compelling rationale for why each assumption is appropriate. Shows awareness that confidence in final conclusions is limited by the accuracy of the assumptions. Explicitly describes assumptions and provides compelling rationale for why assumptions are appropriate. Explicitly describes assumptions. Attempts to describe assumptions. Communication Expressing quantitative evidence in support of the argument or purpose of the work (in terms of what evidence is used and how it is formatted, presented, and contextualized) Uses quantitative information in connection with the argument or purpose of the work, presents it in an effective format, and explicates it with consistently high quality. Uses quantitative information in connection with the argument or purpose of the work, though data may be presented in a less than completely effective format or some parts of the explication may be uneven. Uses quantitative information, but does not effectively connect it to the argument or purpose of the work. Presents an argument for which quantitative evidence is pertinent, but does not provide adequate explicit numerical support. (May use quasi- quantitative words such as "many," "few," "increasing," "small," and the like in place of actual quantities.)
  • 19. 4 3 2 1 0 0 5 10 15 20 25 30 35 40 45 Interpretation Representation Calculation Application / Analysis Assumptions Communication Preview of MSC Demonstration Year (2016) Results Quantitative Literacy Dimension 4-Year Institutional Score Distribution % of student work products scored 4-0 by faculty scorers These results are not generalizable across participating states or the nation in any way. Please use appropriately.
  • 21. Potential to disaggregate by demographic characteristics
  • 22. 1.0 1.5 2.0 2.5 Asian Black Hispanic White Critical Thinking scores by race 2 year 4 year These results are not generalizable across participating states or the nation in any way. Please use appropriately. Asian Black Hispanic White
  • 23. Critical Thinking scores by Pell eligibility 1.0 1.5 2.0 2.5 These results are not generalizable across participating states or the nation in any way. Please use appropriately. 2 year 4 year Not Eligible Pell Eligible Not Eligible Pell Eligible
  • 24. State Level Results Potential to Inform State Level Policy • Transfer & Articulation • Equity • Increase resources to support professional development • Inform policy leaders about the learning outcomes students in state are demonstrating 24
  • 25. MSC Criterion State Level Score Distribution 4 4 4 4 4 43 3 3 3 3 32 2 2 2 2 21 1 1 1 1 10 0 0 0 0 0 0 10 20 30 40 50 60 70 Interpretation Representation Calculation Application/Analysis Assumptions Communication Quantitative Literacy Dimension (State) 2-Year Institutional Score Distribution % of student work products scored 4-0 by faculty scorers
  • 26. 26 4 43 32 21 10 0 0 5 10 15 20 25 30 35 40 Project - Context/Assumptions State - Context/Assumptions Preview of MSC Demonstration Year (2016) Results Quantitative Literacy (Context/Assumptions) 2-Year State vs. Project Score Distribution % of student work products scored 4-0 by faculty scorers
  • 30. Inherent Challenge for VALUE Navigating Methodological Complexity
  • 31. Establishing the validity & reliability of VALUE is a key priority Nature & implications of complexity
  • 32. Reality Check There is no large-scale model for what we are doing. The very variables other assessment approaches “control” or “eliminate” VALUE embraces.
  • 33. Purpose = Discuss validity & reliability in relation to inherent complexity of VALUE Scores (rubrics) AssignmentsScorers
  • 36. Faculty & staff saw the VALUE rubrics as valid. Percent of scorers who reported Strongly Agree or Agree with each aspect of rubric use 75% 80% 83% 86% 89% Encompassed meaning of outcome Descriptors were relevant Descriptors were understandable Scoring levels provided sufficient range Useful for evaluating student work These results are not generalizable across participating states or the nation in any way. Please use appropriately.
  • 37. Lessons Learned • Actionable data about student achievement and improvement of key learning outcomes on specific key dimensions of these important learning outcomes can be generated via a common rubric-based assessment approach. • Faculty can effectively use common rubrics to evaluate student work products—even those produced for courses outside their area of expertise. • Following training, faculty members can produce reliable results using a rubric-based assessment approach. • Faculty report that the VALUE Rubrics used in the study do encompass key elements of each learning outcome studied, and were very useful for assessing student work and for improving assignments. • A web-based platform can create an easily usable framework for uploading student work products and facilitating their assessment.
  • 38. Next Steps • 13 states, five with representative samples for the state • 20,000 artifacts collected and uploaded • Establishment of inter-state “SWAT” teams • Increased focus on evaluation – panel of data scientists • Increased focus on equity • Explore feasibility of sub-study following students into the workforce MSC Refinement year (year three)

Editor's Notes

  • #2: Catherine
  • #4: Catherine
  • #5: Catherine
  • #6: Terry
  • #8: Julie
  • #10: Julie
  • #11: Julie
  • #12: Terry
  • #13: Terry
  • #14: Students had to be 75% of the way to completion of institutional degree requirements 2,642 artifacts scored twice (36.6%) in order to measure inter-rater reliability
  • #15: Terry
  • #16: Terry
  • #17: Terry
  • #18: Terry
  • #19: Terry
  • #20: Note: Each work product was scored on 6 dimensions of quantitative literacy using a common AAC&U VALUE Rubric. See Slide 12 below for rubric dimension criteria. VALUE rubrics are available at www.aacu.org/value.
  • #21: TR
  • #22: Julie
  • #23: Julie
  • #24: Julie
  • #25: Julie
  • #26: Julie
  • #27: JUlie
  • #28: These are some of the results they see. Note the reporting options in the right corner
  • #29: Same screen with the addition of things that can be filtered…
  • #30: TR
  • #31: TR
  • #32: Comparing the validity & reliability of the VALUE process to standardized tests will always be an “apples” to “oranges” proposition.
  • #33: Individual, faculty designed assignments taken straight off the syllabus, out of the classroom. Scorer training sessions that are equal parts calibration to a consensus score and faculty development. Approach to sampling that is designed to raise up – not wash out – diversity on our campuses. Unscripted: There is no such thing as a “common” prompt or assignment. “Big tent” welcome to ALL faculty – adjunct, two-year, four-year, curricular, co-curricular. Not an approximation of learning from a curriculum, but OF THE CURRICULUM. Potential for longitudinal assessment across a students’ undergraduate career.
  • #34: Terry
  • #35: Terry
  • #36: TR
  • #37: Terry
  • #38: TR
  • #39: TR & Julie
  • #40: TR
  • #41: TR
  • #42: Julie/Courtney?