SlideShare a Scribd company logo
TRANSPORT OF OXYGEN AND
CARBON DIOXIDE
Speakers : Dr. Ravi
Dr. Pratyush
Moderator : Dr. Tapas Singh
CONTENTS
• INTRODUCTION
• OXYGEN CASCADE
• OXYGEN DELIVERY DURING
EXERCISE
• OXYGEN DELIVERY DURING
CRITICAL ILLNESS
• CARBON DIOXIDE TRANSPORT
O2 TRANSPORT
REQUIREMENTS FOR OXYGEN
TRANSPORT SYSTEM
Match O2 supply with demand
MOVEMENT OF O2 DOWN CONCENTRATION
GRADIENT
OXYGEN CASCADE
•Oxygen moves down the
concentration gradient from
a relatively high levels in
air to that in the cell
•The PO2 reaches the lowest
level (4-20 mmHg) in the
mitochondria
•This decrease in PO2 from air to
the mitochondrion is known as
the OXYGEN CASCADE
KEY STEPS IN OXYGEN CASCADE
• Uptake in the lungs
• Carrying capacity of blood
• Delivery to capillaries
• Delivery to interstitium
• Delivery to individual cells
• Cellular use of oxygen
Oxygen Transport
ms:Carried in bld in 2 for
1. by red blood cells
 Bound to Hb
 97-98%
2. Dissolved O2 in plasma
 Obeys Henry’s law
PO2 x  = O2 conc in sol
 = Solubility Coefficient (0.003mL/100mL/mmHg at 37C)
Bound to Hgb
Dissolved
Hemoglobin
• Fe porphyrin compound
• Normal adult = HbA=
22
• Hb F= 22
• The  chains ↑ hb affinity
to O2
• Each gm of Hb can carry
up to 1.34ml of O2,
Molecular weight of hemoglobin is 64,000
CHEMICAL BINDING OF
HEMOGLOBIN & OXYGEN
• Hemoglobin combines reversibly with O2
• Association and dissociation of Hb & O2 occurs
within milliseconds
– Critically fast reaction important for O2 exchange
– Very loose bond is formed between Fe2+ and O2,
easily reversible
• Oxygen carried in molecular state (O2) not ionic O2-
Oxygen Saturation & Capacity
• Up to four oxygen molecules can bind to one
hemoglobin (Hb)
• Ratio of oxygen bound to Hb compared to total
amount that can be bound is k/a Oxygen
Saturation
• Maximal amount of O2 bound to Hb is
defined as the Oxygen Capacity
Arterial O2 Content (CaO2)
• 97-98% Carried in Combination With Hb
• 2-3% Dissolved in Plasma
O2 CONTENT -
The sum of O2 carried on Hb and dissolved in plasma
CaO2 (ml/dL) = (SaO2 x Hb x 1.34) + (PO2 x0.003)
• O2 content in 100 ml blood (in normal adult with Hb 15
gm/dl) ~ 20 ml/dl
(19.4 ml as OxyHb + 0.3 ml in plasma)
50
If the PAO2 is ↑ed significantly (by breathing 100% oxygen) then a
small amount of extra oxygen will dissolve in the plasma (at a rate of
0.003 ml O2/100ml of blood /mmHg PO2) but there will normally be no
significant increase in the amount carried by haemoglobin
Venous O2 content (CvO2)
CvO2 =(SvO2 x Hb x 1.34) + (PvO2 x 0.003)
‒(normally-15ml/dl)
• mixed venous saturation (SvO2 ) measured in
the pul A represents the pooled venous
saturation from all organs.
• SvO2 influenced by changes in both DO2 and
VO2
• Normally, the SvO2 is about 75%, however,
clinically a SvO2 of about 65% is acceptable
16
Arterial-Venous Difference
• The arterial-venous oxygen content difference is
the difference between the CaO2 and the CvO2.
• The normal C(a-v)O2 : 5 vol%.
Factors that increase the
C(a-v)O2:
• decreased cardiac output
• increased O2consumption
• exercise
• seizures
• shivering
• increased temp
Factors that decrease the
C(a-v)O2:
• increased cardiac output
• skeletal relaxation (drugs)
• peripheral shunting
• decreased temp
O2 DELIVERY
DO2 (ml/min) = Q x CaO2
N : 900 - 1,300 ml/min
• Decreased oxygen delivery occurs when there is:
– ↓ed cardiac output
– ↓ed hemoglobin concentration
– ↓ed blood oxygenation
18
O2 CONSUMPTION
• The amount of oxygen extracted by the peripheral tissues
during the period of one minute is called oxygen
consumption or VO2. (N- 200-300ml/min)
VO2 = Q x (CaO2 - CvO2) x 10
• O2 consumption is commonly indexed by the patients
body surface area (BSA) and calculated by:
– VO2 / BSA
– Normal VO2 index is between 110 – 160ml/min/m2
19
OXYGEN EXTRACTION RATIO
• The oxygen extraction ratio (O2ER) is the amount of oxygen
extracted by the peripheral tissues divided by the amount of
O2 delivered to the peripheral cells.
• Index of efficiency of O2 transport
• aka: Oxygen coefficient ratio & Oxygen utilization ratio
– O2ER = VO2 / DO2
– Normally ~ 25% but  to 70-80% during maximal
exercise in well trained athletes
Factors that affect O2ER
•Decreased with:
•Increased Cardiac Output
•Skeletal Muscle Relaxation
•Peripheral Shunting
•Hypothermia
•Increased Hemoglobin
•Increased PaO2
•Increased with:
•Decreased CO
•Increased VO2
•Exercise
•Seizures
•Shiveri.ng
•Hyperthermia
•Anemia
•Low PaO2
O2 DIFFUSION FROM
INTERSTITIUM TO CELLS
Intracellular PO2 < Interstitial fluid PO2
• O2 constantly utilized by the cells
• Cellular metabolic rate determines overall O2
consumption
N PcO2 ~ 5-40 mm Hg (average 23 mmHg)
N intracellular req for optimal maintenance of
metabolic pathways ~ 3 mm Hg
Pasteur point –
 critical mitochondrial PO2 below which aerobic
metabolism cannot occur
 1.4 – 2.3mmHg
OXYGEN DISSOCIATION
CURVE
 Sigmoid Shaped
 The amount of oxygen that is
saturated on the hemoglobin
(SO2) is dependent PO2.
 Amount of O2 carried by
Hb rises rapidly upto PO2
of 70mmHg but above that
curve becomes flatter.
 Combination Of 1st Heme with
O2 increases affinity of 2nd
Heme and so on
Steep Portion of Curve
• “Dissociation Portion” of curve.
• Between 10 and 60 mm Hg.
• Small increases in PO2 yield large increases in
SO2.
• At the tissue capillary, blood comes in contact
with reduced tissue PO2 and oxygen diffuses
from the capillary to the tissue.
Flat Portion of Curve
• “Association Portion” of curve.
• Greater than 60 mm Hg.
• Large increases in PO2 yield small increases in SO2.
• At the pulmonary capillary, blood comes in contact
with increased alveolar PO2 and oxygen diffuses
from the alveolus to the capillary. As the PO2 rises,
oxygen binds with the hemoglobin (increasing SO2).
• Very little rise in oxygen saturation above 100 mm
Hg of PaO2.
P50
• The partial pressure of oxygen in the blood at which
the haemoglobin is 50% saturated, is known as the
P50.
• The P50 is a conventional measure of haemoglobin
affinity for oxygen
• Normal P50 value is 26.7 mm Hg
• As P50 increases/decreases, we say the “curve has
shifted”.
– P50 less than 27: Shift to the left.
– P50 greater than 27: Shift to the right.
Factors affecting Dissociation
BLOOD TEMPERATURE
• increased blood temperature
• reduces haemoglobin affinity for O2
BLOOD Ph
• lowering of blood pH (making blood
more acidic)
• caused by presence of H+ ions from
lactic acid or carbonic acid
• reduces affinity of Hb for O2
CARBON DIOXIDE CONCENTRATION
• the higher CO2 concentration in
tissue
• the less the affinity of Hb for O2
2727
RIGHT SHIFT
LEFT SHIFT
Decreasing P50.
Increasing P50
Bohr Effect
• By Christian Bohr in 1904
• The effect of CO2 on the OHDC is known as
the Bohr Effect
• High PCO2 levels and low pH decrease affinity
of hemoglobin for oxygen (a right-ward shift).
• This occurs at the tissues where a high level of
PCO2 and acidemia contribute to the unloading
of oxygen.
Bohr effect – the effect of [CO2] on
haemoglobin
100%
% saturation of
haemoglobin
partial pressure
of O2 (mmHg)
Lower [CO2]
e.g. in lung
► curve shift
to the left
►
haemoglobin
has a higher
affinity to O2
Higher [CO2] e.g. tissue cells
► curve shift to the right
► haemoglobin has a lower
affinity to O2
pH & pO2: BOHR EFFECT
IMPLICATIONS OF BOHR EFECT
• Enhance oxygenation of blood in lungs and to
enhance release of O2 in the tissues
• In lungs, CO2 diffuses out of the blood (H+ conc )
 Shift of O2-Hb curve to left O2 bound to Hb 
 O2 transport to tissues.
• In tissue capillaries,  CO2 and  H+  greater
release of O2 due to less avid binding of O2 to Hb.
DOUBLE BOHR EFFECT
• Reciprocal changes in acid - base balance that occur in
maternal & fetal blood in transit through the placenta
FETAL BLOOD
Loss of CO2
MATERNAL BLOOD
Gain of CO2
Rise in pH Fall in pH
Leftward shift of ODC Rightward shift of ODC
Oxygen dissociation curve:
Foetal VS Maternal
% saturation of
haemoglobin
Maternal
partial pressure
of O2 (mmHg)
→ Foetal haemoglobin has higher affinity to O2 so as obtain O2 from
maternal blood in the placenta.
Foetal
ROLE OF 2,3
DPG(diphosphoglycerate)
2,3 DPG is an organic phosphate normally
found in the RBC
Produced during Anaerobic glycolysisin
RBCS
2,3 DPG
• Tendency to bind to β chains of Hb and thereby
decrease the affinity of Hemoglobin for oxygen.
• HbO2 + 2,3 DPG → Hb-2,3 DPG + O2
• It promotes a rightward shift and enhances oxygen
unloading at the tissues.
• This shift is longer in duration than that due to [H+],
PCO2 or temperature.
2,3 DPG
– Cellular hypoxia.
– Anemia
– Hypoxemia secondary to
COPD
– Congenital Heart Disease
– Ascent to high altitudes
• The levels increase with • The levels decrease with
– Septic Shock
– Acidemia
– Stored blood
• No DPG after 2 weeks of
storage.
EFFECTS OF 2,3-BPG ON STORED
BLOOD
• In banked blood , the 2,3-BPG level falls and the ability
of this blood to release O2 to the tissues is reduced.
Effects of anemia & CO on
the oxyhemoglobin dissociation curve
Anemia
• ↓OCC of blood & O2 content;
• SaO2 remains normal
Carbon Monoxide [CO]
• affinity of Hb for CO is
250 fold relative to O2
competes with O2binding
• L shift- interfere with
O2 unloading at tissues
• severe tissue hypoxia
• sigmoidal HbO2 curve becomes
hyperbolic
CHANGE THE SHAPE OF OHDC
Oxygen dissociation curve: Haemoglobin
VS Myoglobin
partial pressure
of O2 (mmHg)
→ Myoglobin stores O2 in muscles and release it only when the O2
partial pressure is very low.
Myoglobin
Haemoglobin
% saturation of
haemoglobin
Myoglobin has an increased affinity for O2
(binds O2 at lower Po2)
O2 and co2-transport
O2 DELIVERY DURING EXERCISE
• During strenuous exercise VO2 may  to 20
times N
• Blood also remains in the capillary for <1/2 N
time due to  C.O.
O2 Sat not affected
• Blood fully sat in first 1/3 of N time available
to pass through pul circulation
• Diffusion capacity  upto 3 fold since:
1.Additional capillaries open up  no of
capillaries participating in diffusion process
2. Dilatation of both alveoli and capillaries
  alveolo-capillary distance
3.Improved V/Q ratio in upper part of lungs due
to  blood flow to upper part of lungs
Shift of O2-Hb dissociation curve to
right because of:
1.  CO2 released from exercising muscles
2.  H+ ions   pH
3.  Temp
4. Release of phospates   2,3 - DPG
O2 and co2-transport
OXYGEN DELIVERY IN CRITICAL
ILLNESS
• Tissue hypoxia is due to disordered
regional distribution of blood flow
• often caused by capillary
microthrombosis after endothelial
damage and neutrophil activation
rather than by arterial hypoxaemia
OXYGEN STORES
• o2 stores are limited to lung and blood.
• The amount of O2 in the lung is dependent on
the FRC and the alveolar concentration of
oxygen.
• Breathing 100% oxygen causes a large
increase in the total stores as the FRC fills with
oxygen
• This is the reason why pre-oxygenation is so
effective.
THE EFFECTS OF ANAESTHESIA
• The normal protective response to hypoxia is
reduced by anaesthetic drugs and this effect extends
into the post-operative period.
• Following induction of anaesthesia : FRC ↓
• V/Q mismatch is ↑ed
• Atelectasis develops rapidly
• This 'venous admixture' increases from N 1% to around
10% following induction of anaesthesia.
THE EFFECTS OF ANAESTHESIA
• Volatile anaesthetic agents suppress hypoxic
pulmonary vasoconstriction.
• Many anaesthetic agents depress CO and therefore ↓
O2 delivery.
• Anaesthesia causes a 15% ↓ in metabolic rate and
therefore a reduction in oxygen requirements.
• Artificial ventilation causes a further 6% ↓ in
oxygen requirements as the work of breathing is
removed.
Pulmonary Shunting
• PERFUSION WITHOUTVENTILATION.
• Pulmonary shunt is that portion of the cardiac
output that enters the left side of the heart without
coming in contact with an alveolus.
– “True” Shunt – No contact
• Anatomic shunts (Thebesian, Pleural, Bronchial)
• Cardiac anomalies
– “Shunt-Like” (Relative) Shunt
• Some ventilation, but not enough to allow for complete
equilibration between alveolar gas and perfusion.
• Shunts are refractory to oxygen therapy.
VenousAdmixture
• Venous admixture is the mixing of shunted,
non-reoxygenated blood with reoxygenated
blood distal to the alveoli
• resulting in a reduction in:
– PaO2
– SaO2
• Normal Shunt: 3 to 5%
• Shunts above 15% are associated with
significant hypoxemia
CO2 TRANSPORT
INTRODUCTION TO PHSYIOLOGY OF CO2
TRANSPORT
• end-product of aerobic metabolism.
– production averages 200 ml/min in resting
adult
– During exercise this amount may increase 6x
• Produced almost entirely in the mitochondria.
• Importance of co2 elimination lies in the fact
that -Ventilatory control system is more
responsive to PaCO2 changes.
• Carbon dioxide is transported in the blood
from the tissue to the lungs in 3 ways:
(i) dissolved in solution;
(ii) buffered with water as carbonic acid;
(iii) bound to proteins, particularly haemoglobin.
• Approximately 75% of carbon dioxide is transport
in the red blood cell and 25% in the plasma
attributable to
– lack of carbonic anhydrase in plasma
– plasma plays little role in buffering and combination
with plasma proteins is poor.
Dissolved carbon dioxide
• Carbon dioxide is 20 times more soluble than oxygen;
• obeys HENRY’S LAW, which states that the number of
molecules in solution is proportional to the partial pressure at
the liquid surface.
PCO2 x  = CO2 conc in sol
 = Solubility Coefficient
Value dependant upon temp (inversely proportional)  more
temp lesser amount of CO2 dissolved.
• The carbon dioxide solubility coefficient is 0.69 ml/L/mm Hg
at 37C.
• At rest, contribution of dissolved CO2 to total
A-V CO2 conc diff only 10%. In absolute
terms only 0.3 ml of CO2/dL transported in
dissolved form
• During heavy exercise contribution of
dissolved CO2 can  7 fold  1/3 of total
CO2 exchange
CO2 BOUND AS HCO3
•Dissolved CO2 in blood reacts with water to form CarbonicAcid
•CO2 + H2O  H2CO3
Carbonic acid dissociates into H+ & HCO3
H2CO3  H + HCO3
When conc of these ions inc in RBCs,
HCO3 diffuses out
but H+ can’t easily do this because cell
memb is relatively impermeable to cations.
Thus to maintain electrical neutrality, Cl-
ions move into cell from plasma [
CHLORIDE SHIFT]
Movement of gases at tissue level
Resp for  70% of CO2 transport
• Most of H+ combine with Hb because reduced Hb is less acidic
so better proton acceptor
• This fact that deoxygenation of the blood inc its ability to carry
CO2 is known as HALDANE EFFECT.
• As a result of the shift of chloride ions into the red cell and the
buffering of hydrogen ions onto reduced haemoglobin, the
intercellular osmolarity increases slightly an →→ water
enters causing the cell to swel →→ an increase in mean
corpuscular volume (MCV)..
• Hematocrit of venous blood is 3%>arterial
• Venous RBC are more fragile
• Cl content of RBCs V>A
CO2 BOUND AS CARBAMATE
• 15-25% of total CO2 transport
• CO2 reacts directly with terminal amine group of Hb to
form the carbaminoHb (Hgb.CO)
• Reversible Reaction
• Amount of CO2 bound as carbamate to Hb or plasma
proteins depends on:
1) O2 Sat of Hb
2) H+ conc
 During passage of blood through muscle & tissues, O2 Sat
and H+ conc change considerably, in particular during
exercise.
Reduction of Hb ( oxygenation of heme)

 basicity of Hb

 H+ binding to reduced Hb

 dissociation of H2CO3

 carriage of CO2 as HCO3
TISSUES
Oxygenation of Hb

 acidity of Hb


 tendency to combine with
CO2 to form Hgb.CO

Displacement of CO2 from Hb

 H+ binding to Hb

 Release of H+ from Hb

 formation of H2CO3

 release of CO2
LUNGS
CARBON DIOXIDE
DISSOCIATION CURVE
•carbamino hb is much
affected by the state of
oxygenation of Hb than
by the PCO2.
•Lower the saturation of
Hb with O2 , larger the
CO2 conc for a given
PaCO2
•CO2 curve is shifted to
right by increase in SpO2
• CO2 content rises throughout
the increase in partial
pressure.
• O2content rises more steeply
until a point at which the hb is
fully saturated. After that, the
increase is small because of
the small increased amount in
solution.
• Consequently, the CO2 curve
is more linear than the O2Hb
dissociation curve.
• Graph illustrates the difference
between the content in blood of
oxygen and carbon dioxide with
change in partial pressure.
O2 and co2-transport
THANK YOU

More Related Content

PPT
Pneumology - Oxygen and-carbon-dioxide-transport
PPT
Transport of oxygen and carbon dioxide
PPTX
oxygen transport
PPTX
Oxygen and carbon dioxide transport
PPTX
HIGH ALTITUDE PHYSIOLOGY
PPTX
Oxygen transport
PPTX
Respiratory #2, Gas Transport - Physiology
PPT
Oxygen dissociation curve
Pneumology - Oxygen and-carbon-dioxide-transport
Transport of oxygen and carbon dioxide
oxygen transport
Oxygen and carbon dioxide transport
HIGH ALTITUDE PHYSIOLOGY
Oxygen transport
Respiratory #2, Gas Transport - Physiology
Oxygen dissociation curve

What's hot (20)

PPT
Respiratory physiology
PPTX
A detailed mechanism of hypoxia, Physiology
PPTX
Transport of gases
PPTX
Oxygen cascade
PPT
O2 and CO2 transport by M. Pandian
PPTX
Bohr and haldane effect
PPTX
Respiratory physiology
PPTX
Oxygen dissociation curve
PPTX
Oxygen transport
PPT
Transport of oxygen and carbon dioxide
PPT
Physiology of O2 transport & O2 Dissociation Curve
PPTX
anesthesia machine.pptx
PPT
Co2 transport in blood
PPTX
Microcirculation
PPTX
Respiratory physiology at high altitudes
PPTX
Transport of carbon dioxide
PPT
Physiology
PPTX
Hypoxia & hypoxemia
PPTX
Splanchnic circulation
Respiratory physiology
A detailed mechanism of hypoxia, Physiology
Transport of gases
Oxygen cascade
O2 and CO2 transport by M. Pandian
Bohr and haldane effect
Respiratory physiology
Oxygen dissociation curve
Oxygen transport
Transport of oxygen and carbon dioxide
Physiology of O2 transport & O2 Dissociation Curve
anesthesia machine.pptx
Co2 transport in blood
Microcirculation
Respiratory physiology at high altitudes
Transport of carbon dioxide
Physiology
Hypoxia & hypoxemia
Splanchnic circulation
Ad

Similar to O2 and co2-transport (20)

PDF
Oxygen and carbon di oxide transport. PDF
PPTX
oxygen and carbon di oxide transport O2_AND_CO2.pptx
PPTX
O2_AND_CO2 transport.Oxygen cascade in body
PPTX
transport of resp gas.pptx
PPTX
o2 transport.pptx
PPT
Chap 40
PPTX
O2 transport.pptx shsjjsjajsuiisjsjsjsjsjjs
PPT
10560062.ppt biochemistry of respiratory system
PPTX
Oxygen transport
PPTX
Pulmonary physiology in health part ii
PPT
Transport of oxygen in the blood
PDF
OXYGEN AND CARBON DIOXIDE Gas transport.pdf
PPTX
vam ppt (1).xxbcnffhggdgccnfhfhgfhgnvnfhfhfh
PPTX
Oxygen Dissociation Curve.pptx a breif description
PPTX
TRASPORT OF RESPIRATORY GASES.pptx
PPT
TRANPORT OF OXYGEN
PPTX
Blood Gas transport power point pr.pptx
PPTX
Transport of gases for dental students
PPTX
TRANSPORT OF OXYGEN
PPT
transport of gases.ppt
Oxygen and carbon di oxide transport. PDF
oxygen and carbon di oxide transport O2_AND_CO2.pptx
O2_AND_CO2 transport.Oxygen cascade in body
transport of resp gas.pptx
o2 transport.pptx
Chap 40
O2 transport.pptx shsjjsjajsuiisjsjsjsjsjjs
10560062.ppt biochemistry of respiratory system
Oxygen transport
Pulmonary physiology in health part ii
Transport of oxygen in the blood
OXYGEN AND CARBON DIOXIDE Gas transport.pdf
vam ppt (1).xxbcnffhggdgccnfhfhgfhgnvnfhfhfh
Oxygen Dissociation Curve.pptx a breif description
TRASPORT OF RESPIRATORY GASES.pptx
TRANPORT OF OXYGEN
Blood Gas transport power point pr.pptx
Transport of gases for dental students
TRANSPORT OF OXYGEN
transport of gases.ppt
Ad

Recently uploaded (20)

PPTX
DENTAL CARIES FOR DENTISTRY STUDENT.pptx
PPTX
Acid Base Disorders educational power point.pptx
PPT
Copy-Histopathology Practical by CMDA ESUTH CHAPTER(0) - Copy.ppt
PPTX
Respiratory drugs, drugs acting on the respi system
PPT
genitourinary-cancers_1.ppt Nursing care of clients with GU cancer
PPT
Obstructive sleep apnea in orthodontics treatment
PPTX
Note on Abortion.pptx for the student note
PDF
Deadly Stampede at Yaounde’s Olembe Stadium Forensic.pdf
PDF
Human Health And Disease hggyutgghg .pdf
PPTX
post stroke aphasia rehabilitation physician
PDF
Medical Evidence in the Criminal Justice Delivery System in.pdf
DOCX
RUHS II MBBS Microbiology Paper-II with Answer Key | 6th August 2025 (New Sch...
PPT
OPIOID ANALGESICS AND THEIR IMPLICATIONS
PPTX
SKIN Anatomy and physiology and associated diseases
PPTX
ACID BASE management, base deficit correction
PPTX
CME 2 Acute Chest Pain preentation for education
PPTX
Important Obstetric Emergency that must be recognised
PPT
Breast Cancer management for medicsl student.ppt
PPTX
Imaging of parasitic D. Case Discussions.pptx
PDF
Handout_ NURS 220 Topic 10-Abnormal Pregnancy.pdf
DENTAL CARIES FOR DENTISTRY STUDENT.pptx
Acid Base Disorders educational power point.pptx
Copy-Histopathology Practical by CMDA ESUTH CHAPTER(0) - Copy.ppt
Respiratory drugs, drugs acting on the respi system
genitourinary-cancers_1.ppt Nursing care of clients with GU cancer
Obstructive sleep apnea in orthodontics treatment
Note on Abortion.pptx for the student note
Deadly Stampede at Yaounde’s Olembe Stadium Forensic.pdf
Human Health And Disease hggyutgghg .pdf
post stroke aphasia rehabilitation physician
Medical Evidence in the Criminal Justice Delivery System in.pdf
RUHS II MBBS Microbiology Paper-II with Answer Key | 6th August 2025 (New Sch...
OPIOID ANALGESICS AND THEIR IMPLICATIONS
SKIN Anatomy and physiology and associated diseases
ACID BASE management, base deficit correction
CME 2 Acute Chest Pain preentation for education
Important Obstetric Emergency that must be recognised
Breast Cancer management for medicsl student.ppt
Imaging of parasitic D. Case Discussions.pptx
Handout_ NURS 220 Topic 10-Abnormal Pregnancy.pdf

O2 and co2-transport

  • 1. TRANSPORT OF OXYGEN AND CARBON DIOXIDE Speakers : Dr. Ravi Dr. Pratyush Moderator : Dr. Tapas Singh
  • 2. CONTENTS • INTRODUCTION • OXYGEN CASCADE • OXYGEN DELIVERY DURING EXERCISE • OXYGEN DELIVERY DURING CRITICAL ILLNESS • CARBON DIOXIDE TRANSPORT
  • 4. REQUIREMENTS FOR OXYGEN TRANSPORT SYSTEM Match O2 supply with demand
  • 5. MOVEMENT OF O2 DOWN CONCENTRATION GRADIENT
  • 6. OXYGEN CASCADE •Oxygen moves down the concentration gradient from a relatively high levels in air to that in the cell •The PO2 reaches the lowest level (4-20 mmHg) in the mitochondria •This decrease in PO2 from air to the mitochondrion is known as the OXYGEN CASCADE
  • 7. KEY STEPS IN OXYGEN CASCADE • Uptake in the lungs • Carrying capacity of blood • Delivery to capillaries • Delivery to interstitium • Delivery to individual cells • Cellular use of oxygen
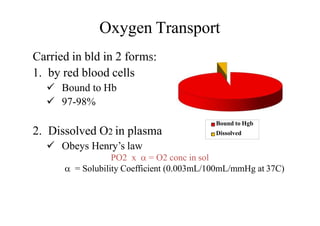
  • 8. Oxygen Transport ms:Carried in bld in 2 for 1. by red blood cells  Bound to Hb  97-98% 2. Dissolved O2 in plasma  Obeys Henry’s law PO2 x  = O2 conc in sol  = Solubility Coefficient (0.003mL/100mL/mmHg at 37C) Bound to Hgb Dissolved
  • 9. Hemoglobin • Fe porphyrin compound • Normal adult = HbA= 22 • Hb F= 22 • The  chains ↑ hb affinity to O2 • Each gm of Hb can carry up to 1.34ml of O2, Molecular weight of hemoglobin is 64,000
  • 10. CHEMICAL BINDING OF HEMOGLOBIN & OXYGEN • Hemoglobin combines reversibly with O2 • Association and dissociation of Hb & O2 occurs within milliseconds – Critically fast reaction important for O2 exchange – Very loose bond is formed between Fe2+ and O2, easily reversible • Oxygen carried in molecular state (O2) not ionic O2-
  • 11. Oxygen Saturation & Capacity • Up to four oxygen molecules can bind to one hemoglobin (Hb) • Ratio of oxygen bound to Hb compared to total amount that can be bound is k/a Oxygen Saturation • Maximal amount of O2 bound to Hb is defined as the Oxygen Capacity
  • 12. Arterial O2 Content (CaO2) • 97-98% Carried in Combination With Hb • 2-3% Dissolved in Plasma O2 CONTENT - The sum of O2 carried on Hb and dissolved in plasma CaO2 (ml/dL) = (SaO2 x Hb x 1.34) + (PO2 x0.003) • O2 content in 100 ml blood (in normal adult with Hb 15 gm/dl) ~ 20 ml/dl (19.4 ml as OxyHb + 0.3 ml in plasma)
  • 13. 50 If the PAO2 is ↑ed significantly (by breathing 100% oxygen) then a small amount of extra oxygen will dissolve in the plasma (at a rate of 0.003 ml O2/100ml of blood /mmHg PO2) but there will normally be no significant increase in the amount carried by haemoglobin
  • 14. Venous O2 content (CvO2) CvO2 =(SvO2 x Hb x 1.34) + (PvO2 x 0.003) ‒(normally-15ml/dl) • mixed venous saturation (SvO2 ) measured in the pul A represents the pooled venous saturation from all organs. • SvO2 influenced by changes in both DO2 and VO2 • Normally, the SvO2 is about 75%, however, clinically a SvO2 of about 65% is acceptable
  • 15. 16 Arterial-Venous Difference • The arterial-venous oxygen content difference is the difference between the CaO2 and the CvO2. • The normal C(a-v)O2 : 5 vol%. Factors that increase the C(a-v)O2: • decreased cardiac output • increased O2consumption • exercise • seizures • shivering • increased temp Factors that decrease the C(a-v)O2: • increased cardiac output • skeletal relaxation (drugs) • peripheral shunting • decreased temp
  • 16. O2 DELIVERY DO2 (ml/min) = Q x CaO2 N : 900 - 1,300 ml/min • Decreased oxygen delivery occurs when there is: – ↓ed cardiac output – ↓ed hemoglobin concentration – ↓ed blood oxygenation
  • 17. 18 O2 CONSUMPTION • The amount of oxygen extracted by the peripheral tissues during the period of one minute is called oxygen consumption or VO2. (N- 200-300ml/min) VO2 = Q x (CaO2 - CvO2) x 10 • O2 consumption is commonly indexed by the patients body surface area (BSA) and calculated by: – VO2 / BSA – Normal VO2 index is between 110 – 160ml/min/m2
  • 18. 19 OXYGEN EXTRACTION RATIO • The oxygen extraction ratio (O2ER) is the amount of oxygen extracted by the peripheral tissues divided by the amount of O2 delivered to the peripheral cells. • Index of efficiency of O2 transport • aka: Oxygen coefficient ratio & Oxygen utilization ratio – O2ER = VO2 / DO2 – Normally ~ 25% but  to 70-80% during maximal exercise in well trained athletes
  • 19. Factors that affect O2ER •Decreased with: •Increased Cardiac Output •Skeletal Muscle Relaxation •Peripheral Shunting •Hypothermia •Increased Hemoglobin •Increased PaO2 •Increased with: •Decreased CO •Increased VO2 •Exercise •Seizures •Shiveri.ng •Hyperthermia •Anemia •Low PaO2
  • 20. O2 DIFFUSION FROM INTERSTITIUM TO CELLS Intracellular PO2 < Interstitial fluid PO2 • O2 constantly utilized by the cells • Cellular metabolic rate determines overall O2 consumption N PcO2 ~ 5-40 mm Hg (average 23 mmHg) N intracellular req for optimal maintenance of metabolic pathways ~ 3 mm Hg
  • 21. Pasteur point –  critical mitochondrial PO2 below which aerobic metabolism cannot occur  1.4 – 2.3mmHg
  • 22. OXYGEN DISSOCIATION CURVE  Sigmoid Shaped  The amount of oxygen that is saturated on the hemoglobin (SO2) is dependent PO2.  Amount of O2 carried by Hb rises rapidly upto PO2 of 70mmHg but above that curve becomes flatter.  Combination Of 1st Heme with O2 increases affinity of 2nd Heme and so on
  • 23. Steep Portion of Curve • “Dissociation Portion” of curve. • Between 10 and 60 mm Hg. • Small increases in PO2 yield large increases in SO2. • At the tissue capillary, blood comes in contact with reduced tissue PO2 and oxygen diffuses from the capillary to the tissue.
  • 24. Flat Portion of Curve • “Association Portion” of curve. • Greater than 60 mm Hg. • Large increases in PO2 yield small increases in SO2. • At the pulmonary capillary, blood comes in contact with increased alveolar PO2 and oxygen diffuses from the alveolus to the capillary. As the PO2 rises, oxygen binds with the hemoglobin (increasing SO2). • Very little rise in oxygen saturation above 100 mm Hg of PaO2.
  • 25. P50 • The partial pressure of oxygen in the blood at which the haemoglobin is 50% saturated, is known as the P50. • The P50 is a conventional measure of haemoglobin affinity for oxygen • Normal P50 value is 26.7 mm Hg • As P50 increases/decreases, we say the “curve has shifted”. – P50 less than 27: Shift to the left. – P50 greater than 27: Shift to the right.
  • 26. Factors affecting Dissociation BLOOD TEMPERATURE • increased blood temperature • reduces haemoglobin affinity for O2 BLOOD Ph • lowering of blood pH (making blood more acidic) • caused by presence of H+ ions from lactic acid or carbonic acid • reduces affinity of Hb for O2 CARBON DIOXIDE CONCENTRATION • the higher CO2 concentration in tissue • the less the affinity of Hb for O2
  • 28. Bohr Effect • By Christian Bohr in 1904 • The effect of CO2 on the OHDC is known as the Bohr Effect • High PCO2 levels and low pH decrease affinity of hemoglobin for oxygen (a right-ward shift). • This occurs at the tissues where a high level of PCO2 and acidemia contribute to the unloading of oxygen.
  • 29. Bohr effect – the effect of [CO2] on haemoglobin 100% % saturation of haemoglobin partial pressure of O2 (mmHg) Lower [CO2] e.g. in lung ► curve shift to the left ► haemoglobin has a higher affinity to O2 Higher [CO2] e.g. tissue cells ► curve shift to the right ► haemoglobin has a lower affinity to O2
  • 30. pH & pO2: BOHR EFFECT
  • 31. IMPLICATIONS OF BOHR EFECT • Enhance oxygenation of blood in lungs and to enhance release of O2 in the tissues • In lungs, CO2 diffuses out of the blood (H+ conc )  Shift of O2-Hb curve to left O2 bound to Hb   O2 transport to tissues. • In tissue capillaries,  CO2 and  H+  greater release of O2 due to less avid binding of O2 to Hb.
  • 32. DOUBLE BOHR EFFECT • Reciprocal changes in acid - base balance that occur in maternal & fetal blood in transit through the placenta FETAL BLOOD Loss of CO2 MATERNAL BLOOD Gain of CO2 Rise in pH Fall in pH Leftward shift of ODC Rightward shift of ODC
  • 33. Oxygen dissociation curve: Foetal VS Maternal % saturation of haemoglobin Maternal partial pressure of O2 (mmHg) → Foetal haemoglobin has higher affinity to O2 so as obtain O2 from maternal blood in the placenta. Foetal
  • 34. ROLE OF 2,3 DPG(diphosphoglycerate) 2,3 DPG is an organic phosphate normally found in the RBC Produced during Anaerobic glycolysisin RBCS
  • 35. 2,3 DPG • Tendency to bind to β chains of Hb and thereby decrease the affinity of Hemoglobin for oxygen. • HbO2 + 2,3 DPG → Hb-2,3 DPG + O2 • It promotes a rightward shift and enhances oxygen unloading at the tissues. • This shift is longer in duration than that due to [H+], PCO2 or temperature.
  • 36. 2,3 DPG – Cellular hypoxia. – Anemia – Hypoxemia secondary to COPD – Congenital Heart Disease – Ascent to high altitudes • The levels increase with • The levels decrease with – Septic Shock – Acidemia – Stored blood • No DPG after 2 weeks of storage.
  • 37. EFFECTS OF 2,3-BPG ON STORED BLOOD • In banked blood , the 2,3-BPG level falls and the ability of this blood to release O2 to the tissues is reduced.
  • 38. Effects of anemia & CO on the oxyhemoglobin dissociation curve Anemia • ↓OCC of blood & O2 content; • SaO2 remains normal Carbon Monoxide [CO] • affinity of Hb for CO is 250 fold relative to O2 competes with O2binding • L shift- interfere with O2 unloading at tissues • severe tissue hypoxia • sigmoidal HbO2 curve becomes hyperbolic CHANGE THE SHAPE OF OHDC
  • 39. Oxygen dissociation curve: Haemoglobin VS Myoglobin partial pressure of O2 (mmHg) → Myoglobin stores O2 in muscles and release it only when the O2 partial pressure is very low. Myoglobin Haemoglobin % saturation of haemoglobin Myoglobin has an increased affinity for O2 (binds O2 at lower Po2)
  • 41. O2 DELIVERY DURING EXERCISE • During strenuous exercise VO2 may  to 20 times N • Blood also remains in the capillary for <1/2 N time due to  C.O. O2 Sat not affected • Blood fully sat in first 1/3 of N time available to pass through pul circulation
  • 42. • Diffusion capacity  upto 3 fold since: 1.Additional capillaries open up  no of capillaries participating in diffusion process 2. Dilatation of both alveoli and capillaries   alveolo-capillary distance 3.Improved V/Q ratio in upper part of lungs due to  blood flow to upper part of lungs
  • 43. Shift of O2-Hb dissociation curve to right because of: 1.  CO2 released from exercising muscles 2.  H+ ions   pH 3.  Temp 4. Release of phospates   2,3 - DPG
  • 45. OXYGEN DELIVERY IN CRITICAL ILLNESS • Tissue hypoxia is due to disordered regional distribution of blood flow • often caused by capillary microthrombosis after endothelial damage and neutrophil activation rather than by arterial hypoxaemia
  • 46. OXYGEN STORES • o2 stores are limited to lung and blood. • The amount of O2 in the lung is dependent on the FRC and the alveolar concentration of oxygen. • Breathing 100% oxygen causes a large increase in the total stores as the FRC fills with oxygen • This is the reason why pre-oxygenation is so effective.
  • 47. THE EFFECTS OF ANAESTHESIA • The normal protective response to hypoxia is reduced by anaesthetic drugs and this effect extends into the post-operative period. • Following induction of anaesthesia : FRC ↓ • V/Q mismatch is ↑ed • Atelectasis develops rapidly • This 'venous admixture' increases from N 1% to around 10% following induction of anaesthesia.
  • 48. THE EFFECTS OF ANAESTHESIA • Volatile anaesthetic agents suppress hypoxic pulmonary vasoconstriction. • Many anaesthetic agents depress CO and therefore ↓ O2 delivery. • Anaesthesia causes a 15% ↓ in metabolic rate and therefore a reduction in oxygen requirements. • Artificial ventilation causes a further 6% ↓ in oxygen requirements as the work of breathing is removed.
  • 49. Pulmonary Shunting • PERFUSION WITHOUTVENTILATION. • Pulmonary shunt is that portion of the cardiac output that enters the left side of the heart without coming in contact with an alveolus. – “True” Shunt – No contact • Anatomic shunts (Thebesian, Pleural, Bronchial) • Cardiac anomalies – “Shunt-Like” (Relative) Shunt • Some ventilation, but not enough to allow for complete equilibration between alveolar gas and perfusion. • Shunts are refractory to oxygen therapy.
  • 50. VenousAdmixture • Venous admixture is the mixing of shunted, non-reoxygenated blood with reoxygenated blood distal to the alveoli • resulting in a reduction in: – PaO2 – SaO2 • Normal Shunt: 3 to 5% • Shunts above 15% are associated with significant hypoxemia
  • 52. INTRODUCTION TO PHSYIOLOGY OF CO2 TRANSPORT • end-product of aerobic metabolism. – production averages 200 ml/min in resting adult – During exercise this amount may increase 6x • Produced almost entirely in the mitochondria. • Importance of co2 elimination lies in the fact that -Ventilatory control system is more responsive to PaCO2 changes.
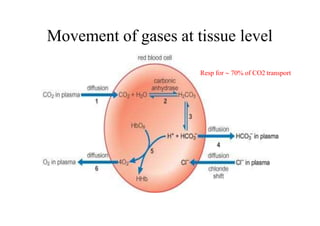
  • 53. • Carbon dioxide is transported in the blood from the tissue to the lungs in 3 ways: (i) dissolved in solution; (ii) buffered with water as carbonic acid; (iii) bound to proteins, particularly haemoglobin. • Approximately 75% of carbon dioxide is transport in the red blood cell and 25% in the plasma attributable to – lack of carbonic anhydrase in plasma – plasma plays little role in buffering and combination with plasma proteins is poor.
  • 54. Dissolved carbon dioxide • Carbon dioxide is 20 times more soluble than oxygen; • obeys HENRY’S LAW, which states that the number of molecules in solution is proportional to the partial pressure at the liquid surface. PCO2 x  = CO2 conc in sol  = Solubility Coefficient Value dependant upon temp (inversely proportional)  more temp lesser amount of CO2 dissolved. • The carbon dioxide solubility coefficient is 0.69 ml/L/mm Hg at 37C.
  • 55. • At rest, contribution of dissolved CO2 to total A-V CO2 conc diff only 10%. In absolute terms only 0.3 ml of CO2/dL transported in dissolved form • During heavy exercise contribution of dissolved CO2 can  7 fold  1/3 of total CO2 exchange
  • 56. CO2 BOUND AS HCO3 •Dissolved CO2 in blood reacts with water to form CarbonicAcid •CO2 + H2O  H2CO3 Carbonic acid dissociates into H+ & HCO3 H2CO3  H + HCO3 When conc of these ions inc in RBCs, HCO3 diffuses out but H+ can’t easily do this because cell memb is relatively impermeable to cations. Thus to maintain electrical neutrality, Cl- ions move into cell from plasma [ CHLORIDE SHIFT]
  • 57. Movement of gases at tissue level Resp for  70% of CO2 transport
  • 58. • Most of H+ combine with Hb because reduced Hb is less acidic so better proton acceptor • This fact that deoxygenation of the blood inc its ability to carry CO2 is known as HALDANE EFFECT. • As a result of the shift of chloride ions into the red cell and the buffering of hydrogen ions onto reduced haemoglobin, the intercellular osmolarity increases slightly an →→ water enters causing the cell to swel →→ an increase in mean corpuscular volume (MCV).. • Hematocrit of venous blood is 3%>arterial • Venous RBC are more fragile • Cl content of RBCs V>A
  • 59. CO2 BOUND AS CARBAMATE • 15-25% of total CO2 transport • CO2 reacts directly with terminal amine group of Hb to form the carbaminoHb (Hgb.CO) • Reversible Reaction • Amount of CO2 bound as carbamate to Hb or plasma proteins depends on: 1) O2 Sat of Hb 2) H+ conc  During passage of blood through muscle & tissues, O2 Sat and H+ conc change considerably, in particular during exercise.
  • 60. Reduction of Hb ( oxygenation of heme)   basicity of Hb   H+ binding to reduced Hb   dissociation of H2CO3   carriage of CO2 as HCO3 TISSUES
  • 61. Oxygenation of Hb   acidity of Hb    tendency to combine with CO2 to form Hgb.CO  Displacement of CO2 from Hb   H+ binding to Hb   Release of H+ from Hb   formation of H2CO3   release of CO2 LUNGS
  • 62. CARBON DIOXIDE DISSOCIATION CURVE •carbamino hb is much affected by the state of oxygenation of Hb than by the PCO2. •Lower the saturation of Hb with O2 , larger the CO2 conc for a given PaCO2 •CO2 curve is shifted to right by increase in SpO2
  • 63. • CO2 content rises throughout the increase in partial pressure. • O2content rises more steeply until a point at which the hb is fully saturated. After that, the increase is small because of the small increased amount in solution. • Consequently, the CO2 curve is more linear than the O2Hb dissociation curve. • Graph illustrates the difference between the content in blood of oxygen and carbon dioxide with change in partial pressure.

Editor's Notes

  • #7: The oxygen cascade describes the process of declining oxygen tension during its passage from atmosphere to mitochondria
  • #16: Vol % means millilitre of a substance dissolved in 100 ml of another substance say blood ,decreased cardiac output increases the arterial venous difference bacoz if the oxygen consumption of body is constant then the oxygen extraction from the blood must be increased at lower cardiac output
  • #17: Q=45dl/min to to 67 dl/min CaO2= 20ml/dl
  • #18: Multiplier of 10 is used to convert cao2-cvo2 from ml/dl to ml/L
  • #23: binding of the first oxygen molecule induces a conformational change of hemoglobin that increases the affinity for the remaining three oxygen molecules.