Obtain Keen Insights with Dashboards
Download as PPTX, PDF0 likes318 views

The document discusses the purpose and effectiveness of dashboards as data visualization tools that help organizations track key metrics. It highlights common reasons dashboards fail, such as inaccurate data and lack of user training, and emphasizes the importance of building useful and purposeful dashboards tailored to specific business needs. Additionally, it outlines a five-step process for creating the right dashboard to ensure data-driven decision-making within the organization.


Obtain Keen Insights with Dashboards
- 1. WWW.MAXIMIZER.COM © 2015 Maximizer Software Inc. Obtain Keen Insights with Dashboards
- 2. WWW.MAXIMIZER.COM © 2015 Maximizer Software Inc. Presenters David Costin Solutions Architect Denis Adeshelidze Solutions Architect
- 3. WWW.MAXIMIZER.COM © 2015 Maximizer Software Inc. • What Are Dashboards? • Why Dashboards Fail • Building the Right Dashboard • How Maximizer Uses Dashboards Agenda
- 4. WWW.MAXIMIZER.COM © 2015 Maximizer Software Inc. What Are Dashboards?
- 5. WWW.MAXIMIZER.COM © 2015 Maximizer Software Inc. • A data visualization tool that displays the current status of metrics and KPI’s for an organization • Metrics often include sales, marketing, support and other departments • Allows for the quick and easy digestion of the information allowing you to make better decisions faster What Are Dashboards?
- 6. WWW.MAXIMIZER.COM © 2015 Maximizer Software Inc. What Are Dashboards?
- 7. WWW.MAXIMIZER.COM © 2015 Maximizer Software Inc. The Key Characteristics of Dashboards are: • Fits onto one screen, makes it simple to view more complex data points • Primarily used to find trends and outliers and anomalies within data • Highly interactive and usually provides functionality like filtering and drill downs What Are Dashboards?
- 8. WWW.MAXIMIZER.COM © 2015 Maximizer Software Inc. What Are Dashboards?
- 9. WWW.MAXIMIZER.COM © 2015 Maximizer Software Inc. Why Dashboards Fail
- 10. WWW.MAXIMIZER.COM © 2015 Maximizer Software Inc. Why Dashboards Fail A Dashboard Can Help You Communicate Your Data Effectively. A Dashboard Cannot help you communicate your data effectively if you don’t know how to build it. Typical Mistakes: • Inaccurate data • Metrics that lack relevance • Uncertain search parameters • Lack of descriptive labels • No user training • Low accessibility
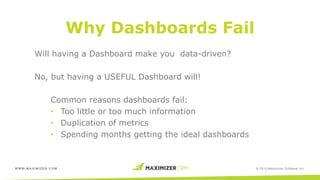
- 11. WWW.MAXIMIZER.COM © 2015 Maximizer Software Inc. Why Dashboards Fail Will having a Dashboard make you data-driven? No, but having a USEFUL Dashboard will! Common reasons dashboards fail: • Too little or too much information • Duplication of metrics • Spending months getting the ideal dashboards
- 12. WWW.MAXIMIZER.COM © 2015 Maximizer Software Inc. Why Dashboards Fail
- 13. WWW.MAXIMIZER.COM © 2015 Maximizer Software Inc. Importance of Building the Right Dashboard
- 14. WWW.MAXIMIZER.COM © 2015 Maximizer Software Inc. Importance of Useful Dashboards A useful dashboard is designed to help you understand the data that is relevant to you. Most importantly it needs to do this at a glance.
- 15. WWW.MAXIMIZER.COM © 2015 Maximizer Software Inc. Importance of Useful Dashboards Useful Dashboards have the following: • Have a clearly defined purpose • Target audience aware • Help your brain digest data easily • Provide insights into what’s happening in your business at any moment. • The right amount of data to make informed decisions • Time bound so you can react quickly to change • A tool for getting your team on the same page
- 16. WWW.MAXIMIZER.COM © 2015 Maximizer Software Inc. Building the Right Dashboard
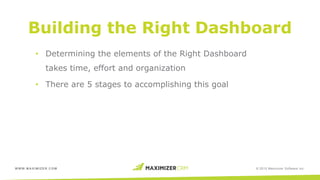
- 17. WWW.MAXIMIZER.COM © 2015 Maximizer Software Inc. Building the Right Dashboard • Determining the elements of the Right Dashboard takes time, effort and organization • There are 5 stages to accomplishing this goal
- 18. WWW.MAXIMIZER.COM © 2015 Maximizer Software Inc. Building the Right Dashboard Step #1 - Identification • You have realized the need to be data-driven • Identify what you need to do to become driven by data metrics • Make a plan
- 19. WWW.MAXIMIZER.COM © 2015 Maximizer Software Inc. Building the Right Dashboard
- 20. WWW.MAXIMIZER.COM © 2015 Maximizer Software Inc. Building the Right Dashboard Step #2 - Implementation • Dashboards built • Understand what the data is telling you • Set up processes and tools • Expand your dashboards
- 21. WWW.MAXIMIZER.COM © 2015 Maximizer Software Inc. Building the Right Dashboard Step #3 – Information Overload • Dashboards are a success! • Teams and individuals are creating them • Hard to see the forest for the trees • Time to review and prune • Focus on your business goals
- 22. WWW.MAXIMIZER.COM © 2015 Maximizer Software Inc. Building the Right Dashboard Step #4 - Organization • You have identified your business goals and key metrics • Your organization is aligned to these goals • There are no clear owners for each metrics • Uncertainty as to when or how they should act upon them
- 23. WWW.MAXIMIZER.COM © 2015 Maximizer Software Inc. Building the Right Dashboard Step #5 - Alignment • There is complete alignment of how data is driving your organization • You fully understand how that data can help you achieve success • Finally you are a data-driven organization • Remember to review your metrics regularly
- 24. WWW.MAXIMIZER.COM © 2015 Maximizer Software Inc. How Maximizer Uses Dashboards
- 25. WWW.MAXIMIZER.COM © 2015 Maximizer Software Inc. How Maximizer Uses Dashboards Top Level – CEO • Health of the Business • Forward looking KPIs – not lagging KPIs • Ask intelligent questions to LOB Multiple Levels • Director Level – Pipeline • Manager Level – Lead Conversion/ Marketing Nurture • Rep Level – Forecast/Revenue/Commissions
- 26. WWW.MAXIMIZER.COM © 2015 Maximizer Software Inc. Top Level KPI - USERS
- 27. WWW.MAXIMIZER.COM © 2015 Maximizer Software Inc. How do you find out ? • Check your leading KPIs – take actions to see if results not what is expected. • Ask more questions and assign people to take actions. Collaborate
- 28. WWW.MAXIMIZER.COM © 2015 Maximizer Software Inc. Marketing Top Lead Source KPI
- 29. WWW.MAXIMIZER.COM © 2015 Maximizer Software Inc. Further Analysis
- 30. WWW.MAXIMIZER.COM © 2015 Maximizer Software Inc. Manager Level
- 31. WWW.MAXIMIZER.COM © 2015 Maximizer Software Inc. Director Level Analysis
- 32. WWW.MAXIMIZER.COM © 2015 Maximizer Software Inc. Rep Level
- 33. WWW.MAXIMIZER.COM © 2015 Maximizer Software Inc. How Maximizer Uses Dashboards For the User: • An economical incentive to migrate to cloud. • Recognize their original investment in Maximizer. For Us: • Address the “churn” at the end of Year 1. • Accelerate the pace of users on subscription. • Migrate our On-Premise “Thick Client” users to Cloud. Questions
Editor's Notes
- #6: Dashboards are great tools for understanding what is going on with your car, plane or more importantly in this presentation, your business. They display key performance indicators (or KPIs) that tell you what is happening. In the instance of a vehicle this would be speed, engine RPM or temperature while your business dashboards will focus on metrics in sales, marketing, support and other areas. Examples would be pipeline, opp/close ratios, leads, web visits as well as cases resolved or escalated. At the end of the day the performance of any dashboard is how quickly it allows you to digest information and make great decisions.
- #7: A pilot only needs a few indicators to fly a plane, the same is true for your business. Figure out what is truly important in the various areas of your business and start tracking them. If you are closing $100K in business a month and want to grow by 20%, what actions do you believe you need to take to get there? Do you need more web visitors, improve the number of leads coming from your website, follow-up on leads faster, improve your sales process, provide better customer service or a combination and to what degree? Set targets in the important areas and track them on dashboards.
- #8: So what makes a dashboard good? Well there are several key areas that we will examine later but for now we can keep it high level. Most important the dashboard indicators need to fit on one screen and make it simple to understand even complex data. The critical role a dashboard plays is to allow you to see if you are on track or there are any anomalies and outliers in your business data. Interactive dashboards give you the ability to drill down to other dashboards, or to the underlying data set, so you can easily investigate and determine the nature of any anomalies.
- #9: During this presentation we will look at a few good dashboards from different functional areas. Let’s start by looking at a Customer Service dashboard and what makes it work. There are enough indicators to show the overall health of the customer service team but not so many that you or anyone else would have trouble digesting the information. A support manager is going to want to know if the number of cases is rising or falling and where the overall case load stands. In addition they will want to see if any customers are experiencing more trouble than others and how the reps are performing. Finally what cases are overdue and it even picks up on cases that have not been assigned, maybe that is why that one is overdue. In the next section we will examine why dashboards fail and how to identify the problems before the creep in.
- #11: So why do dashboards fail? Typically it starts long before the dashboard is created with the lack of data input, or the entry of incorrect data. Organizations who intend to use dashboards need to examine their data and clean it up as necessary. And to prevent any future problems best practices need to be put in place to ensure users know what and when to enter data. Next you see people rush out to create dashboards just for the sake of it and this often leads to two problems, metrics that have no real meaning to users and indicators that display data based on dodgy searches. For instance you may be driving to increase average deal size now but are still displaying metrics from a previous campaign to push certain product lines. And even if you have the right metrics, are you pulling on reliable information? For instance if your accounting program is the system of record for all things financial, is the data making it correctly into your CRM or dashboard software? If not you are likely not getting a true picture. Let’s say you have the right indicators and data, but nobody else nobody else knows how to read your dashboards due to bad labels, incorrect formatting or lack of training, then you cannot effectively communicate this knowledge to your company. Last but not least accessibility is key. Many organizations take the approach of restricting data and this is reflected in their dashboards. That means very little data is available and very few people have access. Many fear that employees will see more than they should and might spread it accidentally. This is where training comes back into the picture. Train them where to find the dashboards, how to use them, even create their own and very importantly what information can be shared (if any) out side the organization.
- #12: Does having dashboards make you data driven? No, but having useful ones will. Useful dashboards allow you to quickly take in the information, make decisions quickly and act on them immediately. Having these dashboards accessible means you can point to problems or opportunities exposed by the indicators, and without any extra effort everyone can see the data themselves. We will get more into what makes an effective dashboard later for now let’s examine some more traits of a less than useful dashboard. Far too often you will see a dashboard with only one indicator or 20 of them. Neither is good because a single indicator is unlikely to give the user enough of a view to make decisions while too many indicators ends up being confusing and hard to process. We will see an example of this in the next slide. Duplication of metrics can be a problem for a few reasons. There may be times when having the same metric on two dashboards is justified but be very careful. For instance both sales and customer service want access to the key customer satisfaction indicator on their group dashboards. This makes sense as long as the indicators are labelled the same and use the same search parameters. Failing to do this can lead to confusion on the part of users as to what the indicator is showing or worse yet each indicator is using a different search resulting in inconsistent data being displayed. A major reason people lose interest in dashboards is they never reach a critical mass due to delays in getting them going. Start small (for instance one group at a time) and with just a minimum set of KPIs. Once that is working you can expand to other teams and additional indicators. Better yet work with your software vendor’s services team to help you define your dashboards and create the initial sets for you.
- #13: Far too often I see dashboards such as this one. How many problems can you spot? Just a few problems with this one: First off there are too many indicators The dashboard is not presented in a logical manner Many indicators are empty. Could be due to bad searches or missing data from other systems Bad and inconsistent scaling make it harder to read Some of the indicators appear to be show duplicate or similar data Wrong data – how could the pipeline be $179 million for the month yet $0 for the quarter? Even if it was correct the information cannot be taken in easily What is this dashboard supposed to be telling me or anyone else? What decisions can I possibly make from it? Now that we have seen the bottom of the barrel, the next section will provide insights into how to create great dashboards.
- #15: You know you have a great dashboard when it is showing you the way like a strong beacon in the night. It highlights your strengths and weaknesses as well as your successes and failures. The data shows you exactly where you business is at and you can digest it at a glance. Best yet you can make sounds decisions based on this information and act on them quickly.
- #16: Earlier we took a high level view of what is important in a dashboard and now it is time to expand the list before we look into the process of creating a dashboard. It is really important to have a dashboard’s purpose is clearly defined so it displays the right data. Without this dashboards are often confusing and can even turn off employees from using them. Determining what data is shown is linked to the target audience. Are the primary users of the dashboard executives, managers or regular employees? What department are they in (sales, marketing, support, accounting) and what do they want to get out of the dashboard (operational, strategic or analytical data)? Once that is determined what format and types of indicators are going to help users digest the information quickly. A well designed dashboard provides key insights into your business in real-time, while a poor one leaves you in a fog or gives you information that is not actionable. When you are developing the dashboard ask yourself what data do I need to make decisions and formulate actions for my company, team or individual employees? Keep the time frames in perspective and consistent. For instance how quickly can a trend emerge and for you to formulate a reaction to it? Once you have acted how long before you are back on track? If this is fairly short on the order of days or weeks, does it make sense to see the 5-year based data on the same dashboard? Finally a good dashboard will bring your team together especially if it is tied to clearly defined objectives and allows users to instantly see how they are doing against them.
- #17: Before we go any further does anyone know what is in the picture in the upper left? The other images are a hint. If you do not it is the earliest form of a dashboard otherwise known as a stock ticker. Not much of a dashboard actually as it was just a sequential series of numbers and characters to tell you only the current price of your stocks. Not only did it tell you about your stocks, but every stock on the exchange. As technology evolved stock numbers were displayed on huge boards at the stock exchange using different colors to indicate positive or negative movement among other things. It was way better than the stock ticker but you still had to wade through the data to find your stocks. It was also better than before as you began to see supplementary data but it was still very limited. Today there are a wide variety of ways to see your stocks value, performance, trends and other factors. You get to select the parameters that matter to you and can focus the display on your stocks of interest. When it comes to dashboards you need to start somewhere. The remainder of this section will provide you with the 5 major steps you need to follow for success. If used effectively you will likely look back on your initial foray into dashboards and see them much like the stock ticker.
- #18: Now that we know the basic rules for creating dashboards we can examine the 5 main steps to making them a reality. I wish I could tell you that it is simple, easy and quick, but alas it is going to take some time and effort to get your dashboards up and running as well as creating a data driven organization.
- #19: Let’s say you are looking at last year’s results and you are not happy. Hind sight is always 20/20 and as you take a deeper dive in the data you realize where things went wrong and you ask yourself, how could I have seen this coming sooner and what could I have done about it? All the data was there during the course of the year, you just did not have easy access to it. This is how many firms realize they need to become data driven. So what does it mean to be data driven? Many think displaying the Revenue YTD in an indicator makes them data driven, wrong. If it is just a number on its own how do I know if it is good or bad, or even if you are on track? Along with it you need to know the target for the year and other key performance metrics that will allow you to make the necessary course corrections. What does it take to be data driven? First you have to figure out what metrics you need to measure and watch them to steer your business in the right direction. Some are obvious while others will take some time to figure out and ultimately some will change with time as your business evolves. Do not agonize over getting all of the right ones the first time around, start small with the KPIs you know are important. Then make a plan to get the dashboards, searches, training and other activities completed so you can drive your business to greater success.
- #20: Okay I know what you are thinking he said, make a plan. Doing so does not have to be a torturous process. Again you are trying to start small and build up or skills. Grab a whiteboard, business challenges and figure out what you need. Also you do not need to do it alone. Get training, work with your software vendor or ask advice from others who have successfully implemented dashboards.
- #21: You have got the first phase of the dashboard project complete and users are able to see one or several dashboards with relevant indicators on them. As users become familiar with the dashboards they will be able to see how their efforts contribute to those metrics. Now the real work begins. When you set out on your dashboard project you wanted to see how your business is doing and you selected a number of metrics to do it. Now that you are visually tracking your data and analyzing it, what does it say? Does it match your expectations or is it painting a completely different picture? What can you or should you do about it? For example you see a number of indicators that are in line with your beliefs about your business. Maybe revenue and profit are spot on but you see that your customer lifetime value is increasing quickly but you are not able to attract new customers. This is of concern so you need to focus on how to maximize the success on the lifetime value front while you figure out how to get more customers. You can help with these efforts by figuring out what is driving the two factors and create additional dashboards to help you see what is happening in each area. Your business activities and strategies will be reflected in the dashboard results and you can quickly see if they are working or not.
- #22: I wish every business (or any for that matter) could skip this stage but it comes and can derail a dashboard implementation. The best way to put it is, if you want a healthy garden you are going to have to pull some weeds. Dashboards are a success and your employees are eagerly creating them. They are adding new dashboards as well as additional indicators to existing ones. Likely they will get carried away and you will get information overload or a plethora of dashboards making it difficult to find what you need. Remember that ugly dashboard I showed you earlier? I am sure that nobody starts out specifically creating that dashboard, but never the less it evolved over time. So now and periodically in the future you are going to need to review your dashboards, makes sure they are still relevant, free from clutter and are focused on your business goals.
- #23: You have pulled the dashboard weeds and you are seeing your organization benefit from them but something is still not completely right. The problem is typically due to lack of ownership. Up until now the dashboard effort has been about measuring, understanding and acting on the data. This is all good but is everyone in the organization interpreting the data in the same way and are they acting in concert with each other? An example of this is the drive to have low inventory. The operations team is all about just in time delivery but the sales department is frustrated because new customers have to wait to get their first shipment so they end up going somewhere else. While it is logical for the operations team to be the primary owner of the inventory metrics, they must include other functional groups who may be impacted by their actions. Doing so will allow the operations team to meet their objectives without impacting the adoption of new customers.
- #24: Your dashboards are up and running effectively so you can easily measure and analyze your data. The organization has embraced dashboards and everyone has a clear understanding what the number mean. Further more they are working in cross-functional groups to ensure that everyone is moving in the same direction and that certain goals are not being met at the expense of others. So what is next on your path to being a data driven organization? Nothing, you are already there all you need to do is keep up the good work. That means you need to change the metrics and dashboards as the organization evolves, market forces change and new targets are set. You also have to go back to step #3 periodically to make sure your business garden comes to fruition. Up until now I have given a number of typical examples of how to use dashboards effectively. I will now hand it over to Patrick to show how Maximizer uses dashboards to transform and grow our business.
- #26: CEOs and Owners of any business need to be able to see their business in a simple way that enables them to get ahead of changes or respond dynamically as their company’s environment changes. Intelligent questions raise better performance by all areas of the business. Service Level Agreements can be validated. Key is to make sure you are looking at KPIs that are meaningful towards company performance before it has already happened. Each person/department will have Key Performance Indicators that directly measure their performance and contribution towards the company’s success. A dashboard simply provides a visualization to quickly assess if the situation is above or below a benchmark determined by the business. Usually a Dashboard is a beginning of a performance loop to help an organization determine if its actions (investment of resources) is producing the desired results. In Maximizer a dashboard is often derived from an advanced search that an individual creates to answer a performance related question.
- #27: For a CRM software supplier like Maximizer the company is centric on making customers successful. One key measure of this is the number of users across different segments of the business. Our CEO pays close attention to things like Customer Life Time Value, Churn Analysis and Total Number of Users across different time horizons. This dashboard is a mock up example of how he keeps a daily pulse of the number of users per segment and can ask his management team at any given time as to discrepancies or new trends in the data he explores. For example he might ask his Director of Sales why there is no Base Customer sales (albeit early in the new month) as it contrasts quite differently over last month (or YOY). Our CEO utilizes our CRM to assign tasks to make sure action is taken before something goes too far off course.
- #28: As the Director of Sales – I will have pre-defined DBs to help monitor the health of the Revenue of the business and determine where time and resources need to be focused. I also can look at a question like Month over Month sales deltas in several different ways – is there an issue with the marketing engine (marketing automation lead flow like HubSpot that is fully integrated into Maximizer)? Are there enough Trials per customer segment? Are there other situational specific reasons for this irregular result? Should I be concerned or is it just a temporary abnormality. I can ask my team managers to further investigate on a rep per rep basis…
- #29: The CRM Trial DB can quickly tell me if there is a problem with the pipeline or a trend of monthly sales (not actual deals closing this week which is a different question). A thermometer or dial is an instantaneous way to see if there enough levels of activity recorded in the system. I can drill down on any of these Dashboard components and get into the Customer Segment and deal specific data based on a properly constructed DB. The scenario here is Revenue focused but this could easily be a product quality control or a CS case management one with multiple KPIs that are linked to each other.
- #30: Another view reveals that there are many Trials for Base still ongoing with three that expire today – which could be a decent partial answer to the CEO’s question that Base licensing is not off track yet. But maybe a request for the Manager to check with the reps and their forecast to confirm if there is revenue coming for this group might make sense.
- #31: The Manager of the Base Team will drill into Dashboards she has pre defined to give her confidence in her team’s ability to deliver the pipeline and revenue expected by the Management Team. She will check on whether the reps are converting leads into Opportunities and one possible outcome might be to identify that a larger than normal % of the leads are not actual leads but Customer Service requests related to a recent Service Announcement out to the customer base. The speed of Lead follow up is also critical for most companies in this Customer is King economy. The need to monitor lead status and the manager to be able to ask the reps for lead progression is a way of improving the health of a company’s pipeline. A marketing nurture program is another way for companies to not lose valuable prospect interest and help them along the buying process journey with an effective/timely hand off by sales and marketing.
- #32: This is an example of a dashboard that was created by a question in a management meeting about average deal size per month. Keeping a view on this allows the Director to see trends and also individual performance in alternative ways to grow the business and allocate resources. I find the most powerful and useful dashboards are the simplest ones that often get refined over use to make the purpose of the dashboard be very specific. The ones combining KPIs are often the ones that are inaccurate or confusing for exactly this reason.
- #33: The Dash boarding capability in Maximizer is available to all levels. The reps often use the dashboards to alert them every morning for leads and for an annual pipeline view of their business. The Best Dash Boards are planned for a specific view/use by a CRM user. Hiring an expert saves trial & error effort on the first views created. Once you have a core KPI outlined and how this metric will be found and used then the design of the dashboard (how best to visualize it against benchmark) can be accomplished. It is really important you can see what is good/acceptable/or above/below target. You can set up indicators to access Address Book information in the following ways: • Saved searches – You can link indicators with existing searches in the search catalog. The indicator reports either the number of entries returned in the search or a calculation based on fields in the entries. • SQL metrics – Your administrator can set up SQL queries that report on any information in your Address Book. While they are defined in Administrator, you can add any of these metrics to your dashboard indicators in Maximizer. • Filters – You can specify filters for activities and quotas and return information on the entries that match the filters. You can filter information by date, assigned users or teams, and values of specific fields in appointments and tasks.