SlideShare a Scribd company logo
EUROPEAN
DATA PORTAL
Open Data Maturity
Report 2019
OPEN DATA MATURITY REPORT 2019 2
The European Data Portal is an initiative of the European Commission, implemented with the support
of a consortium led by Capgemini Invent, including Intrasoft International, Fraunhofer Fokus, con.terra,
Sogeti, 52North, Time.Lex, the Lisbon Council, and the University of Southampton. The Publications
Office of the European Union is responsible for contract management of the European Data Portal.
For more information about this report, please contact:
European Commission
Directorate-General for Communications Networks, Content and Technology
Unit G.1 Data Policy and Innovation
Daniele Rizzi - Policy Officer
Email: Daniele.Rizzi@ec.europa.eu
European Data Portal
Gianfranco Cecconi - Principal Consultant, Capgemini Invent
European Data Portal Lead
Email: gianfranco.cecconi@capgemini.com
Written by:
Marit Blank - Consultant, Capgemini Invent
Email: marit.blank@capgemini.com
With contributions by:
Cosmina Radu - Senior Consultant, Capgemini
Eline Lincklaen Arriëns - Consultant, Capgemini Invent
Esther Huyer - Senior Consultant, Capgemini Invent
Last update: December 2019
DISCLAIMER
By the European Commission, Directorate-General of Communications Networks, Content and
Technology. The information and views set out in this publication are those of the author(s) and do
not necessarily reflect the official opinion of the Commission. The Commission does not guarantee
the accuracy of the data included in this study. Neither the Commission nor any person acting on the
Commission’s behalf may be held responsible for the use, which may be made of the information
contained therein.
ISBN: 978-92-78-42052-9
ISSN: 2600-0512
doi: 10.2830/073835
The reuse policy of European Commission documents is implemented by the Commission Decision
2011/833/EU of 12 December 2011 on the reuse of Commission documents (OJ L 330, 14.12.2011,
p. 39). Except otherwise noted, the reuse of this document is authorised under a Creative Commons
Attribution 4.0 International (CC-BY 4.0) licence (https://creativecommons.org/licenses/by/4.0/). This
means that reuse is allowed provided appropriate credit is given and any changes are indicated.
OPEN DATA MATURITY REPORT 2019 3
EXECUTIVE SUMMARY
This report is the fifth in a series of annual studies that assess the level of open data maturity in the EU28
Member States plus the European Free Trade Association countries (or “EFTA”: Iceland, Liechtenstein,
Norway and Switzerland, together called the EU28+ countries). The report serves as a benchmark to gain
insights into the development achieved in the field of open data in Europe. The assessment measures
maturity against four open data dimensions: policy, portal, impact, and quality. The following trends and
results have been identified in the open data maturity assessment of 2019:
	 1. 	 From acceleration to consolidation
After years of open data maturity acceleration, Europe has now entered a phase of consolidation. From
the start of the assessment in 2015, the overall maturity level significantly increased each year until it
peaked in 2017, as can be seen in figure 1. In 2018, the revision of the methodology made our assessment
more ambitious and comprehensive, with the inclusion of two new dimensions of impact and quality.
The earlier, easier acceleration towards maturity came to an end and is replaced by the steadier trend
of improvement and consolidation seen today. This year, the Member States - now equipped with solid
open data policies and advanced portals - are strengthening their open data offer and expanding and
intensifying their efforts in the more challenging areas of impact and quality.
	 2. 	 From quantity to quality
As the EU28+ countries’ open data propositions mature, their focus moves from quantity to quality. In
the early years, great efforts were made in publishing more and more data in the open, unleashing data
assets that were already in the hands of public administrations. However, there were only a few, if any,
adaptations made to these data assets. Today, and more than ever before, there is an intensified focus on
ensuring the value of data to the re-users, and this often means improving the quality of the data first. This
is particularly true as open data teams at both national and local level become more engaged with the
community of re-users, listen to their feedback, and strive to address their needs.
	 3. 	 From publishing to creating impact
Valuable data enables better re-use, which, in turn, enables a more significant impact on society and the
economy. The EU28+ countries’ focus is no longer just on publishing data and adhering to the other
basic requirements of the Public Sector Information Directive, but rather on making the best opportunity
out of the data and enabling impact. They are conducting more activities to understand and capture how
value is created with open data and to gain insights into re-users’ demands and needs. Examples range
from events to engage with the community of re-users and the development of monitoring frameworks,
to satisfaction surveys and studies into the societal and economic value of open data.
	 4. 	 From open data to data sharing
Beyond open data, the governments are becoming more aware of the opportunities arising from sharing
data in general. When a dataset cannot be published in the open - due to, for example, intellectual property
constraints or confidentiality concerns - it does not mean that its value cannot be realised according to
other models. That is what is commonly called “data sharing” in the public and private sector. EU28+
countries are preparing to be effective at data sharing with other governments and organisations in a
secure way and in full respect to intellectual property and privacy.
	 5. 	 Overall open data maturity scores 2019
The overall open data maturity scores of the 2019 assessment are presented in figure 2.
•	 Ireland, Spain, and France retain from last year their leading position in Europe.
•	 The average open data maturity score of the EU28 is 66%, up just 1 percentage point from 2018.
•	 Exactly half of the participating 32 countries scores above the EU28 average, and half below.
•	 The average open data maturity score of the EU28+ is slightly lower than EU28: 62%.
•	 20 of the participating 32 countries score above the EU28+ average, and 12 below.
OPEN DATA MATURITY REPORT 2019 4
	 6. 	 Clustering EU28+ open data maturity scores 2019
The open data maturity clusters are presented in figure 3. The 2019 clustering exercise uses the same
grouping criteria of last year and categorises countries - from high performing to low performing - as Trend-
Setters, Fast-Trackers, Followers, and Beginners1
.
•	 This year, the clustering shows a clearer separation between the four groups than last year. Within
the groups, the differences in scores are minimal.
•	 Only 3 countries belong to the Trend-Setters group: Ireland, Spain, and France.
•	 The number of countries in the Fast-Trackers group has decreased from 16 in 2018 to 8 in 2019.
•	 The strength of Trend-Setter and Fast-Tracker countries has enabled them to significantly
improve on the progress they had achieved already. On the other side, this has also amplified the
performance gap with the Followers and Beginners groups.
•	 The Followers group is with 14 countries the biggest group this year. In 2018, the Fast-Trackers
group was the biggest.
•	 Because the groups are identified starting from the top performers, the score variance within the
Trend-Setters, Fast-Trackers and Followers groups is minimal. This is different for the Beginners
group, that collects all remaining countries, hence shows much more variance.
	 7. 	 Open data maturity scores on the four dimensions 2019
The EU28 average maturity level on each of the four dimensions are presented in figure 4.
•	 Policy is the most mature open data dimension with an average score of 74%. This year in
particular, countries have invested in the governance of open data to ensure the effectiveness of
publication and re-use at all government levels.
•	 The national portals are getting more advanced with an average maturity of 67%. This year in
particular, countries have spent more effort analysing their users’ behaviours with 89% of the
EU28 countries using web analytic tools.
•	 The average score of 65% on quality shows that, although EU28 countries are already making an
effort in boosting the quality of their metadata and data, there is room for improvement.
•	 Impact is the least mature open data dimension with an average score of 57%. This reiterates the
need for a strategic approach to monitor and measure the re-use of open data and the impact it
generates.
0%
10%
20%
30%
40%
50%
60%
70%
80%
90%
100%
2015 2016 2017 2018 2019
Policy Portal Impact Quality EU28 average
Figure 1: EU28 open data maturity development 2015-2019
1
	 The groups are specified in detail in Chapter 6 “Clustering the EU28+ countries”.
OPEN DATA MATURITY REPORT 2019 5
Figure 2: EU28+ open data maturity 2019
Figure 3: Open data maturity clustering 2019
0%
10%
20%
30%
40%
50%
60%
70%
80%
90%
62% EU28+ average
66% EU28 average
100%
1.Ireland2.Spain3.France4.C
yprus
5.N
etherlands
6.D
enm
ark7.Poland
8.Italy9.Finland10.Latvia
10.Slovenia
11.C
roatia
12.G
erm
any
13.Estonia
14.G
reece
15.Austria
16.Belgium
17.N
orw
ay
18.C
zech
Republic
19.Luxem
bourg
20.U
nited
Kingdom
21.Bulgaria
22.Rom
ania
23.Sw
eden
24.Lithuania
25.Sw
itzerland
26.Portugal27.M
alta
28.Slovakia
29.H
ungary
30.Iceland
31.Liechtenstein
100% 90% 80% 70% 60% 50% 40% 30% 20% 10% 0%
BeginnersFollowersTrend-setters Fast-trackers
AT NO
HR
CZ HU IS
SK LI
CY
IT
NL
FR
IE
DK
PLES
LV
SL
FI
BE
BG LT
SE
MT
PTCHRO
EE GR LU UK
DE
Policy Portal Impact Quality
74% 67% 57% 65%
Figure 4: EU28 average open data maturity per dimension
OPEN DATA MATURITY REPORT 2019 6
TABLE OF CONTENTS
Executive summary.............................................................................................................................................................. 3
Introduction........................................................................................................................................................................... 7
Measuring open data maturity..........................................................................................................................................8
Chapter 1: Open data policy...........................................................................................................................................10
1.1 Policy framework......................................................................................................................................................11
1.2 Governance of open data..................................................................................................................................... 14
1.3 Open data implementation.................................................................................................................................. 18
1.4 Overall performance..............................................................................................................................................20
Chapter 2: Open data portal...........................................................................................................................................22
2.1 Portal features..........................................................................................................................................................23
2.2 Portal usage.............................................................................................................................................................27
2.3 Data provision..........................................................................................................................................................29
2.4 Portal sustainability.................................................................................................................................................30
2.5 Overall performance..............................................................................................................................................34
Chapter 3: Open data impact.........................................................................................................................................36
3.1 Strategic awareness................................................................................................................................................37
3.2 Political Impact........................................................................................................................................................38
3.3 Social impact........................................................................................................................................................... 41
3.4 Environmental impact...........................................................................................................................................44
3.5 Economic impact...................................................................................................................................................46
3.6 Overall performance..............................................................................................................................................49
Chapter 4: Open data quality.......................................................................................................................................... 51
4.1 Currency....................................................................................................................................................................52
4.2 Monitoring and measures....................................................................................................................................53
4.3 DCAT-AP compliance............................................................................................................................................56
4.4 Deployment quality and linked data..................................................................................................................57
4.5 Overall performance..............................................................................................................................................59
Chapter 5: open data maturity in the EFTA countries.............................................................................................. 61
5.1 Open data policy.....................................................................................................................................................62
5.2 Open data portal.....................................................................................................................................................64
5.3 Open data impact...................................................................................................................................................65
5.4 Open data quality....................................................................................................................................................67
5.5 Overall performance..............................................................................................................................................68
Chapter 6: clustering the EU28+ countries................................................................................................................70
6.1 Clustering profiles....................................................................................................................................................71
6.2 The 2019 clustering...............................................................................................................................................72
6.3 Development of the clusters 2015-2019..........................................................................................................73
Chapter 7: recommendations.........................................................................................................................................74
7.1 Trend-setters.............................................................................................................................................................75
7.2 Fast-trackers..............................................................................................................................................................76
7.3 Followers................................................................................................................................................................... 77
7.4 Beginners...................................................................................................................................................................78
Conclusions......................................................................................................................................................................... 81
Annex: country factsheets...............................................................................................................................................82
OPEN DATA MATURITY REPORT 2019 7
INTRODUCTION
Since its launch in 2015, the European Data Portal (EDP) has been the main point of access at EU level to
find public sector information published across Europe. Its objective is to improve access to open data,
foster high-quality open data publication at national, regional and local level, and increase its impact.
Within this remit, the European Data Portal has been conducting an annual landscaping exercise providing
the EU28+ countries with an assessment of their maturity level and documenting their year-on-year
progress since 2015.
This report provides an extensive overview of the open data maturity assessment of 2019, which aims to
deliver a benchmarking and learning tool at both national as well as European level. It supports countries
to better understand their level of maturity, to capture their progress and the areas for improvement, and
benchmark this against other countries. Additionally, the study provides an overview of best practices
implemented across Europe that could be transferred to other national and local contexts.
Complementary to this report, country factsheets are provided on the dashboard of the European Data
Portal website2
. The customised country factsheets provide a more detailed insight at national level into
the results of the four open data dimensions (policy, portal, impact, and quality) in comparison with
EU28 average and the results from previous years. The graphs in this report illustrate the findings from
the data gathered. The data from this year’s assessment - as well as data gathered for previous editions
- are publicly available on the dashboard. Please consult the method paper3
on the dashboard for a
comprehensive description of the methodology used for the assessment.
The Open Data Maturity report 2019 is structured as follows:
•	 The “measuring open data maturity” chapter describes how open data maturity is measured.
•	 Chapters 1-4 provide a detailed assessment of the four open data dimensions: policy (1), portal (2),
impact (3) and quality (4) in the EU28 Member States.
•	 Chapter 5 offers an overview of open data maturity in the EFTA countries.
•	 Chapter 6 presents a clustering of the countries in four categories according to their performance
and describes the key insights related to the grouping.
•	 Chapter 7 provides a set of recommendations for the countries depending on the cluster they are
associated with, providing indicative guidance for policy-makers, portal owners, and stakeholders
in general to push the open data agenda forward.
•	 The concluding chapter underlines the main takeaways and reflections from the 2019 landscaping
exercise.
2
	 https://www.europeandataportal.eu/dashboard
3
	 https://www.europeandataportal.eu/sites/default/files/method-paper_insights-report_n5_2019.pdf
OPEN DATA MATURITY REPORT 2019 8
MEASURING OPEN DATA MATURITY
In the period 2015-2017 the annual open data maturity measurement was built on two key indicators:
“readiness” and “maturity”, covering the policy developments at country level as well as the level of
sophistication of the national open data portals. To better reflect the open data developments taking
place across Europe, a major update to the landscaping methodology was carried out in 2018. The 2018
methodology made the assessment more ambitious and comprehensive and set a stronger focus on the
quality of open data as well as the re-use and impact derived by open data. The scope of the assessment
has hence been broadened to comprise four dimensions: policy, portal, impact, and quality.
Against this background, the 2019 measurement was further developed to add new layers of granularity
to the four dimensions. The updates to the questionnaire reflect progress in the European countries, the
developments at EU level as well as national and EU priorities, such as the focus on real-time access to
dynamic data and enabling smarter cities and countries. With the 2019 updates, the maturity assessment
aims to provide further impulses for the national open data teams to redirect their focus on new strategic
areas. Stronger prioritisation of high-quality open data publication, an active fostering of re-use and
monitoring mechanisms of open data re-use, the development of advanced portal features, and the need
for more inclusive and participative governance structures are the main highlights of the 2019 assessment.
Similar to past iterations of this research, the data was collected through a questionnaire sent to the
national open data representatives working in collaboration with the European Commission and the
Public Sector Information Expert Group. The questionnaire was structured against the four open data
dimensions as outlined below and included detailed metrics for each dimension to assess the level of
maturity. The detailed metrics are presented in figure 5. Dimensions and metrics were last specified at the
time of the latest major revision of the methodology in 2018, and have since been maintained to improve
clarity or address ambiguities in response to the open data representatives’ feedback.
Open Data Policy focuses on the presence of specific policies and strategies to foster open data at national
level. The dimension also analyses the existence of governance structures that allow the participation of
private and third sector actors, as well as implementation measures that enable open data initiatives at
national, regional, and local level. Furthermore, the dimension looks at training schemes that enhance
the data literacy skills of the civil servants working with data, and harvesting mechanisms that foster the
discoverability of all open data available in the country.
Open Data Portal focuses on advanced portal functions that enable both versed and less versed users to
access open data via the national portal and features that enhance the interaction between publishers and
re-users (via forum and discussion boards). Additionally, the dimension assesses the extent to which portal
managers use web analytics tools to better understand their users’ needs and behaviour and update the
portals’ features in line with the insights gained from these analyses. The dimension examines the open
data coverage across different domains, as well as the approach and measures in place to ensure the
portal’s sustainability.
Open Data Impact looks at the activities performed to monitor and measure open re-use and the impact
derived by such re-use. Beyond this first layer of “strategic awareness”, the impact dimension focusses
on four areas of sectoral impact: political, social, environmental, and economic. Within these areas, the
questionnaire examines the extent to which monitoring is in place to document the re-use of open data
published in these fields, the extent to which applications, products, and services have been developed
to address challenges in these fields, as well as the extent to which civil society initiatives exist that are
based on such open data and supported by government institutions. With regard to the economic field,
the questionnaire focuses on assessments, reports and/or studies that demonstrate the micro and macro-
economic value of open data, as well as the efficiency gains achieved by the public sector.
Open Data Quality focuses on the measures adopted by portal managers to ensure the systematic
harvesting of metadata from sources across the country, as well as the currency of the available metadata
and where possible the actual data, the monitoring of the compliance with the DCAT-AP metadata
OPEN DATA MATURITY REPORT 2019 9
standard as well as the quality of deployment of the published data. The fourth dimension provides
impulses for portal managers and policy-makers to enable open data publication that is good quality all
round: using open data formats, machine-readable, high-quality and suitable to a linked data approach
(the use of URI’s etc.).
Dimension Metrics
Open Data Policy
Policy framework
Governance of open data
Open data implementation
Open Data Portal
Portal features
Portal usage
Data provision
Portal sustainability
Open Data Impact
Strategic awareness
Political impact
Social impact
Environmental impact
Economic impact
Open Data Quality
Currency
Monitoring and measures
DCAT-AP compliance
Deployment quality and linked data
Figure 5: overview of dimensions and metrics
OPEN DATA MATURITY REPORT 2019 10
Open data policy
Chapter 1
OPEN DATA MATURITY REPORT 2019 11
The first assessment dimension “open data policy”, focuses on the open data policies and strategies in
place at national level, the governance model by which open data is managed in each country, and the
measures adopted towards the implementation of these policies and/or strategies.
The following indicators compose the policy dimension:
Metric Key elements
Policy framework Open data policies and strategies are in place at national level
to provide a long-term strategic vision and action plan for open
data. The strategies incentivise open data re-use by both the
public and private sector.
Governance of open data Governance models and coordination activities are in place that
ensure the publication of open data at all government levels and
support local and regional open data initiatives.
Open data implementation Data publication plans exist and progress against these plans is
monitored. The number of public bodies that charge above mar-
ginal costs is also monitored. Training activities for civil servants
working with data are in place.
1.1 Policy framework
This indicator analyses the open data policies, strategies, and action plans in the EU28 Member States and
their scope. The indicator looks at the visions and objectives around open data and the breadth of actions
to implement those.
1.1.1 Open data policies
With regard to the availability of open data policies, all EU28 countries report in 2019 that they have adopted
a policy that targets the open data field. (Open) data legislation takes either the form of extensive policy
frameworks or is embedded in the broader legislation framework that focuses on the modernisation of
public bodies. In many countries, the open data policy is part of the national Digital Agenda, the national
Digital Strategy, the national Data Strategy, or the work done in the context of the Open Government
Partnership4
. A few examples can be found below.
In Denmark for example, open data is included in the country’s main digital strategies and programmes.
Open data is integrated into the Basic Data Programme (2012)5
, the National Digital Strategy 2016-20206
,
the Strategy for Denmark’s Digital Growth (2018)7
, and since 2019 into the National Strategy for Artificial
Intelligence8
with a key objective to make more open public sector data available for AI. The government
will identify during 2020 and 2021 five key public sector datasets that can contribute to the development
of artificial intelligence in Denmark. Brought together, the above-mentioned policies and strategies make
out a consistent and comprehensive vision around ‘everything digital’ and how data and open data can
fuel this vision.
In Italy, the focus on open data is one of the actions of the governmental document Strategy for Digital
Growth 2014-20209
. The strategy has a dynamic character and is meant to be progressively updated
during the period 2014-2020.
4
	 https://www.opengovpartnership.org/
5
	 https://en.digst.dk/media/14139/grunddata_uk_web_05102012_publication.pdf
6
	 https://digst.dk/media/16165/ds_singlepage_uk_web.pdf
7
	 https://eng.em.dk/media/10566/digital-growth-strategy-report_uk_web-2.pdf
8
	 https://en.digst.dk/media/19337/305755_gb_version_final-a.pdf
9
	 https://www.agid.gov.it/sites/default/files/repository_files/documentazione/strat_crescita_digit_3marzo_0.pdf
Chapter 1: Open data policy
OPEN DATA MATURITY REPORT 2019 12
In Slovenia, open data is part of the Government Strategy on the development of public administration
2015-202010
. The strategy has a special section devoted to transparency, re-use and open data. The
dedicated section focuses on the online publication of data in an open and machine-readable format.
It emphasises the actual goal of open data publication - its re-use - by providing best practice examples.
In Croatia, the Open Data Policy11
has been introduced in 2018. The policy sets open data goals and
objectives and envisages the adoption of periodical action plans. The implementation of the first action
plan started this year.
In Germany, the national open data policy for the federal level is part of the national e-government act.
The bill was passed by the parliament in May 2017. It introduced the open-by-default approach for raw
data collected by federal agencies. Exceptions to that are mainly related to ensuring consistency with
the pre-existing federal freedom of information act. Special legislation precedes the open data policy to
ensure more specific regulations are not ruled out by the more generic approach of the open data policy.
Germany is currently considering working on a strategy for open government data at federal level.
1.1.2 Open data strategies
With regard to a dedicated open data strategy, 23 of the EU28 countries (82%) stated that they adopted an
open data strategy or equivalent. Not all 23 countries developed a strategy that is exclusively targeting open
data but rather embed it into the broader vision of enabling an open government. Moreover, elements of
open data strategies are often distributed across multiple strategic documents with their own dedicated
focus.
Ireland published a dedicated “Open Data Strategy 2017-2022”12
in July 2017. It aims to help Ireland become
a leader in open data and to create an environment where the economic, social, and democratic benefits
of open data are realised. The strategy sets two core objectives: 1) the publication of high-value government
data in open format, making it publicly available and freely reusable and 2) the engagement of the community
of stakeholders to promote its social and economic benefits. In 2019, Ireland also published the “Public
Service Data Strategy 2019-2023”13
. This strategy underpins the Open Data Strategy and aims to foster high
quality and well-governed data accessible by third parties through an API-first and aims to enhance the value
of open data in the country.
In Latvia, a dedicated open data strategy14
was approved in 2019. The strategy outlines the actions to be
taken in order to foster open data transformation.
In the Netherlands, a national “Data Agenda”15
was adopted in 2019, a government-wide strategy that
focuses on creating a data-driven public sector, and on further developing areas such as data security and
data sharing. Data sharing in particular is the current frame of reference, within which open data is dealt
with. The Dutch strategy refers to data sharing in its broadest sense, beyond the more traditional exchange
between government and citizens (G2C) and government and businesses (G2B), typical of open data. It
includes strategic elements covering government to government (G2G), business to business (B2B), and
business to government (B2G). Open data is no longer considered to be a specific policy domain but part
of the overall data strategy and governance.
A similar approach was taken by Malta with its newly adopted “National Data Strategy”16
which establishes a
holistic approach towards data management and data sharing based on 12 guiding principles. The Maltese
strategy focuses on data sharing within the government domain covering both open data, as well as sensitive
data (‘closed data’). This is also being implemented as part of the ‘Once only principle’ activities through the
Foundation Data Layer.
10
	 http://nio.gov.si/nio/asset/strategija+razvoja+javne+uprave+2015+2020?lang=en
11
	 https://rdd.gov.hr/UserDocsImages//SDURDD-dokumenti//POLITIKA%20OTVORENIH%20PODATAKA.pdf
12
	 https://www.gov.ie/pdf/?file=https://assets.gov.ie/6572/91c623e548a448ab883c9971bad125a0.Open%20Data%20Strategy%202017-2022#page=1
13
	 https://assets.gov.ie/7107/7ac4ae109cd944dc99c9e178962fa095.pdf
14
	 http://tap.mk.gov.lv/lv/mk/tap/?pid=40472319
15
	 https://www.digitaleoverheid.nl/wp-content/uploads/sites/8/2019/03/data-agenda-overheid.pdf
16
	 https://mita.gov.mt/en/nationaldatastrategy/Documents/Data-Driven%20Public%20Administration%20(Malta).pdf
OPEN DATA MATURITY REPORT 2019 13
The UK is currently also working on a National Data Strategy17
in which open data will be a significant
component.
1.1.3 Open data action plans
Along with the adoption of open data strategies, the EU28 countries also have implemented action plans
to ensure the strategies’ goals are reached. In 2019, 26 Member States (93%) have set up action plans. In
Ireland, the necessary actions to achieve these objectives are set out in an “Implementation Plan” which
specifies the responsible body for each action and the expected timeframe for delivery.
Cyprus also drafted an action plan with measures to be implemented in the open data field. In light on
this year’s developments at the EU level - with the recast of the Open Data and PSI Directive18
- the plan
underwent a review, with new actions added that aim to strengthen open data governance and ensure a
better alignment with EU legislation.
In Italy an Action Plan19
was developed for a timeline of three years, targeting, in its latest iteration, the
period 2019-2021.
In Greece, the 4th
National Action Plan on Open Government20
was released in May 2019 with commitments
to further promote open access and re-use of documents, information and public sector data, with a view
to bringing significant benefits to the society, the economy and the public administration. Commitments
are, for example, the creation of a new open data portal with advanced functionalities, screening, scoring
and communication mechanisms with users, which should be completed by August 2021.
In Sweden, the Agency for Digital Government (DIGG) is drafting a national action plan that will be released
in March 2020. DIGG has been established in 2019 and is responsible for Swedish open data portal and
the national open data strategy with guidelines and recommendations.
In 24 (86%) Member States, the national strategy also mandates central, regional, and local bodies to
conduct audits of their data resources and to set up publication plans for data that can be released in the
open. In Bulgaria for example, the national strategy requires that each public sector body develops a list
of priority datasets for publication on an annual basis. The executive authorities in Bulgaria are assigned
the responsibility to monitor progress against these targets.
In Poland, the strategy specifies that the public officers responsible for open data at institutional level track
and report back their annual progress by year’s end to the Ministry of Digital Affairs – the body in charge
with the implementation of the open data strategy.
In Finland, the “Act on the Openness of Government Activities”21
mandates that catalogues listing the data
inventories are published as open data. These catalogues give an indication on what each data repository/
information repository holds. The act also stipulates that all public sector activities are public and open
by default, unless otherwise decreed. This does not, however, automatically mean that data is opened.
Needs to limit access to data are considered, typically due to the data containing either personal data,
data related to national security or the need to restrict access to sensitive information to datasets that are
being processed and not yet suitable to publication.
Finally, in response to the upcoming requirement to publish “high-value datasets” expressed in the latest
Open Data and PSI Directive, 26 of the EU28 countries (93%) have stated to have commenced work
aimed at identifying and prioritising datasets for publications.
17
	 https://www.gov.uk/government/publications/national-data-strategy-open-call-for-evidence/national-data-strategy-open-call-for-evidence
18
	 https://eur-lex.europa.eu/legal-content/EN/TXT/PDF/?uri=CELEX:32019L1024&from=EN
19
	 https://pianotriennale-ict.italia.it/piano/
20
	 https://www.opengovpartnership.org/wp-content/uploads/2019/05/Greece_Action-Plan_2019-2021_EN.pdf
21
	 https://oikeusministerio.fi/en/act-on-the-openness-of-government-activities
OPEN DATA MATURITY REPORT 2019 14
1.1.4 Open data re-use by public and private sector
Concerning the measures in place to foster the re-use of the data, 21 Member States (75%) replied to the
questionnaire by sharing that such measures were indeed taken as part of the national strategy to support
re-use specifically by public sector bodies, going up to 24 Member States (86%) when targeting the re-use
by the private sector. In most countries, these measures are generic and aim to support re-use regardless
of the sector of activity - public or private. The measures mainly involve conducting events and trainings for
awareness-raising (e.g. hackathons) and skills development.
It is important to note at this stage that some European countries (Denmark, Sweden, Norway, or Estonia)
have a longstanding tradition of re-use of the data within the public sector. In Estonia, for example, the
national X-Tee interoperability infrastructure22
for secure data exchange between information systems
owned by public sector bodies was set up as early as 2000.
A similar infrastructure exists in Denmark, in the form of the Data Distributor (“Datafordeler”)23
and the “Basic
Data” programme24
. By making key, reference data (“basic data”) available to citizens, business, and other
public sector bodies under a common basic-data infrastructure, Denmark ensured early on that the data
collected by public administrations was made accessible and easy to use by the public and the private
sectors. By ensuring that this basic data conforms to the same technical requirements, data can be used
in digital procedures and case processing. The Data Distributor provides access to information about
businesses, cadastral registers, maps and buildings, and the register of property owners. At a later stage,
the Data Distributor aims to include data on incomes, road infrastructure, and the financial statements of
businesses.
Additionally, and as mentioned above, other countries - such as the Netherlands and Malta included the
data sharing between the government bodies in the direct scope of National Data Strategies. By doing so,
an overarching vision is created for the entire public sector in the country.
1.2 Governance of open data
This indicator looks at the governance models in place that ensure the publication of open data at all
government levels. In addition, the indicator looks at the existence of open data “liaison officers” at public
body level and the extent to which open data activities are organised throughout the country to foster the
exchange on the open data topic. In 2019, all EU28 Member States except for Hungary had a governance
model in place that enables the participation and inclusion of various open data stakeholders.
1.2.1 Hybrid and top-down governance models
When looking at the type of governance that is practised in the countries, the vast majority of the EU28
Member States (21 countries, 75%) opted for a hybrid model. These are a mix of a top-down model (strong
central coordination) and a bottom-up one (initiatives developed and pursued at local level, with little central
guidance). Only 7 countries (25%) stated that they run exclusively a top-down model. These countries are
Bulgaria, Cyprus, the Czech Republic, Hungary, Ireland, Luxembourg, and Slovenia. None of the EU28
Member States opted for an exclusive bottom-up model. Hungary is the only country that does not have a
governance structure in place yet. However, new strategic planning is in progress in which the establishment
of a dedicated agency is planned. Hungary states that a top-down governance model would best fits the
country’s context.
There appears to be a positive correlation between the model adopted and the country size, with top-
down coordination mainly adopted by smaller countries. Strong central guidance seems to be the best
option for a small country to move forward in open data transformation, where it is more efficient for a
central administrative body to keep track of the resources, systems, and platforms, and makes sure they are
used in common. In addition, especially in small countries, limited resources are available at local level and
municipalities often need to rely on the technical assistance and financial support of the central government.
The hybrid model is chosen by many countries because it allows for guidance, coordination, and support at
22
	 https://www.ria.ee/en/state-information-system/x-tee.html
23
	 https://datafordeler.dk/
24
	 http://grunddata.dk/wp-content/uploads/2017/06/Tidsplan_GDP.pdf
OPEN DATA MATURITY REPORT 2019 15
national level, while at the same time allows for autonomy at regional and local level. In countries such as
Denmark or Finland, the local levels enjoy a strong level of autonomy, with little guidance from the national
level.
In Denmark, the local level’s right to self-government is captured in the country’s constitution, with an
oversight from the national level. This is reflected in the open data field as well, with the “Basic Data”
programme governed by the state with participation from the local and regional levels.
In Finland, a similar looser governance structure is in place. The Finnish system is characterised by wide
communal and regional authorities. Central level guidance is feasible only on the highest, strategic level.
For the time being, no national body in charge of the governance of open data has been created in Finland.
The governance is based on exchanges between the managing team of the national portal opendata.fi and
regional and local level actors and cooperation in the form of regular meetings between data re-users and
publishers at local and regional level. Based on these experiences, the goal is to expand this collaborative
approach to select data owners on the state administrative level.
While in some European countries, the governance model includes private and third sector actors (e.g.
in Ireland, Estonia, and Spain) in other European countries, the model comprises mainly public sector
representatives (e.g. in Czech Republic, Denmark, and Germany). In the following section, the governance
models observed in different countries are exemplified.
Governance models: Ireland
In Ireland, the governance of the Open Data Initiative is underpinned by the Open Data Governance Board25
that was established in 2015. The Board provides strategic leadership and governance in line with best
international practices in the area of open data. It is tasked with considering how to improve the capacity and
capability of public bodies in implementing open data and considering opportunities to maximise the value
of public sector data and information for long-term economic, social, and democratic benefits. The Board
also oversees implementation of the national Open Data Strategy 2017-2022 together with the Department
of Public Expenditure and Reform. The composition of the Board was reconstituted in 2018 to ensure that
the right mix of skills and experience were present on the Governance Board. The complete governance
structure to support the Open Data Initiative can be seen in the organigram below.
•	The Department of Public Expenditure & Reform supports the Open Data Governance Board
and the Public Bodies Working Group in implementing the Open Data Strategy and oversees the
operation of the national Open Data Portal.
•	The Open Data Governance Board leads and drives the Open Data Initiative and ensures
implementation of the Open Data Strategy 2017- 2022.
•	The Open Data Unit in the department of Public Expenditure & Reform offers support and
assistance to public sectors when publishing their data and organises and runs national open
data events.
•	The Public Bodies Working Group provides technical support and ensures a coherent and
consistent approach to the publication of open data.
25
	 https://data.gov.ie/blog/appointments-to-the-open-data-governance-board
Open Data Governance Board Open Data Unit
Department of Public Expenditure & Reform
Public Bodies Working Group
OPEN DATA MATURITY REPORT 2019 16
Governance models: Estonia
In Estonia, the open data governance structure is composed of an open data steering group, which involves
representatives of the Ministry of Economic Affairs and Communications, the State Information Systems
Authority, and the NGO Open Knowledge Estonia - the ministry’s implementing partner of open data policy
in the period of 2018–2020. In addition, an open data working group meets regularly to discuss open data,
from organisational practical needs to strategic open data policy issues.
The working group involves members from different interested ministries and other public sector
organisations, such as the National Audit Office and the City of Tallinn. The working group meetings are
also open to non-members, such as civil society, private companies, and academia. Other stakeholders can
also participate in the governance process via GitHub (via the dedicated issue tracker) and participating to
discussion events, such as the annual Open Data Day, Open Data Forum or smaller workshops throughout
the year devoted to specific open data issues. The governance structure closely collaborates with the public
sector data management working group, coordinated by the Ministry of Economic Affairs and Statistics
Estonia. Alignment with the activities of the working groups is ensured by the government’s Chief Data
Officer who holds a leading role in both.
Governance models: Spain
In Spain as well, a governance model was set up that reflects the country’s complex federal structure and
heterogeneity of open data actors. The governance model ensures that the goals and vision that were set
under the country’s “APORTA Initiative”26
are accomplished.
The model includes a mix of actors from the public sector bodies at national, regional, and local level, and
private and third sector actors such as enterprises, start-ups and entrepreneurs, civil society organisations,
and universities. This governance model also ensures that there is constant collaboration and exchange with
other national and international bodies or groups.
The open data governance model in Spain identifies a body entrusted with coordinating information re-
use activities in each ministry or public entity. The coordination responsibilities lie with the head of the
department Under Secretary’s Office, and with the head of associated or dependent entities. The main
tasks involve 1) coordinating information re-use activities with department or entity policies, as well as
coordinating the sending of information on re-use activities undertaken, 2) facilitating information on
competent bodies within its scope to receive, process and resolve re-use requests, as well as coordinating
the provision of information on reusable documents and 3) address, where appropriate, complaints and
suggestions submitted on the re-use of information.
Governance models: Czech Republic
The National Open Data Coordinator in the Czech Republic is the main lead of Open Data Working Group
which operates under the Council of Government for Information Society (the government advisory and
coordination body for reforms of digitisation of the Czech Public administration).
To improve coordination within the public administration, the Government Council for Information Society
established the Open Data Working Group in March 2017. The Working Group serves as a government
platform for open data providers and suppliers from public bodies and authorities to share knowledge and
best practices as well as to identify the datasets regularly requested by the public and private sectors. The
group consists of 14 Open Data Coordinators from ministries and a few institutions. Civil society and other
relevant stakeholders outside of the public administration are not involved.
1.2.2 Open data liaison officers
Many Member States (24, i.e. 86%) have set up a network of relevant contact persons for data publication
within public administrations. Designated persons in public administrations act as a “liaison officer” or “data
steward” in relation to open data and serve as a point of contact with the national open data team. The
function of open data liaison officer is often required to promote and encourage the publication and re-use
of open data within the respective organisation, to maintain an active dialogue with liaison officers in other
public administrations, to exchange and increase knowledge regarding open data, and to ensure linking of
datasets to the national open data portal.
26
	 https://datos.gob.es/en/about-aporta-initiative
OPEN DATA MATURITY REPORT 2019 17
In Ireland, there are currently some 70 liaison officers in place who actively promote open data and
publication within their organisations.
In Germany, a guideline27
recommends the appointment of data officers in every public body. Moreover,
every federal ministry in Germany has appointed an open data officer (“Open-Data-Ansprechpartner”). The
open data officers convene every 2 months to discuss open data policies and to coordinate the related
other public bodies.
In Sweden, guidelines recommend all public bodies to appoint a responsible person in the organisation for
open data, but only very few public bodies have yet complied to this recommendation.
In the Czech Republic, public bodies have to appoint an open data chief officer, who is in charge of open
data implementation. This open data officer prepares an internal directive which sets the roles of data
stewards, data officers, and a head of institution, in order to ensure a smooth process for opening up data.
Open data publication plans are then prepared, with selected datasets and identified risks and benefits along
with a time framework for publication.
1.2.3 Fostering open data initiatives throughout the country
A vast majority of the EU28 (23 Member States, 82%) report that local or regional governments conduct
their own open data initiatives. From the 7 countries that have a top-down governance model in place,
3 countries (Bulgaria, the Czech Republic and Ireland) report that local or regional governments conduct
their own open data initiatives. These include writing dedicated open data policies, the implementation of
strategies, and operating portals for municipalities or cities, and activities to boost the re-use of open data,
such as hackathons, conferences, re-user meetings, open data challenges, and studies into benefits and
challenges of open data publication and re-use.
Figure 1.1 below shows the percentages of local and/or regional governments conducting open data
initiatives. Looking at the left side of the figure, it shows that in 10 countries (36%) only less than 25% of the
local/regional governments conduct open data initiatives. At the same time, looking at the right side of the
figure, in 5 countries (18%), more than 75% of the local/regional governments conduct open data initiatives.
These countries are Belgium, Denmark, Germany, Latvia, and the United Kingdom. In the UK for example,
at a regional level, Northern Ireland, Scotland, and Wales all publish their own National Action Plans with
their own respective open data commitments and initiatives. At a local level, regions of the UK have pursued
their own open data approaches, such as the Data Mill North28
, Devon County Council Open Data29
, and
the London Data Store30
.
36%
21%
7%
18%
0%
5%
10%
15%
20%
25%
30%
35%
40%
100%
1-25%
%ofEU28countries
26-50% 51-75% 76-100%
Figure 1.1: The percentage of local and/or regional open data initiatives
27
	 https://www.verwaltung-innovativ.de/SharedDocs/Publikationen/eGovernment/open_data_prozessbeschreibung.pdf?__blob=publicationFile&v=2
28
	 https://datamillnorth.org/
29
	 https://www.devon.gov.uk/factsandfigures/open-data/
30
	 https://data.london.gov.uk/
OPEN DATA MATURITY REPORT 2019 18
1.3 Open data implementation
This indicator looks at implementation measures in place that enable open data initiatives at national,
regional, and local level. More specifically, the indicator analyses the existence of guidelines or guidebooks
that foster the release of open data within the country, the existence of data publication plans and the
monitoring of progress against these plans, and the extent to which regional and local sources are
systematically harvested by the national portals. Additionally, the indicator looks at access to real-time
and dynamic data, training activities that enhance the data literacy skills of the civil servants working with
open data, and the monitoring of public bodies that still charge above marginal costs.
1.3.1 Guidelines and guidebooks
Member States are providing guidance and assistance to the local and regional level, as well as federal
level ministries when it comes to the implementation processes of open data. For the purpose of open
data implementation, guidelines and guidebooks have been developed and circulated. Most of these
guidelines and guidebooks are available on the national open data portals.
A good practice comes from France, where different guidelines were written with a specific target
audience in mind31
. France is currently updating these guidebooks in order to provide guidelines to the
data producer on data.gouv.fr and accompanying the data producer through the user story of creating
a profile on the national portal, to the publication and the updating process of data. A guidebook on
technical and legal best practices was also published.32
With the same objective of addressing different audiences, Finland developed its “Data Owner’s Guide”33
.
The guide provides different sections that are tailored to the needs of different audiences. A first section
deals with beginner-level topics such as the concept of open data, explains its significance, the key terms
as well as the most commonly used licenses. Another section targets the needs of the data producers.
The section is aimed at organisations that currently plan to open their data. A different section is targeted
to organisations that have opened their data already and explaining to them how they can use the national
portal to gain further insights into their data, thus helping them further along the path of benefiting the
data consumers. Another section provides detailed guidelines in e.g. adopting processes to ensure the
buy-in of the entire organisation throughout the data publication and data maintenance process.
The Polish Ministry of Digital Affairs published the “Data Opening - Good Practice Guide”34
. The guide is
part of the project “Open data - access, standard, education”35
that aims to increase the availability and
quality of open data and its re-use. The guide describes the basic framework for the process of opening
data by referencing relevant legal acts, identifying desired institutional settings, and presenting practical
scenarios for data opening in government offices. Furthermore, the guide shows how to implement
the data opening process effectively and gives guidance on the standards for data openness. The good
practice guide is written for managers and employees in central and local government administration
offices, representatives of non-governmental organisations, and for those who base their knowledge of
public administration activities on data generated and processed in public institutions.
In Italy guidelines take the shape of a formal policy document: the “Guidelines for the enhancement of
public information”36
. The documentation provides support to public administrations in the publication
process, defining the main recommendations to be followed in order to implement the national strategy.
The actual implementation of the strategy is guided by the aforementioned Action Plan 2019-2021 and
the Action Plan of the Open Government Partnership37
.
31
	 https://doc.data.gouv.fr/, https://opendatafrance.gitbook.io/odl-ressources
32
	 https://www.cnil.fr/sites/default/files/atoms/files/guide-open-data.pdf
33
	 https://www.avoindata.fi/fi/opas/avoimen-datan-opas
34
	 https://dane.gov.pl/media/ckeditor/2019/07/04/open-data-good-practice-guide.pdf
35
	 https://www.gov.pl/web/cyfryzacja/otwarte-dane-dostep-standard-edukacja2
36
	 https://www.dati.gov.it/content/linee-guida-nazionali-valorizzazione-patrimonio-informativo-pubblico
37
	 http://www.funzionepubblica.gov.it/attivita-internazionali/ogp
OPEN DATA MATURITY REPORT 2019 19
In Austria, practical guidelines38
for the implementation of the PSI Directive were compiled by a working
group of the platform Digital Austria, which covers organisational and technical aspects. Additionally,
an “Open Government Implementation Model”39
was developed, that was re-used by authorities in the
country and abroad as foundation for their open-government initiatives and gives comprehensive help to
organise in the publication process.
Greece has a dedicated support area40
on the national open data portal that allows data publishers to
learn about DCAT-AP, different licensing options, and high-quality data. The portal also offers a guide41
for
public administrators for publishing open data.
1.3.2 Monitoring data publication
Datapublicationplansandmonitoringmechanismsfordatapublicationcanserveastoolstooverseeprogress
across national and local public administrations and enable more effective interventions where applicable
in order to overrun barriers to data publication. The number of Member States that have such publications
plans in place are 24 (86%), but only 18 of these Member States also have a monitoring mechanism in place
to track the progress of data publication against these plans.
A good practice in this field comes from France, where plans have been set up at national as well as regional
and local levels. At the national level, the Etalab task force42
follows a data publication plan driven by the
latest decrees, such as the publication of public procurement data. Moreover, Etalab also defined a list of
datasets with high impact on economic and social life, which have to be opened as a priority. Additionally,
and applicable to each level (national, regional, and local), the Digital Republic Act43
has also set a deadline
for all municipalities with more than 3500 inhabitants to open all their data. Each level is also concerned by
the priority publication of data with high value impact.
In Croatia, such plans were defined within the framework of the Action Plan for the Implementation of the
Open Data Policy, which mandates public sector bodies to identify and publish key datasets. Such activities
include defining the priority datasets, developing a timeline for publication and monitoring progress against
this timeline. The goal set by the national level is that all the identified key datasets are published in open
format by the end of 2020 or beginning of 2021. In addition, the Action plan envisages the development of
a model open data strategy for local and regional level, in cooperation with the national associations of local
and regional authorities, and its adoption by at least 10% of local and regional bodies.
1.3.3 Harvesting data from regional and local portals
Compared to 2018, the national levels have also increased their harvesting of local and regional portals.
Whereas in 2018, 21 (75%) of the Member States harvested data from local and regional portals, in 2019
this has increased to 24 Member States (86%). On one side of the spectrum, there are 10 countries that
harvest over 90% of their local and regional portals: Austria, Belgium, Croatia, Czech Republic, Estonia,
France, Germany, Ireland, Latvia, and Portugal. On the other side of the spectrum, there are 6 countries
that harvest less than 25% of their local and regional portals: Bulgaria, Greece, Hungary, Lithuania, Poland,
and Slovenia. The reason for this low percentage varies per country. In Bulgaria, for example, the current
national open data portal does not allow for harvesting yet, although this development is in process.
In Slovenia, the low percentage is due to the fact that regional governments are relatively small and
therefore do not have their own portals. Regional governments act on the basis of laws, by-laws, and the
national public sector strategy, and publish their data to the national portal directly.
1.3.4 Access to real-time and dynamic data
Of particular interest in 2019 is the topic of access to real-time and dynamic data. Of the of EU28 countries,
21 (75%) conduct activities at national level to assist real-time and/or dynamic data holders in their
publication process. In Luxembourg, for example, there have been many meetings to succeed in opening
up the real-time public transport data from the transport ministry. Regular interventions by users make clear
38
	 https://www.ref.gv.at/fileadmin/_migrated/content_uploads/upsir_1-0-0._20150701pdf.pdf
39
	 https://www.kdz.eu/en/open-government-implementation-model
40
	 http://www.data.gov.gr/pages/support-material
41
	 http://data.gov.gr/files/UserGuide_data.gov.gr.ver.1.0.pdf
42
	 https://www.data.gouv.fr/en/organizations/etalab/
43
	 https://www.legifrance.gouv.fr/eli/decret/2018/12/10/ECOJ1817657D/jo/texte
OPEN DATA MATURITY REPORT 2019 20
that amendments are still necessary. Cyprus, just like many other countries, provides trainings, technical
guidelines, and technical support on how to release real-time and dynamic data. In some cases, the Public
Sector Information team in Cyprus collaborates with universities to develop API’s for public sector bodies to
release their data. In Ireland, the Open Data Unit also engages with real-time and dynamic data holders. The
number of datasets available via API at the Irish national open data portal has increased significantly in the
past year to 537 datasets (November 2019).
1.3.5 Open data training for civil servants
To enable the open data skills development, 24 of the EU28 Member States (86%) provide training activities
to their civil servants. Only Belgium, Hungary, Portugal, and Sweden report that they do not conduct any
training activities at national/federal level around open data. However, in Belgium, such trainings do exist at
a regional level. The variety of training ranges from information sessions for public servants, workshops and
training sessions at public body level, to webinars, e-learnings, and tutorials.
In Romania, the Secretariat General of the Government (SGG) developed open data training material for
civil servants, as well as a set of specific recommendations for the local level. During 2018, there have been
training sessions for 200 civil servants at national level, and in 2019 there were training sessions provided for
civil servants at local level, too.
In Latvia, each ministry and their agencies organised technical workshops on publishing open data. In
addition, the Latvian Open Strategy Action Plan includes plans for developing educational courses and
expert seminars on open data.
1.3.6 Charging for data
When assessing the share of EU28 that monitor the extent to which public sector bodies are still charging
for data above marginal costs, just over half of the countries (17 countries, 61%) replied affirmatively. In most
of these countries (12 countries, 71%), only less than 10% of public administrations charge above marginal
costs. In 5 countries (29%) this percentage is slightly higher: between 10% and 25%. It is worth mentioning
here that none of these 17 countries found that more than 25% of their public administrations charge data
above marginal costs.
When asked how this percentage has changed compared to the previous year, 7 countries - Austria, Croatia,
Estonia, France, Lithuania, the Netherlands, and Slovenia - confirmed that their situation hasn’t changed, as
they mention that none of their public administrations charged above marginal costs during 2018 and 2019.
This is mainly thanks to the respective national legislations that mandate public bodies to publish free of
charge. Additionally, 9 countries reported that the percentage of bodies that charged above marginal cost
has decreased compared to 2018. None of the EU28 countries stated that the percentage of public bodies
that charge data above marginal cost has increased since last year.
1.4 Overall performance
Figure 1.2 shows the EU28 average maturity on each of the 3 indicators of the policy dimension. On
average, Member States score relatively high on the policy dimension with an overall maturity level of 74%.
The most mature indicator within the policy dimension is the governance of open data (79%), followed
closely by the policy frameworks in place (73%) and the implementation of open data (69%).
Figure 1.2: EU28 average maturity on open data policy dimension
73%
79%
69%
0%
10%
20%
30%
40%
50%
60%
70%
80%
90%
100%
Policy Framework Governance Implementation
OPEN DATA MATURITY REPORT 2019 21
When looking at the maturity development over the years, figure 1.3 shows that the policy dimension
significantly increased each year since 2015, but that this acceleration has stopped in 2019. This year is
the first one when the maturity level did not increase but decreased compared to 2018. This is likely due
to the Member States focusing effort on policy early in the overall transformation to support open data
publishing and re-use. Moreover, while policymaking is never a simple process, the most of the “low-
hanging fruits” were picked in the early years.
The country ranking of the policy dimension can be observed in figure 1.4. The figure reveals that 17
Member States score above the EU28 average of 74% and 11 Member States score below the EU28
average. The countries with the highest maturity levels on the policy dimension are France (98%), Denmark
(95%), Ireland and Poland (both 91%).
47%
57%
72%
82%
74%
0%
30%
40%
50%
60%
70%
80%
90%
100%
2015 2016 2017 2018 2019
Figure 1.3: EU28 average open data policy development
0%
10%
20%
30%
40%
50%
60%
70%
80%
90%
100%
FranceD
enm
arkIrelandPoland
SpainC
roatiaC
yprus
N
etherlands
ItalyEstoniaSlovenia
LatviaG
reece
C
zech
RepublicLithuaniaG
erm
anyBulgaria
EU
28
averageFinland
U
nited
KingdomBelgium
Austria
Luxem
bourgSw
edenRom
ania
M
altaSlovakiaPortugalH
ungary
Figure 1.4: EU28 open data policy maturity
OPEN DATA MATURITY REPORT 2019 22
Open data portal
Chapter 2
OPEN DATA MATURITY REPORT 2019 23
The second assessment dimension ”open data portal” focuses on the level of maturity of national open
data portals, including considerations around their functionality, usage (user analytics), variety of data
featured, and the approach to ensuring the portal’s sustainability. The following metrics are assessed as
part of this dimension:
Metric Key elements
Portal features Portal features ensure access to datasets and relevant content,
including more advanced features such as SPARQL search,
discussion forum, rating of datasets, requesting datasets, and
providing transparency on the progress status of requested
datasets.
Portal usage Traffic to the portal is monitored and analytics tools are used
to gain insights into users’ behaviour and the most and least
consulted data categories. In addition, the portal offers API’s
through which advanced users can access the metadata
programmatically.
Data provision The majority of data publishers can contribute (meta)data to the
national portal and actions are taken to enable publication from
data publishers. In addition, access to real-time data is enabled
via the portal and data that does not stem from official sources
can be uploaded.
Portal sustainability A sustainability strategy for the portal has been defined and
activities are conducted to ensure the portal’s visibility, including
social media presence. In addition, user surveys are conducted
regularly, and feed into reviewing process of improving the
portal.
In 2019, all EU28 countries have a national portal that ensures the data sources available throughout the
countries are discoverable via one gateway. Early 2019, Malta launched its national data portal, as part of the
wider framework of the Enterprise Data Management Strategy that is currently implemented in the country.
Although Denmark does not offer one single gateway to open data existing throughout the country, the
country provides a number of different thematic portals that ensure that the data from these fields is made
available to its target audiences. Denmark has opted for this decentralised approach, as it best fits the
national context and administrative system.
2.1 Portal features
This indicator evaluates the functionalities on the national open data portals and investigates both basic
features as well as more advanced features. Basic portal features include, for example, search functions that
enable filtering, searching by file format and searching by data domain, while more advanced portals also
enable users to search data via a SPARQL search query. Moreover, the indicator examines portal features such
as the possibility for visitors to request and rate datasets and examines whether portals offer a designated
area to show open data use cases. More advanced portals do not only allow users to request data and offer
a designated for open data use cases, but also provide a higher degree of transparency towards visitors
by presenting the progress status of data requests and allowing visitors to submit their own open data use
cases. The indicator also examines whether portals have features in place that foster the online interaction
between publishers and re-users, such as discussion forums, the possibility to provide feedback on datasets,
and to receive notifications when new datasets are available on the portal.
2.1.1 Searching for datasets
With regard to searching for datasets, all 28 national portals have a search function in place that enables
multiple field search and various filter options. In addition, all 28 national portals enable users to search for
data per data domain and 26 national portals enable users to search by file format. When looking into more
advanced search features, only 5 countries offer a SPARQL search query function: Austria, Belgium, the
Chapter 2: Open data portal
OPEN DATA MATURITY REPORT 2019 24
Czech Republic, Slovakia, and Spain. The European Data Portal presents a good practice regarding SPARQL
search query, by also providing links to additional documentation on the SPARQL specifications.
Using SPARQL enables the more advanced users to search deeply and precisely in the metadata offered -
whether by the source portals or the European Data Portal itself. Moreover, it enables access to metadata
that is not directly visible to users by using the website interactively, e.g. SPARQL queries can use the fields
included in metadata specific to geospatial datasets published according to the GeoDCAT-AP standard44
.
SPARQL can also be used “programmatically”: this means that advanced users can write software that
automatically interrogates the data portal, e.g. to identify the availability of new datasets.
The screenshot below showcases the European Data Portal’s SPARQL manager - also accessible via the
portal’s main page.
2.1.2 Requesting datasets
Search functions need to be in place to enable users to discover the data they are looking for. However,
not all data that users aim to find is published on the national portals. Besides the national portals of
Austria and Hungary, all EU28 national portals provide users with the ability to request datasets that are not
published (yet). The most common way to request datasets is via a designated request form. The level of
detail of these request forms varies per country. In the UK, for example, users are required to explain their
request in a message, while other national portals, such as the Bulgarian and the Spanish portal, require
users to fill in mandatory fields about their request, such as the reason for their request, the expected
benefits of the dataset, the preferred data format, and the name of the users’ organisation.
When looking at the frequency by which data requests come in, 16% of the portals receive data request
on a daily basis, about 20% on a weekly basis, another 24% on a monthly basis, and around 40% at less
44
	 GeoDCAT-AP is an extension to the “DCAT application profile for European data portals” (DCAT-AP) for the representation of geographic
	 metadata. See: https://inspire.ec.europa.eu/good-practice/geodcat-ap. Future releases of the European Data Portal will give better visibility to the
	 interactive user of the availability of GeoDCAT-AP metadata and other DCAT-AP extensions’.
Screenshot 1: SPARQL search function on the European Data Portal
OPEN DATA MATURITY REPORT 2019 25
frequent intervals. These numbers tell us that most national portals in EU28 (40%) receive less than one
data requests per month.
Even if 26 national portals offer a data request option, only 22 national portals monitor the extent to
which these requests result in the publication of the respective data. The distribution of the percentage
of data requests resulting in publication can be seen in figure 2.1. Looking at the right side of the figure, it
becomes clear that 2 countries (9%) - Estonia and Poland – indicate that more than 90% of the incoming
requests are fulfilled. An important note here is that Poland only receives data requests less than once a
month. Estonia, however, receives data requests on a weekly basis and achieves to publish more than
90% of these datasets. In 5 other countries (23%), between 51% and 90% of the data requests are fulfilled.
In countries (41%) between 10% and 50% of the data requests are fulfilled. In 6 countries (27%) only less
than 10% of the requested data results in publication.
2.1.3 Providing transparency
From the 26 national portals that offer a data request option, only 14 of them showcase these requests in
a transparent way on the portal. A good practice in this regard comes from the national portal of Spain.
The portal offers a designated area in which all data requests are listed. Visitors can see the description
of the request, the reason for the request, and the expected benefits of the data. In addition, the status of
every request is shown, such as assigned, published, not feasibly, under study, or partially published. The
portal also enables visitors to filter requests by, for example, date of the request, data category, or progress
status of the request.
Along the line of transparency, 15 national portals provide users with the possibility to see what data
is available but cannot be published as open data e.g. because of unresolved rights restrictions or
confidentiality reasons. A good practice, in this case, comes from the Netherlands, where this data is
tagged as “closed data” on the national portal. Another interesting approach comes from Ireland, as can
be seen in the screenshot below. The visualisation shows the number of datasets under an open licence
(green) and the available datasets that are not
under an open licence yet (blue). The screenshot
reveals that not only the number of datasets
under an open license has increased over the
years, but that also the share of data under an
open license reported to the total available data
has increased. In October 2019, for example,
there were 8937 datasets available, all available
under an open licence.
27%
41%
23%
9%
0%
5%
10%
15%
20%
25%
30%
35%
40%
45%
<10% 10-50% 51-90% >90%
100%
%ofEU28countries
Figure 2.1: The percentage of data requests resulting in data publication
Screenshot 2: number of datasets under open license (green) -
Irish national open data portal
OPEN DATA MATURITY REPORT 2019 26
2.1.4 Enabling interaction
With regards to features that foster interaction between re-users and data publishers, 27 of EU28 portals
offer a general feedback channel on their portal. There is still a preference amongst portal teams to collect
feedback of any nature via an intermediary point. This feedback generally comes into a monitored email inbox
that is then manually forwarded to the responsible person or public body. The most common mechanism
remains the general helpdesk form, through which users can provide general feedback, report low-quality
data or broken links, or make suggestions. A possible explanation for the decision to collect all feedback
via one single point rather than enable direct interaction between users and publishers might be that this
mechanism enables the portal managing team to monitor the feedback that comes in and develop a better
understanding of their users’ and the general open data community’s needs. Besides general feedback
channels, 25 of EU28 national portals allow users to provide feedback on datasets. This often takes place in
the form of a feedback button or a direct e-mailing to the dataset provider.
Along the line of fostering interaction between data publishers and data re-users or between re-users
themselves, 16 of the EU28 portals offer a discussion forum for registered users. The most common forum
type is a discussion module that is available for each dataset. This allows users to express their opinions
about the published dataset and makes it possible to report areas for improvement to the data provider.
Some Member States, such as France, do not only offer a discussion forum attached to each dataset, but
also a general discussion forum where users can discuss issues and express their opinions that are not
related to a specific dataset. A general discussion forum remains a common and valid choice to support
the communities surrounding the portals for topics that are not related to a dataset in particular, but general
such as skills or best practices. This choice was also made by other major data-related projects, such as the
European Commission’s Support Centre for Data Sharing, fostering the community of practitioners - private
and public - in data sharing, rather than in open data45
.
A discussion forum enables a more qualitative approach for evaluating datasets than rating mechanisms
such as up or down voting or a five-star rating module. However, rating mechanisms provide users with
the opportunity to show their satisfaction with the data in a glance and allows users to see how datasets
are valued by the crowd. Only 8 out of the EU28 national portals allow users to rate datasets. Slovenia and
Ireland do not have a rating system in place yet, but both have plans to release this feature in the near future.
The most common rating system is a 3 or 5-star rating, or a like/dislike button.
Most national portals (19 of EU28) offer the possibility for users to receive notifications on the availability of
new datasets (e.g. RSS/ATOM feeds, email notifications). A good practice comes from the national portal of
Finland, where registered users can tag a number of organisations to follow. When the organisation publishes
a new dataset, or updates an existing one, the users following this organisation receive a notification. Non-
registered users cannot follow an organisation but can follow individual datasets. By subscribing to these
datasets, users receive a notification when the datasets are updated.
2.1.5 Providing examples of open data re-use
Regarding the promotion of open data re-use via the national portal, 20 of EU28 have a designated section
to promote applications based on open data. Latvia and Lithuania do not have such an area yet but have
plans to release this feature in the near future. The 20 national portals also offer the possibility for users
to submit their own open data reuse examples. In some cases, such as France, Luxembourg or Portugal,
the national portal has a designated ‘use case upload’ feature. The most common way to submit such use
cases, however, remains the possibility to register use cases via the general feedback form.
Regarding open data use cases, 18 national portals offer a mapping between the use cases and the datasets
that the use cases are based on. A best practice in this regard comes from Austria, where datasets and
applications are mapped in two different ways. The first one is a designated area on the portal that showcases
all open data applications and that provides a link to each dataset that is used to build the application.
The second way is the other way around: for every published dataset, the portal provides a link to all the
applications that are built with the data. This two-way mapping between datasets and applications enables
users to get inspired by what can be done with the data and enables data providers to discover what kind of
applications are built with the data they provide.
45
	See https://eudatasharing.eu/
OPEN DATA MATURITY REPORT 2019 27
When looking at more advanced features such as a preview function for both tabular and geodata, 19
portals have a preview feature for tabular data, and 15 portals a visualisation feature for geospatial data. The
functionality is perceived to be an important way to engage non-expert users, whose skills do not extend
into being able to process the data for themselves. Through previewing and visualisations - and particularly
through maps, where suitable - users can experience and explore the data interactively. An example in this
regard comes from Cyprus. The screenshot below illustrates how geospatial data visualisation is used to
show the location of local earthquakes between 1997 and 2016.
2.2 Portal usage
This indicator examines the extent to which national portals gather insights into the usage of the portal
to better understand users’ behaviour. Insight into, for example, the number of unique visitors, the typical
user profiles, the most consulted datasets, the most popular data domains, and traffic generated via the
portal’s API, allow portal managers to evaluate if the current portal design and features, as well as the
available data, meet the users’ needs.
2.2.1 User analytics
Most national data portals (25 of EU28) use analytics tools to better understand the visitor profiles and
capture the extent to which the portals meet the needs of the visitors. Often mentioned tools are Google
Analytics46
and Matomo47
. Portal owners become more aware of the benefits of using analytic tools to
gain insights into portal usage, as in 2017 only 39% of the portal teams used analytic tools, while in 2018
this number increased to 88% and in 2019 to 89%.
A good practice in this regard comes from Latvia. The analytics of the portal demonstrated that 90% of the
visitors came from Latvia. To attract more foreign visitors, the team decided to translate more content into
English. The Finnish national portal discovered that only 30% of the portal visitors browsed the portal with
mobile devices, which is below the national percentage of 67%. This lower percentage can be explained
by a user base that mainly consists of developers. The Spanish portal uses insights into visitor’s behaviour
not only to increase their understanding of users’ behaviour but also to choose the theme for weekly
published articles and for the composition of the newsletter.
46
	 https://analytics.google.com
47
	 https://matomo.org/
Screenshot 3: geospatial data visualisation on the Cypriot national open data portal
OPEN DATA MATURITY REPORT 2019 28
2.2.2 Portal visitors
When trying to better capture portal usage, the number of unique visitors48
per month is one of the
most common measures used. Figure 2.2 shows the share of unique visitors per month reported to the
population per country. Looking at the numbers depicted by the chart, it becomes clear that the national
open data portal of Luxembourg attracts the most visitors compared to its population. With 613.894
persons having their usual residence in Luxembourg on 1 January 201949
and with an average of 16720
unique portal visitors per month, the portal attracts 0.027% of Luxembourg’s population.
2.2.3 Most popular data domains
Insights into the popularity of data domains allow portal teams to research and engage with less popular
data domains. Figure 2.3 shows the most popular data domains in the EU28 Member States in 2019. The
domains are based on the 13 European standard DCAT-AP data categories. The 2019 open data maturity
assessment asked countries to provide the top 5 data categories consulted on the portal. The chart below
shows the weighted scores. Similar to 2018, Government and Public Sector is the most popular data
domain (20%). Environmental (16%) and Economy and Finance (14%) follow as the second and third most
popular data domains. The least popular data domains are Agriculture, Fisheries, Forestry & Foods (3%),
Justice, Legal system, & Public safety (1%), and Science and Technology (1%). None of the EU28 national
portals mentions the data domains Energy and International Issues in their top 5 of most popular data
domains.
It is important to note that there is no way to say whether one category is unsuccessful because the
portals’ audience is uninterested in it, or because the countries do not publish enough relevant and
valuable data on those topics. A recent study by the European Data Portal for example - the “enabling
smart rural: the open data gap”50
- has explored in more detail the availability of rural open data, and the
Figure 2.2: The share of unique visitors per month reported to the countries population
0,0% 0,005% 0,010% 0,030%0,025%
Bulgaria
Portugal
Germany
Lithuania
Italy
Poland
Sweden
Denmark
Belgium
Romania
Netherlands
Finland
Greece
Spain
Slovenia
Estonia
Hungary
Austria
Ireland
Croatia
United Kingdom
Latvia
France
Cyprus
Luxembourg
48
	 ‘Unique visitors’ refer to the number of distinct individuals accessing pages of a website during a given period, regardless of how often they visit
	 that website in the given period. ‘Visits’ refer to the number of times a website is visited, independent of the numbers of visitors that access the
	website.
49
	 https://ec.europa.eu/eurostat/tgm/table.do?tab=table&init=1&language=en&pcode=tps00001&plugin=1
50
	 Find this and all of the European Data Portal’s analytical reports at https://www.europeandataportal.eu/nl/what-we-do/factsheets-and-reports.
OPEN DATA MATURITY REPORT 2019 29
challenges and opportunities related to it. The lack of popularity of the “Agriculture, Fisheries, Forestry &
Foods” category may be a direct consequence of those challenges.
2.2.4 Application Programming Interface (API)
When looking at API’s, 26 (93%) of the Member States’ portals offer API’s through which advanced users
can access the metadata programmatically, e.g. by writing software that performs searches automatically,
to identify new datasets. However, only 16 (57%) of the open data teams also take the effort of monitoring
the API’s usage, e.g. by running analytics on the respective log files. It can be expected that this will
change soon, as the latest Open Data and PSI Directive promotes the use of API’s significantly, and it is
expected that the teams will adapt to develop a better understanding of how their users make use of this
opportunity.
2.3 Data provision
This indicator analyses the extent to which data publishers contribute to the national open data portals
and what actions are taken to foster their contribution. In terms of the share of data publishers that
make their data discoverable via the national portal - be it by harvesting of the metadata or direct upload
mechanisms - 17 (61%) of EU28 report that all data publishers in the country make use of the national
portal to showcase their data. In many countries, data publishers are not obligated to publish their data
on the national portal but are encouraged to do so. Public bodies and institutions commonly publish their
data on their own portal first. A typical example of this comes from Luxembourg, where the national library
Bibliothèque nationale de Luxembourg created their own open data portal51
, but also the corresponding
entries via the national open data portal of Luxembourg52
.
2.3.1 Challenges in data provision
One of the biggest challenges that EU28 Member States mention regarding data providers contributing to
national portals is that it often depends on the technical expertise, the resources, and the interest of the
staff of public sector bodies. Not all public sector bodies and institutions prioritise open data publication
and even when they are willing to contribute to the national portal, it might be a challenge in terms of
technical and financial resources. Especially smaller public bodies and institutions often lack the capacity
to invest in open data publication. In the Czech Republic, for example, there are approximately 10.000
public sector data providers, but the national portal only publishes data of 30 of them since many small
public bodies and institutions in the Czech Republic lack the capacity to publish data.
Another challenge is publishing metadata suitable for harvesting according to European standards. Public
sector bodies and institutions do not always publish their metadata in the preferred European DCAT-AP
standards. Additionally, national portals that use DCAT-AP occasionally make mistakes that compromise
the discoverability of the datasets they offer, e.g. it is common to mismatch the mapping between
the standard DCAT-AP categories (energy, health, environment, transport etc.) and the ones they use
1%
1%
3%
4%
9%
9%
11%
12%
14%
16%
20%
0% 5% 10% 15% 20% 25%
Science & Technology
Justice, Legal System & Public Safety
Agriculture, Fisheries, Forestry & Foods
Health
Education, Culture & Sport
Regions & Cities
Transport
Population & Society
Economy & Finance
Environment
Government & Public Sector
Figure 2.3: The most popular data domains
51
	 https://data.bnl.lu/
52
	 https://data.public.lu/en/organizations/bibliotheque-nationale-du-luxembourg/
OPEN DATA MATURITY REPORT 2019 30
internally, that may have different names or hierarchy. Therefore, not all data that is published on the
individual portals is published on the national portals.
2.3.2 Overcoming challenges in data provision
Several steps can be taken to help data publishers contribute to the national data portal. Many countries
provide support to data publishers, for example by providing trainings, helping with legal and technical
questions, or supporting with the production of DCAT-AP metadata. In addition, countries organise sessions
and meetings on advantages, opportunities and benefits of opening up data and contributing to the national
data portal.
The portal team of Lithuania, for example, organised an educational programme for public employees
regarding open data publication and discussed the opening of new datasets with representatives from 64
public institutions in numerous meetings.
Another good practice comes from Slovenia, where meetings were organised with individual data publishers
to assess the best approach for data publication, either by being harvested by the national open data portal
or by uploading data on the portal themselves, and step-by-step support was provided.
2.3.3 Data from unofficial sources
When it comes to the possibility of uploading data that does not stem from official sources (data that is not
from a public body but might be the result of research projects or contributions by citizens), only 10 (36%) of
the EU28 national portals offer this possibility. The explanation for this is rooted in many cases in the mission
and scope of the portal – whose main purpose is specified to be the publication of public sector data
only. However, in several countries, such as Denmark and Luxembourg, everyone can upload data instead,
regardless if this data stems from citizens, private firms, associations, or public bodies and institutions.
Interesting approaches to publish both official as well as unofficial data come from Luxembourg and France.
Both portals highlight the nature of the source by displaying a stamp symbol to characterise official data
providers. The “stamp” shows users that the provider is certified by the national portal as an official data
provider. Finland and Bulgaria have a different approach and provide dedicated sections on the portal for
unofficial data. The Bulgarian portal provides two different sections, one for public bodies and one for
private organisations, while the Finnish national portal provides three different sections: data from societies
and trusts, data from individuals, and data from private enterprises and corporations. The Austrian national
open data portal provides a dedicated portal for data provided by businesses and NGO’s.
2.3.4 Access to real-time and dynamic data
Another aspect assessed under this dimension was the level at which the national open data infrastructure
also provides access to real-time and dynamic data. Only 21% of EU28 national data portals still do not make
any real-time source discoverable. Missing this opportunity are the national portals from Bulgaria, Croatia,
the Czech Republic, Hungary, Portugal, Slovakia, and the UK. Worth mentioning here is that access to real-
time data in the UK as in the other Member States takes place rather directly on the portals hosted by the
respective data providers. Like for API access in general, the space of real-time and dynamic data is strongly
promoted by the latest Open Data and Public Sector Information directive, hence it is expected that soon
most national portal infrastructures will adapt accordingly.
2.4 Portal sustainability
This indicator analyses the extent to which the national open data teams have set up a strategy to ensure
the long-term sustainability of the portal, and the measures in place to ensure that the portal caters to the
needs and brings an added value to the main audience.
In 2019, 22 (79%) of the EU28 national open data portals have a strategy in place that ensures the portal’s
sustainability. This is a slight increase compared to 2018 when 19 (69%) national portals had such a strategy
in place. As in previous years, in most cases, the sustainability strategy seems to be limited to the portal being
recognised as a necessary and instrumental function of government operations in the broader open data
strategy or digital agenda of the country – in the cases in which open data is integrated into this strategy.
The budget to maintain and improve the portals is, hence, part of the budget dedicated to the national open
OPEN DATA MATURITY REPORT 2019 31
data teams’ operations. Beyond that, specific strategies that set out the measures to be taken to ensure the
portals’ sustainability over time do not yet exist in the Member States.
2.4.1 Enhancing visibility
In terms of the activities that enhance the visibility of the portal by promoting their available features and
data, 25 (89%) national teams conduct such promotional work. Moreover, 20 (71%) national portals have an
active social media account to assist with communication and awareness-raising.
Another way in which national portals enhance the visibility of their work is the use of source code sharing
platforms such as GitLab or GitHub to publish their source code and/or other useful software artefacts and
to ask for the community’s feedback on those elements. In 2019, 22 (79%) national teams reported that they
used such platforms in their daily work. The Issue Tracker functionality53
of GitHub is recognised for example
by the Estonian portal team to be a great tool to collect requests from the portal users. Users can use the
Issue Tracker to express their demand for datasets, which is also an opportunity for the open data portal
team to learn about the perceived value of different datasets.
2.4.2 Gathering insights into user satisfaction
In 2019, 12 (43%) national portal teams have conducted a user satisfaction survey on the national portals. This
is a good though not significant number of surveys, representing how the option is not yet fully considered
useful by portal teams.
Among the countries who run user satisfaction surveys, one of the results for Austria was that the search
engine needed to be improved. This result also came out of the Polish survey. Additionally, the Polish survey
revealed that users wanted to be able to use data visualisations and data validators on the national portal,
features that are available on other portals, such as the European Data Portal itself. The Polish survey also
suggested the need for better navigation. One of the results of a Spanish survey was that - among all services
that the national portal offers - e.g. news, articles, use cases, documentation, etc. - users are most interested
in the data catalogue.
The Cypriot national open data portal also conducted a user satisfaction survey in 2018. The findings of the
research were integrated into the “Open Data Cyprus” report of 201954
and made available back to the public.
The results of the survey - as can be seen in the screenshot below - reveal that users evaluate the national
open data portal overall, the website design, and the Government Open Data Initiative as positively or even
very positively. Users are less satisfied with the portals API’s, the searchability of the data and the formats of the
datasets.
53
	 https://github.com/okestonia/Estonian-Open-Data-Issue-Tracker/issues
54
	 https://www.data.gov.cy/sites/default/files/%CE%91%CF%80%CE%BF%CF%84%CE%B5%CE%BB%CE%AD%CF%83%CE%BC%CE%B1%CF%84
	 CE%B1%20%CE%88%CF%81%CE%B5%CF%85%CE%BD%CE%B1%CF%82%20%CE%99%CE%BA%CE%B1%CE%BD%CE%BF%CF%80%CE%BF%CE%AF
	 CE%B7%CF%83%CE%B7%CF%82%20%CE%A7%CF%81%CE%B7%CF%83%CF%84%CF%8E%CE%BD%202018.pdf
Screenshot 4: results from the Cypriot user satisfaction survey (2018)
OPEN DATA MATURITY REPORT 2019 32
The Netherlands conducted an extensive study55
into open data re-use and published the results in July
2019. The study analysed who open data re-users are, how they re-use open data, and what their barriers
and needs are. The researchers used both qualitative and quantitative methods and used log analysis
of the three biggest open data portals in the Netherlands: the statistical portal, the geodata portal and
the national open data portal56
. One of the findings is that re-users experience most barriers in re-using
open data from local governments due to a lack of standardisation, that re-user wants to be involved in
developing open data portals to make them more user-friendly, and that re-users want access to direct
and quick feedback and support mechanisms.
Another good practice comes from Ireland. The Irish national portal offers to those who download a
dataset a survey made of 13 questions, such as what sector the user is from and what the data is being
used for. In addition, the user is asked if there are any changes he or she would like to make to the
national portal, or if the user has any comments on how the portal can be improved. The answers so far
revealed that 50% of the respondents think that the portal is excellent or doesn’t need to be improved.
The suggested changes and improvements are used as input for reviewing sessions of the portal. Other
sources are also used as input for these reviewing sessions, such as best practices from other countries
and suggestions from the portal’s team. Last year, the output from the continuous process of reviewing
the portal resulted in a new home page, a “developer’s corner” section, and a newsletter. Additionally, the
Irish portal plans to release a new feature that allows users to rate datasets, the publication of a number
of open data impact stories, and the creation of an Irish language version.
2.4.3 Reviewing and improving the national portals
With regard to the practices used to review and improve the portals, 23 (82%) of 28 EU national portals
have a process in place by which portals are reviewed and improved regularly. The frequency by which
these processes are run differs per country, as figure 2.4 shows. Most national open data portals (39%)
are reviewed quarterly. The rest of the portals are reviewed bi-annually (26%), annually (17%) or even less
frequently (17%).
A good practice in this regard comes from France. Every six month the national portal team organises
a seminar to review the projects developed by the national portal and the possible improvements.
Discussions are based on user feedback, the needs expressed by the public and private stakeholders, and
log analyses carried out over time. After the seminar, a roadmap is written that specifies the key objectives
set to address those needs.
2.4.4 Monitoring performance
In terms of features that monitor the portals’ performance, 24 (86%) of EU28 portals offer a dashboard
or similar tool to showcase the main key performance indexes related, for example, to the volume and
quality of metadata that the portal offers. In some cases, these are elaborated dashboards showcasing
0%
5%
10%
15%
20%
25%
30%
35%
40%
45%
39%
26%
17% 17%
quarterly bi-annually annually less frequently
100%
Figure 2.4: The frequency of portal reviews
55
	 https://kennisopenbaarbestuur.nl/media/256297/hergebruikers-van-open-data-in-beeld.pdf
56
	 Statistical data: https://opendata.cbs.nl/statline/portal.html?_la=nl&_catalog=CBS; geospatial data: https://www.pdok.nl/datasets;
	 national open data portal: https://data.overheid.nl/
OPEN DATA MATURITY REPORT 2019 33
results on various levels such as increase in metadata over time, broken links, metadata formats and
distribution of licences.
A good practice comes from the Irish national data portal, that offers a designated and thorough dashboard
to visitors as shown in the screenshots below. On top of the page, users can find visualisations regarding
the number of users, the number of publishers, and the total number of datasets versus the total number
of open datasets. In addition, the dashboard shows detailed information regarding the number of broken
links, top keywords found in metadata, and compliance with technical standards, such as the number of
datasets described by compliant DCAT-AP.
Screenshot 5: data visualisations on the dashboard of the Irish national open data portal
Screenshot 6: metadata and data information on the dashboard of the Irish national open data portal
OPEN DATA MATURITY REPORT 2019 34
Going one step further, 16 (57%) of EU28 national portals offer additional features that allow also data
publishers to monitor their own activity on the portal. This type of monitoring tools can create a “positive
competition” amongst public bodies and nudge the lesser performers to improve the volume and
quality of their publication. At the same time, such feature can also help identify data providers that are
top performers and enable the creation of channels for knowledge transfer between them and other
publishers. In some cases, such features also enable publishers to see the popularity of their own datasets
and inform them about the applications that are based on their data.
A good practice in this regard comes from Cyprus, where all data publishers can see all the statistics of
their data, such as the number datasets they provide per data domain, the number of datasets per format,
but more importantly the views and downloads over and changes over time per dataset.
2.5 Overall performance
Figure 2.5 shows the EU28 average maturity on each of the 4 indicators of the portal dimension.
The overall maturity level of the portal dimension is 67%. The most mature indicator within the portal
dimension is deriving insights into portal usage (80%), followed by the features that the portals offer
to ensure discoverability and access to datasets and relevant content (69%), the provision of data by a
majority of data publishers (61%) and lastly ensuring the portal’s sustainability (59%).
When looking at the maturity development over the years, figure 2.6 shows that the portal dimension
increased each year between 2015 and 2017, decreased in 2018, and increased again in 2019. In the early
years, particularly where starting from scratch, it was relatively easy for Member States to improve their
performance by setting up their national open data portals in the first place, in most cases relying on
mainstream dedicated software like CKAN or DKAN. Their basic functionalities have been implemented
thoroughly in the early years to make data available and accessible to the public. Over time and with the
overall open data maturity in Europe increasing and the data re-users demanding for more, portals have
to meet higher expectations to serve the needs of their communities.
69%
80%
61% 59%
0%
10%
20%
30%
40%
50%
60%
70%
80%
90%
100%
Portal features Portal usage Data provision Portal sustainability
Figure 2.5: EU28 averages on open data portal dimension
32%
66%
76%
63%
67%
0%
10%
20%
30%
40%
50%
60%
70%
80%
90%
100%
2015 2016 2017 2018 2019
Figure 2.6: EU28 average open data portal development
OPEN DATA MATURITY REPORT 2019 35
0%
10%
20%
30%
40%
50%
60%
70%
80%
90%
100%
France
Spain
Ireland
C
yprus
FinlandSloveniaRom
ania
Luxem
bourg
N
etherlands
Latvia
Poland
ItalyG
erm
anyEstonia
Austria
G
reece
EU
28
averageBelgium
C
roatiaD
enm
ark
M
alta
U
nited
KingdomBulgariaSw
edenPortugalLithuania
C
zech
RepublicH
ungarySlovakia
Figure 2.7: EU28 open data portal maturity
The country ranking of the portal dimension can be observed in figure 2.7. The figure reveals that 16
Member States score above the EU28 average of 67% and 12 Member States score below the EU28
average. The countries with the highest maturity levels on the portal dimension are France (91%), Spain
(89%), Ireland and Cyprus (both 86%).
OPEN DATA MATURITY REPORT 2019 36
Open data impact
Chapter 3
OPEN DATA MATURITY REPORT 2019 37
The third assessment dimension ”open data impact” analyses the existing approaches and methodologies
developed at country and public body level to monitor and measure the re-use and impact of open data.
The re-use of open data can contribute to the growth of the European economy, the development of
artificial intelligence, and overcoming political, societal, economic, and environmental challenges. The new
Directive on open data and the re-use of public sector information, adopted on 20 June 2019 (Directive
(EU) 2019/102457
), encourages Member States to facilitate the re-use of public sector data with minimal or
no legal, technical, and financial restraints and will make available under specific conditions datasets that,
potentially, have a high impact on society and economy. The following key elements are analysed as part
of the impact dimension:
Metric Key elements
Strategic awareness Monitoring mechanisms are in place at national and public
body level to monitor open data re-use. Methods are in place
to measure the impact that can be derived from re-using open
data.
Political impact Various reuse examples can be provided and the reuse of the
open data available in this field is systematically monitored.
Social impact Various reuse examples can be provided and the reuse of the
open data available in this field is systematically monitored.
Environmental impact Various reuse examples can be provided and the reuse of the
open data available in this field is systematically monitored.
Economic impact Studies that focus on the macro and microeconomic impact
of open data are commissioned or conducted by Government.
Other studies that focus on the economic impact of open data
in a particular sector are available.
3.1 Strategic awareness
This indicator emphasises the importance of a structured approach to monitoring and measuring open data
re-use and impact. This allows to identify trends, bottlenecks and new opportunities, and enables decision-
makers to steer initiatives and boost open data and its re-use and impact.
Data published in the open allows anyone to re-use it. Consequently, its audience is a wide variety of
groups, such as researchers, journalists, developers, private companies, NGO’s, and citizens. One of the
most important groups of re-users is public sector bodies, re-using the data from other public sector bodies.
In 2019, 25 (89%) of the EU28 Member States recognised this as a trend. Of these, 20 (71%) made supporting
this type of re-use a priority at a national level, a clear increase from only 10 countries (36%) the previous
year.
Answers provided by the Member States show that the re-use of public sector information enables public
bodies to become more effective and efficient, to make more informed decisions, and to improve their
services to citizens. In Ireland, for example, city dashboards such as the Cork Dashboard58
are increasingly
being used to facilitate citizens, businesses, and the policy-makers themselves to access information about
the city in an unprecedented way. The Cork Dashboard allows users to monitor a huge range of public data
at a glance, from real-time traffic and weather information to air quality and crime levels.
3.1.1 Monitoring and boosting open data re-use
In 2019, 21 (75%) of the EU28 Member States report that they have mechanisms in place to monitor the re-
use of data featured on their national open data portals. This is mainly done by using web analytic tools to
gain insights into visitors and what data is being accessed, such as the most popular datasets and domains.
National open data portals monitor open data re-use also by tracking and showcasing new applications,
services, and products that are built with the data they offer.
57
	 https://eur-lex.europa.eu/legal-content/EN/TXT/?uri=CELEX:32019L1024
58
	 https://www.corkdashboard.ie
Chapter 3: Open data impact
OPEN DATA MATURITY REPORT 2019 38
In addition to monitoring and boosting the re-use of data at national level, 22 (79%) Member States mention
that the contributing public sector bodies conduct such activities for themselves, too. This is exemplified by
public sector bodies increasingly engaging with re-user’s communities, organising open data events such
as hackathons, fairs, workshops, and meet-ups, conducting studies into re-use barriers and benefits, and
fostering cooperation with open data driven civil society and volunteer groups.
The Statistical Office in Slovenia, for example, has been carrying out several activities to encourage the re-
use of its statistical data, such as press conferences, engagement on social networks, and presentations of
statistical data targeting different kind of interested re-user groups.
In Sweden, around 45 organisations were connected to the Hack for Sweden59
to promote citizen-driven
innovation and open data, and the Swedish Energy Agency organised an innovation contest on open data
and mobility60
. In addition, the national challenge platform61
was launched, where public organisations can
post innovation contests and challenges to solve with open data. The aim of the platform is to increase the
re-use of open data and public administration documents and to facilitate public actors to highlight current
societal challenges that can be solved with open and data-driven innovation.
In Spain, the Castilla-León Open Data Competition62
and the Barcelona Open Data Challenge63
were
organised last year. Both challenges took place at city level with the aim of promoting open data re-use and
to support their community in the city. Another example of a public body initiative last year was Asedie’s
annual International Conference on the Re-use of Public Sector Information across Spain64
, which served as
a platform to share knowledge and experiences within the open data community and to promote public-
private collaboration.
3.1.2 Measuring open data impact
Beyond monitoring re-use, 15 of the EU28 (54%) Member States mention having a methodology in place
to measure the impact of open data. When analysing their answers, however, it becomes clear that most
countries lack a measurement framework, and impact assessment is unsystematic. Through surveys and web
log analysis, countries gain insight into the re-use of open data, but it is much more complex to measure the
impact that is derived by re-using. Measuring the number of downloads of open meteorological datasets, for
example, does not represent how many citizens use predictions from the weather application - that is built with
this data - to decide to take the train or the car to avoid bad weather. Open data might have a high impact on
people’s daily life, but this impact is hard to quantify. Measurement frameworks can help countries to structure
their approach in measuring open data impact in the fields of politics, society, environment, and economy.
This year more than in previous years countries have increased their efforts in understanding the impact
of open data re-use. Studies have been conducted on national as well as public body level and targeted
different topics related to re-use, such as barriers, demands, and needs, as well as different areas or sector,
such as studies into the use of geospatial open data. Studies conducted into the re-use and the political, social,
environmental, and economic impact of open data are covered in the next sections of this chapter.
3.2 Political Impact
“Political impact” refers to the impact of open data on the public sector and citizen engagement. Open data
supports the public sector in improving their internal processes and services and to engage with citizens.
In this field, open data has a specifically high impact in Cyprus, Finland, France, Germany, Ireland, Italy,
Luxembourg, Slovenia, Spain and the United Kingdom, as reported by the countries’ open data teams.
In 2019, 25 (89%) of the EU28 Member States confirmed that open data is used in policy-making processes
in their country, for example as evidence for problem identification and policy formulation. In addition, 24
(86%) Member States confirm that open data is also used in decision-making processes, for example public
59
	 https://hackforsweden.se/
60
	 https://challengesgov.se/sustainable-mobility-challenge/
61
	 https://challengesgov.se/
62
	 https://datosabiertos.jcyl.es/web/es/concurso-datos-abiertos/concurso-datos-abiertos.html
63
	 https://ajuntament.barcelona.cat/digital/en/digital-transformation/city-data-commons/open-data-challenge
64
	 https://datos.gob.es/es/eventos/ya-puedes-inscribirte-la-10a-conferencia-internacional-sobre-reutilizacion-de-la-informacion
OPEN DATA MATURITY REPORT 2019 39
administrations making use of open data as a knowledge basis for their daily operations. This highlights the
importance of open data re-use for governmental institutions.
The following section specifically looks at the impact that open data has on increasing 1) transparency
and accountability, 2) effectiveness (e.g. improving the quality of public service delivery) and 3) efficiency
(e.g. reducing costs) in the public sector. Figure 3.1 shows the countries’ perceived impact of open data on
transparency and accountability, effectiveness, and efficiency. The figure reveals that 20 (71%) of the EU28
Member States perceive a high impact of open data on transparency and accountability of governments, 15
(54%) a high impact on effectiveness and 12 (43%) a high impact on efficiency. In the following, the report
looks at these three fields in more detail.
3.2.1 Transparency and accountability
Publishing public sector information in an open format increases government transparency and enables
citizens to hold their representatives accountable. In 2019, 20 (71%) of the EU28 Member States indicate
that open data has a high impact on government transparency and accountability, while 5 Member States
(Belgium, Bulgaria, Estonia, Lithuania, and Romania) indicate the impact as medium, and only Hungary
as low65
. Two popular topics regarding increasing transparency and accountability through open data are
providing insights into government expenditure (1) and providing insights into the behaviour of politicians
and political parties and into elections (2).
Insight into government expenditure
A large number of websites and applications based on open data has been developed to enable citizens to
understand how public money is spent. An example comes from Croatia, where the Association of Croatian
Counties released the “Open Budget”66
project to raise the level of transparency of county budgets. The
aim of the project is to support all counties visualise their budgets in a unified, consistent manner. The
application enables citizen to monitor and compare local and regional budgets and spending and thereby
increases their transparency.
Another example is the Austrian website offenerhaushalt.at67
. The website presents all financial data of the
country’s municipalities in an easy and understandable way. The website is created for both citizens as well
as for civil servants to provide a clear overview of municipal finances.
Also, the Finnish website tutkihankintoja.fi68
allows citizens, companies, and interest groups to explore public
spending. It provides information on state spending on goods, supplies and services down to the purchase
order level. The website improves transparency in the use of public funds and provides information on the
market for those companies that aim to be suppliers to the government.
Insight into the behaviour of politicians and political parties, and into elections
Another popular area regarding transparency and accountability is the use of open data to gain insights into
65
	 Two Member States stated that they do not know.
66
	 https://www.internationalbudget.org/wp-content/uploads/croatia-open-budget-survey-2017-summary.pdf
67
	 https://www.offenerhaushalt.at/projektinfo
68
	 https://tutkihankintoja.fi/tietoa-palvelusta
Figure 3.1: The political impact of open data
Low Medium High
4%
11%
4%
18%
21% 36%
71% 54% 43%
0%
10%
20%
30%
40%
50%
60%
70%
80%
90%
100%
Transparency Effectiveness Efficiency
OPEN DATA MATURITY REPORT 2019 40
the behaviour of political parties and politicians, and into elections. Examples range from websites that allow
fact-checking of political statements to applications visualising voting behaviour and election results.
Politica.io69
is an innovative political analysis tool and interactive application developed by a Cyprus-based
start-up. The application re-uses open data from the Lands Surveys Department and the Elections Service
to provide graphic visualisation of election results. Also, a trend increase is observed in Cyprus to re-use
datasets from data.gov.cy for data journalism, to analyse behaviour of political parties and politicians to
increase transparency and accountability.
Another example of how open data can inform citizen on political decisions is the application “Voordat Het
Nieuws Was”70
(in English: “before it was news”) from the Netherlands. The application makes the public
aware of political decisions by showing what has been done before something is decided at political level
and becomes news. This is done by a browser plugin that shows the reader of a news article the policy
documents that underlie the news, such as amendments, motions, and letters.
3.2.2 Increasing effectiveness
Open data has the potential to increase government effectiveness, specifically in delivering public services.
15 (54%) of the Member States indicate that open data has a high impact on government effectiveness, while
6 (21%) indicate a medium impact and 3 (11%, Czech Republic, Portugal, and Poland) indicate the impact
as low71
. There are multiple ways in which open data can improve the quality of public service delivery and
make governments more effective. The EU28 Member States have improved their public service delivery
by making it easier for citizens to interact with the government. In addition, public administrations make
use of open data as evidence for their daily operations, problem identification and policy formulation, and
therefore are able to provide more effective services.
An example of open data re-use to increase government effectiveness comes from Spain. The application
Almería Mantiene72
provided by the Almería City Council enables users to send and track notices and requests
affecting the maintenance, and repair of public roads. This is a two-way real-time communication channel:
for users, it is a way to communicate issues that must be addressed by the council, such as potholes, road
damage, etc. For the council, on the other hand, it is a channel to notify users of possible issues on their
routes and request additional information from users if necessary.
Another example of open data re-use that supports informed decision-making and increases government
effectiveness comes from France: it is the Secmar Map73
from the National System of Observation of the
Safety of the Nautical Activities. Secmar Map is an interactive map showing accidents at sea. Through
analysing this data, the government can better predict where accidents will happen and improve the location
of lifeguards on the territory. In addition, the information from the map is used for awareness campaigns and
advice on safety at sea.
Estonia also re-uses open data to increase government effectiveness. The Agricultural Registers and
Information Board (ARIB) map74
uses data from the European Space Agency’s Sentinel satellite system for
remote sensing of the mowing and grazing of grassland to improve the administration of their geographical
area-based financial support to farmers. The aim is to detect violations of legal requirements with minimal
effort, increase the effectiveness of the supports, and save on administration costs.
3.2.3 Increasing efficiency
Opening up data can also lead to more government efficiency, for example by reducing operational costs.
Twelve (43%) of the Member States indicate that open data has a high impact on government efficiency,
while 10 (36%) indicate that there is a medium impact and only Portugal indicates that there is a low impact75
.
Publishing data in an open format gives re-users such as local administrations or citizens the opportunity to
obtain data without having to explicitly request it. Data holders do not have to repeatedly go through the
process of dealing with data requests, thus reducing operational costs.
An example of this comes from Belgium, where the Federal Ministry of Finances published parts of the
69
	 https://www.politica.io
70
	 https://www.voordathetnieuwswas.nl/
71
	 Four Member States stated that they do not know.
72
	 https://datos.gob.es/en/aplicaciones/almeria-mantiene
73
	 https://carte.snosan.fr/
74
	 https://kls.pria.ee/kaart/
75
	 Five Member States were not able to assess the impact.
OPEN DATA MATURITY REPORT 2019 41
Cadastre data in the open. This enabled local administrations to re-use it without making requests and thereby
saving time and money on both sides: the Ministry as well as the local administrations. Another example from
Belgium is Lex.be76
: a legal search platform that provides easy access to documents from the judiciary and
makes them searchable. The platform aims to help courts in developing a sound legal basis for their sentences
and increase efficiency by lowering costs. It also increases transparency and accountability.
3.2.4 Monitoring the political impact of open data
In 2019, 15 (54%) Member States have conducted some type of activity to monitor and showcase the political
impact of open data in their country. Examples are presented below.
Denmark published a study77
that shows examples of how government agencies can systematically open
data. It provides examples and best practices, mainly from the Ministry of Energy, Supply and Climate, and the
Ministry of Employment. The study linked the availability of data to its political impact and advocated the merits
of open data for political transparency and efficiency.
In Italy, results on the specific open data actions are included in the third action plan for Open Government
2016-2018 monitor political commitment in the international context of the OGP. Italy is in the process of
drafting the 4th National Action Plan for the Open Government 2019-2021. In addition, the monitoring actions
expected in the context of the indicators foreseen by the Partnership Agreement on Open Data objectives
allows “political” feedback on the impact of open data on projects funded through the Partnership Agreement.
In Spain, activities to monitor the impact of data and, specifically the political impact, include for example an
online questionnaire78
where different public administration entities are asked to identify case studies in which
data re-use has a political impact. Furthermore, the country reports news and success stories showing impact
in the political field. Content is researched and created to showcase the impact, e.g. in use cases, news and
an event calendar79
.
3.3 Social impact
In this chapter, the impact of open data on society is examined, as well as the extent of using open data to
address societal challenges. Figure 3.2 shows how the EU28 countries perceive the impact of open data
through 2018 and 2019. The figure reveals that the percentage of countries perceiving a high social impact
increased from 39% in 2018 to 46% in 2019. For medium impact, this slightly decreased from 39% to 32%
and the for low impact the percentage decreased from 14% in 2018 to 2 countries (7%) in 2019 - Slovakia
and the Czech Republic. Overall, the answers provided by the Member States show that the perceived social
impact of open data increased compared to 2018, with, in 2019, more Member States indicating a high
impact and fewer Member States indicating a low impact.
76
	 https://lex.be
77
	 https://www.ft.dk/~/media/sites/statsrevisorerne/dokumenter/2018/beretning-12-2018-om-aabne-data.ashx?la=da
78
	 https://datos.gob.es/es/evaluacion-del-ecosistema-de-los-datos-publicos-reutilizables-en-espana
79
	 https://datos.gob.es/en
Figure 3.2: The social impact of open data
0%
10%
20%
30%
40%
50%
70%
60%
2018 2019
Low Medium High
100%
OPEN DATA MATURITY REPORT 2019 42
A wide variety of open data initiatives and applications enable citizens to discover insights into different
topics that concern society such as food waste, gender equality, noise pollution, etc. In 22 (79%) Member
States there are civil society initiatives that are open data-driven and aim to tackle one or more problems
in the social field. That is an increase of 8 countries (+36%) compared to last year, which clearly indicates a
significant development.
Within the broad field of social aspects and challenges, this year’s report specifically looks at housing in
urban areas and the inclusion of marginalised groups. The results of the impact on these two aspects, as the
Member States rate it, are presented in figure 3.3. The figure reveals that 46% of the Member States perceive
a high impact of open data on housing in urban areas and 43% perceives a high impact of open data on
the inclusion of marginalised groups in society. Whereas only 2 Member States (7%) perceive a low impact
on housing in urban areas, 18% of the Member States rate the impact on inclusion of marginalised groups
as low.
3.3.1 Housing in urban areas
Aspects of housing - from availability to quality, to price - are becoming more important. Information about a
neighbourhood and its facilities and characteristics helps citizens and companies make informed decisions
about housing, living and doing business.
When looking at the assessment of social impact enabled by open data to raise awareness concerning
housing in the city, 13 (46%) countries rate the impact as high. Especially Finland, France, Germany, Ireland,
Italy, Latvia, Lithuania, Netherlands, Poland, Slovenia, Spain and Estonia provided inspiring examples. 7 (25%)
countries assessed the impact as medium, and 2 (7%) (the Czech Republic and Romania) described it as
low80
. By cross-referencing these results with country and city population density or housing prices, there
is no significant correlation observed. E.g., countries that have the most populated cities (France, Belgium,
Greece, Spain) or highest housing prices (France, Austria, Sweden, Netherlands, the Czech Republic, Finland,
Italy, Germany, Spain)81
do not necessarily show a higher maturity in using open data to address housing
issues.
In Estonia, open data is used to provides citizens insights about their neighbourhoods, such as crime
rates82
, school locations83
, real estate prices84
, and children’s playgrounds and dog parks85
. The Spanish
Urban Data Analytics86
is dedicated to segmented and geolocated real estate knowledge. The website
combines the real estate sector with Big Data and Business Intelligence and provides a service with 190
indicators focused on real estate published both via APIs and interactively to offer instant knowledge
80
	 Six countries were not able to assess the impact.
81
	 https://www.statista.com/statistics/722905/average-residential-square-meter-prices-in-eu-28-per-country/
82
	 https://www2.politsei.ee/et/organisatsioon/analuus-ja-statistika/avaandmed.dot
83
	 https://info.haridus.ee/Asutused/Kool
84
	 http://www.maaamet.ee/kinnisvara/htraru/
85
	 https://www.manguvaljakud.tallinn.ee
86
	 http://www.urbandataanalytics.com/
87	
https://kurgyvenu.lt/	
Figure 3.3: Addressing societal challenges with open data
100%
7%
18%
25%
21%
46%
43%
0%
10%
20%
30%
40%
50%
60%
70%
80%
90%
Housing in urban areas Including marginalised groups
Low Medium High
OPEN DATA MATURITY REPORT 2019 43
of the property market and property portfolio to organisations. The Lithuanian website kurgyvenu.lt87
is
a project that provides the most important information about real estate and quality of life in different
place in the country. Open data, collected and structured from various source institutions, conveniently
presents the market value of a particular real estate, heating costs, air pollution, noise and crime rates,
distances to important locations, demographic situation and even the ranking of the nearest schools.
3.3.2 Inclusion of marginalised groups in society
Inclusion of marginalised groups describes the process in which individuals or entire communities whose
participation in politics and society was originally challenged, can now enjoy rights, opportunities and
resources to better partake in social, cultural, and political life. Marginalised groups can be, for example,
elderly people, people with disabilities, or minorities.
When looking at the assessment of social impact enabled by open data to improve inclusion of marginalised
communities, 12 (43%) countries, that is 4 more than last year and 10 more than in 2016, rate the impact
as high. The countries are Cyprus, France, Greece, Ireland, Italy, Spain and this year also Croatia, Denmark,
Finland, Netherlands, Poland and Sweden. Slovenia and the UK decreased their rating from high to medium
impact on the inclusion of marginalised groups in 2019. In addition, 5 (18%) countries assessed it as medium,
and another 5 (Austria, Belgium, the Czech Republic, Estonia, Germany) described it as low.
A wide variety of websites, applications, and services based on open data have been developed with the aim
to promote the inclusion of marginalised groups into society. Examples provided by EU28 Member States
are mainly applications that make it easier for these groups to live their daily lives and participate in society in
ways that are better integrated. Most applications focus on immigrants or on people with disabilities. Other
applications focus, for example, on fighting poverty and on rural areas and population.
The Canary Island Women Open Data Project88
, for example, aims to promote the use of open data to raise
awareness on and facilitate gender equality, fostering work-life-free time balance and equal distribution of
public and private responsibilities between men and women. In Cyprus, the Migrant Information Service
(MIC) has developed an application called MiHub App89
based on open data to support the access to services
and resources that meet migrants’ needs and to put emphasis on building new skills towards harmonically
adjustment to the Cypriot cultural and social environment. The National Authority for Citizenship of Romania
has upgraded its services for immigrants requiring citizenship, making use of and publicly available data90
. As
part of the Open Government Partnership 2018-2020, the Ministry of Labour and Social Justice is updating
and increasing the accessibility and usability of a platform dedicated to mapping existing social services. The
commitment will also focus on the development of social inclusion policies and re-use of data.
Inclusion of people with disabilities
The C.I.D.-S.I.S.TE.M. project in Marsala, Italy, is an innovative organisational structure of the institutions
in the planning and management of services to the disabled population, that uses also open data for the
promotion of their rights and social well-being. The initiative is characterised by a multidisciplinary and
innovative approach and a strong technological and participatory connotation, associated with a deep
knowledge of the aspects of disability in the area.
The city of Utrecht in the Netherlands provides citizens with a map91
that shows parking places reserved
to disabled persons. Besides the location of parking spots in the city, users can also find additional
information, such as the exact length and width of the parking spots and the type of surface.
Another example comes from Germany, where the Federal Ministry of Labour and Social Affairs launched
a website92
that provides information for persons with disabilities and their relatives. Included is data about
institutions providing support for children and teenagers with disabilities.
88
	 https://www.opendatamujerescanarias.es/
89
	 https://mihub.eu/en/, datasets at: https://www.data.gov.cy/dataset/%CE%BA%CE%B1%CF%84%CE%AC%CE%BB%CE%BF%CE%B3%CE%BF%CF
	 %82-%CE%BA%CE%AD%CE%BD%CF%84%CF%81%CF%89%CE%BD-%CE%B5%CE%BE%CF%85%CF%80%CE%B7%CF%81%CE%AD%CF%84%CE
	 %B7%CF%83%CE%B7%CF%82-%CE%BC%CE%B5%CF%84%CE%B1%CE%BD%CE%B1%CF%83%CF%84%CF%8E%CE%BD
90
	 https://portalgis.servicii-sociale.gov.ro/arcgis/apps/MapJournal/index.html?appid=80a803fabb834a67971c1053a65c18bd, http://ogp.gov.ro/
91
	 https://www.utrecht.nl/wonen-en-leven/verkeer/fiets/fiets-stallen/p-route/
92
	 https://www.einfach-teilhaben.de/DE/AS/Themen/KunstKultur/KinoundTheater/kinoundtheater_node.html
OPEN DATA MATURITY REPORT 2019 44
In Slovenia, the State Electoral Commission presented statistical data on the attendance of the electoral
polling stations by disabled persons. On the basis of that data - and a constitutional court decision-based in
it - the legislation has been changed so that all of the polling stations must physically enable easy access to
the disabled.
Rural areas and population
In 2019, the Spanish Ministry of Development and Environment of the Junta de Castilla y León published
the “Open Data Guide: Publication and reuse of Open Data as an Open Government initiative in the
Administration”93
. The guide is part of the Digital Rural Community, a collaborative project between Public
Administrations of Portugal and Spain, with the objective to improve the technological innovation of rural
institutions, promoting cooperation and competitiveness. The guide contains a dedicated chapter on
examples of innovative solutions and success stories based on open data. Another example from Spain
is the “Basque atlas by small areas”: a web portal created to monitor geographic inequality in health,
social-economic, and environmental indicators in the Basque Country, taking the gender perspective into
account. The maps displayed help to better understand the geographical distribution of health indicators
and their decisive factors in the population. This fosters decision making and preparing policies designed
to bring inequality to an end.
3.3.3 Monitoring the social impact of open data
In 2019, 10 (36%) Member States (in 2018 it was 39%) report to have conducted activities to monitor the
social impact of open data. Below are interesting examples of such conducted research.
The Aportia Academy in Belgium published a white paper on Smart cities called “Livre blanc Smart cities:
les données, la pierre angulaire des villes et communes du futur” (English: “Data, the cornerstone of cities
and towns of the future”)94
in March 2019. The report researches and promotes the usefulness of open data
for cities and municipalities to support their policies and improve citizens’ comfort. In addition, the report
provides advice to local governments to start working concretely with their data.
Open data DK and KL (KL is an interest organisation for the 98 municipal councils in Denmark), has launched
a project aiming to shed light on the value of open data in the Danish municipalities. The project is especially
interested in emphasising the social impact of open data. This is done by highlighting the impact and value
of several use cases. The purpose is to illuminate concrete examples of open data re-use that are also
relevant to smaller municipalities.
Furthermore, the Irish Open Data Impact Series95
promotes awareness, adoption, and re-use of open data
and aims to monitor impact in the country with a particular focus on social and economic aspects. The 4th
series, for example, focused on open data supporting art, heritage and culture.
3.4 Environmental impact
This indicator focuses on the activities that monitor and address environmental issues through open data,
examples of how open data is used to raise awareness on environmental challenges, and the existence
of open data-driven civil society initiatives that aim to address environmental challenges. Currently, there
is a large amount of open environmental data that is available across Europe, including geospatial data,
meteorological data, air and water quality data, weather data, and noise levels. These datasets have the
potential to enable users to discover new insights into the environment and to increase citizens’ participation
and awareness of different environmental issues.
Figure 3.4 shows how the EU28 countries perceive the environmental impact of open data through 2018
and 2019. The figure shows that the percentage of countries perceiving a high impact increased from 39%
in 2018 to 57% in 2019. The percentage of countries perceiving a medium environmental impact did not
93
	 https://datos.gob.es/sites/default/files/doc/file/open_data_publicacion_y_reutilizacion_de_datos_abiertos_como_iniciativa_de_gobierno_
	 abierto_en_la_administracion_compressed.pdf
94
	 https://www.agoria.be/fr/Livre-blanc-Smart-cities-les-donnees-la-pierre-angulaire-des-villes-et-commues-du-futur
95
	 https://data.gov.ie/it/blog/open-data-impact-series-4-open-data-supporting-arts-culture-and-heritage
OPEN DATA MATURITY REPORT 2019 45
change and the percentage of countries perceiving a low impact decreased from 21% in 2018 to 14% in 2019.
In conclusion, the answers provided by the EU28 Member States show that the perceived environmental
impact increased, with in 2019 more Member States stating a high impact and less stating a low impact.
3.4.1 Open data to address environmental issues
This year’s open data maturity report specifically focusses on the use of open data to address the following
different environmental issues: (1) water and/or air quality, (2) waste management, (3) environmentally
friendly transport offers, and (4) noise levels in cities. The percentage of EU28 Member States stating that
there are services and applications available in the country that address these environmental issues can be
seen in figure 3.5.
It can be observed that 25 (89%) of the EU28 Member States report that they have a service or application
that raises awareness on water and/or air quality. For example, the Municipality of Sofia in Bulgaria developed
a platform96
that informs users on the quality of the air. The platform shows the level and daily average of
a specific type of air pollution (PM10) from measuring stations across the city. In addition, the platform
provides a two-day forecast for PM10 levels calculated from open data from the Department of Weather
Forecasts. Access to this type of information, citizens can be informed of what the air quality will be and
adjust their plans accordingly to avoid pollution.
Regarding waste management and reduction, 24 (86%) of the EU28 Member States provide services that are
based on open data. An example is Differenziata Teramo97
, an Italian website and application that uses open
data to inform and develop awareness among users on aspects such as the correct separation of types of
96
	 https://air.sofia.bg/
97
	 https://www.differenziatateramo.it/
Figure 3.4: The environmental impact of open data
0%
10%
20%
30%
40%
50%
60%
70%
2018 2019
Low Medium High
100%
Figure 3.5: Addressing environmental challenges with open data
89%
86%
82%
75%
0%
10%
20%
30%
40%
50%
60%
70%
80%
90%
100%
Water/Air auality Waste management Environmentally friendly
transport
Noise level
OPEN DATA MATURITY REPORT 2019 46
urban waste for collection, and the timetable for their collection. The application also updates users on
waste management news in Italy and guides users who have doubts on how to recycle different materials.
Regarding environmentally friendly transport systems, 23 (82%) of the 28 EU Member States report that there
exist applications, services or platforms based on open data that aim to raise awareness on the different
sustainable mobility offers in their country. An example is Elmo98
from Estonia, a platform that informs users
on the locations of charging stations for electric cars.
Regarding noise levels, 21 (75%) of the EU28 countries report that there are applications using open data
to raise awareness on noise levels and noise protection. For instance, the Austrian application and website
Lärminfo.at99
, that alerts and updates users about noise levels caused by, among others, cars, trains, and
airplanes. In addition, it provides news articles that are related to noise, such as new calculation methods
for noise levels or technology for silent car tires.
3.4 2 Monitoring the environmental impact of open data
Monitoring the impact of open data on the environment can be done through, for example, organising and
participating in events, conducting studies to understand the impact of open data in the environmental field
or sub-dimensions of this field, or identifying news and success stories that show the impact of open data
re-use in the environmental field. In 2019, only about half (46%) of the EU28 Member States conducted such
activities, whilst 5 (18%) do not conduct such activities and 10 (36%) are unsure.
A good practice in this regard comes from Ireland. On 29 April 2019, the Irish open data portal team
launched their third Open Data Impact Series100
with the theme ‘How open data can help the environment’.
The event focused on how data is being used for different services, what challenges users are facing and
what other environmental data could potentially be made available in the open. Ireland currently offers 2705
open environmental datasets (23 October 2019) - including meteorological, data, air, water and energy
consumption data - that can be harnessed to discover new insights or used to create new services and
applications. The Open Data Impact Series offered the Irish open data team an invaluable opportunity to
observe how open environmental data is being used, how impact is being created by re-use, and brought
together publishers and re-users to discuss the use of data in addressing environmental challenges.
3.5 Economic impact
Measuring the economic impact of open data is particularly important as a basis to argue for additional
resources or efforts, as quantifiable benefits can be weighed against the investment required to produce
and publish it.
Economic impact can be measured using different approaches and indicators. The most direct economic
impact of open data is the costs saved by getting the data free of charge (or at a minimum cost). If the data
was not available in the open, re-users would need to buy it or produce it themselves.
In other cases, if the demanded data was not available, not even for sale, and the re-users were not able to
produce it themselves, making the data open is the event that enabled the creation of a new or improved
service or product or provided new insight. In these cases, the economic benefit is more complex to
measure and intertwined with other factors.
Indirect benefits can also be identified for example through jobs created, resources saved, productivity
gained, etc. that have to be taken into account. This further confirms that the benefits due to open data
availability are broader than just the money saved. However, measuring this benefit is, due to its complexity,
challenging. Despite that, more than half of the Member States (57%) reported activities in the past year to
monitor the economic impact of open data. Quantifying and showcasing the economic impact of open
data is a key element for countries to rallying support for open data and to trigger publication and re-use.
98
	 http://elmo.ee/charging-network/
99
	 https://www.laerminfo.at/
100
	https://data.gov.ie/blog/open-data-impact-series-3-how-open-data-can-help-the-environment
OPEN DATA MATURITY REPORT 2019 47
In 2019, further progress in this regard can be observed, compared to previous years. Several studies
have been conducted that assess the economic value of open data, at the forefront from Denmark,
France, Germany, Ireland, Luxembourg, Poland, Spain, and the United Kingdom. Whereas in 2015 only 5
countries had conducted studies, in 2017 this number has increased to 9. In 2019- but also in 2018 - 13
countries conducted or commissioned studies to capture the economic value of open data on the macro
level, 11 of which also investigated the micro-level. In addition, 11 countries conducted research on the
economic benefits of open data specific to public administrations. Most studies are either conducted or
commissioned by the government or by civil society and/or private organisations.
3.5.1 Studies to assess the impact of open data impact at a macro-economic level
Macro-economic studies look at the overall market of open data re-use. In Spain, the 7th edition of the
Infomediary Sector report101
, prepared by Asedie was published. The study analyses the economic and
social value of companies that re-use data from the public and/or private sector to create added value
products. It investigates the barriers businesses face when reusing this information and the benefits of
opening these data may bring to the public sector. Asedie detected that the number of companies re-
using open data in Spain has increased by 3.7% compared to 2018, that the Infomediary Sector turnover in
Spain has risen by 5.4%, and the number of employees hired by these companies has increased by 4.6%.
Moreover, the report also measures how long the companies have been operating, the sectors where
they are most present and the type of information they re-used.
Inaddition,theMinistryoftheEconomyandBusiness,throughtheSpanishObservatoryforTelecommunications
and the Information Society (ONTSI) of Red.es, is conducting a study on the infomediary sector. It aims to
discover the characteristics of this market and the businesses that belong to it, to understand the value they
generate and, especially, the barriers they face. ESADE analyses the type of data used by businesses and
their impact on these businesses in their report “Adoption and impact of Big Data and Advanced Analytics
in Spain”.102
A public satisfaction survey study from Luxembourg, “Impacts of Open Data in Luxembourg and the
Greater Region - 2019”103
investigates the economic impact of open data. The results show that the users
of the open data portal consider that the available data leads to an economic impact due to new business
opportunities in the ICT sector and the data science market, as well as the possibility to create new jobs or
start-ups. The macro-economic study is based on the methods already used by other European countries
to assess the potential scope of the public data market. These methods are based on ex-ante indicators
that provide information on four major types of metrics defined by the report Creating Value Through
Open Data104
.
The German Federal Ministry for Economic Affairs and Energy is currently also undertaking a study
concerning the economic impact of open government data. The study looks at the economic impact in
Germany and finance models of municipalities. The Czech Republic, as well, is in the process of creating
their Annual Report on the State of Publication of open data in the Czech Republic, which gathers and
analyses information about the economic impact of open data.
3.5.2 Microeconomic and sector-specific studies
Many studies that explore the economic benefit of open data focus on a micro level, investigating businesses
or specific sectors, such as transport, forestry, or tourism. Others do focus on specific data, such as geospatial
data. This kind of studies shows an increasing trend, as they allow for more granular results.
Austria conducted, for example, a survey for companies in Vienna to monitor the economic impact of open
data105
. The Finnish study “Benefits from Open Data” focused specifically on barriers of supply and demand
of open data in private organizations106
. The Swedish Forest Agency calculated, according to an analysis
performed by the European Association of Remote Sensing Companies (EARSC), the total direct economic
101
	https://datos.gob.es/en/noticia/available-7th-edition-infomediary-sector-report
102
	http://itemsweb.esade.edu/wi/Prensa/InformeESADE_AdopcionImpactoBigDataAdvancedAnalytics.pdf
103
	https://data.public.lu/en/datasets/study-impacts-of-open-data-in-luxembourg-and-the-greater-region-2019/
104
	https://www.europeandataportal.eu/sites/default/files/edp_creating_value_through_open_data_0.pdf
105
	https://www.data.gv.at/2018/01/19/umfrage-open-government-wien/
106
	https://lutpub.lut.fi/handle/10024/158560
OPEN DATA MATURITY REPORT 2019 48
benefit of satellite Imagery for Sweden’s forest management on between €16.1m and €21.6m per annum.107
The Danish Geo Forum108
will analyse how, in the future, data and distribution solutions to create value for
users in public administration and in companies.
Poland carried out a study on the impact of open data on the economy as part of the Main Office of
Geodesy and Cartography participation in the international OpenELS project109
, supported by geodesy
and cartography offices from Poland, Norway, the Netherlands, Germany, Spain, Great Britain, Finland and
Sweden, and the EuroGeographics association. The results show a steady increase in the interest and use
of open geospatial data by a growing number of institutional and business users (up to 10-15%), contributing
to the growth of the digital market’s growth rate on a European scale. The main areas in which the greatest
impact of open data availability have been identified are 1) the improvement of existing products and
services; 2) the development of new services and products based on geospatial data, and 3) the reduction
of time and cost of data acquisition (up to 90%).110
Poland also conducted a study of the conditions and directions of spatial development of Gdańsk111
and on
open data as a source of innovation-drive of enterprises - published by the Technical University of Lodz112
.
According to a study commissioned by the Ministry of Digitisation, the Polish economy is expected to gain
above-average benefits thanks to increased productivity and new business models, making investing in a
data-based economy most advantageous.113
Latvia’s Jelgaca City investigated technologies that capture and analyse data on population movements,
flood risks, and other infrastructure issues in the city as part of its Smart City initiative.114
Spain, as well, focused on the Smart City concept and explored the implications for tourism management
in smart cities and tourist destinations due to the use of open data.115
3.5.3 Economic impact of open data for the public sector
Some studies focus specifically on the economic impact of open data for the public sector. The Regional
Government of Castile-León in Spain, for example, published a study116
on publication and re-use of open
data as an Open Government initiative.
A study from Tallinn University investigated the capability of Linked Open Statistical Data (LOSD) and Open
Government Data (OGD) to drive the creation of new and innovative public services to provide higher levels
of public value: “The Role of Linked Open Statistical Data in Public Service Co-Creation”117
.
Latvia focused on Interinstitutional Data Exchange118
in their e-index survey about the publication of data
as well as its use in the performance of their duties. The e-index119
is an assessment of the maturity of the
digital environment in the work and service delivery of public administrations and municipalities. The e-index
provides a fact-based assessment of how actively and fruitfully institutions and municipalities are using
modern information and communication technologies and practices to improve the quality and accessibility
of services provided to citizens and businesses, and the effectiveness and environmental friendliness of
organisations.
107
	http://earsc.org/news/what-is-the-economic-value-of-satellite-imagery-the-case-of-forest-management-in-sweden
108
	https://geoforum.dk/
109
	https://openels.eu/
110
	https://openels.eu/wp-content/uploads/2019/04/Open_ELS_socio_economic_benefits_final_report_Website.pdf
111
	 https://www.gdansk.pl/download/2018-06/109370.pdf
112
	https://www.polsl.pl/Wydzialy/ROZ/ZN/Documents/z120/Goli%C5%84ska-Pieszy%C5%84ska,%20Batorowicz.pdf
113
	https://www.gov.pl/web/cyfryzacja/gospodarka-oparta-o-dane-przemysl-
114
	https://www.tvnet.lv/4550022/gudra-un-drosa-pilseta-jelgava
115
	https://investigacionesturisticas.ua.es/index
116
	https://datos.gob.es/es/documentacion/open-data-publicacion-y-reutilizacion-de-datos-abiertos-como-iniciativa-de-gobierno
117
	https://dl.acm.org/citation.cfm?id=3209415.3209446
118
	http://www.varam.gov.lv/lat/darbibas_veidi/e_parv/vis/?doc=12652
119
	https://mana.latvija.lv/e-indekss/
OPEN DATA MATURITY REPORT 2019 49
France made their efforts concrete and sound by defining into law (in article 14 of the Digital Republic Bill)
a series of “reference datasets”, that are mandated to be in open data because of their great economic
impacts120
. A few of these include sensitive information such as personal data, but the country made the
decision that the value of the reference datasets is more important to the country than the risk of disclosure
and created any necessary legal basis to release them in any case, and without anonymisation121
.
3.6 Overall performance
Figure 3.6 shows the EU28 average maturity on each of the 5 indicators of the impact dimension. The
overall maturity level of the impact dimension is 57%, which is the lowest maturity level of the four open data
dimensions. The most mature indicator within the impact dimension is the environmental impact of open
data (69%), followed closely by the political impact of open data (67%), which shows that Member States are
aware of the many services and applications that re-use open data to address environmental challenges and
increasingly use it to increase government efficiency, effectiveness, and to provide transparency. Creating
impact on society, however, seem to be more challenging for Member States. With an average score of
46% the social impact indicator is lagging behind. Measuring the economic impact of open data seem to
be most difficult for Member States (28%). Although some countries conducted economic impact studies,
most EU28 Member States did not recently address the economic value that can be derived from open data.
The average score of 65% on strategic awareness shows that although EU28 countries are already making
efforts to boost the re-use of open data, a strategic approach to monitor and measure the impact derived
by the use of open data is needed.
The open data maturity assessment broadened its scope in 2018 by including the impact and quality
dimensions. Figure 3.7 shows that the impact dimension increased from 50% in 2018 to 57% in 2019. This is
mainly caused by the steep increase of the environmental re-use and impact of open data, that increased
from 48% in 2018 to 69% in 2019.
65% 67%
46%
69%
28%
0%
10%
20%
30%
40%
50%
60%
70%
80%
90%
100%
Awareness Political Social Environmental Economic
Figure 3.6: EU28 averages on open data impact dimension
120
	https://www.data.gouv.fr/fr/reference
121
	https://www.legifrance.gouv.fr/affichTexte.do;jsessionid=2358AE5E4D21392EF7E4F0C83C9E9934.tplgfr41s_1?cidTexte=JORFTEXT000037797147
	 &dateTexte=
Figure 3.7: EU28 average development on open data impact
50%
57%
0
40%
50%
60%
70%
100%
2018 2019
OPEN DATA MATURITY REPORT 2019 50
The country ranking of the impact dimension can be observed in the figure. Figure 3.8 reveals that 14
Member States score above the EU28 average of 57% and 14 Member States score below the EU28 average.
The countries with the highest maturity levels on the impact dimension are Spain (100%), France and Ireland
(both 92%), and Denmark and Italy (both 72%).
Figure 3.8: EU28 open data impact maturity
0%
10%
20%
30%
40%
50%
60%
70%
80%
90%
100%
Spain
France
IrelandD
enm
ark
Italy
Poland
U
nited
Kingdom
FinlandG
erm
any
LatviaSlovenia
C
yprus
N
etherlandsSw
eden
EU
28
average
G
reece
Estonia
C
roatia
AustriaBelgium
C
zech
RepublicBulgaria
Luxem
bourgLithuaniaRom
aniaH
ungary
M
altaPortugalSlovakia
OPEN DATA MATURITY REPORT 2019 51
Open data quality
Chapter 4
OPEN DATA MATURITY REPORT 2019 52
The fourth assessment dimension “open data quality” focuses on the measures adopted by portal managers
to ensure the systematic harvesting of metadata from sources across the country, as well as the currency
of the available metadata and where possible the actual data, the monitoring of the compliance with
the DCAT-AP metadata standard as well as the quality of deployment of the published data. The fourth
dimension provides impulses for portal managers and policy-makers to enable open data publication that
is good quality all round: using open data formats, machine-readable, high-quality and suitable to a linked
data approach (the use of URI’s etc.).
Metric Key elements
Currency A systematic approach in place to ensure that metadata is up
to date. Harvesters are programmed to ensure that changes at
the source are reflected with the least amount of delay on the
national portal.
Monitoring and measures Mechanisms are in place to monitor the quality of the metadata
and the compliance level in terms of correct licensing
information. Measures are in place to assist publishers in
publishing in high-quality metadata and choosing the right type
of licence for their data.
DCAT-AP Compliance Compliance to the DCAT-AP standard in terms of mandatory,
recommended and optional classes is monitored. Guidelines
and learning materials help publishers in ensuring compliance
with DCAT-AP.
Deployment and linked data The 5-star open data model or similar are used to assess the
quality of data deployment. Percentage of published open data
that complies with the requirements of the 5-stars Open Data
model.
4.1 Currency
This indicator analyses to what extent EU28 countries have a systematic approach in place to ensure that
metadata, and where applicable the actual data, is up to date. The indicator looks specifically at automatic
harvesting processes to ensure that changes at the source of the data are reflected with the least amount
of delay on the national portal.
Up-to-date metadata on the national portals are critical for users to obtain the correct information about
the data that it describes. A vast majority of the EU28 Member States (75%) have a pre-defined approached
in place to ensure that the metadata is kept up to date. How often metadata needs to be updated, however,
depends on the characteristics of the data that it describes. Some datasets do not require frequent updates,
as they do not change frequently, while other datasets change more often and therefore require more
frequent updates to the metadata, too. For example, a gazetteer of city streets changes when new buildings
and roads are built, or street names are changed, whereas the data on current weather conditions may be
updated in real-time. In both cases, the way the metadata describes the date and time the data was last
updates is instrumental to the re-user to understand the value of the dataset itself.
The mechanisms in place to keep metadata up to date differ by country. EU28 countries often mention
that the currency of the metadata is a responsibility of the data providers or the harvested portals itself. The
Irish national open data portal harvests metadata automatically on a nightly basis from 14 data sources,
capturing any new, updated, or deleted datasets. The Finnish national open data portal sends out annual
reminders to all data publishers to check the currency of the descriptions, datasets, and the organisations
that provide them. In addition, the Finnish portal sends out a weekly reminder to data publishers to update
any broken links and sends out multiple reminders on datasets that have a set expiration date to update the
data and check the descriptions before the data expires. In Italy, a generalised approach has been defined
that provides for weekly harvesting of each federated catalogue, except for specific requests for more
frequent updates.
Chapter 4: Open data quality
OPEN DATA MATURITY REPORT 2019 53
The ability to keep the metadata up to date depends, among others, on the extent to which metadata is
obtained from its source automatically. Obtaining metadata from its source automatically enables automatic
updates of the metadata when the data that it describes is updated. Figure 4.1 shows the percentage of the
metadata that is obtained from its source automatically. Looking at the right side of the figure, it becomes
clear that only in 3 (11%) countries - Belgium, Denmark, and Sweden, all metadata is uploaded in an automated
way to the national portal. Additionally, 7 (25%) countries obtain between 90% and 99% of their metadata
from the source automatically. Looking at the left side of the figure, however, it becomes clear that 11 (39%)
countries obtain less than 30% of their metadata from its source automatically. This means that most of the
metadata in these countries is edited manually to some degree, which becomes more time consuming as
the amount and complexity of data grows. In addition, manual editing of metadata easily allows for errors
and mistakes.
Beyond the metadata, the currency of data too is critical to applications. Regarding the speed of updates to
datasets available on the national data portals, figure 4.2 shows what percentage of the datasets is updated
within 1 day from the update of its primary source. Looking at the right side of the figure, it becomes clear
that 9 (32%) countries update more than 90% of the data within 1 day. These countries are Austria, the Czech
Republic, Denmark, Estonia, Malta, the Netherlands, Portugal, Spain, and Sweden. Another 6 (21%) countries
update 51% to 90% of their data within one day, 5 countries (18%) between 10% to 50% of their data, and 8
(29%) countries update less than 10% of their data within 1 day its primary source is updated.
4.2 Monitoring and measures
This indicator analyses the extent to which mechanisms are in place to assess and boost the quality of
metadata and the compliance level in terms of correct licensing information. In addition, the indicator looks
Figure 4.1: The percentage of datasets obtained from its source automatically
39%
7%
11%
7%
25%
11%
0%
5%
10%
15%
20%
25%
30%
35%
40%
45%
<30% 30-49% 50-69% 70-89% 90-99% 100%
100%
%ofcountries
Figure 4.2: The time it takes to update data from the moment its source is updated
29%
18%
21%
32%
0%
5%
10%
15%
20%
25%
30%
35%
40%
45%
<10% 10-50% 51-90% >90%
100%
%ofcountries
OPEN DATA MATURITY REPORT 2019 54
at support, guidelines, and tools available to assist data publishers in publishing high-quality metadata and in
choosing the right type of licence for their data.
4.2.1 Ensuring high-quality metadata
Most EU28 countries (23 countries, 82%) monitor the quality of the metadata available on their national
open data portal. Metadata often undergoes a quality control before being published on the national open
data portals. The process of quality control differs per country.
In Cyprus, there is a system in place that requires data publishers to provide a number of mandatory metadata
fields when publishing on the national open data portal. No dataset can be published on the national portal
unless the mandatory metadata fields are completed. The submitted datasets and the related metadata
undergo a quality review for format compliance and metadata completeness.
In France, a similar process is in place. Metadata is published after fulfilling a quality checklist, with questions
such as: is the dataset described? Are keywords added? Is the format open? Is a channel for feedback to the
data provide made available? Is the dataset up to date? Is the dataset available?
In the Netherlands, data publishers also must fill in mandatory fields before data is published. In addition, a
link checker shows if the link to the data is valid.
In Lithuania, the quality of metadata is currently checked manually, but a tool to implement automatic
quality control is planned for the renewed portal.
Some countries, such as Belgium and Greece, have implemented the DCAT-AP validator122
into the national
data portal that automatically checks metadata description of datasets for integrity and consistency against
DCAT-AP specifications.
In Spain, great efforts have been taken to implement a module that regularly checks if distribution URLs fail.
A report is generated with all URLs with an error and the type of error.
Just over half of the EU28 portals (54%) publish information on the quality of the metadata available on the
portal itself. An example in this regard comes from the Czech Republic, that provides a designated area123
on the portal to show metadata quality. Portal visitors can, for example, find information on the number
of datasets that do not specify the terms of use by the provider and the number of datasets with an invalid
media file type. Another example comes from the Finnish portal, that shows the number of broken links124
,
provides the URLs and reports when the error last occurred and was fixed. Also, the previously mentioned
statistics page125
of the Irish national open data portal provides information on data quality, specifically on
compliance with the standards as set out in the technical framework. The statistics page is updated monthly.
In addition to tools to check metadata quality against standards, such as with DCAT-AP validators, 22 (79%)
of the EU28 countries conduct regular activities to incentivise and assist data providers in the publication of
high-quality metadata. Such activities include e-learning modules and materials, webinars, guidelines and
meetings, trainings, and workshops with the main data providers. Especially in smaller countries, such as
Luxembourg, it is possible to establish a direct dialogue with each of the data providers, keeping contact
through regular mail exchanges, meetings, and dedicated courses.
4.2.2 Providing licensing information
In order for data to be open, it should be accessible and licensed for anyone to access, use and share. An
open data licence provides users with certainty that the data can be used and shared for a wide range of
purposes. Without a licence, data may be publicly available, but users will not have clarity around what
permission they have to access, use and share it under copyright or database laws. Member States are
aware of the importance of providing licensing information, as can be seen by the high percentages of data
available on the national portal that is accompanied by relevant licences.
122
	E.g. see https://joinup.ec.europa.eu/solution/dcat-ap-validator or the European Data Portal’s own at https://www.europeandataportal.eu/shacl/
123
	https://opendata.gov.cz/statistika:datova-kvalita
124
	https://data.ouka.fi/data/en_GB/report/broken-links/konsernihallinto
125
	https://data.gov.ie/stats
OPEN DATA MATURITY REPORT 2019 55
Although in an ideal world all data available on the open data portals should be accompanied by licensing
information, in practice 15 (54%) Member States achieved 100% datasets available with licenses. Additionally,
8 (29%) Member States provide licensing information to 90-99% of their available data. Only in Sweden,
Lithuania, and Malta this percentage is lower: in Sweden between 50% and 74% and in Lithuania and Malta
less than 25% of the data is accompanied by licensing information. Hungary responded to the questionnaire
around these topics by choosing “not applicable” because data providers give them metadata that does
not include licensing information. Poland also chose the “not applicable” answer because they report that
most data on the portal is available under a general statement about the data being provided without any
conditions or under minimum conditions.
Additionally, and in line with the Member States acknowledging the importance of providing licensing
information, all EU28 publish guidelines and have tools in place to assist publishers in choosing an appropriate
licence. The Dutch national open data portal, for example, obligates data publishers to choose a licence
for the datasets they want to make available via the portal and provides a dedicated licence support area126
in which several licences are explained, e.g. to clarify if a licence is open or open with restrictions. When
the data publisher is uncertain about the type of licence, they can temporarily choose to licence the data
as “closed” or “undefined”. The data is then still discoverable on the portal, but not available as open data.
In some other countries, such as Spain, guidance on open data licencing is part of general methodological
guidelines for opening up data. This also applies to Slovakia, that additionally provides a video127
on how to
publish open data.
In Ireland, following a public consultation, the Creative Commons Attribution 4.0 International (CC BY 4.0)
licence was chosen as the open licence for the country. The standards for the publication of data on the
national portal are set out in the “Technical Framework”128
. This framework ensures that the publication
of datasets on the portal is done in a consistent, persistent, and truly open way. Guidance on open data
licencing is provided in the “Guide for Publishers”129
: a guide for existing and potential open data publishers
who wish to publish open data on the portal. From time to time, Ireland gives specific assistance to some
public bodies who experience issues with open data licensing. For example, they assisted Met Eireann130
(the Irish Meteorological Service) with legal advice for the drafting of a custom open data licence that was
necessary to access some specific needs of their situation. Met Eireann now has published some 2000
datasets on the national portal.
Similar to Ireland, a vast majority of the EU28 Member States (21 countries, 75%) recommend data publishers
to use Creative Commons (CC) licences. Only France, Germany, Romania, Spain, and the UK recommend
data publishers to use the country’s own developed open licence. In their response to the questionnaire,
France mentions concerns that the CC licencing does not enable the re-use to be commercialised. That
is the reason why Etalab - the French task force for open data - has adopted the Open Database Licence
instead. In Germany, the licence “Datenlizenz Deutschland”131
was developed, that allows for completely
free use and continued use of open data. The licence obliges the user to give credits and name the author
or originator.
In Romania, the custom Open Government Licence Romania132
(OGL-RO) was developed, similar to the
Open Government Licence of the UK. The OGL-RO licence has slightly more restrictive conditions than the
CC. Romania currently recommends the OGL-RO licence, but also provides information on CC licencing. As
the CC4.0 licence is currently being translated to Romanian, they consider switching to the recommending
CC in the near future.
126
	https://data.overheid.nl/ondersteuning/data-publiceren/licentie-keuze
127
	https://www.youtube.com/watch?v=trzJit8YQpQ&feature=youtu.be
128
	https://data.gov.ie/pages/opendatatechnicalframework#open-data-licence
129
	https://data.gov.ie/pages/guideforpublishers
130
	https://www.met.ie/
131
	https://www.govdata.de/lizenzen
132
	http://data.gov.ro/base/images/logoinst/OGL-ROU-1.0.pdf
OPEN DATA MATURITY REPORT 2019 56
Spain is currently working to incorporate the use of CC licences for re-using public sector information into
Spanish regulations and establish an equivalence between national conditions of use and CC licences. The
current Spanish conditions of use are similar to the CC-BY licence.
Member States are generally making efforts to publish data against a narrower and less complex set of
licences on their portal, in the attempt to simplify the effort required of re-users to assess what their rights
are in respect to the data. The distribution of difference licences can be found in figure 4.3. In 2019, 20 (71%)
of the EU28 portals use between 1 and 5 different licences across all the data they distribute. In 2018, only
12 portals used between 1 and 5 different licences, which shows a trend towards narrowing down the set
of different licences. In 2019, 4 Member States (14%) – Italy, the Netherlands, Portugal, and Slovakia – use
between 6 and 10 different licences, Greece and Belgium (7%) between 11 and 15, Germany (4%) between
16 and 20, and the Czech Republic (4%) more than 20.
4.3 DCAT-AP compliance
This indicator examines to what extent countries comply with the DCAT-AP standard for describing public
sector datasets and what efforts are taken to assist data publishers in ensuring compliance with DCAT-AP.
Compliance to DCAT-AP improves interoperability and fosters the discoverability and re-use of open data
across European portals. The indicator assesses the national portals’ compliance in providing all classes
specified as mandatory by the standard, but also values the availability of recommended and optional
classes. EU28 countries are increasingly aware of the importance and benefits of DCAT-AP and take efforts
to boost its correct use.
Figure 4.4 shows the percentage of metadata on national data portals in Europe that is DCAT-AP compliant
and that provide recommended and optional classes, too. When looking at the mandatory classes, the
figure reveals that in 22 (79%) countries more than 90% of the metadata is compliant to mandatory classes
(agent, catalogue, dataset, literal, resource). In 14 (50%) countries, more than 90% of the metadata meets
the standards of recommended classes (category, category scheme, distribution, license document), and
in 11 (39%) countries, more than 90% of the metadata meets the standards of optional classes (catalogue
record, checksum, document, frequency). The trend is clear: countries are focusing on compliance by
Figure 4.3: The number of different licences on the portal
71%
14%
7%
4%
4%
1-5 6-10 11-15 16-20 >20
Figure 4.4: The percentage of datasets compliant to DCAT-AP classes
7%
14%
18%
4% 4%
25%
7%
14%
7%
4%
18%
11%
79%
50%
39%
0%
10%
20%
30%
40%
50%
60%
70%
80%
90%
100%
Mandatory Recommended Optional
no priority <10% 10-50% 51-90% >90%
OPEN DATA MATURITY REPORT 2019 57
providing metadata for the mandatory classes but investing limited effort in recommended and optional
classes. It is worth mentioning that Poland and Bulgaria are currently in the process of implementing DCAT-
AP standards into the national open data portal. In some countries, such as in Sweden, there is an automatic
process in place that only allows the publication of metadata that is compliant to mandatory classes.
Half of the EU28 Member States (14 countries) have extended the European DCAT-AP standard to better
address their own legacy and needs. The national extension for Spain, for example, is described in the
“Technical Interoperability Standard of Reuse of information resources”133
. This regulation determines,
among others, the minimum mandatory metadata for open data in Spain. One of the main reasons why
Spain has its own DCAT profile is that it was developed and officially approved in 2013, prior to the creation
of European DCAT-AP. Primary differences are based on the taxonomy for identifying public entities and
the taxonomy for geographical coverage, which are specific to Spain. An application guide and e-learning134
for the Spanish extension is available in order to help public administrations becoming DCAT-AP compliant.
In the Netherlands, all dataset descriptions are validated against the DCAT-AP-NL model. Mandatory classes
need to be filled before the data can be published on the portal. The DCAT-AP-NL makes more classes
mandatory than the European DCAT-AP model. Therefore, violations of the European DCAT-AP are not
allowed and do not occur. The Netherlands created the DCAT-AP-NL to keep the exchange of metadata
within the Netherlands simple. The Netherlands also created a DCAT-NL-DONL for the national open data
portal, which is even more restrictive than DCAT-AP-NL and which also determines which value lists to use
to fill classes. Only values from pre-published value lists are allowed.
4.4 Deployment quality and linked data
This indicator examines to what extent countries use a model such as the 5-Star Open Data135
to assess
the quality of data. The 5-Star Open Data is a deployment quality model that enables countries to rate data
against a 5 “stars” scale. To gain the maximum of 5 stars, data must (1) be available online under an open
licence, (2) be in the form of structured data, (3) be machine-readable, (4) use URIs as its identifiers, (5)
include links to other data sources.
4.4.1 The 5-Star Open Data model
Figure 4.6 shows the percentage of data available in the Member States according to the requirements of
the 5-Star Open Data model. The figure reveals that most data (above 50%) on the national data portals is
available according to the requirements of the first three stars, but that data according to four and five stars
is not common in Europe yet.
Figure 4.6: The percentage of data provided according to the 5-Star Open Data model
7%
14% 18%
18%
75%
4%
4% 4% 4%
96%
21%
50%
64%
7%
68%
32%
14%
0%
10%
20%
30%
40%
50%
60%
70%
80%
90%
100%
1 star 2 stars 3 stars 4 stars 5 stars
<10% 10-49% 50-90% >90%
%ofcountries
133
	https://datos.gob.es/es/documentacion/norma-tecnica-de-interoperabilidad-de-reutilizacion-de-recursos-de-informacion
134
	https://datos.gob.es/es/documentacion/dcat-ap-y-la-norma-tecnica-de-interoperabilidad-de-reutilizacion-de-recursos-de
135
	For more information: http://5stardata.info/en/ or https://joinup.ec.europa.eu/sites/default/files/inline-files/W3C04.pdf.
OPEN DATA MATURITY REPORT 2019 58
1 star: open license
The first star is attributed if data is available under an open licence. The star examines if data is
accompanied with open licensing information that permits people to use the data in any way they want,
including transforming, combining and sharing the data with others, even commercially. The results of
the questionnaire show that in a majority of the EU28 countries - 19 countries (68%) - more than 90% of
the published data is made available under an open licence. In order to be truly classified as open data, the
data should be accompanied with an open licence. In some countries, however, the national open data
portal does not only make available open data, but also “closed” data. From this perspective, not acquiring
a first star does not necessarily mean that these countries are performing less well, but rather shows that
the country has a more holistic approach to data sharing that does not only focus on providing open data
on the portal.
2 stars: structured data
In order to gain a second star, data does not only need to be available under an open licence, but also
in a structured format. Whereas 19 countries have more than 90% of the data published under an open
licence, only 9 (32%) countries also have more than 90% data published in a structured format. Gaining a
second star for more than 90% of the data is achieved by: Belgium, the Czech Republic, Estonia, Finland,
the Netherlands, Ireland, Italy, Portugal, and Romania. Besides these 9 countries, 14 (50%) other countries
achieved a second star for 50% to 90% of the data.
3 stars: machine-readable format
The third star is awarded when data is available under an open licence, in a structured format, and is
machine-readable, i.e. in a format that can be automatically read and processed by computers. Data must
be structured in order to be machine-readable. Therefore, acquiring a third star for more than 90% of the
data is only possible for those countries who acquired a second star for more than 90% of the data. A total
of 4 (14%) countries achieved this: the Czech Republic, Ireland, Italy, and the Netherlands. Besides these
4 countries, 18 (64%) other countries achieved a third star for 50% to 90% of their data.
4 stars: URIs as its identifiers
The use of Uniform Resource Identifiers (URIs) in the public sector open data is not common in Europe
yet. The percentage of datasets that is made available under an open licence, in a machine-readable
format, and with consistent use of Uniform Resource Identifiers is less than 10% in 21 (75%) countries. In
4 (18%) countries (Finland, Italy, Germany and the Netherlands) the percentage ranges between 10% and
19%. Germany and the Netherlands made the best achievements in gaining 4 stars, in the Netherlands
between 50% and 59% and in Germany 60% and 70% of the data is made available under an open licence,
in a machine-readable format, and with the use of URI’s.
5 stars: links to other data sources
Interlinking data to other data so that a person or a machine can explore the web of data is also not
common in Europe yet. The percentage of linked open data is below 10% in 27 countries (96%). Only in
Latvia, 10% to 19% of the data has 5 stars.
4.4.2 Promoting deployment quality
A vast majority of the EU28 countries (21 countries, 75%) conduct activities to familiarise data providers
with deployment quality models such as the 5-star Open Data and the linked data concept. In Croatia, for
example, the Information Commissioner organises open data education for civil servants and provides a
dedicated module on the 5-star Open Data quality model. Similarly to Croatia, Cyprus educates open data
Liaison Officers via the “Structured Training Program” that contains training on the 5-star model. Sweden
offered education to 45 organisations in 2019, where they also discussed the 5-star Open Data model and
briefly discussed the concept of linked data. Slovenian civil servants and data publishers can learn about
the 5-star Open Data at the courses at the Administrative Academy, where a whole chapter/segment is
dedicated to 5-star Open Data.
The Finnish open data portal team receives increasing feedback from data publishers and open data
re-users that the 5-Star Open Data model is cumbersome and difficult and may become a barrier for
publication. A lot of typical open data re-users (e.g. regular citizens and reporters in media) use open data
in proprietary formats, such as Microsoft Excel. The Finnish national open data portal also considers it
OPEN DATA MATURITY REPORT 2019 59
problematic that the 5-star Open Data model does not include a semantic dimension, that would instead
be considered instrumental to foster interoperability of data at national (Finnish) and European levels.
4.5 Overall performance
Figure 4.7 shows the EU28 average maturity on each of the 4 indicators of the quality dimension. The overall
maturity level of the quality dimension is 65%. The most mature indicator within the quality dimension is the
monitoring and measures in place to boost the quality of metadata and the compliance level in terms of
correct licensing information (76%), followed by the level of DCAT-AP compliance of metadata (67%) and
its currency (65%). The lowest scoring indicator within the quality dimension is the extent to which data
provided on the portals is available under an open licence, in machine-readable format, with the use of
URI’s, and linked to other relevant data (53%).
The open data maturity assessment broadened its scope in 2018 by including the impact and quality
dimensions. Figure 4.8 shows that the quality dimension slightly increased compared to 2019; from 62%
to 65%. This is mainly caused by including in 2019 the new indicator that analyses the monitoring and
measures in place to boost the quality of metadata publication. The results show that, although EU28
countries are taking efforts in boosting the quality of metadata, the actual deployment quality is insufficient,
when evaluated by the 5-star Open Data model.
65%
76%
67%
53%
0%
10%
20%
30%
40%
50%
60%
70%
80%
90%
100%
Currency Monitoring and
measures
DCAT-AP
Compliance
Deployment
quality
Figure 4.7: EU28 averages on quality dimension
Figure 4.8: EU28 average open data quality development
62% 65%
0%
50%
60%
70%
80%
100%
2018 2019
OPEN DATA MATURITY REPORT 2019 60
Figure 4.9: EU28 open data quality maturity
0%
10%
20%
30%
40%
50%
60%
70%
80%
90%
100%
Ireland
C
zech
Republic
C
yprus
Spain
Finland
N
etherlands
FranceD
enm
ark
Latvia
Belgium
Italy
PolandSlovenia
C
roatia
Estonia
EU
28
averagePortugal
AustriaG
erm
anyRom
ania
Luxem
bourg
G
reeceSw
edenBulgariaSlovakia
M
alta
U
nited
KingdomLithuaniaH
ungary
The country ranking of the portal dimension can be observed in figure 4.9. The figure reveals that 15 Member
States score above the EU28 average of 65% and 13 Member States score below the EU28 average. The
countries with the highest maturity levels on the portal dimension are Ireland (92%), the Czech Republic
(84%), and Cyprus (82%). Worth mentioning here is the high maturity level of the Czech Republic, that
achieved a 100% score on DCAT-AP compliance.
OPEN DATA MATURITY REPORT 2019 61
Open data maturity
in the EFTA countries
Chapter 5
OPEN DATA MATURITY REPORT 2019 62
Similar to previous years, the open data landscaping exercise also assesses the open data maturity in the
four European Free Trade Association (EFTA) countries - Iceland, Liechtenstein, Norway, and Switzerland.
The maturity assessment follows the same four dimensions that are used to assess the open data maturity
in the EU28 Member States: open data policy, open data portal, open data quality, and open data impact.
5.1 Open data policy
Regarding a policy framework to foster open data in the EFTA countries, three of the four EFTA countries
report that they have open data policies in place. In Iceland, there are currently no policies or strategies in
place to boost open data publication and re-use in the country. Similarly to the EU28 countries, a trend is
observed in the EFTA countries that open data legislation is embedded in different national digital agendas
and programmes and tied into national legislation to ensure government transparency and promote an
open government.
In Norway, open data policy is embedded in the Digital Agenda that was published in 2016136
, which has
a strong focus on data sharing. The importance of data sharing is identified as a central component of
ensuring openness and transparency, a more efficient and effective government, and value creation in
the private sector. The Digital Agenda prescribes that there should be specific open data strategies for five
different areas: government spending, geospatial data, transport, research, and culture. Currently, four of
these open data strategies137
are in place and only a dedicated open data strategy for government spending
is not yet developed.
In addition to the Digital Agenda, Norway published its Digital Strategy for the Public Sector138
in June
2019. The strategy defines the common goals and focuses areas for digitalisation activities towards 2025.
One of the goals is that the public sector shall exploit the potential of sharing and the use of data to create
user-friendly services, and to promote value creation in the business sector. To reach this goal, data shall
be shared and re-used in the public sector to a greater degree. This greater degree is necessary because,
despite Norway’s efforts to boost open data publication and re-use, at the turn of the year 2018/2019, it is
estimated that only around 10% of relevant datasets have been made available.
Norway also published its Fourth Norwegian Action Plan Open Government Partnership (OGP)139
in 2019.
This plan, developed by the Ministry of Local Government and Modernisation in cooperation with several
other ministries, has three main pillars: integrity and openness in public administration (1), open data and re-
use of public data (2), and public procurement, information on the beneficial owners, and anticorruption (3).
Regarding the area of open data and re-use, the country is now considering whether there are new areas in
which one should establish dedicated strategies and action plans in relation to making data publicly available
and fostering data sharing (besides the previously mentioned dedicated strategies for government spending,
geodata, transport, research, and culture). The above-outlined policies, strategies, and action plans, together
with the Digitisation Circular130
that specifies that each public body has to create, maintain, and share a data
inventory, are setting the stage for data sharing and open data.
Liechtenstein also published their Digital Agenda141
in 2019, which unifies the various objectives and measures
of the ministries to push forward digital transformation. The Digital Agenda highlights the importance of
open geospatial data. The objective is to ensure the sustainable availability of high-quality geospatial data
and to facilitate its re-use. Therefore, Liechtenstein aims to provide free access to geospatial data in a
machine-readable format. Apart from geospatial data, the country does not have policies or strategies in
136
	https://www.regjeringen.no/no/dokumenter/meld.-st.-27-20152016/id2483795/
137
	Culture: https://www.regjeringen.no/no/dokumenter/kulturdepartementets-strategi-for-apne-data/id2576038/?q=strategi%20kultur;
	 geospatial data https://www.geonorge.no/Geodataarbeid/geografisk-infrastruktur/Norge-digitalt/nasjonalgeodatastrategi/;
	 research https://www.forskningsradet.no/servlet/Satellite?cid=1254023795613&pagename=VedleggPointer&target=_blank;
	transport https://www.regjeringen.no/no/dokumenter/strategi-for-tilgjengeliggjoring-av-offentlige-data--samferdselssektoren/id2598229/
138
	https://www.regjeringen.no/en/dokumenter/one-digital-public-sector/id2653874/sec1
139
	https://www.regjeringen.no/en/dokumenter/norges-handlingsplan-4---open-government-partnership-ogp/id2638814/
140
	https://www.regjeringen.no/no/dokumenter/digitaliseringsrundskrivet/id2623277/
141
	https://www.regierung.li/media/attachments/ikr-DigitaleAgendaFL-A4-Einzelseiten-200dpi.pdf?t=636924885232021692
Chapter 5: Open data maturity in the EFTA countries
OPEN DATA MATURITY REPORT 2019 63
place to foster the publication and re-use of other types of open data. In addition to the Digital Agenda,
Liechtenstein also published the E-Government Strategy142
in 2019, that includes a vision, mission, and
principles for implementation of digital services.
In Switzerland, norms relating to open data are part of the national legislation to ensure government
transparency. In November 2018, the Open Government Strategy 2019-2023143
was approved by the Federal
Council. The strategy is the successor to the Open Government Strategy 2014-2018. The new strategy
is legally binding for the federal administration but also a basis for continuous collaboration with other
governments at regional and local level. One of the main objectives of the new strategy is the publication of
open data by default. The strategy prescribes that data produced or commissioned by the public sector shall
- subject to conflicting legal provisions - be regarded as Open Government Data and, as far as technically
and legally possible, be published in machine-readable form as of 2020. This data will be freely accessible
and gradually include other existing datasets.
In Iceland, opening Public Sector Information is recommended by the government. According to the
answers provided by the country representatives, there is no policy, strategy, action plan, or governance
model in place to boost open data publication and re-use in the country.
When looking at the type of governance that is practised in the four EFTA countries, a similar pattern can
be observed as within the EU28 countries, where a majority (75%) of the countries opted for a hybrid
governance model. This type of model allows for both central coordination and guidance as well as
developing and pursuing initiatives at local level. In the EFTA, both Norway and Switzerland also opted for a
hybrid governance model, while Iceland and Liechtenstein report to not have a governance model in place.
Liechtenstein mentions that cities and villages are largely administratively independent and that there is no
mechanism in place to monitor open data initiatives.
The Norwegian system is characterised by strong local municipalities and regions with significant
decentralisation. This is also reflected in their data governance model in which open data initiatives are
mainly coordinated from the national level. At the same time, bottom-up initiatives are encouraged.
Between 1% and 25% of the local or regional authorities in Norway conduct their own open data initiatives.
Due to the fact that Norway is a relatively small country with a relatively small open data community, the
national government can easily keep track of open data initiatives at regional and local levels.
In Norway, national coordination and guidance includes, among others, a common “Framework for
Information Management”144
, a guideline on the release of public sector information145
, a data-sharing
manual146
, national open data events such as the hackathon for Norway147
, an annual meeting with data
re-users and publishers, and regular meetings to support data publishers in opening up their data. Norway
has also established a competence centre to support public organisations in sharing their data. In 2019 this
support was limited to legal challenges but will be broadened to other areas from 2020. The main agencies
and municipalities are involved in weekly meetings to discuss API-catalogue and concept-catalogue. There
are a number of structures in place to ensure the involvement of different stakeholders in data sharing
initiatives at national level. Examples include that the “Sharing of Data” project, that has a steering committee
and reference groups with a broad representation from stakeholders, who are deeply involved in progress
and plans for data sharing in the country.
In Switzerland, the federal government has a leading role in open data but does not impose standards or
practices. The only requirement is that all public data publishers must publish their data on the national
open data portal. The federal administration organises round tables and other meetings to bring together
different stakeholders, such as cantons (regions), cities, state-owned enterprises, and re-users. In addition,
142
	https://www.regierung.li/media/attachments/ikr-eGovernmentStrategie-A4-D.PDF?t=636911057929590704
143
	https://www.bfs.admin.ch/bfs/en/home/services/ogd/strategy.html
144
	https://www.difi.no/fagomrader-og-tjenester/digitalisering-og-samordning/nasjonal-arkitektur/informasjonsforvaltning/rammeverk-
	 informasjonsforvaltning
145
	https://data.norge.no/retningslinjer-ved-tilgjengeliggj%C3%B8ring-av-offentlige-data
146
	https://doc.difi.no/data/veileder-apne-data/
147
	http://hack4.no/
OPEN DATA MATURITY REPORT 2019 64
a handbook148
is provided to assist data providers in their open data publication process and the newly
constituted Open Government Data Secretary provides support and advice as well. The Open Government
Data Strategy of Switzerland foresees the appointment of a data responsible at public level, that is
responsible for open data publication in its own federal office or department. Of all four EFTA countries,
Switzerland has the most open data initiatives at local or regional level. Between 26% and 50% of the local
and regional government conduct open data initiatives, with the dedicated Open Data Strategy for the
Geneva Administration149
as a good example in this regard.
5.2 Open data portal
Three of the four EFTA countries have a national open data portal to make open data and Public Sector
Information discoverable. Liechtenstein is the only EU28+ country that does not have national open data
portal. Some public sector data can be found on dedicated open data portals, such as statistical data150
and
geospatial data151
. Given that Liechtenstein does not yet have a national open data portal, the following
section will only discuss the maturity of the national open data portals of Iceland, Norway and Switzerland.
In terms of portal features, all three national open data portals offer the possibility for users to download
datasets. The portals provide functions such as multiple field search, filter options, and searching by file
format or data domain format. None of the EFTA countries, however, provide a SPARQL search function.
Contrary to Iceland, the portals of Norway and Switzerland offer a designated area to showcase open data
use cases, allow users to submit their own use case, and reference the datasets that the showcased use
cases are based on. Although the portals of Norway and Switzerland offer a mechanism for users to provide
general feedback, only the portal of Norway enables users to provide feedback at dataset level. In addition,
only the Norwegian portal offers the possibility for users to receive notifications when new datasets are
available, a preview function for tabular data, and shows what data exists but cannot be made available as
open data. The screenshot below shows how users can see that a dataset is available on the Norwegian
portal but is not available as open data. Contrary to many EU28 Member States, the EFTA portals do not
provide portal visitors yet the opportunity to request datasets, to rate datasets, to preview geospatial data, or
to discuss their issues and opinions in a discussion forum.
In terms of portal usage, all three EFTA portals track the number of visitors on their national data portals.
According to the answers provided, the Norwegian portal receives the most unique visitors per month, with
an average of 9500. Switzerland follows with 7000 and Iceland with an average of 1700 unique visitors152
per month. However, when these numbers are weighted against the countries’ population153
, it becomes
clear that the portal of Iceland is the one that attracts the largest share of the country’s population (0.005%),
followed by the portal of Norway (0.002%), and lastly the portal of Switzerland (0.001%). If these figures were
148
	https://handbook.opendata.swiss/de/pages/index
149
	https://www.ge.ch/document/strategie-matiere-libre-acces-aux-donnees-publiques-administration-genevoise-open-data/telecharger
150
	https://www.llv.li/inhalt/11480/amtsstellen/amt-fur-statistik
151
	https://geodaten.llv.li/
152
	Unique visitors refer to the number of distinct individuals accessing pages on the website during a given period, regardless of how often they visit
	 that website. Visits refer to the number of times a website is visited, no matter how many visitors make up those visits.
153
	https://ec.europa.eu/eurostat/tgm/table.do?tab=table&init=1&language=en&pcode=tps00001&plugin=1
Screenshot 7: Datasets with limited publicity on the Norwegian national open data portal
OPEN DATA MATURITY REPORT 2019 65
compared together with the rest of the EU28 Member States, then Iceland would be ranked as number 5,
Norway as number 10, and Switzerland as number 15.
Even though all three EFTA portals use log analytics to gain insights into usage, only Norway uses these
insights for improvement. In addition, all three portals monitor what the most and least consulted pages are.
Only Norway and Switzerland, however, monitor the most popular datasets. The most popular dataset in
Norway is “Offentlige tilfluksrom” (public shelters) and the most popular dataset in Switzerland is “Messwerte
Lufttemperatur 2m” (measurements air temperature). Regarding API access, both Norway and Switzerland
mention that the metadata describing the datasets is accessible via a publicly available API, but only Norway
runs log analytics on API usage. Norway does not know, however, what percentage of outgoing portal
traffic is generated by API usage only.
In terms of data provision, Norway is the only EFTA country that responded to the questionnaire by claiming
that all public sector data providers contribute data to the portal. To assist data providers in their data
publication process, general guidance and documentation are provided and advice is given on demand. In
Switzerland, not all public sector data providers contribute to the national open data portal, and the ones
that do not contribute to the national portal yet are identified for further action. Whereas 36% of the EU28
Member States offer the possibility to upload data on the national data portal that does not stem from
official sources, none of the EFTA portals provide non-official data. In addition, whereas 89% of the EU28
Member States make real-time sources discoverable, in the EFTA countries only Norway and Switzerland do
so. In Norway, 16% to 20% of data featured is real-time, while in Switzerland that is 1% to 5%.
In terms of portal sustainability, none of the three data portals of the EFTA countries have sustainability
strategies in place. This is not aligned with the EU28 Member States, where 79% of the open data portals
do. In addition, and contrary to the EU28 Member States, none154
of the EFTA countries conduct activities to
enhance the visibility of the portal by promoting the available features and data, although the national portals
of Norway and Switzerland are active on social media. In addition, none of the EFTA portals have conducted
a user satisfaction survey over the past year, while 43% of the Member States did. Norway and Switzerland
both mention that they review their portals bi-annually. In Norway, data publishers regularly meet to improve
the open data portal, based on the feedback of re-users and new technologies. Whereas 86% of the EU28
portals have a dashboard or similar section on their portal on which they showcase the main indexes
concerning the volume and quality of their metadata, only Norway and Iceland provide such a dashboard.
5.3 Open data impact
With regard to the activities to monitor and measure both the re-use and impact of open data, some efforts
are visible in the four EFTA countries, but, compared to the EU28 Member States, these efforts remain
relatively low. In line with this, but contrary to the EU28 Member States, open data re-use by public bodies
is only defined as a priority at national level in Norway. Although in Liechtenstein open data re-use does not
have such a priority, the country mentions seeing a trend in the public bodies towards the re-use of the data
published by other public bodies. This trend is not observed in Iceland and Switzerland, according to the
answers provided.
Norway is the only EFTA country that states to conduct activities to support public bodies in monitoring the
re-use of their own open data. This is done by the national open data portal by providing statistics on the use
of specific datasets to public bodies. Beyond monitoring, Norway does not have any practices, frameworks,
or methods in place to measure the impact of open data. Some public bodies in Norway have taken efforts
to increase the re-use and impact of open data. An example in this regard is the Norwegian Public Roads
Administration, that provides a database of information on national and county roads, municipal roads,
private roads, and forest roads, and encourages the public to re-use the data. To gain insights into the re-use
of the data, the authority monitors statistics such as API usage and the number of downloads. In addition,
the blog vegdata.no shows the public how solutions have been developed based on this data.
Examples of open data re-use provided by Norway show that it is re-used to address challenges in the
political, societal, and environmental field. Norway states that the re-use of open data has a high impact on
154
	Norway did not provide an answer to this question.
OPEN DATA MATURITY REPORT 2019 66
increasing government efficiency. An example in this regard is that the re-use of data from the OpenPEPPOL155
project. Also, the Norwegian company register has supported a faster uptake of electronic invoicing and
thereby contributed to a higher degree of efficiency and to lower costs. In addition, open data is, amongst
other applications, re-used in decision-making and policy-making processes, to provide transparency on
political actions and behaviour of politicians, to address housing issues in the cities, to raise awareness on
noise levels and to reduce emission levels.
Switzerland is the only EFTA country that has a monitoring framework156
in place to measure the impact of
open data. However, the respondents to the survey reported that this was considered too theoretical to be
effective. Therefore, a new version is currently being elaborated. Besides the framework, there are no other
activities conducted to measure the re-use of open data. Some insights into open data re-use in Switzerland,
however, can be gained by looking at the national open data portal, that provides a list of applications that
are developed by using data from the portal. At the moment of writing (October 2019) the list contains 43
applications, with most of them providing solutions to address societal and environmental challenges. The
portal also links the used datasets to each application.
Iceland and Liechtenstein do not put explicit effort in increasing the re-use open data, according to the
answers provided by these countries. Open data re-use is not defined as a priority at national level, and there
are no mechanisms in place to monitor or measure open data re-use. It is unclear if and how open data is
re-used in these countries, and both countries were not able to provide examples of applications or services
built on open data.
An example of open data re-use in Iceland can be found on the European Data Portal, where hundreds
of open data use cases from all of Europe are featured. The application is called Iceland Aurora Alert157
,
and allows users to monitor and learn more about northern lights activities. Coloured areas on the orbit
tell users the likelihood that northern lights can be detected on the sky. Users can set alerts if aurora
activity is expected in a specific area and can share the alerts with others. The application derives
metrological data from multiple resources such as the Icelandic Meteorology Office and the National
Oceanic and Atmospheric Administration.
The Norwegian national open data portal provides a designated area to showcase applications and
services that are based on open data. An example of how open data is re-used in Norway is the platform
Air Quality158
, that provides information on local air quality and predicts air pollution with the help of
open data. The platform is a cooperation between the Environment Directorate, the Norwegian Public
Roads Administration Road Directorate, the Meteorological Institute, the Norwegian Institute of Public
Health, and the Directorate of Health, who have the mission to reduce emissions to air and exposure
to local air pollution.
The Swiss national open data portal provides a designated area to showcase open data use cases.
An example of open data re-use is the application Badimeter159
, that provides users with information
on all public open indoor and outdoor pools of Zurich. Users find information on water temperature,
opening hours and location, and current real-time occupancy and scheduled occupancy for the
swimming pool. Badimeter uses real-time information from the sports department of the city of Zurich.
155
	https://peppol.eu/who-is-who/peppol-certified-aps/
156
	http://digisus.com/blog/wp-content/uploads/2013/06/OGD-CH-IMF-DACHLI-Bericht-V04-DOWNLOAD-VERSION.pdf
157
	https://www.europeandataportal.eu/sites/default/files/iceland_-_auroraalert.pdf
158
	https://luftkvalitet.miljostatus.no/om-tjenesten
159
	https://www.europeandataportal.eu/sites/default/files/switzerland_-_badimeter.pdf
OPEN DATA MATURITY REPORT 2019 67
5.4 Open data quality
Since Liechtenstein does not have a national open data portal yet, this dimension only assesses the open
data quality and the efforts to increase quality in Liechtenstein, Norway, and Switzerland.
When looking at automatic processes to ensure that changes at the source of the data are reflected with
the least amount of delay on the national portal, in both Norway and Switzerland, between 70% and 89%
of the metadata is uploaded automatically. In Iceland, only below 30% is uploaded automatically, which
means that most metadata is edited manually instead.
Due to, amongst others, the automation of the process of uploading metadata, more than 90% of the
data on the national portal of Norway is updated within 1 day from when its primary source is updated.
In Switzerland, this percentage is slightly lower, between 79% and 90%. Iceland was not able to provide
information about this.
Although 82% of the EU28 Member States have a mechanism in place to monitor the quality of metadata
available on their national open data portals, from the EFTA countries, only Norway states to have such a
mechanism. Switzerland does not monitor the quality of metadata yet, but a system for this is currently
being developed and will be put in place for the near future. None of the EFTA countries publishes
information on the quality of the metadata on their respective portals.
Norway and Switzerland both mention that 100% of the data available on the national portal is
accompanied by licensing information. In Switzerland, to be able to publish on the national open data
portal, a publisher must choose one of the portal’s defined licences. Iceland was not able to assess
the share of data accompanied by licensing information. Norway and Switzerland assist publishers in
choosing an appropriate licence for their data by providing information about open licensing in their
general guidelines and handbooks. Both these countries mention that, in line with 79% of EU28 Member
States, between 1 and 5 different open licences are used on the national open data portal.
In terms of compliance with the DCAT-AP standard, both Norway and Switzerland present good levels
of compliance to mandatory, and the support to recommended, and optional classes. In Norway, more
than 90% of the metadata is compliant, more than 90% uses recommended classes, and between 31%
and 50% optional classes. In Switzerland, more than 90% of the metadata is compliant, but there is no
information available on to the use of recommended and optional classes. Both countries developed a
national extension of the DCAT-AP standard to better fit their national context. One of the reasons for
the national extension in Norway was to be able to be more ambitious when it comes to mandatory and
recommended classes, but also to better cover relations to the Norwegian law for restricted and non-
public datasets. The national extension of the DCAT-AP in Switzerland includes more optional fields, and
more attributes are defined as mandatory.
When looking at models such as the 5-Star Open Data to assess the quality of deployment of data in
the countries, none of the EFTA countries report to use such models, and only Switzerland conducts
activities to familiarise data providers with deployment quality models such as the 5-star Open Data or
the linked data concept. The Swiss Federal Archives coordinates with different data publishers “linked data
showcases”, to experiment with this technology and to show its potential. Currently, they are also building
a linked data infrastructure, to encourage and directly support the publication of linked data.
When looking at the quality of data on the national portals of the EFTA countries, it becomes clear that in
Norway more than 90% of the available data is made available under an open licence and in an open and
machine-readable format (3 stars in the 5-stars model). In Switzerland, this percentage is lower, between
30% and 39%. In addition, in Norway, between 10% and 19% of the data is made available under an open
licence, in an open and machine-readable format, and uses consistently Uniform Resource Identifiers (4
stars in the 5-stars model). In Switzerland, this percentage is slightly lower, between 0% and 9%. Just like
in 27 Member States, only 0% and 9% of the data on the portal links to other renowned sources to provide
additional context for the users (5 stars in the 5-stars model).
OPEN DATA MATURITY REPORT 2019 68
5.5 Overall performance
Figure 5.1 shows the average maturity level of the EFTA countries on each of the four open data dimensions.
When looking at the EFTA averages of the open data maturity per dimension, then the same observation as
in the case of the EU28 can be made for the EFTA countries. The dimensions policy and portal are the most
mature, while the dimensions impact and quality are lagging behind. An exception here is the maturity level
of open data quality in Norway. With an average score of 68% on this dimension, Norway scores higher than
the EU28 average of 65%.
In terms of the overall maturity level, the 2019 results in figure 5.2 show a mixed picture in the EFTA
countries. Whereas Norway and Switzerland reach overall open data maturity levels of 65% and respectively
45%, Iceland and Liechtenstein only show very modest results of 8% and respectively 6%. All the four EFTA
countries score below the EU28 average of 66%, although it is worth mentioning here that the overall
maturity score of Norway only differs very slightly (1 percentage point) from the EU28 average open data
maturity score.
When looking at the maturity development over the years, the 2019 results in figure 5.3 show a mixed
picture in the EFTA countries. The open data maturity development in Norway follows the same pattern as in
the EU28 Member States, that is an acceleration of open data maturity between 2015 and 2017, a decrease
in 2018 when the two new dimensions impact and quality were added to the assessment, and an increase
in 2019 again. The open maturity level in Switzerland stays stable over the years. With an average score
Figure 5.1: EFTA averages on the four open data dimensions
0%
10%
20%
30%
40%
50%
60%
70%
80%
90%
100%
Policy Portal Impact Quality
Norway Switzerland Iceland Liechtenstein EU28 average EFTA average
Figure 5.2: EFTA open data maturity development 2015-2019
65%
45%
8% 6%
0%
10%
20%
30%
40%
50%
60%
70%
80%
90%
100%
Norway Switzerland Iceland Liechtenstein
31% EFTA average
66% EU28 average
OPEN DATA MATURITY REPORT 2019 69
between 45% and 56% each year, the open data field is not developing as fast as in the EU28 Member States.
The open data maturity level in Iceland and Liechtenstein are not significantly increasing over the years. On
the contrary, Iceland’s scores are decreasing since 2017.
Figure 5.3: EFTA open data maturity 2019
0%
10%
20%
30%
40%
50%
60%
70%
80%
90%
100%
2015 2016 2017 2018 2019
Norway Switzerland Iceland Liechtenstein EU28 average EFTA average
OPEN DATA MATURITY REPORT 2019 70
Clustering the EU28+
countries
Chapter 6
OPEN DATA MATURITY REPORT 2019 71
The 2019 clustering exercise follows the previous year’s grouping of countries and distinguishes between
the following levels of maturity, from the most performing to the least: open data Trend-Setters, Fast-
Trackers, Followers and Beginners.
6.1 Clustering profiles
The indicative profiles that exemplify the level of maturity you may expect from the countries according
to clusters they belong to are specified below.
Trend-Setter The country has an advanced open data policy in place with a strong
coordination of open data activities throughout at all levels of government. The
national portal provides a wide range of features and caters for the needs of
advanced users and publishers. The level of quality of open data in the country
is very good, with various initiatives in place to ensure the publication of high-
quality data and compliance with DCAT-AP. There are different open data
ecosystems developed around data domains, with a high level of interaction
and reuse within these domains. Activities to measure re-use are conducted,
with methodologies in place to assess the impact in different domains. Little to
no limitations to publication or re-use are observable.
Fast-Tracker The country shows a good level of maturity against all dimensions. Overall
the country showcases activities to boost data publication, with a strategic
approach to increase the quality of published data and a high level of
compliance with standards is achieved. The national portal provides a good
level of functionalities to cover the needs of advanced and basic users. Limited
efforts are made to monitor the impact of open data. However, a stronger
focus is given to tracking and boosting re-use. Some issues can still be
observed, but measures are in place to tackle them.
Follower The country has already an open data policy in place and is conducting
activities to ensure a fair level of coordination of open data activities. The portal
showcases standard features, but also a limited number of features that cater
for the needs of more advanced users. There are a few activities conducted to
boost the publication of high-quality data from different providers, however,
there is no systematic approach to ensure a higher quality of publication across
the board. Only very limited activities to monitor re-use and measure the
impact of open data are performed. A fair number of limitations in terms of data
publication and re-use still exist
Beginner The country shows an early stage of maturity on the four dimensions or -
alternatively - was not able to develop at the same pace as the counties in
other, better performing clusters. Progress is more prominent in the open
data policy dimension. There is no open data portal or, if existent, the portal
showcases limited features or a limited number of datasets, compared to the
country’s potential. None or very limited activities are performed to monitor the
reuse of open data in the country and no monitoring is done to assess impact.
In terms of data quality, the country is taking little action to enable the
publication of data in higher quality, and little effort is spent to ensure the
adoption of DCAT-AP. Visible limitations in terms of open data publication exist,
with limited reuse examples.
Chapter 6: Clustering the EU28+ countries
OPEN DATA MATURITY REPORT 2019 72
The names of the clusters are an exemplification and do not intend to represent literally the achievements
and history of open data developments in the respective countries, e.g. you may find among the “Beginners”
countries that have been investing in open data for years, though with less significant results than others.
6.2 The 2019 clustering
The visual analysis of clustering the overall maturity scores of the EU28+ Member States are presented in
figure 6.1. The figure shows the most mature countries on the left side and the least mature countries on
the right side. This year more than last year the clustering exercise shows clear distances between the four
different groups and minimal distances within the groups. The groups consist of the following number of
countries: 3 Trend-Setters (9%), 8 Fast-Trackers (25%), 14 Followers (44%), and 7 Beginners.
6.2.1 Open data Trend-Setters
With overall maturity scores between 89% and 91%, this year only 3 countries belong to the Trend-Setters
group. Ireland maintains its top position in Europe, with an overall maturity of 91%, followed by Spain with
90%, and France with 89%. Last year, Cyprus and Italy were also qualified as open data Trend-Setters.
Although these countries achieved similar scores to last year (around 80%), they have been pushed back to
the Fast-Trackers group due to the speed of open data transformation in Ireland, Spain, and France. Ireland
increased its score from 88% to 91%, Spain from 87% to 90%, and France from 83% to 89%. This year, the
maturity scores of the trendsetters range from 89% to 91%, while last year this range was from 80% to 88%,
which underpins the minimal distances within the group this year.
6.2.2 Open data Fast-Trackers
With overall maturity scores between 75% and 80%, this year 8 countries belong to the Fast-Trackers group.
This is a decrease of 8 countries compared to 2018 when 16 countries belonged to this group. Ranked from
the lowest to the highest scores within the Fast-Trackers group, these countries in 2019 are: Latvia, Slovenia,
Finland, Italy, Poland, Denmark, the Netherlands, and Cyprus. The only country that moved upwards from
being a follower into being a Fast-Tracker, is Denmark. The other 7 countries in this cluster were already a
Fast-Tracker last year (Latvia, Slovenia, Finland, Poland, and the Netherlands), or fell back from being a Trend-
Setter into being a Fast-Tracker (Italy and Cyprus). It is worth mentioning here that in 2018, the Fast-Trackers
group consisted of countries scoring between 62% and 79%, while in 2019 the group consists of countries
scoring between 75% and 80%. This again shows that this year the differences within the clusters are minor.
6.2.3 Open data Followers
With overall maturity scores between 53% and 69%, this year 14 countries belong to the Follower’s group.
This is an increase of 8 countries compared to 2018, when only 6 countries belonged to the follower’s
group. The Follower’s group is the densest group this year, while in 2018 this was the Fast-Trackers group.
Ranked from the lowest to the highest scores within the Follower’s group, these countries in 2019 are:
Lithuania, Sweden, Romania, Bulgaria, United Kingdom, Luxembourg, Czech Republic, Norway, Belgium,
Figure 6.1: Open data maturity clustering 2019
100% 90% 80% 70% 60% 50% 40% 30% 20% 10% 0%
BeginnersFollowersTrend-setters Fast-trackers
AT NO
HR
CZ HU IS
SK LI
CY
IT
NL
FR
IE
DK
PLES
LV
SL
FI
BE
BG LT
SE
MT
PTCHRO
EE GR LU UK
DE
OPEN DATA MATURITY REPORT 2019 73
Austria, Greece, Estonia, Germany, and Croatia. It is worth mentioning here that the Follower’s group last
year consisted of countries with an overall open data maturity score between 37% and 62%, while this year
the group consists of countries scoring between 53% and 69%. This shows that the group of Followers have
moved forward (with lowest scores increasing from 37% to 53%, and highest scores increasing from 62% to
69%) and that the scores of countries within the group differ less than last year.
6.2.4 Open data Beginners
With overall maturity scores below 45%, this year 7 countries belong to the Beginner’s group. This is an increase
from 4 countries compared to 2018 when Iceland, Liechtenstein, and Malta belonged to the beginner’s
group. Ranked from the lowest to the highest scores within the Beginner’s group, these countries in 2019
are: Liechtenstein, Iceland, Hungary, Slovakia, Malta, Portugal, and Switzerland. The distances between the
countries in the Beginner’s cluster are larger than the distances between the countries in the other 3 clusters,
which shows that the open data maturity level in the 7 countries belonging to the Beginner’s cluster differ
quite a lot from each other. There is a clear distinction between true beginners - Iceland and Liechtenstein -
and the other countries in the cluster that are already further in their open data transformation.
Iceland and Liechtenstein score the lowest since these countries are not yet prioritising open data publication
and re-use and lack dedicated policies and strategies to boost open data transformation in the country. It
is worth mentioning here that Liechtenstein published their Digital Agenda in 2019 with a specific focus on
making available geodata in an open and machine-readable format, which shows that Iceland is taking steps
in opening up public sector information.
Frontrunner in the beginner’s group is Switzerland (45%), followed by Portugal and Malta (both 42%). These
countries are not at the beginning of their open data journey but are not progressing as fast as other countries.
It is worth mentioning here that the beginner’s group in the previous year consisted of countries with an
overall open data maturity score lower than 20%, while this year the group is made up by countries scoring
lower than 45%. While Switzerland and Portugal achieved similar scores as last year, they have been pushed
back to the beginner’s group due to the speed of open data transformation in other countries.
6.3 Development of the clusters 2015-2019
The development of the clusters can be seen in figure 6.2. When looking at the Beginner’s cluster (light blue),
it becomes clear that each year this is the smallest group, which means that each year only a few countries
can be qualified as Beginners. Only this year the beginner’s group is not the smallest group. For the first time
since 2015, there are more Beginners than Trend-Setters. When looking at the Follower’s cluster (dark blue),
it becomes clear that the number of countries in this group decreased each year but increased for the first
time in 2019. In this year, the group of Followers more than doubled compared to 2018. When looking at
the cluster of Fast-Trackers (light orange), it becomes clear that the cluster consists of approximately the
same number of countries every year but only included more than half of the Member States in 2018. When
looking at the Trend-Setters cluster (dark orange), it becomes clear that - except for in 2017 - the group is
getting smaller each year. In 2019, the Trend-Setters group only consists of 3 countries, which is the lowest
number since 2015.
Figure 6.2: EU28 average open data maturity per dimension
0%
10%
20%
30%
40%
50%
60%
70%
80%
90%
100%
2015 2016 2017 2018 2019
BeginnersFollowersFast-trackesTrend-setters
OPEN DATA MATURITY REPORT 2019 74
Recommendations
Chapter 7
OPEN DATA MATURITY REPORT 2019 75
Since 2018, the EU28+ countries are clustered against their level of maturity, to identify affinities between
their progress and challenges. Clustering also enables us to provide focused advice, re-using and building
on the best practices and successes of those the countries who moved first, or perform better.
This year, this exercise is refined in light of the latest results and learnings. Of course, the recommendations
cannot change dramatically from one year of the other. The open data maturity report continues to
evolve these lists of actions through EU28+ countries’ experimentation and contribution.
7.1 Trend-setters
Maintain the ecosystem, experiment, and share the knowledge
	 Enhance and consolidate the open data ecosystem you developed already and consolidate any
‘sectoral depth’. Enable the development of ‘thematic data ecosystems’ around domains defined in
the recent Directive on Open Data and the re-use of Public Sector Information for what concerns
high-value datasets (thematic categories such as statistics, meteorological, mobility). Pilot activities
to develop a thematic ecosystem of publishers and re-users. Transfer the practices to help create a
new ecosystem around another field of interest. Foster the creation of online exchange channels
and tools to further develop knowledge, such as wikis on topics of interest for the open data
community.
2	 Steer the network of open data stewards towards activities to enable data-driven policy-making in
their organisations and commission research to showcase the value of re-use in the public sector
itself, e.g. in terms of efficiency gains. Decentralise monitoring activities to the network of stewards
within your country. Monitoring should address elements that are relevant to enabling more
high-quality data publication as well as to boosting reuse and impact. Such monitoring includes
monitoring on charging practices for open data publication within the stewards’ organisation,
degree of reuse of open data within the organisation, as well as monitoring of progress against the
defined data publication plans. Encourage the publication of structured data by mature, data-aware
organisations. Increase awareness around the use of URIs and RDF for metadata and enable its
publication.
3	 Define a strategy to ensure the Open Data portal’s sustainability. Experiment with alternative funding
models beyond state funding, e.g. pay for value-added services on the portal. Share the outcome of
your experimentation with the other countries.
4	 Engage universities and research institutions to develop country-specific metrics to measure impact.
Be aware of the characteristics of each industry and sector in your assessment. Focus on data
domains in which both data publication and re-use have reached a high level of maturity. Define
and understand clearly the ‘impact’ to be measured in those areas. Operationalise monitoring
the metrics and assessing impact. Rely on a mix of methods (e.g. ex-ante and ex-post analyses,
structured/semi-structured interviews, use cases, log analyses from the national portal…) to ensure
a variety of insights. Improve the metrics iteratively over time. Do not be afraid to try and fail.
5	 Conduct research to assess the economic impact of open data, at both micro and macro levels.
Take advantage of the European Commission’s upcoming impact assessment on the list of high-
value datasets160
to learn from and re-use its economic impact assessment methodology. Iterate
annually or biannually to observe change and refine activities and goals. Leverage the momentum
created by showcasing the results and rally stronger political support.
6	 Harness the wisdom of the crowd by enabling the broader open data community to contribute
more to the national open data programmes. Enable re-users to upload their own data and
showcase their ideas and creations on the national portal. Enable users to comment on and rate
datasets and embed their feedback and ratings in the search algorithms. Enable publishers to
improve their data publication, based on re-users’ feedback and ratings.
1
2
3
4
5
6
160
	Project SMART 2019/0025, https://etendering.ted.europa.eu/cft/cft-display.html?cftId=4676
Chapter 7: Recommendations for the countries
OPEN DATA MATURITY REPORT 2019 76
	 Continue the work on improving the quality of both metadata and data by boosting the use of tools
on your portal (e.g. for the validation of metadata). Enable automated notifications to publishers
to notify them of issues. Provide tools to enable data conversion into alternative formats, possibly
replacing non-machine-readable, proprietary formats.
8	 Link to a variety of sources of real-time data and evaluate means of incentivising custodians of
real-time data to enable publishing, given the higher costs that publication of such data implies
(bandwidth, processing power, etc).
9	 Work with training institutions on providing advanced open data courses and training and tailor
training curriculum to involved more advanced elements (e.g. linked data and the use of Uniform
Resource Identifiers and Resource Description Frameworks . Enable such courses to be formally
recognised as ‘continuing education’ and provide certification to civil servants upon successful
completion of these trainings.
10	 Share your knowledge and results of your experimentation with other countries and enable them
to learn from your best practices and contribute to your research, e.g. in areas of focus you
share, or where you experience similar barriers. Reach out and cooperate with other countries on
developing solutions to common challenges, including basic, re-usable elements such as open
source software that your platforms share (e.g. portal extensions).
7.2 Fast-trackers
Graduate from traction to impact
1.	 Assist the development of open data initiatives at local and regional level and coordinate more
intensively with the local and regional open data teams.
2.	 Activate the network of open data officers and enable them to set up monitoring activities within
their organisation (e.g. develop plans for data publication and monitor charging practice). Track
progress against these plans and assist open data officers to alleviate barriers to data publication
identified in their organisation.
3.	 Ensure that existing open data courses and training materials are promoted and extensively used.
Cooperate with training organisations to develop new course offerings tailored to the needs of
your national, regional and local administrations. Enable such courses to be formally recognised
as ‘continuing education’ and provide certification for civil servants upon successful completion.
Ensure more financial resources are allocated at all administrative levels to enable more civil
servants to benefit from such training activities.
4.	 Focus on organising activities that better target the delivery of sustainable solutions. Move
beyond creativity-stimulating formats (e.g. hackathons) to formats that privilege enabling business
opportunities for medium- to long-term engagement (e.g. data challenges). Ensure funding and
political sponsorship (e.g. organisation as ‘patron’) for winning ideas.
5.	 Promote and follow-up on the performance of developed products and/or services. Develop
strategic awareness of reuse and impact of open data. If useful, focus your resources on a specified
field or sector, to start demonstrating impact, and take the opportunity to from the early work
developed to specify the upcoming high-value datasets for inspiration and prioritisation. Pilot
thematic workshops in these areas. Create a framework for knowledge exchange and enable
the development of a community of practice between publishers and re-users. Increase your
knowledge on the publication and reuse of data in that domain and start thinking of a definition
of impact in that field that can be operationalised into metrics.
6.	 Update the national open data portal to better engage your audience. Include features that enable
online interaction between data publishers and re-users. Showcase re-use examples prominently
on the national portal and promote the datasets used to develop those use cases. Consider the
opportunity to promote the developers as well.
7
8
9
10
1
2
3
4
5
6
OPEN DATA MATURITY REPORT 2019 77
7.	 Monitor access and usage of the portal and enhance knowledge in your team around the profiles
of your portal’s typical users. Enable such insights to flow into improving the portals features, the
access to data and improve the variety of data published in your country.
8.	 Prepare to address the requirements of the recent Open Data and Public Sector Information
Directive by revising and enhancing the portal’s support for real-time data sources. Identify the
main real-time data holders in your country and promote the publication of their data. Deepen
the understanding amongst real-time data holders of the concept of high-value datasets (e.g.
for enabling societal development within the broader vision of smart cities and with most of
high-value sectors becoming real-time). Understand the concerns and costs of publication and
work together with publishers to enable the data publication process. Start with a small range of
datasets.
9.	 Think of ways to ensure the portal’s sustainability by enabling more contributions from the open
data community (e.g. contributions in terms of own datasets, developed use cases, news and
blog items written by the community), by providing value-added features, as well as by exploring
additional funding options.
10.	 Enforce minimum standards to quality of metadata and data by using analytics tools to monitor
data publication - at both metadata (compliance with the DCAT-AP schema) and data (formats
of publication) level. Develop validation schemas for your national portal and send out reports
on published datasets to data providers. Act on the findings of these reports and provide tailored
assistance to publishers to increase the quality of their data publication, both in terms of metadata
and data.
7.3 Followers
Strengthen governance, boost engagement
1.	 Update the national strategy for open data to reflect technical and policy developments at EU
level. In particular, prepare to address the requirements of the latest Open Data and Public Sector
Information Directive by identifying high-priority domains and high-value datasets for publication,
through APIs and free whenever possible. Support publication through legislation where suitable.
2.	 Set up a governance structure that accounts for the characteristics of your country. Engage
potential re-use groups (e.g. data companies, research institutions, NGO’s) into the open data
governance in your country. This will enable a co-ownership around a common vision and buy-in
on the actions for each sector.
3.	 Develop a yearly plan for activities (events, conferences…) at national level to promote open
data. Focus on formats that promote publication as well as re-use by both public and private
sector. Experiment with formats that both leverage creativity (e.g. hackathons) and enable the
development of business opportunities on medium- to long-term engagements (e.g. data
challenges). Ensure funding and political sponsorship for the winning ideas. Promote and follow
up on the performance of developed products and/or services.
4.	 Identify communities of re-users and conduct awareness-raising activities around open data
within these groups (e.g. universities, data start-ups and data companies, research institutes,
NGOs, journalists).
5.	 Encourage the network of open data liaison officers to set up data publication plans and monitor
progress against these plans. Enable the open data officers to monitor charging practices within
their organisation and exchange within the network on practices to alleviate such barriers. Deepen
the understanding within the network of open data officers of the benefits of open data re-use by
the public sector.
7
8
9
10
1
2
3
4
5
OPEN DATA MATURITY REPORT 2019 78
6.	 Ensure that pre-existing open data courses and training materials are used and cooperate with
public administrations and training organisations to develop open data training curricula for national,
regional and local administrations. Enable such courses to be formally recognised as ‘continuing
education’ and provide certification upon completion. Ensure financial resources are allocated at all
administrative levels to training activities for civil servants working with data.
7.	 Enablemeet-upsandengagementbetweenre-usersandpublishers.Developadeeperunderstanding
of open data demand side and work together with data publishers to prioritise data publication in
line with this demand. Focus on fostering open data reuse by both public and private sector and
encourage the community to share their reuse cases. Promote these open data use cases more
prominently on the national portal, ideally in a section directly accessible from the homepage.
8.	 Conduct regular updates to the national portal to reflect the users’ needs. Include features such
as feedback and interaction mechanisms at dataset level, designated login areas for users, access
via SPARQL query or/and API in general. Consider integrating data visualisation and analytics tools
to allow portal visitors to gain insights from data via interactive charts and other visualisation tools.
Monitor access and usage of the portal. Draw insights from this data and enhance awareness
around it within your team.
9.	 Increase understanding of the variety of data that your portal features (historical vs. current data)
and work towards improving it. Identify data holders that do not publish their data or do not reach
to their full potential, understand what friction they are experiencing and plan to address it. Think of
the future and on enabling publication of real-time data in your country.
10.	 Provide trainings and online materials that focus on metadata and data quality. Promote the
DCAT-AP standard and existing guidelines to foster compliance. Create understanding around the
importance of publishing data in machine-readable, non-proprietary formats as well as regarding
the licensing of data. Develop knowledge around existing open source tools to clean up data and
validators for metadata compliance.
7.4 Beginners
Think big, act small
1.	 Rally support to the open data programme and political leadership from top level of government.
Showcase international research around the value of open data. Present research of market value
of open but also commercial data for your country (e.g. from the European Data Market Value
Monitoring161
) to emphasise economic benefits of data exploitation.
2.	 Develop a national strategy for open data and align it with broader strategies at national level (e.g.
national digital strategy, national strategy for the modernisation of public sector).
3.	 Set up a team at national level in charge of open data to ensure coordination of activities within
the country and set up ‘road-shows’ to promote the team’s scope and activities with the main
public administrations in the country. Include both national, and -if applicable - regional and local -
administrations in this process.
4.	 Organise a series of open data events at national level and focus on engaging both data publishers
and re-users in your country. Prioritise the promotion of data publication best practices and re-use
cases during such events.
5.	 Set up relevant communication channels and contact persons for data publication within public
administrations (if applicable, the open data liaison officers) and foster the exchange between these.
Maintain an active dialogue with the open data liaison officers and enable regular exchange of
knowledge amongst them, through offline and online channels (meetings, online forums etc.)
6
7
8
9
10
1
2
3
4
5
161
	http://datalandscape.eu/european-data-market-monitoring-tool
OPEN DATA MATURITY REPORT 2019 79
6.	 Identify the main data holders in the country and understand the main concerns and barriers to
data publication. Take the first steps to overrun these barriers and unlock the publication of data.
7.	 Organise workshops and awareness-raising sessions with the main data holders. Re-use materials
already developed in other countries and at European level as source of inspiration to cover the
basics of open data publication.
8.	 Develop guidelines to enable publication of data, of its metadata and the take-up of suitable
licensing conditions. If standard licences are not suitable, reflect on the need to develop a
national licence for Open Government Data publication in your country. Learn from European
best practices and reach out to colleagues in other countries when setting out to develop such
guidelines. Raise awareness amongst main data publishers around the importance of metadata
and promote the DCAT-AP standard, specifications and existing guidelines developed at European
level.
9.	 Make sure you run a modern portal that enables publication and discoverability of open data. Scout
for European best practices and compare existing infrastructure to choose the most adequate to
support your scope and mission. Set up dedicated news and blog sections to promote relevant
developments as well as to showcase open data re-use examples. Ensure feedback channels are
seamlessly integrated into the national portal.
10.	 Ensure that the national open data strategy guarantees scoping, management and funding of the
portal. Ensure that sufficient resources are allocated to open data awareness-raising activities with
both publishers and potential re-users.
6
7
8
9
10
OPEN DATA MATURITY REPORT 2019 80
Conclusions
OPEN DATA MATURITY REPORT 2019 81
Conclusions
This report presents an extensive overview of the open data maturity levels across the EU28 and the EFTA
countries. It assesses the level of maturity against four dimensions: policy, portal, impact, and quality.
The study clusters countries into four different groups from the most mature to the least: trend-setters,
fast-trackers, followers, and beginners. It includes recommendations tailored to the level of maturity and
characteristics of each of these groups. By doing so, the report provides policy-makers and portal owners
with actionable guidance to push forward and harness sustainable digital transformation through open
data in the years to come.
The report emphasises that the acceleration in open data maturity observed since the first assessment
in 2015 has evolved into a steadier trend of improvement and consolidation. Dedicated open data
policies and strategies together with increasingly advanced national open data portals have laid down the
foundation for making open data available and discoverable throughout Europe. This year in particular,
the EU28+ countries have made great efforts in ensuring the governance of open data at all government
levels by appointing dedicated open data stewards and providing training and guidance to civil servants in
national, regional, and local administrations. Furthermore, and in particular this year, countries have made
more advanced features available on the national portals to make open data better discoverable and to
create channels that connect re-users to data providers and re-users between themselves.
Making open data available and discoverable through increasingly advanced national portals, however, is
just a component of a mature strategy and implementation. Enabling open data re-use and generating
impact are integral parts to this. To steer open data initiatives towards their next phase of maturity, there
is an urgency to increase the quality of both data and metadata to make the former more suitable for re-
use. In addition, there is a need to better understand and capture how value is created with open data and
to gain insights into re-users’ demands and needs. The more mature countries have already expanded
and intensified their efforts to address the more challenging dimensions of open data: quality and impact.
They are becoming more engaged with the community of re-users, listening to their feedback, striving
to address their needs, and creating frameworks to measure impact. Less mature countries, however,
need to step up their efforts and move beyond the basic requirements of the Public Sector Information
Directive if they want to truly harvest the benefits of open data.
The results of this year’s clustering exercise have shown an increasing divide between the trend-setters, fast-
trackers, followers, and beginners. In order to prevent the gap from further increasing, more collaboration
between the countries and a better transfer of knowledge and expertise are necessary. Collaboration
and ensuring more cohesive and consistent open data and shared data spaces in Europe are getting
even more important with the upcoming challenge to publish the selected “high-value datasets” as truly
open data under the Open Data Directive in the coming years. Countries will need to cooperate with the
European Commission throughout 2020 in order to reach a common definition of high-value datasets
and to standardise their specifications, thus facilitating re-use across borders.
To move forward, it is up to the EU28+ countries to capitalise on the experience of the other countries,
captured through this report’s insights and recommendations. This document enables policy-makers and
civil servants to see their progress in the perspective of the commitment and results of their peers across
Europe, whether at national, regional or local level. They can better understand the level of maturity
of their open data achievements in the European context and identify the areas for improvement.
Finally, they can be inspired by the work done in other countries, learn from it, and initiate further cross-
border collaboration. This is a fundamental prerequisite in further realising the benefits of open data and
contributing to the European data economy.
OPEN DATA MATURITY REPORT 2019 82
Annex: country factsheets
Complementary to this report, country factsheets are available on the European Data Portal’s dashboard
at https://www.europeandataportal.eu/en/dashboard. The factsheets provide a more detailed insight at
national level into the results of the four open data dimensions (policy, portal, impact, and quality) in
comparison with EU28 average and with the results from previous years. Examples of content you will
find in the country factsheets can be seen below.
Example from Denmark
Example from Norway
Example from Ireland
OPEN DATA MATURITY REPORT 2019 83
Links to countryfactsheets.
Austria
Belgium
Bulgaria
Croatia
Cyprus
Czech Republic
Denmark
Estonia
Finland
France
Germany
Greece
Hungary
Iceland
Ireland
Italy
Latvia
Liechtenstein
Lithuania
Luxembourg
Malta
Norway
Netherlands
Poland
Portugal
Romania
Slovakia
Slovenia
Spain
Sweden
Switzerland
United Kingdom

More Related Content

PDF
It infrastructure management services @ yash
PDF
Mit Streaming die Brücken zum Erfolg bauen
PPTX
Improving Clinical Trial Performance: Part 3 - Streamline Trial Management wi...
PPTX
Cloud Computing Security Issues
PDF
The open data economy unlocking economic value by opening government and publ...
PDF
The Open Data Economy Unlocking Economic Value by Opening Government and Publ...
PDF
(Background report) Future-proofing eGovernment for a Digital Single Market
PDF
European cohesion policy opens up to open data 2012
It infrastructure management services @ yash
Mit Streaming die Brücken zum Erfolg bauen
Improving Clinical Trial Performance: Part 3 - Streamline Trial Management wi...
Cloud Computing Security Issues
The open data economy unlocking economic value by opening government and publ...
The Open Data Economy Unlocking Economic Value by Opening Government and Publ...
(Background report) Future-proofing eGovernment for a Digital Single Market
European cohesion policy opens up to open data 2012

Similar to Open data maturity report 2019 (20)

PPTX
Report on future policies and regulatory frameworks
PDF
Europe – eGovernment Benchmark 2012 - final insight report
PDF
Digital news-report-2018
PDF
Digital news-report-2018
PDF
Seema Hafeez presentation to 3rd parliamentary forum 2010
PDF
Seema Hafeez presentation on United Nations E-government Survey Leveraging ...
PDF
Conference THE FUTURE IS DATA Panel: Leaders of the European Open Data Maturi...
PDF
European Data Portal - Activities in a nutshell
PDF
qolexity_fazio_26 septembr_2014
PDF
Digital Government Review of Sweden: Towards a Data-driven Public Sector - OE...
PDF
Where does EU money go? Availability and quality of Open Data on the recipien...
PDF
Seema Hafeez presentation to e World Forum 2011 India
PPTX
USA CENDI's Strategic Thinking About Openness for 2014
PDF
Redefining the Digital Divide
PPT
UN e-government survey 2012
PDF
Best practices in Open Data across Europe
PDF
E-Society 2016 - The GOV Indicator - Mark Verhijde
PDF
Open data barometer global report - 2nd edition
PDF
Open Data Barometer, 2nd edition
PDF
HOMER: Results and beyond
Report on future policies and regulatory frameworks
Europe – eGovernment Benchmark 2012 - final insight report
Digital news-report-2018
Seema Hafeez presentation to 3rd parliamentary forum 2010
Seema Hafeez presentation on United Nations E-government Survey Leveraging ...
Conference THE FUTURE IS DATA Panel: Leaders of the European Open Data Maturi...
European Data Portal - Activities in a nutshell
qolexity_fazio_26 septembr_2014
Digital Government Review of Sweden: Towards a Data-driven Public Sector - OE...
Where does EU money go? Availability and quality of Open Data on the recipien...
Seema Hafeez presentation to e World Forum 2011 India
USA CENDI's Strategic Thinking About Openness for 2014
Redefining the Digital Divide
UN e-government survey 2012
Best practices in Open Data across Europe
E-Society 2016 - The GOV Indicator - Mark Verhijde
Open data barometer global report - 2nd edition
Open Data Barometer, 2nd edition
HOMER: Results and beyond
Ad

More from CHARLES Frédéric (20)

PDF
Does the ecological transition necessitate the creation of a “super world cha...
PDF
Etude mastercard digital index 2020
PDF
Pour_une_politique_publique_de_la_donnée
PDF
Pour une transition numérique écologique - Sénat
PDF
Europe AI report ai 2020
PDF
IT Talent Strategy
PDF
Global risks_report_2012
PDF
Global risks_report_2019
PDF
IT Trends : skills for tech pros of tomorrow
PDF
Cigref nouvelles-strategies-plateformes-business-conception-mise-en-oeuvre-de...
PDF
Guide audit du SI - 2nd édition 2019
PDF
Cours crm scm erp vision globale v1.0
PDF
Rapport de la Cour des compte sur le numérique de l'education
PDF
Libra whitepaper fr_fr-1
PDF
Plan SmartCity Quayside Toronto - Sidewalk Labs - Volume 3
PDF
Plan SmartCity Quayside Toronto - Sidewalk Labs - Volume 2
PDF
Plan SmartCity Quayside Toronto - Sidewalk Labs
PDF
State of AI 2019 report
PDF
Intelligence-artificielle-Etat-de-l-art-et-perspectives-synthèse
PDF
Mind the-(ai)-gap : BCG study
Does the ecological transition necessitate the creation of a “super world cha...
Etude mastercard digital index 2020
Pour_une_politique_publique_de_la_donnée
Pour une transition numérique écologique - Sénat
Europe AI report ai 2020
IT Talent Strategy
Global risks_report_2012
Global risks_report_2019
IT Trends : skills for tech pros of tomorrow
Cigref nouvelles-strategies-plateformes-business-conception-mise-en-oeuvre-de...
Guide audit du SI - 2nd édition 2019
Cours crm scm erp vision globale v1.0
Rapport de la Cour des compte sur le numérique de l'education
Libra whitepaper fr_fr-1
Plan SmartCity Quayside Toronto - Sidewalk Labs - Volume 3
Plan SmartCity Quayside Toronto - Sidewalk Labs - Volume 2
Plan SmartCity Quayside Toronto - Sidewalk Labs
State of AI 2019 report
Intelligence-artificielle-Etat-de-l-art-et-perspectives-synthèse
Mind the-(ai)-gap : BCG study
Ad

Recently uploaded (20)

PPTX
job Avenue by vinith.pptxvnbvnvnvbnvbnbmnbmbh
PPTX
CkgxkgxydkydyldylydlydyldlyddolydyoyyU2.pptx
PPTX
Amazon (Business Studies) management studies
PPTX
Principles of Marketing, Industrial, Consumers,
PPTX
Dragon_Fruit_Cultivation_in Nepal ppt.pptx
PDF
Laughter Yoga Basic Learning Workshop Manual
PDF
Digital Marketing & E-commerce Certificate Glossary.pdf.................
PPTX
Probability Distribution, binomial distribution, poisson distribution
PDF
SIMNET Inc – 2023’s Most Trusted IT Services & Solution Provider
PPT
340036916-American-Literature-Literary-Period-Overview.ppt
PPTX
Board-Reporting-Package-by-Umbrex-5-23-23.pptx
PDF
Solara Labs: Empowering Health through Innovative Nutraceutical Solutions
PPTX
Lecture (1)-Introduction.pptx business communication
PDF
Nidhal Samdaie CV - International Business Consultant
PDF
A Brief Introduction About Julia Allison
PPTX
HR Introduction Slide (1).pptx on hr intro
PDF
Ôn tập tiếng anh trong kinh doanh nâng cao
PPTX
Belch_12e_PPT_Ch18_Accessible_university.pptx
DOCX
unit 2 cost accounting- Tender and Quotation & Reconciliation Statement
PDF
Stem Cell Market Report | Trends, Growth & Forecast 2025-2034
job Avenue by vinith.pptxvnbvnvnvbnvbnbmnbmbh
CkgxkgxydkydyldylydlydyldlyddolydyoyyU2.pptx
Amazon (Business Studies) management studies
Principles of Marketing, Industrial, Consumers,
Dragon_Fruit_Cultivation_in Nepal ppt.pptx
Laughter Yoga Basic Learning Workshop Manual
Digital Marketing & E-commerce Certificate Glossary.pdf.................
Probability Distribution, binomial distribution, poisson distribution
SIMNET Inc – 2023’s Most Trusted IT Services & Solution Provider
340036916-American-Literature-Literary-Period-Overview.ppt
Board-Reporting-Package-by-Umbrex-5-23-23.pptx
Solara Labs: Empowering Health through Innovative Nutraceutical Solutions
Lecture (1)-Introduction.pptx business communication
Nidhal Samdaie CV - International Business Consultant
A Brief Introduction About Julia Allison
HR Introduction Slide (1).pptx on hr intro
Ôn tập tiếng anh trong kinh doanh nâng cao
Belch_12e_PPT_Ch18_Accessible_university.pptx
unit 2 cost accounting- Tender and Quotation & Reconciliation Statement
Stem Cell Market Report | Trends, Growth & Forecast 2025-2034

Open data maturity report 2019

  • 1. EUROPEAN DATA PORTAL Open Data Maturity Report 2019
  • 2. OPEN DATA MATURITY REPORT 2019 2 The European Data Portal is an initiative of the European Commission, implemented with the support of a consortium led by Capgemini Invent, including Intrasoft International, Fraunhofer Fokus, con.terra, Sogeti, 52North, Time.Lex, the Lisbon Council, and the University of Southampton. The Publications Office of the European Union is responsible for contract management of the European Data Portal. For more information about this report, please contact: European Commission Directorate-General for Communications Networks, Content and Technology Unit G.1 Data Policy and Innovation Daniele Rizzi - Policy Officer Email: Daniele.Rizzi@ec.europa.eu European Data Portal Gianfranco Cecconi - Principal Consultant, Capgemini Invent European Data Portal Lead Email: gianfranco.cecconi@capgemini.com Written by: Marit Blank - Consultant, Capgemini Invent Email: marit.blank@capgemini.com With contributions by: Cosmina Radu - Senior Consultant, Capgemini Eline Lincklaen Arriëns - Consultant, Capgemini Invent Esther Huyer - Senior Consultant, Capgemini Invent Last update: December 2019 DISCLAIMER By the European Commission, Directorate-General of Communications Networks, Content and Technology. The information and views set out in this publication are those of the author(s) and do not necessarily reflect the official opinion of the Commission. The Commission does not guarantee the accuracy of the data included in this study. Neither the Commission nor any person acting on the Commission’s behalf may be held responsible for the use, which may be made of the information contained therein. ISBN: 978-92-78-42052-9 ISSN: 2600-0512 doi: 10.2830/073835 The reuse policy of European Commission documents is implemented by the Commission Decision 2011/833/EU of 12 December 2011 on the reuse of Commission documents (OJ L 330, 14.12.2011, p. 39). Except otherwise noted, the reuse of this document is authorised under a Creative Commons Attribution 4.0 International (CC-BY 4.0) licence (https://creativecommons.org/licenses/by/4.0/). This means that reuse is allowed provided appropriate credit is given and any changes are indicated.
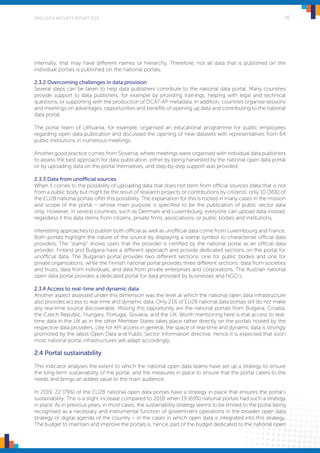
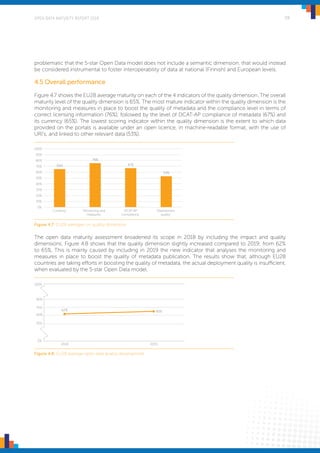
  • 3. OPEN DATA MATURITY REPORT 2019 3 EXECUTIVE SUMMARY This report is the fifth in a series of annual studies that assess the level of open data maturity in the EU28 Member States plus the European Free Trade Association countries (or “EFTA”: Iceland, Liechtenstein, Norway and Switzerland, together called the EU28+ countries). The report serves as a benchmark to gain insights into the development achieved in the field of open data in Europe. The assessment measures maturity against four open data dimensions: policy, portal, impact, and quality. The following trends and results have been identified in the open data maturity assessment of 2019: 1. From acceleration to consolidation After years of open data maturity acceleration, Europe has now entered a phase of consolidation. From the start of the assessment in 2015, the overall maturity level significantly increased each year until it peaked in 2017, as can be seen in figure 1. In 2018, the revision of the methodology made our assessment more ambitious and comprehensive, with the inclusion of two new dimensions of impact and quality. The earlier, easier acceleration towards maturity came to an end and is replaced by the steadier trend of improvement and consolidation seen today. This year, the Member States - now equipped with solid open data policies and advanced portals - are strengthening their open data offer and expanding and intensifying their efforts in the more challenging areas of impact and quality. 2. From quantity to quality As the EU28+ countries’ open data propositions mature, their focus moves from quantity to quality. In the early years, great efforts were made in publishing more and more data in the open, unleashing data assets that were already in the hands of public administrations. However, there were only a few, if any, adaptations made to these data assets. Today, and more than ever before, there is an intensified focus on ensuring the value of data to the re-users, and this often means improving the quality of the data first. This is particularly true as open data teams at both national and local level become more engaged with the community of re-users, listen to their feedback, and strive to address their needs. 3. From publishing to creating impact Valuable data enables better re-use, which, in turn, enables a more significant impact on society and the economy. The EU28+ countries’ focus is no longer just on publishing data and adhering to the other basic requirements of the Public Sector Information Directive, but rather on making the best opportunity out of the data and enabling impact. They are conducting more activities to understand and capture how value is created with open data and to gain insights into re-users’ demands and needs. Examples range from events to engage with the community of re-users and the development of monitoring frameworks, to satisfaction surveys and studies into the societal and economic value of open data. 4. From open data to data sharing Beyond open data, the governments are becoming more aware of the opportunities arising from sharing data in general. When a dataset cannot be published in the open - due to, for example, intellectual property constraints or confidentiality concerns - it does not mean that its value cannot be realised according to other models. That is what is commonly called “data sharing” in the public and private sector. EU28+ countries are preparing to be effective at data sharing with other governments and organisations in a secure way and in full respect to intellectual property and privacy. 5. Overall open data maturity scores 2019 The overall open data maturity scores of the 2019 assessment are presented in figure 2. • Ireland, Spain, and France retain from last year their leading position in Europe. • The average open data maturity score of the EU28 is 66%, up just 1 percentage point from 2018. • Exactly half of the participating 32 countries scores above the EU28 average, and half below. • The average open data maturity score of the EU28+ is slightly lower than EU28: 62%. • 20 of the participating 32 countries score above the EU28+ average, and 12 below.
  • 4. OPEN DATA MATURITY REPORT 2019 4 6. Clustering EU28+ open data maturity scores 2019 The open data maturity clusters are presented in figure 3. The 2019 clustering exercise uses the same grouping criteria of last year and categorises countries - from high performing to low performing - as Trend- Setters, Fast-Trackers, Followers, and Beginners1 . • This year, the clustering shows a clearer separation between the four groups than last year. Within the groups, the differences in scores are minimal. • Only 3 countries belong to the Trend-Setters group: Ireland, Spain, and France. • The number of countries in the Fast-Trackers group has decreased from 16 in 2018 to 8 in 2019. • The strength of Trend-Setter and Fast-Tracker countries has enabled them to significantly improve on the progress they had achieved already. On the other side, this has also amplified the performance gap with the Followers and Beginners groups. • The Followers group is with 14 countries the biggest group this year. In 2018, the Fast-Trackers group was the biggest. • Because the groups are identified starting from the top performers, the score variance within the Trend-Setters, Fast-Trackers and Followers groups is minimal. This is different for the Beginners group, that collects all remaining countries, hence shows much more variance. 7. Open data maturity scores on the four dimensions 2019 The EU28 average maturity level on each of the four dimensions are presented in figure 4. • Policy is the most mature open data dimension with an average score of 74%. This year in particular, countries have invested in the governance of open data to ensure the effectiveness of publication and re-use at all government levels. • The national portals are getting more advanced with an average maturity of 67%. This year in particular, countries have spent more effort analysing their users’ behaviours with 89% of the EU28 countries using web analytic tools. • The average score of 65% on quality shows that, although EU28 countries are already making an effort in boosting the quality of their metadata and data, there is room for improvement. • Impact is the least mature open data dimension with an average score of 57%. This reiterates the need for a strategic approach to monitor and measure the re-use of open data and the impact it generates. 0% 10% 20% 30% 40% 50% 60% 70% 80% 90% 100% 2015 2016 2017 2018 2019 Policy Portal Impact Quality EU28 average Figure 1: EU28 open data maturity development 2015-2019 1 The groups are specified in detail in Chapter 6 “Clustering the EU28+ countries”.
  • 5. OPEN DATA MATURITY REPORT 2019 5 Figure 2: EU28+ open data maturity 2019 Figure 3: Open data maturity clustering 2019 0% 10% 20% 30% 40% 50% 60% 70% 80% 90% 62% EU28+ average 66% EU28 average 100% 1.Ireland2.Spain3.France4.C yprus 5.N etherlands 6.D enm ark7.Poland 8.Italy9.Finland10.Latvia 10.Slovenia 11.C roatia 12.G erm any 13.Estonia 14.G reece 15.Austria 16.Belgium 17.N orw ay 18.C zech Republic 19.Luxem bourg 20.U nited Kingdom 21.Bulgaria 22.Rom ania 23.Sw eden 24.Lithuania 25.Sw itzerland 26.Portugal27.M alta 28.Slovakia 29.H ungary 30.Iceland 31.Liechtenstein 100% 90% 80% 70% 60% 50% 40% 30% 20% 10% 0% BeginnersFollowersTrend-setters Fast-trackers AT NO HR CZ HU IS SK LI CY IT NL FR IE DK PLES LV SL FI BE BG LT SE MT PTCHRO EE GR LU UK DE Policy Portal Impact Quality 74% 67% 57% 65% Figure 4: EU28 average open data maturity per dimension
  • 6. OPEN DATA MATURITY REPORT 2019 6 TABLE OF CONTENTS Executive summary.............................................................................................................................................................. 3 Introduction........................................................................................................................................................................... 7 Measuring open data maturity..........................................................................................................................................8 Chapter 1: Open data policy...........................................................................................................................................10 1.1 Policy framework......................................................................................................................................................11 1.2 Governance of open data..................................................................................................................................... 14 1.3 Open data implementation.................................................................................................................................. 18 1.4 Overall performance..............................................................................................................................................20 Chapter 2: Open data portal...........................................................................................................................................22 2.1 Portal features..........................................................................................................................................................23 2.2 Portal usage.............................................................................................................................................................27 2.3 Data provision..........................................................................................................................................................29 2.4 Portal sustainability.................................................................................................................................................30 2.5 Overall performance..............................................................................................................................................34 Chapter 3: Open data impact.........................................................................................................................................36 3.1 Strategic awareness................................................................................................................................................37 3.2 Political Impact........................................................................................................................................................38 3.3 Social impact........................................................................................................................................................... 41 3.4 Environmental impact...........................................................................................................................................44 3.5 Economic impact...................................................................................................................................................46 3.6 Overall performance..............................................................................................................................................49 Chapter 4: Open data quality.......................................................................................................................................... 51 4.1 Currency....................................................................................................................................................................52 4.2 Monitoring and measures....................................................................................................................................53 4.3 DCAT-AP compliance............................................................................................................................................56 4.4 Deployment quality and linked data..................................................................................................................57 4.5 Overall performance..............................................................................................................................................59 Chapter 5: open data maturity in the EFTA countries.............................................................................................. 61 5.1 Open data policy.....................................................................................................................................................62 5.2 Open data portal.....................................................................................................................................................64 5.3 Open data impact...................................................................................................................................................65 5.4 Open data quality....................................................................................................................................................67 5.5 Overall performance..............................................................................................................................................68 Chapter 6: clustering the EU28+ countries................................................................................................................70 6.1 Clustering profiles....................................................................................................................................................71 6.2 The 2019 clustering...............................................................................................................................................72 6.3 Development of the clusters 2015-2019..........................................................................................................73 Chapter 7: recommendations.........................................................................................................................................74 7.1 Trend-setters.............................................................................................................................................................75 7.2 Fast-trackers..............................................................................................................................................................76 7.3 Followers................................................................................................................................................................... 77 7.4 Beginners...................................................................................................................................................................78 Conclusions......................................................................................................................................................................... 81 Annex: country factsheets...............................................................................................................................................82
  • 7. OPEN DATA MATURITY REPORT 2019 7 INTRODUCTION Since its launch in 2015, the European Data Portal (EDP) has been the main point of access at EU level to find public sector information published across Europe. Its objective is to improve access to open data, foster high-quality open data publication at national, regional and local level, and increase its impact. Within this remit, the European Data Portal has been conducting an annual landscaping exercise providing the EU28+ countries with an assessment of their maturity level and documenting their year-on-year progress since 2015. This report provides an extensive overview of the open data maturity assessment of 2019, which aims to deliver a benchmarking and learning tool at both national as well as European level. It supports countries to better understand their level of maturity, to capture their progress and the areas for improvement, and benchmark this against other countries. Additionally, the study provides an overview of best practices implemented across Europe that could be transferred to other national and local contexts. Complementary to this report, country factsheets are provided on the dashboard of the European Data Portal website2 . The customised country factsheets provide a more detailed insight at national level into the results of the four open data dimensions (policy, portal, impact, and quality) in comparison with EU28 average and the results from previous years. The graphs in this report illustrate the findings from the data gathered. The data from this year’s assessment - as well as data gathered for previous editions - are publicly available on the dashboard. Please consult the method paper3 on the dashboard for a comprehensive description of the methodology used for the assessment. The Open Data Maturity report 2019 is structured as follows: • The “measuring open data maturity” chapter describes how open data maturity is measured. • Chapters 1-4 provide a detailed assessment of the four open data dimensions: policy (1), portal (2), impact (3) and quality (4) in the EU28 Member States. • Chapter 5 offers an overview of open data maturity in the EFTA countries. • Chapter 6 presents a clustering of the countries in four categories according to their performance and describes the key insights related to the grouping. • Chapter 7 provides a set of recommendations for the countries depending on the cluster they are associated with, providing indicative guidance for policy-makers, portal owners, and stakeholders in general to push the open data agenda forward. • The concluding chapter underlines the main takeaways and reflections from the 2019 landscaping exercise. 2 https://www.europeandataportal.eu/dashboard 3 https://www.europeandataportal.eu/sites/default/files/method-paper_insights-report_n5_2019.pdf
  • 8. OPEN DATA MATURITY REPORT 2019 8 MEASURING OPEN DATA MATURITY In the period 2015-2017 the annual open data maturity measurement was built on two key indicators: “readiness” and “maturity”, covering the policy developments at country level as well as the level of sophistication of the national open data portals. To better reflect the open data developments taking place across Europe, a major update to the landscaping methodology was carried out in 2018. The 2018 methodology made the assessment more ambitious and comprehensive and set a stronger focus on the quality of open data as well as the re-use and impact derived by open data. The scope of the assessment has hence been broadened to comprise four dimensions: policy, portal, impact, and quality. Against this background, the 2019 measurement was further developed to add new layers of granularity to the four dimensions. The updates to the questionnaire reflect progress in the European countries, the developments at EU level as well as national and EU priorities, such as the focus on real-time access to dynamic data and enabling smarter cities and countries. With the 2019 updates, the maturity assessment aims to provide further impulses for the national open data teams to redirect their focus on new strategic areas. Stronger prioritisation of high-quality open data publication, an active fostering of re-use and monitoring mechanisms of open data re-use, the development of advanced portal features, and the need for more inclusive and participative governance structures are the main highlights of the 2019 assessment. Similar to past iterations of this research, the data was collected through a questionnaire sent to the national open data representatives working in collaboration with the European Commission and the Public Sector Information Expert Group. The questionnaire was structured against the four open data dimensions as outlined below and included detailed metrics for each dimension to assess the level of maturity. The detailed metrics are presented in figure 5. Dimensions and metrics were last specified at the time of the latest major revision of the methodology in 2018, and have since been maintained to improve clarity or address ambiguities in response to the open data representatives’ feedback. Open Data Policy focuses on the presence of specific policies and strategies to foster open data at national level. The dimension also analyses the existence of governance structures that allow the participation of private and third sector actors, as well as implementation measures that enable open data initiatives at national, regional, and local level. Furthermore, the dimension looks at training schemes that enhance the data literacy skills of the civil servants working with data, and harvesting mechanisms that foster the discoverability of all open data available in the country. Open Data Portal focuses on advanced portal functions that enable both versed and less versed users to access open data via the national portal and features that enhance the interaction between publishers and re-users (via forum and discussion boards). Additionally, the dimension assesses the extent to which portal managers use web analytics tools to better understand their users’ needs and behaviour and update the portals’ features in line with the insights gained from these analyses. The dimension examines the open data coverage across different domains, as well as the approach and measures in place to ensure the portal’s sustainability. Open Data Impact looks at the activities performed to monitor and measure open re-use and the impact derived by such re-use. Beyond this first layer of “strategic awareness”, the impact dimension focusses on four areas of sectoral impact: political, social, environmental, and economic. Within these areas, the questionnaire examines the extent to which monitoring is in place to document the re-use of open data published in these fields, the extent to which applications, products, and services have been developed to address challenges in these fields, as well as the extent to which civil society initiatives exist that are based on such open data and supported by government institutions. With regard to the economic field, the questionnaire focuses on assessments, reports and/or studies that demonstrate the micro and macro- economic value of open data, as well as the efficiency gains achieved by the public sector. Open Data Quality focuses on the measures adopted by portal managers to ensure the systematic harvesting of metadata from sources across the country, as well as the currency of the available metadata and where possible the actual data, the monitoring of the compliance with the DCAT-AP metadata
  • 9. OPEN DATA MATURITY REPORT 2019 9 standard as well as the quality of deployment of the published data. The fourth dimension provides impulses for portal managers and policy-makers to enable open data publication that is good quality all round: using open data formats, machine-readable, high-quality and suitable to a linked data approach (the use of URI’s etc.). Dimension Metrics Open Data Policy Policy framework Governance of open data Open data implementation Open Data Portal Portal features Portal usage Data provision Portal sustainability Open Data Impact Strategic awareness Political impact Social impact Environmental impact Economic impact Open Data Quality Currency Monitoring and measures DCAT-AP compliance Deployment quality and linked data Figure 5: overview of dimensions and metrics
  • 10. OPEN DATA MATURITY REPORT 2019 10 Open data policy Chapter 1
  • 11. OPEN DATA MATURITY REPORT 2019 11 The first assessment dimension “open data policy”, focuses on the open data policies and strategies in place at national level, the governance model by which open data is managed in each country, and the measures adopted towards the implementation of these policies and/or strategies. The following indicators compose the policy dimension: Metric Key elements Policy framework Open data policies and strategies are in place at national level to provide a long-term strategic vision and action plan for open data. The strategies incentivise open data re-use by both the public and private sector. Governance of open data Governance models and coordination activities are in place that ensure the publication of open data at all government levels and support local and regional open data initiatives. Open data implementation Data publication plans exist and progress against these plans is monitored. The number of public bodies that charge above mar- ginal costs is also monitored. Training activities for civil servants working with data are in place. 1.1 Policy framework This indicator analyses the open data policies, strategies, and action plans in the EU28 Member States and their scope. The indicator looks at the visions and objectives around open data and the breadth of actions to implement those. 1.1.1 Open data policies With regard to the availability of open data policies, all EU28 countries report in 2019 that they have adopted a policy that targets the open data field. (Open) data legislation takes either the form of extensive policy frameworks or is embedded in the broader legislation framework that focuses on the modernisation of public bodies. In many countries, the open data policy is part of the national Digital Agenda, the national Digital Strategy, the national Data Strategy, or the work done in the context of the Open Government Partnership4 . A few examples can be found below. In Denmark for example, open data is included in the country’s main digital strategies and programmes. Open data is integrated into the Basic Data Programme (2012)5 , the National Digital Strategy 2016-20206 , the Strategy for Denmark’s Digital Growth (2018)7 , and since 2019 into the National Strategy for Artificial Intelligence8 with a key objective to make more open public sector data available for AI. The government will identify during 2020 and 2021 five key public sector datasets that can contribute to the development of artificial intelligence in Denmark. Brought together, the above-mentioned policies and strategies make out a consistent and comprehensive vision around ‘everything digital’ and how data and open data can fuel this vision. In Italy, the focus on open data is one of the actions of the governmental document Strategy for Digital Growth 2014-20209 . The strategy has a dynamic character and is meant to be progressively updated during the period 2014-2020. 4 https://www.opengovpartnership.org/ 5 https://en.digst.dk/media/14139/grunddata_uk_web_05102012_publication.pdf 6 https://digst.dk/media/16165/ds_singlepage_uk_web.pdf 7 https://eng.em.dk/media/10566/digital-growth-strategy-report_uk_web-2.pdf 8 https://en.digst.dk/media/19337/305755_gb_version_final-a.pdf 9 https://www.agid.gov.it/sites/default/files/repository_files/documentazione/strat_crescita_digit_3marzo_0.pdf Chapter 1: Open data policy
  • 12. OPEN DATA MATURITY REPORT 2019 12 In Slovenia, open data is part of the Government Strategy on the development of public administration 2015-202010 . The strategy has a special section devoted to transparency, re-use and open data. The dedicated section focuses on the online publication of data in an open and machine-readable format. It emphasises the actual goal of open data publication - its re-use - by providing best practice examples. In Croatia, the Open Data Policy11 has been introduced in 2018. The policy sets open data goals and objectives and envisages the adoption of periodical action plans. The implementation of the first action plan started this year. In Germany, the national open data policy for the federal level is part of the national e-government act. The bill was passed by the parliament in May 2017. It introduced the open-by-default approach for raw data collected by federal agencies. Exceptions to that are mainly related to ensuring consistency with the pre-existing federal freedom of information act. Special legislation precedes the open data policy to ensure more specific regulations are not ruled out by the more generic approach of the open data policy. Germany is currently considering working on a strategy for open government data at federal level. 1.1.2 Open data strategies With regard to a dedicated open data strategy, 23 of the EU28 countries (82%) stated that they adopted an open data strategy or equivalent. Not all 23 countries developed a strategy that is exclusively targeting open data but rather embed it into the broader vision of enabling an open government. Moreover, elements of open data strategies are often distributed across multiple strategic documents with their own dedicated focus. Ireland published a dedicated “Open Data Strategy 2017-2022”12 in July 2017. It aims to help Ireland become a leader in open data and to create an environment where the economic, social, and democratic benefits of open data are realised. The strategy sets two core objectives: 1) the publication of high-value government data in open format, making it publicly available and freely reusable and 2) the engagement of the community of stakeholders to promote its social and economic benefits. In 2019, Ireland also published the “Public Service Data Strategy 2019-2023”13 . This strategy underpins the Open Data Strategy and aims to foster high quality and well-governed data accessible by third parties through an API-first and aims to enhance the value of open data in the country. In Latvia, a dedicated open data strategy14 was approved in 2019. The strategy outlines the actions to be taken in order to foster open data transformation. In the Netherlands, a national “Data Agenda”15 was adopted in 2019, a government-wide strategy that focuses on creating a data-driven public sector, and on further developing areas such as data security and data sharing. Data sharing in particular is the current frame of reference, within which open data is dealt with. The Dutch strategy refers to data sharing in its broadest sense, beyond the more traditional exchange between government and citizens (G2C) and government and businesses (G2B), typical of open data. It includes strategic elements covering government to government (G2G), business to business (B2B), and business to government (B2G). Open data is no longer considered to be a specific policy domain but part of the overall data strategy and governance. A similar approach was taken by Malta with its newly adopted “National Data Strategy”16 which establishes a holistic approach towards data management and data sharing based on 12 guiding principles. The Maltese strategy focuses on data sharing within the government domain covering both open data, as well as sensitive data (‘closed data’). This is also being implemented as part of the ‘Once only principle’ activities through the Foundation Data Layer. 10 http://nio.gov.si/nio/asset/strategija+razvoja+javne+uprave+2015+2020?lang=en 11 https://rdd.gov.hr/UserDocsImages//SDURDD-dokumenti//POLITIKA%20OTVORENIH%20PODATAKA.pdf 12 https://www.gov.ie/pdf/?file=https://assets.gov.ie/6572/91c623e548a448ab883c9971bad125a0.Open%20Data%20Strategy%202017-2022#page=1 13 https://assets.gov.ie/7107/7ac4ae109cd944dc99c9e178962fa095.pdf 14 http://tap.mk.gov.lv/lv/mk/tap/?pid=40472319 15 https://www.digitaleoverheid.nl/wp-content/uploads/sites/8/2019/03/data-agenda-overheid.pdf 16 https://mita.gov.mt/en/nationaldatastrategy/Documents/Data-Driven%20Public%20Administration%20(Malta).pdf
  • 13. OPEN DATA MATURITY REPORT 2019 13 The UK is currently also working on a National Data Strategy17 in which open data will be a significant component. 1.1.3 Open data action plans Along with the adoption of open data strategies, the EU28 countries also have implemented action plans to ensure the strategies’ goals are reached. In 2019, 26 Member States (93%) have set up action plans. In Ireland, the necessary actions to achieve these objectives are set out in an “Implementation Plan” which specifies the responsible body for each action and the expected timeframe for delivery. Cyprus also drafted an action plan with measures to be implemented in the open data field. In light on this year’s developments at the EU level - with the recast of the Open Data and PSI Directive18 - the plan underwent a review, with new actions added that aim to strengthen open data governance and ensure a better alignment with EU legislation. In Italy an Action Plan19 was developed for a timeline of three years, targeting, in its latest iteration, the period 2019-2021. In Greece, the 4th National Action Plan on Open Government20 was released in May 2019 with commitments to further promote open access and re-use of documents, information and public sector data, with a view to bringing significant benefits to the society, the economy and the public administration. Commitments are, for example, the creation of a new open data portal with advanced functionalities, screening, scoring and communication mechanisms with users, which should be completed by August 2021. In Sweden, the Agency for Digital Government (DIGG) is drafting a national action plan that will be released in March 2020. DIGG has been established in 2019 and is responsible for Swedish open data portal and the national open data strategy with guidelines and recommendations. In 24 (86%) Member States, the national strategy also mandates central, regional, and local bodies to conduct audits of their data resources and to set up publication plans for data that can be released in the open. In Bulgaria for example, the national strategy requires that each public sector body develops a list of priority datasets for publication on an annual basis. The executive authorities in Bulgaria are assigned the responsibility to monitor progress against these targets. In Poland, the strategy specifies that the public officers responsible for open data at institutional level track and report back their annual progress by year’s end to the Ministry of Digital Affairs – the body in charge with the implementation of the open data strategy. In Finland, the “Act on the Openness of Government Activities”21 mandates that catalogues listing the data inventories are published as open data. These catalogues give an indication on what each data repository/ information repository holds. The act also stipulates that all public sector activities are public and open by default, unless otherwise decreed. This does not, however, automatically mean that data is opened. Needs to limit access to data are considered, typically due to the data containing either personal data, data related to national security or the need to restrict access to sensitive information to datasets that are being processed and not yet suitable to publication. Finally, in response to the upcoming requirement to publish “high-value datasets” expressed in the latest Open Data and PSI Directive, 26 of the EU28 countries (93%) have stated to have commenced work aimed at identifying and prioritising datasets for publications. 17 https://www.gov.uk/government/publications/national-data-strategy-open-call-for-evidence/national-data-strategy-open-call-for-evidence 18 https://eur-lex.europa.eu/legal-content/EN/TXT/PDF/?uri=CELEX:32019L1024&from=EN 19 https://pianotriennale-ict.italia.it/piano/ 20 https://www.opengovpartnership.org/wp-content/uploads/2019/05/Greece_Action-Plan_2019-2021_EN.pdf 21 https://oikeusministerio.fi/en/act-on-the-openness-of-government-activities
  • 14. OPEN DATA MATURITY REPORT 2019 14 1.1.4 Open data re-use by public and private sector Concerning the measures in place to foster the re-use of the data, 21 Member States (75%) replied to the questionnaire by sharing that such measures were indeed taken as part of the national strategy to support re-use specifically by public sector bodies, going up to 24 Member States (86%) when targeting the re-use by the private sector. In most countries, these measures are generic and aim to support re-use regardless of the sector of activity - public or private. The measures mainly involve conducting events and trainings for awareness-raising (e.g. hackathons) and skills development. It is important to note at this stage that some European countries (Denmark, Sweden, Norway, or Estonia) have a longstanding tradition of re-use of the data within the public sector. In Estonia, for example, the national X-Tee interoperability infrastructure22 for secure data exchange between information systems owned by public sector bodies was set up as early as 2000. A similar infrastructure exists in Denmark, in the form of the Data Distributor (“Datafordeler”)23 and the “Basic Data” programme24 . By making key, reference data (“basic data”) available to citizens, business, and other public sector bodies under a common basic-data infrastructure, Denmark ensured early on that the data collected by public administrations was made accessible and easy to use by the public and the private sectors. By ensuring that this basic data conforms to the same technical requirements, data can be used in digital procedures and case processing. The Data Distributor provides access to information about businesses, cadastral registers, maps and buildings, and the register of property owners. At a later stage, the Data Distributor aims to include data on incomes, road infrastructure, and the financial statements of businesses. Additionally, and as mentioned above, other countries - such as the Netherlands and Malta included the data sharing between the government bodies in the direct scope of National Data Strategies. By doing so, an overarching vision is created for the entire public sector in the country. 1.2 Governance of open data This indicator looks at the governance models in place that ensure the publication of open data at all government levels. In addition, the indicator looks at the existence of open data “liaison officers” at public body level and the extent to which open data activities are organised throughout the country to foster the exchange on the open data topic. In 2019, all EU28 Member States except for Hungary had a governance model in place that enables the participation and inclusion of various open data stakeholders. 1.2.1 Hybrid and top-down governance models When looking at the type of governance that is practised in the countries, the vast majority of the EU28 Member States (21 countries, 75%) opted for a hybrid model. These are a mix of a top-down model (strong central coordination) and a bottom-up one (initiatives developed and pursued at local level, with little central guidance). Only 7 countries (25%) stated that they run exclusively a top-down model. These countries are Bulgaria, Cyprus, the Czech Republic, Hungary, Ireland, Luxembourg, and Slovenia. None of the EU28 Member States opted for an exclusive bottom-up model. Hungary is the only country that does not have a governance structure in place yet. However, new strategic planning is in progress in which the establishment of a dedicated agency is planned. Hungary states that a top-down governance model would best fits the country’s context. There appears to be a positive correlation between the model adopted and the country size, with top- down coordination mainly adopted by smaller countries. Strong central guidance seems to be the best option for a small country to move forward in open data transformation, where it is more efficient for a central administrative body to keep track of the resources, systems, and platforms, and makes sure they are used in common. In addition, especially in small countries, limited resources are available at local level and municipalities often need to rely on the technical assistance and financial support of the central government. The hybrid model is chosen by many countries because it allows for guidance, coordination, and support at 22 https://www.ria.ee/en/state-information-system/x-tee.html 23 https://datafordeler.dk/ 24 http://grunddata.dk/wp-content/uploads/2017/06/Tidsplan_GDP.pdf
  • 15. OPEN DATA MATURITY REPORT 2019 15 national level, while at the same time allows for autonomy at regional and local level. In countries such as Denmark or Finland, the local levels enjoy a strong level of autonomy, with little guidance from the national level. In Denmark, the local level’s right to self-government is captured in the country’s constitution, with an oversight from the national level. This is reflected in the open data field as well, with the “Basic Data” programme governed by the state with participation from the local and regional levels. In Finland, a similar looser governance structure is in place. The Finnish system is characterised by wide communal and regional authorities. Central level guidance is feasible only on the highest, strategic level. For the time being, no national body in charge of the governance of open data has been created in Finland. The governance is based on exchanges between the managing team of the national portal opendata.fi and regional and local level actors and cooperation in the form of regular meetings between data re-users and publishers at local and regional level. Based on these experiences, the goal is to expand this collaborative approach to select data owners on the state administrative level. While in some European countries, the governance model includes private and third sector actors (e.g. in Ireland, Estonia, and Spain) in other European countries, the model comprises mainly public sector representatives (e.g. in Czech Republic, Denmark, and Germany). In the following section, the governance models observed in different countries are exemplified. Governance models: Ireland In Ireland, the governance of the Open Data Initiative is underpinned by the Open Data Governance Board25 that was established in 2015. The Board provides strategic leadership and governance in line with best international practices in the area of open data. It is tasked with considering how to improve the capacity and capability of public bodies in implementing open data and considering opportunities to maximise the value of public sector data and information for long-term economic, social, and democratic benefits. The Board also oversees implementation of the national Open Data Strategy 2017-2022 together with the Department of Public Expenditure and Reform. The composition of the Board was reconstituted in 2018 to ensure that the right mix of skills and experience were present on the Governance Board. The complete governance structure to support the Open Data Initiative can be seen in the organigram below. • The Department of Public Expenditure & Reform supports the Open Data Governance Board and the Public Bodies Working Group in implementing the Open Data Strategy and oversees the operation of the national Open Data Portal. • The Open Data Governance Board leads and drives the Open Data Initiative and ensures implementation of the Open Data Strategy 2017- 2022. • The Open Data Unit in the department of Public Expenditure & Reform offers support and assistance to public sectors when publishing their data and organises and runs national open data events. • The Public Bodies Working Group provides technical support and ensures a coherent and consistent approach to the publication of open data. 25 https://data.gov.ie/blog/appointments-to-the-open-data-governance-board Open Data Governance Board Open Data Unit Department of Public Expenditure & Reform Public Bodies Working Group
  • 16. OPEN DATA MATURITY REPORT 2019 16 Governance models: Estonia In Estonia, the open data governance structure is composed of an open data steering group, which involves representatives of the Ministry of Economic Affairs and Communications, the State Information Systems Authority, and the NGO Open Knowledge Estonia - the ministry’s implementing partner of open data policy in the period of 2018–2020. In addition, an open data working group meets regularly to discuss open data, from organisational practical needs to strategic open data policy issues. The working group involves members from different interested ministries and other public sector organisations, such as the National Audit Office and the City of Tallinn. The working group meetings are also open to non-members, such as civil society, private companies, and academia. Other stakeholders can also participate in the governance process via GitHub (via the dedicated issue tracker) and participating to discussion events, such as the annual Open Data Day, Open Data Forum or smaller workshops throughout the year devoted to specific open data issues. The governance structure closely collaborates with the public sector data management working group, coordinated by the Ministry of Economic Affairs and Statistics Estonia. Alignment with the activities of the working groups is ensured by the government’s Chief Data Officer who holds a leading role in both. Governance models: Spain In Spain as well, a governance model was set up that reflects the country’s complex federal structure and heterogeneity of open data actors. The governance model ensures that the goals and vision that were set under the country’s “APORTA Initiative”26 are accomplished. The model includes a mix of actors from the public sector bodies at national, regional, and local level, and private and third sector actors such as enterprises, start-ups and entrepreneurs, civil society organisations, and universities. This governance model also ensures that there is constant collaboration and exchange with other national and international bodies or groups. The open data governance model in Spain identifies a body entrusted with coordinating information re- use activities in each ministry or public entity. The coordination responsibilities lie with the head of the department Under Secretary’s Office, and with the head of associated or dependent entities. The main tasks involve 1) coordinating information re-use activities with department or entity policies, as well as coordinating the sending of information on re-use activities undertaken, 2) facilitating information on competent bodies within its scope to receive, process and resolve re-use requests, as well as coordinating the provision of information on reusable documents and 3) address, where appropriate, complaints and suggestions submitted on the re-use of information. Governance models: Czech Republic The National Open Data Coordinator in the Czech Republic is the main lead of Open Data Working Group which operates under the Council of Government for Information Society (the government advisory and coordination body for reforms of digitisation of the Czech Public administration). To improve coordination within the public administration, the Government Council for Information Society established the Open Data Working Group in March 2017. The Working Group serves as a government platform for open data providers and suppliers from public bodies and authorities to share knowledge and best practices as well as to identify the datasets regularly requested by the public and private sectors. The group consists of 14 Open Data Coordinators from ministries and a few institutions. Civil society and other relevant stakeholders outside of the public administration are not involved. 1.2.2 Open data liaison officers Many Member States (24, i.e. 86%) have set up a network of relevant contact persons for data publication within public administrations. Designated persons in public administrations act as a “liaison officer” or “data steward” in relation to open data and serve as a point of contact with the national open data team. The function of open data liaison officer is often required to promote and encourage the publication and re-use of open data within the respective organisation, to maintain an active dialogue with liaison officers in other public administrations, to exchange and increase knowledge regarding open data, and to ensure linking of datasets to the national open data portal. 26 https://datos.gob.es/en/about-aporta-initiative
  • 17. OPEN DATA MATURITY REPORT 2019 17 In Ireland, there are currently some 70 liaison officers in place who actively promote open data and publication within their organisations. In Germany, a guideline27 recommends the appointment of data officers in every public body. Moreover, every federal ministry in Germany has appointed an open data officer (“Open-Data-Ansprechpartner”). The open data officers convene every 2 months to discuss open data policies and to coordinate the related other public bodies. In Sweden, guidelines recommend all public bodies to appoint a responsible person in the organisation for open data, but only very few public bodies have yet complied to this recommendation. In the Czech Republic, public bodies have to appoint an open data chief officer, who is in charge of open data implementation. This open data officer prepares an internal directive which sets the roles of data stewards, data officers, and a head of institution, in order to ensure a smooth process for opening up data. Open data publication plans are then prepared, with selected datasets and identified risks and benefits along with a time framework for publication. 1.2.3 Fostering open data initiatives throughout the country A vast majority of the EU28 (23 Member States, 82%) report that local or regional governments conduct their own open data initiatives. From the 7 countries that have a top-down governance model in place, 3 countries (Bulgaria, the Czech Republic and Ireland) report that local or regional governments conduct their own open data initiatives. These include writing dedicated open data policies, the implementation of strategies, and operating portals for municipalities or cities, and activities to boost the re-use of open data, such as hackathons, conferences, re-user meetings, open data challenges, and studies into benefits and challenges of open data publication and re-use. Figure 1.1 below shows the percentages of local and/or regional governments conducting open data initiatives. Looking at the left side of the figure, it shows that in 10 countries (36%) only less than 25% of the local/regional governments conduct open data initiatives. At the same time, looking at the right side of the figure, in 5 countries (18%), more than 75% of the local/regional governments conduct open data initiatives. These countries are Belgium, Denmark, Germany, Latvia, and the United Kingdom. In the UK for example, at a regional level, Northern Ireland, Scotland, and Wales all publish their own National Action Plans with their own respective open data commitments and initiatives. At a local level, regions of the UK have pursued their own open data approaches, such as the Data Mill North28 , Devon County Council Open Data29 , and the London Data Store30 . 36% 21% 7% 18% 0% 5% 10% 15% 20% 25% 30% 35% 40% 100% 1-25% %ofEU28countries 26-50% 51-75% 76-100% Figure 1.1: The percentage of local and/or regional open data initiatives 27 https://www.verwaltung-innovativ.de/SharedDocs/Publikationen/eGovernment/open_data_prozessbeschreibung.pdf?__blob=publicationFile&v=2 28 https://datamillnorth.org/ 29 https://www.devon.gov.uk/factsandfigures/open-data/ 30 https://data.london.gov.uk/
  • 18. OPEN DATA MATURITY REPORT 2019 18 1.3 Open data implementation This indicator looks at implementation measures in place that enable open data initiatives at national, regional, and local level. More specifically, the indicator analyses the existence of guidelines or guidebooks that foster the release of open data within the country, the existence of data publication plans and the monitoring of progress against these plans, and the extent to which regional and local sources are systematically harvested by the national portals. Additionally, the indicator looks at access to real-time and dynamic data, training activities that enhance the data literacy skills of the civil servants working with open data, and the monitoring of public bodies that still charge above marginal costs. 1.3.1 Guidelines and guidebooks Member States are providing guidance and assistance to the local and regional level, as well as federal level ministries when it comes to the implementation processes of open data. For the purpose of open data implementation, guidelines and guidebooks have been developed and circulated. Most of these guidelines and guidebooks are available on the national open data portals. A good practice comes from France, where different guidelines were written with a specific target audience in mind31 . France is currently updating these guidebooks in order to provide guidelines to the data producer on data.gouv.fr and accompanying the data producer through the user story of creating a profile on the national portal, to the publication and the updating process of data. A guidebook on technical and legal best practices was also published.32 With the same objective of addressing different audiences, Finland developed its “Data Owner’s Guide”33 . The guide provides different sections that are tailored to the needs of different audiences. A first section deals with beginner-level topics such as the concept of open data, explains its significance, the key terms as well as the most commonly used licenses. Another section targets the needs of the data producers. The section is aimed at organisations that currently plan to open their data. A different section is targeted to organisations that have opened their data already and explaining to them how they can use the national portal to gain further insights into their data, thus helping them further along the path of benefiting the data consumers. Another section provides detailed guidelines in e.g. adopting processes to ensure the buy-in of the entire organisation throughout the data publication and data maintenance process. The Polish Ministry of Digital Affairs published the “Data Opening - Good Practice Guide”34 . The guide is part of the project “Open data - access, standard, education”35 that aims to increase the availability and quality of open data and its re-use. The guide describes the basic framework for the process of opening data by referencing relevant legal acts, identifying desired institutional settings, and presenting practical scenarios for data opening in government offices. Furthermore, the guide shows how to implement the data opening process effectively and gives guidance on the standards for data openness. The good practice guide is written for managers and employees in central and local government administration offices, representatives of non-governmental organisations, and for those who base their knowledge of public administration activities on data generated and processed in public institutions. In Italy guidelines take the shape of a formal policy document: the “Guidelines for the enhancement of public information”36 . The documentation provides support to public administrations in the publication process, defining the main recommendations to be followed in order to implement the national strategy. The actual implementation of the strategy is guided by the aforementioned Action Plan 2019-2021 and the Action Plan of the Open Government Partnership37 . 31 https://doc.data.gouv.fr/, https://opendatafrance.gitbook.io/odl-ressources 32 https://www.cnil.fr/sites/default/files/atoms/files/guide-open-data.pdf 33 https://www.avoindata.fi/fi/opas/avoimen-datan-opas 34 https://dane.gov.pl/media/ckeditor/2019/07/04/open-data-good-practice-guide.pdf 35 https://www.gov.pl/web/cyfryzacja/otwarte-dane-dostep-standard-edukacja2 36 https://www.dati.gov.it/content/linee-guida-nazionali-valorizzazione-patrimonio-informativo-pubblico 37 http://www.funzionepubblica.gov.it/attivita-internazionali/ogp
  • 19. OPEN DATA MATURITY REPORT 2019 19 In Austria, practical guidelines38 for the implementation of the PSI Directive were compiled by a working group of the platform Digital Austria, which covers organisational and technical aspects. Additionally, an “Open Government Implementation Model”39 was developed, that was re-used by authorities in the country and abroad as foundation for their open-government initiatives and gives comprehensive help to organise in the publication process. Greece has a dedicated support area40 on the national open data portal that allows data publishers to learn about DCAT-AP, different licensing options, and high-quality data. The portal also offers a guide41 for public administrators for publishing open data. 1.3.2 Monitoring data publication Datapublicationplansandmonitoringmechanismsfordatapublicationcanserveastoolstooverseeprogress across national and local public administrations and enable more effective interventions where applicable in order to overrun barriers to data publication. The number of Member States that have such publications plans in place are 24 (86%), but only 18 of these Member States also have a monitoring mechanism in place to track the progress of data publication against these plans. A good practice in this field comes from France, where plans have been set up at national as well as regional and local levels. At the national level, the Etalab task force42 follows a data publication plan driven by the latest decrees, such as the publication of public procurement data. Moreover, Etalab also defined a list of datasets with high impact on economic and social life, which have to be opened as a priority. Additionally, and applicable to each level (national, regional, and local), the Digital Republic Act43 has also set a deadline for all municipalities with more than 3500 inhabitants to open all their data. Each level is also concerned by the priority publication of data with high value impact. In Croatia, such plans were defined within the framework of the Action Plan for the Implementation of the Open Data Policy, which mandates public sector bodies to identify and publish key datasets. Such activities include defining the priority datasets, developing a timeline for publication and monitoring progress against this timeline. The goal set by the national level is that all the identified key datasets are published in open format by the end of 2020 or beginning of 2021. In addition, the Action plan envisages the development of a model open data strategy for local and regional level, in cooperation with the national associations of local and regional authorities, and its adoption by at least 10% of local and regional bodies. 1.3.3 Harvesting data from regional and local portals Compared to 2018, the national levels have also increased their harvesting of local and regional portals. Whereas in 2018, 21 (75%) of the Member States harvested data from local and regional portals, in 2019 this has increased to 24 Member States (86%). On one side of the spectrum, there are 10 countries that harvest over 90% of their local and regional portals: Austria, Belgium, Croatia, Czech Republic, Estonia, France, Germany, Ireland, Latvia, and Portugal. On the other side of the spectrum, there are 6 countries that harvest less than 25% of their local and regional portals: Bulgaria, Greece, Hungary, Lithuania, Poland, and Slovenia. The reason for this low percentage varies per country. In Bulgaria, for example, the current national open data portal does not allow for harvesting yet, although this development is in process. In Slovenia, the low percentage is due to the fact that regional governments are relatively small and therefore do not have their own portals. Regional governments act on the basis of laws, by-laws, and the national public sector strategy, and publish their data to the national portal directly. 1.3.4 Access to real-time and dynamic data Of particular interest in 2019 is the topic of access to real-time and dynamic data. Of the of EU28 countries, 21 (75%) conduct activities at national level to assist real-time and/or dynamic data holders in their publication process. In Luxembourg, for example, there have been many meetings to succeed in opening up the real-time public transport data from the transport ministry. Regular interventions by users make clear 38 https://www.ref.gv.at/fileadmin/_migrated/content_uploads/upsir_1-0-0._20150701pdf.pdf 39 https://www.kdz.eu/en/open-government-implementation-model 40 http://www.data.gov.gr/pages/support-material 41 http://data.gov.gr/files/UserGuide_data.gov.gr.ver.1.0.pdf 42 https://www.data.gouv.fr/en/organizations/etalab/ 43 https://www.legifrance.gouv.fr/eli/decret/2018/12/10/ECOJ1817657D/jo/texte
  • 20. OPEN DATA MATURITY REPORT 2019 20 that amendments are still necessary. Cyprus, just like many other countries, provides trainings, technical guidelines, and technical support on how to release real-time and dynamic data. In some cases, the Public Sector Information team in Cyprus collaborates with universities to develop API’s for public sector bodies to release their data. In Ireland, the Open Data Unit also engages with real-time and dynamic data holders. The number of datasets available via API at the Irish national open data portal has increased significantly in the past year to 537 datasets (November 2019). 1.3.5 Open data training for civil servants To enable the open data skills development, 24 of the EU28 Member States (86%) provide training activities to their civil servants. Only Belgium, Hungary, Portugal, and Sweden report that they do not conduct any training activities at national/federal level around open data. However, in Belgium, such trainings do exist at a regional level. The variety of training ranges from information sessions for public servants, workshops and training sessions at public body level, to webinars, e-learnings, and tutorials. In Romania, the Secretariat General of the Government (SGG) developed open data training material for civil servants, as well as a set of specific recommendations for the local level. During 2018, there have been training sessions for 200 civil servants at national level, and in 2019 there were training sessions provided for civil servants at local level, too. In Latvia, each ministry and their agencies organised technical workshops on publishing open data. In addition, the Latvian Open Strategy Action Plan includes plans for developing educational courses and expert seminars on open data. 1.3.6 Charging for data When assessing the share of EU28 that monitor the extent to which public sector bodies are still charging for data above marginal costs, just over half of the countries (17 countries, 61%) replied affirmatively. In most of these countries (12 countries, 71%), only less than 10% of public administrations charge above marginal costs. In 5 countries (29%) this percentage is slightly higher: between 10% and 25%. It is worth mentioning here that none of these 17 countries found that more than 25% of their public administrations charge data above marginal costs. When asked how this percentage has changed compared to the previous year, 7 countries - Austria, Croatia, Estonia, France, Lithuania, the Netherlands, and Slovenia - confirmed that their situation hasn’t changed, as they mention that none of their public administrations charged above marginal costs during 2018 and 2019. This is mainly thanks to the respective national legislations that mandate public bodies to publish free of charge. Additionally, 9 countries reported that the percentage of bodies that charged above marginal cost has decreased compared to 2018. None of the EU28 countries stated that the percentage of public bodies that charge data above marginal cost has increased since last year. 1.4 Overall performance Figure 1.2 shows the EU28 average maturity on each of the 3 indicators of the policy dimension. On average, Member States score relatively high on the policy dimension with an overall maturity level of 74%. The most mature indicator within the policy dimension is the governance of open data (79%), followed closely by the policy frameworks in place (73%) and the implementation of open data (69%). Figure 1.2: EU28 average maturity on open data policy dimension 73% 79% 69% 0% 10% 20% 30% 40% 50% 60% 70% 80% 90% 100% Policy Framework Governance Implementation
  • 21. OPEN DATA MATURITY REPORT 2019 21 When looking at the maturity development over the years, figure 1.3 shows that the policy dimension significantly increased each year since 2015, but that this acceleration has stopped in 2019. This year is the first one when the maturity level did not increase but decreased compared to 2018. This is likely due to the Member States focusing effort on policy early in the overall transformation to support open data publishing and re-use. Moreover, while policymaking is never a simple process, the most of the “low- hanging fruits” were picked in the early years. The country ranking of the policy dimension can be observed in figure 1.4. The figure reveals that 17 Member States score above the EU28 average of 74% and 11 Member States score below the EU28 average. The countries with the highest maturity levels on the policy dimension are France (98%), Denmark (95%), Ireland and Poland (both 91%). 47% 57% 72% 82% 74% 0% 30% 40% 50% 60% 70% 80% 90% 100% 2015 2016 2017 2018 2019 Figure 1.3: EU28 average open data policy development 0% 10% 20% 30% 40% 50% 60% 70% 80% 90% 100% FranceD enm arkIrelandPoland SpainC roatiaC yprus N etherlands ItalyEstoniaSlovenia LatviaG reece C zech RepublicLithuaniaG erm anyBulgaria EU 28 averageFinland U nited KingdomBelgium Austria Luxem bourgSw edenRom ania M altaSlovakiaPortugalH ungary Figure 1.4: EU28 open data policy maturity
  • 22. OPEN DATA MATURITY REPORT 2019 22 Open data portal Chapter 2
  • 23. OPEN DATA MATURITY REPORT 2019 23 The second assessment dimension ”open data portal” focuses on the level of maturity of national open data portals, including considerations around their functionality, usage (user analytics), variety of data featured, and the approach to ensuring the portal’s sustainability. The following metrics are assessed as part of this dimension: Metric Key elements Portal features Portal features ensure access to datasets and relevant content, including more advanced features such as SPARQL search, discussion forum, rating of datasets, requesting datasets, and providing transparency on the progress status of requested datasets. Portal usage Traffic to the portal is monitored and analytics tools are used to gain insights into users’ behaviour and the most and least consulted data categories. In addition, the portal offers API’s through which advanced users can access the metadata programmatically. Data provision The majority of data publishers can contribute (meta)data to the national portal and actions are taken to enable publication from data publishers. In addition, access to real-time data is enabled via the portal and data that does not stem from official sources can be uploaded. Portal sustainability A sustainability strategy for the portal has been defined and activities are conducted to ensure the portal’s visibility, including social media presence. In addition, user surveys are conducted regularly, and feed into reviewing process of improving the portal. In 2019, all EU28 countries have a national portal that ensures the data sources available throughout the countries are discoverable via one gateway. Early 2019, Malta launched its national data portal, as part of the wider framework of the Enterprise Data Management Strategy that is currently implemented in the country. Although Denmark does not offer one single gateway to open data existing throughout the country, the country provides a number of different thematic portals that ensure that the data from these fields is made available to its target audiences. Denmark has opted for this decentralised approach, as it best fits the national context and administrative system. 2.1 Portal features This indicator evaluates the functionalities on the national open data portals and investigates both basic features as well as more advanced features. Basic portal features include, for example, search functions that enable filtering, searching by file format and searching by data domain, while more advanced portals also enable users to search data via a SPARQL search query. Moreover, the indicator examines portal features such as the possibility for visitors to request and rate datasets and examines whether portals offer a designated area to show open data use cases. More advanced portals do not only allow users to request data and offer a designated for open data use cases, but also provide a higher degree of transparency towards visitors by presenting the progress status of data requests and allowing visitors to submit their own open data use cases. The indicator also examines whether portals have features in place that foster the online interaction between publishers and re-users, such as discussion forums, the possibility to provide feedback on datasets, and to receive notifications when new datasets are available on the portal. 2.1.1 Searching for datasets With regard to searching for datasets, all 28 national portals have a search function in place that enables multiple field search and various filter options. In addition, all 28 national portals enable users to search for data per data domain and 26 national portals enable users to search by file format. When looking into more advanced search features, only 5 countries offer a SPARQL search query function: Austria, Belgium, the Chapter 2: Open data portal
  • 24. OPEN DATA MATURITY REPORT 2019 24 Czech Republic, Slovakia, and Spain. The European Data Portal presents a good practice regarding SPARQL search query, by also providing links to additional documentation on the SPARQL specifications. Using SPARQL enables the more advanced users to search deeply and precisely in the metadata offered - whether by the source portals or the European Data Portal itself. Moreover, it enables access to metadata that is not directly visible to users by using the website interactively, e.g. SPARQL queries can use the fields included in metadata specific to geospatial datasets published according to the GeoDCAT-AP standard44 . SPARQL can also be used “programmatically”: this means that advanced users can write software that automatically interrogates the data portal, e.g. to identify the availability of new datasets. The screenshot below showcases the European Data Portal’s SPARQL manager - also accessible via the portal’s main page. 2.1.2 Requesting datasets Search functions need to be in place to enable users to discover the data they are looking for. However, not all data that users aim to find is published on the national portals. Besides the national portals of Austria and Hungary, all EU28 national portals provide users with the ability to request datasets that are not published (yet). The most common way to request datasets is via a designated request form. The level of detail of these request forms varies per country. In the UK, for example, users are required to explain their request in a message, while other national portals, such as the Bulgarian and the Spanish portal, require users to fill in mandatory fields about their request, such as the reason for their request, the expected benefits of the dataset, the preferred data format, and the name of the users’ organisation. When looking at the frequency by which data requests come in, 16% of the portals receive data request on a daily basis, about 20% on a weekly basis, another 24% on a monthly basis, and around 40% at less 44 GeoDCAT-AP is an extension to the “DCAT application profile for European data portals” (DCAT-AP) for the representation of geographic metadata. See: https://inspire.ec.europa.eu/good-practice/geodcat-ap. Future releases of the European Data Portal will give better visibility to the interactive user of the availability of GeoDCAT-AP metadata and other DCAT-AP extensions’. Screenshot 1: SPARQL search function on the European Data Portal
  • 25. OPEN DATA MATURITY REPORT 2019 25 frequent intervals. These numbers tell us that most national portals in EU28 (40%) receive less than one data requests per month. Even if 26 national portals offer a data request option, only 22 national portals monitor the extent to which these requests result in the publication of the respective data. The distribution of the percentage of data requests resulting in publication can be seen in figure 2.1. Looking at the right side of the figure, it becomes clear that 2 countries (9%) - Estonia and Poland – indicate that more than 90% of the incoming requests are fulfilled. An important note here is that Poland only receives data requests less than once a month. Estonia, however, receives data requests on a weekly basis and achieves to publish more than 90% of these datasets. In 5 other countries (23%), between 51% and 90% of the data requests are fulfilled. In countries (41%) between 10% and 50% of the data requests are fulfilled. In 6 countries (27%) only less than 10% of the requested data results in publication. 2.1.3 Providing transparency From the 26 national portals that offer a data request option, only 14 of them showcase these requests in a transparent way on the portal. A good practice in this regard comes from the national portal of Spain. The portal offers a designated area in which all data requests are listed. Visitors can see the description of the request, the reason for the request, and the expected benefits of the data. In addition, the status of every request is shown, such as assigned, published, not feasibly, under study, or partially published. The portal also enables visitors to filter requests by, for example, date of the request, data category, or progress status of the request. Along the line of transparency, 15 national portals provide users with the possibility to see what data is available but cannot be published as open data e.g. because of unresolved rights restrictions or confidentiality reasons. A good practice, in this case, comes from the Netherlands, where this data is tagged as “closed data” on the national portal. Another interesting approach comes from Ireland, as can be seen in the screenshot below. The visualisation shows the number of datasets under an open licence (green) and the available datasets that are not under an open licence yet (blue). The screenshot reveals that not only the number of datasets under an open license has increased over the years, but that also the share of data under an open license reported to the total available data has increased. In October 2019, for example, there were 8937 datasets available, all available under an open licence. 27% 41% 23% 9% 0% 5% 10% 15% 20% 25% 30% 35% 40% 45% <10% 10-50% 51-90% >90% 100% %ofEU28countries Figure 2.1: The percentage of data requests resulting in data publication Screenshot 2: number of datasets under open license (green) - Irish national open data portal
  • 26. OPEN DATA MATURITY REPORT 2019 26 2.1.4 Enabling interaction With regards to features that foster interaction between re-users and data publishers, 27 of EU28 portals offer a general feedback channel on their portal. There is still a preference amongst portal teams to collect feedback of any nature via an intermediary point. This feedback generally comes into a monitored email inbox that is then manually forwarded to the responsible person or public body. The most common mechanism remains the general helpdesk form, through which users can provide general feedback, report low-quality data or broken links, or make suggestions. A possible explanation for the decision to collect all feedback via one single point rather than enable direct interaction between users and publishers might be that this mechanism enables the portal managing team to monitor the feedback that comes in and develop a better understanding of their users’ and the general open data community’s needs. Besides general feedback channels, 25 of EU28 national portals allow users to provide feedback on datasets. This often takes place in the form of a feedback button or a direct e-mailing to the dataset provider. Along the line of fostering interaction between data publishers and data re-users or between re-users themselves, 16 of the EU28 portals offer a discussion forum for registered users. The most common forum type is a discussion module that is available for each dataset. This allows users to express their opinions about the published dataset and makes it possible to report areas for improvement to the data provider. Some Member States, such as France, do not only offer a discussion forum attached to each dataset, but also a general discussion forum where users can discuss issues and express their opinions that are not related to a specific dataset. A general discussion forum remains a common and valid choice to support the communities surrounding the portals for topics that are not related to a dataset in particular, but general such as skills or best practices. This choice was also made by other major data-related projects, such as the European Commission’s Support Centre for Data Sharing, fostering the community of practitioners - private and public - in data sharing, rather than in open data45 . A discussion forum enables a more qualitative approach for evaluating datasets than rating mechanisms such as up or down voting or a five-star rating module. However, rating mechanisms provide users with the opportunity to show their satisfaction with the data in a glance and allows users to see how datasets are valued by the crowd. Only 8 out of the EU28 national portals allow users to rate datasets. Slovenia and Ireland do not have a rating system in place yet, but both have plans to release this feature in the near future. The most common rating system is a 3 or 5-star rating, or a like/dislike button. Most national portals (19 of EU28) offer the possibility for users to receive notifications on the availability of new datasets (e.g. RSS/ATOM feeds, email notifications). A good practice comes from the national portal of Finland, where registered users can tag a number of organisations to follow. When the organisation publishes a new dataset, or updates an existing one, the users following this organisation receive a notification. Non- registered users cannot follow an organisation but can follow individual datasets. By subscribing to these datasets, users receive a notification when the datasets are updated. 2.1.5 Providing examples of open data re-use Regarding the promotion of open data re-use via the national portal, 20 of EU28 have a designated section to promote applications based on open data. Latvia and Lithuania do not have such an area yet but have plans to release this feature in the near future. The 20 national portals also offer the possibility for users to submit their own open data reuse examples. In some cases, such as France, Luxembourg or Portugal, the national portal has a designated ‘use case upload’ feature. The most common way to submit such use cases, however, remains the possibility to register use cases via the general feedback form. Regarding open data use cases, 18 national portals offer a mapping between the use cases and the datasets that the use cases are based on. A best practice in this regard comes from Austria, where datasets and applications are mapped in two different ways. The first one is a designated area on the portal that showcases all open data applications and that provides a link to each dataset that is used to build the application. The second way is the other way around: for every published dataset, the portal provides a link to all the applications that are built with the data. This two-way mapping between datasets and applications enables users to get inspired by what can be done with the data and enables data providers to discover what kind of applications are built with the data they provide. 45 See https://eudatasharing.eu/
  • 27. OPEN DATA MATURITY REPORT 2019 27 When looking at more advanced features such as a preview function for both tabular and geodata, 19 portals have a preview feature for tabular data, and 15 portals a visualisation feature for geospatial data. The functionality is perceived to be an important way to engage non-expert users, whose skills do not extend into being able to process the data for themselves. Through previewing and visualisations - and particularly through maps, where suitable - users can experience and explore the data interactively. An example in this regard comes from Cyprus. The screenshot below illustrates how geospatial data visualisation is used to show the location of local earthquakes between 1997 and 2016. 2.2 Portal usage This indicator examines the extent to which national portals gather insights into the usage of the portal to better understand users’ behaviour. Insight into, for example, the number of unique visitors, the typical user profiles, the most consulted datasets, the most popular data domains, and traffic generated via the portal’s API, allow portal managers to evaluate if the current portal design and features, as well as the available data, meet the users’ needs. 2.2.1 User analytics Most national data portals (25 of EU28) use analytics tools to better understand the visitor profiles and capture the extent to which the portals meet the needs of the visitors. Often mentioned tools are Google Analytics46 and Matomo47 . Portal owners become more aware of the benefits of using analytic tools to gain insights into portal usage, as in 2017 only 39% of the portal teams used analytic tools, while in 2018 this number increased to 88% and in 2019 to 89%. A good practice in this regard comes from Latvia. The analytics of the portal demonstrated that 90% of the visitors came from Latvia. To attract more foreign visitors, the team decided to translate more content into English. The Finnish national portal discovered that only 30% of the portal visitors browsed the portal with mobile devices, which is below the national percentage of 67%. This lower percentage can be explained by a user base that mainly consists of developers. The Spanish portal uses insights into visitor’s behaviour not only to increase their understanding of users’ behaviour but also to choose the theme for weekly published articles and for the composition of the newsletter. 46 https://analytics.google.com 47 https://matomo.org/ Screenshot 3: geospatial data visualisation on the Cypriot national open data portal
  • 28. OPEN DATA MATURITY REPORT 2019 28 2.2.2 Portal visitors When trying to better capture portal usage, the number of unique visitors48 per month is one of the most common measures used. Figure 2.2 shows the share of unique visitors per month reported to the population per country. Looking at the numbers depicted by the chart, it becomes clear that the national open data portal of Luxembourg attracts the most visitors compared to its population. With 613.894 persons having their usual residence in Luxembourg on 1 January 201949 and with an average of 16720 unique portal visitors per month, the portal attracts 0.027% of Luxembourg’s population. 2.2.3 Most popular data domains Insights into the popularity of data domains allow portal teams to research and engage with less popular data domains. Figure 2.3 shows the most popular data domains in the EU28 Member States in 2019. The domains are based on the 13 European standard DCAT-AP data categories. The 2019 open data maturity assessment asked countries to provide the top 5 data categories consulted on the portal. The chart below shows the weighted scores. Similar to 2018, Government and Public Sector is the most popular data domain (20%). Environmental (16%) and Economy and Finance (14%) follow as the second and third most popular data domains. The least popular data domains are Agriculture, Fisheries, Forestry & Foods (3%), Justice, Legal system, & Public safety (1%), and Science and Technology (1%). None of the EU28 national portals mentions the data domains Energy and International Issues in their top 5 of most popular data domains. It is important to note that there is no way to say whether one category is unsuccessful because the portals’ audience is uninterested in it, or because the countries do not publish enough relevant and valuable data on those topics. A recent study by the European Data Portal for example - the “enabling smart rural: the open data gap”50 - has explored in more detail the availability of rural open data, and the Figure 2.2: The share of unique visitors per month reported to the countries population 0,0% 0,005% 0,010% 0,030%0,025% Bulgaria Portugal Germany Lithuania Italy Poland Sweden Denmark Belgium Romania Netherlands Finland Greece Spain Slovenia Estonia Hungary Austria Ireland Croatia United Kingdom Latvia France Cyprus Luxembourg 48 ‘Unique visitors’ refer to the number of distinct individuals accessing pages of a website during a given period, regardless of how often they visit that website in the given period. ‘Visits’ refer to the number of times a website is visited, independent of the numbers of visitors that access the website. 49 https://ec.europa.eu/eurostat/tgm/table.do?tab=table&init=1&language=en&pcode=tps00001&plugin=1 50 Find this and all of the European Data Portal’s analytical reports at https://www.europeandataportal.eu/nl/what-we-do/factsheets-and-reports.
  • 29. OPEN DATA MATURITY REPORT 2019 29 challenges and opportunities related to it. The lack of popularity of the “Agriculture, Fisheries, Forestry & Foods” category may be a direct consequence of those challenges. 2.2.4 Application Programming Interface (API) When looking at API’s, 26 (93%) of the Member States’ portals offer API’s through which advanced users can access the metadata programmatically, e.g. by writing software that performs searches automatically, to identify new datasets. However, only 16 (57%) of the open data teams also take the effort of monitoring the API’s usage, e.g. by running analytics on the respective log files. It can be expected that this will change soon, as the latest Open Data and PSI Directive promotes the use of API’s significantly, and it is expected that the teams will adapt to develop a better understanding of how their users make use of this opportunity. 2.3 Data provision This indicator analyses the extent to which data publishers contribute to the national open data portals and what actions are taken to foster their contribution. In terms of the share of data publishers that make their data discoverable via the national portal - be it by harvesting of the metadata or direct upload mechanisms - 17 (61%) of EU28 report that all data publishers in the country make use of the national portal to showcase their data. In many countries, data publishers are not obligated to publish their data on the national portal but are encouraged to do so. Public bodies and institutions commonly publish their data on their own portal first. A typical example of this comes from Luxembourg, where the national library Bibliothèque nationale de Luxembourg created their own open data portal51 , but also the corresponding entries via the national open data portal of Luxembourg52 . 2.3.1 Challenges in data provision One of the biggest challenges that EU28 Member States mention regarding data providers contributing to national portals is that it often depends on the technical expertise, the resources, and the interest of the staff of public sector bodies. Not all public sector bodies and institutions prioritise open data publication and even when they are willing to contribute to the national portal, it might be a challenge in terms of technical and financial resources. Especially smaller public bodies and institutions often lack the capacity to invest in open data publication. In the Czech Republic, for example, there are approximately 10.000 public sector data providers, but the national portal only publishes data of 30 of them since many small public bodies and institutions in the Czech Republic lack the capacity to publish data. Another challenge is publishing metadata suitable for harvesting according to European standards. Public sector bodies and institutions do not always publish their metadata in the preferred European DCAT-AP standards. Additionally, national portals that use DCAT-AP occasionally make mistakes that compromise the discoverability of the datasets they offer, e.g. it is common to mismatch the mapping between the standard DCAT-AP categories (energy, health, environment, transport etc.) and the ones they use 1% 1% 3% 4% 9% 9% 11% 12% 14% 16% 20% 0% 5% 10% 15% 20% 25% Science & Technology Justice, Legal System & Public Safety Agriculture, Fisheries, Forestry & Foods Health Education, Culture & Sport Regions & Cities Transport Population & Society Economy & Finance Environment Government & Public Sector Figure 2.3: The most popular data domains 51 https://data.bnl.lu/ 52 https://data.public.lu/en/organizations/bibliotheque-nationale-du-luxembourg/
  • 30. OPEN DATA MATURITY REPORT 2019 30 internally, that may have different names or hierarchy. Therefore, not all data that is published on the individual portals is published on the national portals. 2.3.2 Overcoming challenges in data provision Several steps can be taken to help data publishers contribute to the national data portal. Many countries provide support to data publishers, for example by providing trainings, helping with legal and technical questions, or supporting with the production of DCAT-AP metadata. In addition, countries organise sessions and meetings on advantages, opportunities and benefits of opening up data and contributing to the national data portal. The portal team of Lithuania, for example, organised an educational programme for public employees regarding open data publication and discussed the opening of new datasets with representatives from 64 public institutions in numerous meetings. Another good practice comes from Slovenia, where meetings were organised with individual data publishers to assess the best approach for data publication, either by being harvested by the national open data portal or by uploading data on the portal themselves, and step-by-step support was provided. 2.3.3 Data from unofficial sources When it comes to the possibility of uploading data that does not stem from official sources (data that is not from a public body but might be the result of research projects or contributions by citizens), only 10 (36%) of the EU28 national portals offer this possibility. The explanation for this is rooted in many cases in the mission and scope of the portal – whose main purpose is specified to be the publication of public sector data only. However, in several countries, such as Denmark and Luxembourg, everyone can upload data instead, regardless if this data stems from citizens, private firms, associations, or public bodies and institutions. Interesting approaches to publish both official as well as unofficial data come from Luxembourg and France. Both portals highlight the nature of the source by displaying a stamp symbol to characterise official data providers. The “stamp” shows users that the provider is certified by the national portal as an official data provider. Finland and Bulgaria have a different approach and provide dedicated sections on the portal for unofficial data. The Bulgarian portal provides two different sections, one for public bodies and one for private organisations, while the Finnish national portal provides three different sections: data from societies and trusts, data from individuals, and data from private enterprises and corporations. The Austrian national open data portal provides a dedicated portal for data provided by businesses and NGO’s. 2.3.4 Access to real-time and dynamic data Another aspect assessed under this dimension was the level at which the national open data infrastructure also provides access to real-time and dynamic data. Only 21% of EU28 national data portals still do not make any real-time source discoverable. Missing this opportunity are the national portals from Bulgaria, Croatia, the Czech Republic, Hungary, Portugal, Slovakia, and the UK. Worth mentioning here is that access to real- time data in the UK as in the other Member States takes place rather directly on the portals hosted by the respective data providers. Like for API access in general, the space of real-time and dynamic data is strongly promoted by the latest Open Data and Public Sector Information directive, hence it is expected that soon most national portal infrastructures will adapt accordingly. 2.4 Portal sustainability This indicator analyses the extent to which the national open data teams have set up a strategy to ensure the long-term sustainability of the portal, and the measures in place to ensure that the portal caters to the needs and brings an added value to the main audience. In 2019, 22 (79%) of the EU28 national open data portals have a strategy in place that ensures the portal’s sustainability. This is a slight increase compared to 2018 when 19 (69%) national portals had such a strategy in place. As in previous years, in most cases, the sustainability strategy seems to be limited to the portal being recognised as a necessary and instrumental function of government operations in the broader open data strategy or digital agenda of the country – in the cases in which open data is integrated into this strategy. The budget to maintain and improve the portals is, hence, part of the budget dedicated to the national open
  • 31. OPEN DATA MATURITY REPORT 2019 31 data teams’ operations. Beyond that, specific strategies that set out the measures to be taken to ensure the portals’ sustainability over time do not yet exist in the Member States. 2.4.1 Enhancing visibility In terms of the activities that enhance the visibility of the portal by promoting their available features and data, 25 (89%) national teams conduct such promotional work. Moreover, 20 (71%) national portals have an active social media account to assist with communication and awareness-raising. Another way in which national portals enhance the visibility of their work is the use of source code sharing platforms such as GitLab or GitHub to publish their source code and/or other useful software artefacts and to ask for the community’s feedback on those elements. In 2019, 22 (79%) national teams reported that they used such platforms in their daily work. The Issue Tracker functionality53 of GitHub is recognised for example by the Estonian portal team to be a great tool to collect requests from the portal users. Users can use the Issue Tracker to express their demand for datasets, which is also an opportunity for the open data portal team to learn about the perceived value of different datasets. 2.4.2 Gathering insights into user satisfaction In 2019, 12 (43%) national portal teams have conducted a user satisfaction survey on the national portals. This is a good though not significant number of surveys, representing how the option is not yet fully considered useful by portal teams. Among the countries who run user satisfaction surveys, one of the results for Austria was that the search engine needed to be improved. This result also came out of the Polish survey. Additionally, the Polish survey revealed that users wanted to be able to use data visualisations and data validators on the national portal, features that are available on other portals, such as the European Data Portal itself. The Polish survey also suggested the need for better navigation. One of the results of a Spanish survey was that - among all services that the national portal offers - e.g. news, articles, use cases, documentation, etc. - users are most interested in the data catalogue. The Cypriot national open data portal also conducted a user satisfaction survey in 2018. The findings of the research were integrated into the “Open Data Cyprus” report of 201954 and made available back to the public. The results of the survey - as can be seen in the screenshot below - reveal that users evaluate the national open data portal overall, the website design, and the Government Open Data Initiative as positively or even very positively. Users are less satisfied with the portals API’s, the searchability of the data and the formats of the datasets. 53 https://github.com/okestonia/Estonian-Open-Data-Issue-Tracker/issues 54 https://www.data.gov.cy/sites/default/files/%CE%91%CF%80%CE%BF%CF%84%CE%B5%CE%BB%CE%AD%CF%83%CE%BC%CE%B1%CF%84 CE%B1%20%CE%88%CF%81%CE%B5%CF%85%CE%BD%CE%B1%CF%82%20%CE%99%CE%BA%CE%B1%CE%BD%CE%BF%CF%80%CE%BF%CE%AF CE%B7%CF%83%CE%B7%CF%82%20%CE%A7%CF%81%CE%B7%CF%83%CF%84%CF%8E%CE%BD%202018.pdf Screenshot 4: results from the Cypriot user satisfaction survey (2018)
  • 32. OPEN DATA MATURITY REPORT 2019 32 The Netherlands conducted an extensive study55 into open data re-use and published the results in July 2019. The study analysed who open data re-users are, how they re-use open data, and what their barriers and needs are. The researchers used both qualitative and quantitative methods and used log analysis of the three biggest open data portals in the Netherlands: the statistical portal, the geodata portal and the national open data portal56 . One of the findings is that re-users experience most barriers in re-using open data from local governments due to a lack of standardisation, that re-user wants to be involved in developing open data portals to make them more user-friendly, and that re-users want access to direct and quick feedback and support mechanisms. Another good practice comes from Ireland. The Irish national portal offers to those who download a dataset a survey made of 13 questions, such as what sector the user is from and what the data is being used for. In addition, the user is asked if there are any changes he or she would like to make to the national portal, or if the user has any comments on how the portal can be improved. The answers so far revealed that 50% of the respondents think that the portal is excellent or doesn’t need to be improved. The suggested changes and improvements are used as input for reviewing sessions of the portal. Other sources are also used as input for these reviewing sessions, such as best practices from other countries and suggestions from the portal’s team. Last year, the output from the continuous process of reviewing the portal resulted in a new home page, a “developer’s corner” section, and a newsletter. Additionally, the Irish portal plans to release a new feature that allows users to rate datasets, the publication of a number of open data impact stories, and the creation of an Irish language version. 2.4.3 Reviewing and improving the national portals With regard to the practices used to review and improve the portals, 23 (82%) of 28 EU national portals have a process in place by which portals are reviewed and improved regularly. The frequency by which these processes are run differs per country, as figure 2.4 shows. Most national open data portals (39%) are reviewed quarterly. The rest of the portals are reviewed bi-annually (26%), annually (17%) or even less frequently (17%). A good practice in this regard comes from France. Every six month the national portal team organises a seminar to review the projects developed by the national portal and the possible improvements. Discussions are based on user feedback, the needs expressed by the public and private stakeholders, and log analyses carried out over time. After the seminar, a roadmap is written that specifies the key objectives set to address those needs. 2.4.4 Monitoring performance In terms of features that monitor the portals’ performance, 24 (86%) of EU28 portals offer a dashboard or similar tool to showcase the main key performance indexes related, for example, to the volume and quality of metadata that the portal offers. In some cases, these are elaborated dashboards showcasing 0% 5% 10% 15% 20% 25% 30% 35% 40% 45% 39% 26% 17% 17% quarterly bi-annually annually less frequently 100% Figure 2.4: The frequency of portal reviews 55 https://kennisopenbaarbestuur.nl/media/256297/hergebruikers-van-open-data-in-beeld.pdf 56 Statistical data: https://opendata.cbs.nl/statline/portal.html?_la=nl&_catalog=CBS; geospatial data: https://www.pdok.nl/datasets; national open data portal: https://data.overheid.nl/
  • 33. OPEN DATA MATURITY REPORT 2019 33 results on various levels such as increase in metadata over time, broken links, metadata formats and distribution of licences. A good practice comes from the Irish national data portal, that offers a designated and thorough dashboard to visitors as shown in the screenshots below. On top of the page, users can find visualisations regarding the number of users, the number of publishers, and the total number of datasets versus the total number of open datasets. In addition, the dashboard shows detailed information regarding the number of broken links, top keywords found in metadata, and compliance with technical standards, such as the number of datasets described by compliant DCAT-AP. Screenshot 5: data visualisations on the dashboard of the Irish national open data portal Screenshot 6: metadata and data information on the dashboard of the Irish national open data portal
  • 34. OPEN DATA MATURITY REPORT 2019 34 Going one step further, 16 (57%) of EU28 national portals offer additional features that allow also data publishers to monitor their own activity on the portal. This type of monitoring tools can create a “positive competition” amongst public bodies and nudge the lesser performers to improve the volume and quality of their publication. At the same time, such feature can also help identify data providers that are top performers and enable the creation of channels for knowledge transfer between them and other publishers. In some cases, such features also enable publishers to see the popularity of their own datasets and inform them about the applications that are based on their data. A good practice in this regard comes from Cyprus, where all data publishers can see all the statistics of their data, such as the number datasets they provide per data domain, the number of datasets per format, but more importantly the views and downloads over and changes over time per dataset. 2.5 Overall performance Figure 2.5 shows the EU28 average maturity on each of the 4 indicators of the portal dimension. The overall maturity level of the portal dimension is 67%. The most mature indicator within the portal dimension is deriving insights into portal usage (80%), followed by the features that the portals offer to ensure discoverability and access to datasets and relevant content (69%), the provision of data by a majority of data publishers (61%) and lastly ensuring the portal’s sustainability (59%). When looking at the maturity development over the years, figure 2.6 shows that the portal dimension increased each year between 2015 and 2017, decreased in 2018, and increased again in 2019. In the early years, particularly where starting from scratch, it was relatively easy for Member States to improve their performance by setting up their national open data portals in the first place, in most cases relying on mainstream dedicated software like CKAN or DKAN. Their basic functionalities have been implemented thoroughly in the early years to make data available and accessible to the public. Over time and with the overall open data maturity in Europe increasing and the data re-users demanding for more, portals have to meet higher expectations to serve the needs of their communities. 69% 80% 61% 59% 0% 10% 20% 30% 40% 50% 60% 70% 80% 90% 100% Portal features Portal usage Data provision Portal sustainability Figure 2.5: EU28 averages on open data portal dimension 32% 66% 76% 63% 67% 0% 10% 20% 30% 40% 50% 60% 70% 80% 90% 100% 2015 2016 2017 2018 2019 Figure 2.6: EU28 average open data portal development
  • 35. OPEN DATA MATURITY REPORT 2019 35 0% 10% 20% 30% 40% 50% 60% 70% 80% 90% 100% France Spain Ireland C yprus FinlandSloveniaRom ania Luxem bourg N etherlands Latvia Poland ItalyG erm anyEstonia Austria G reece EU 28 averageBelgium C roatiaD enm ark M alta U nited KingdomBulgariaSw edenPortugalLithuania C zech RepublicH ungarySlovakia Figure 2.7: EU28 open data portal maturity The country ranking of the portal dimension can be observed in figure 2.7. The figure reveals that 16 Member States score above the EU28 average of 67% and 12 Member States score below the EU28 average. The countries with the highest maturity levels on the portal dimension are France (91%), Spain (89%), Ireland and Cyprus (both 86%).
  • 36. OPEN DATA MATURITY REPORT 2019 36 Open data impact Chapter 3
  • 37. OPEN DATA MATURITY REPORT 2019 37 The third assessment dimension ”open data impact” analyses the existing approaches and methodologies developed at country and public body level to monitor and measure the re-use and impact of open data. The re-use of open data can contribute to the growth of the European economy, the development of artificial intelligence, and overcoming political, societal, economic, and environmental challenges. The new Directive on open data and the re-use of public sector information, adopted on 20 June 2019 (Directive (EU) 2019/102457 ), encourages Member States to facilitate the re-use of public sector data with minimal or no legal, technical, and financial restraints and will make available under specific conditions datasets that, potentially, have a high impact on society and economy. The following key elements are analysed as part of the impact dimension: Metric Key elements Strategic awareness Monitoring mechanisms are in place at national and public body level to monitor open data re-use. Methods are in place to measure the impact that can be derived from re-using open data. Political impact Various reuse examples can be provided and the reuse of the open data available in this field is systematically monitored. Social impact Various reuse examples can be provided and the reuse of the open data available in this field is systematically monitored. Environmental impact Various reuse examples can be provided and the reuse of the open data available in this field is systematically monitored. Economic impact Studies that focus on the macro and microeconomic impact of open data are commissioned or conducted by Government. Other studies that focus on the economic impact of open data in a particular sector are available. 3.1 Strategic awareness This indicator emphasises the importance of a structured approach to monitoring and measuring open data re-use and impact. This allows to identify trends, bottlenecks and new opportunities, and enables decision- makers to steer initiatives and boost open data and its re-use and impact. Data published in the open allows anyone to re-use it. Consequently, its audience is a wide variety of groups, such as researchers, journalists, developers, private companies, NGO’s, and citizens. One of the most important groups of re-users is public sector bodies, re-using the data from other public sector bodies. In 2019, 25 (89%) of the EU28 Member States recognised this as a trend. Of these, 20 (71%) made supporting this type of re-use a priority at a national level, a clear increase from only 10 countries (36%) the previous year. Answers provided by the Member States show that the re-use of public sector information enables public bodies to become more effective and efficient, to make more informed decisions, and to improve their services to citizens. In Ireland, for example, city dashboards such as the Cork Dashboard58 are increasingly being used to facilitate citizens, businesses, and the policy-makers themselves to access information about the city in an unprecedented way. The Cork Dashboard allows users to monitor a huge range of public data at a glance, from real-time traffic and weather information to air quality and crime levels. 3.1.1 Monitoring and boosting open data re-use In 2019, 21 (75%) of the EU28 Member States report that they have mechanisms in place to monitor the re- use of data featured on their national open data portals. This is mainly done by using web analytic tools to gain insights into visitors and what data is being accessed, such as the most popular datasets and domains. National open data portals monitor open data re-use also by tracking and showcasing new applications, services, and products that are built with the data they offer. 57 https://eur-lex.europa.eu/legal-content/EN/TXT/?uri=CELEX:32019L1024 58 https://www.corkdashboard.ie Chapter 3: Open data impact
  • 38. OPEN DATA MATURITY REPORT 2019 38 In addition to monitoring and boosting the re-use of data at national level, 22 (79%) Member States mention that the contributing public sector bodies conduct such activities for themselves, too. This is exemplified by public sector bodies increasingly engaging with re-user’s communities, organising open data events such as hackathons, fairs, workshops, and meet-ups, conducting studies into re-use barriers and benefits, and fostering cooperation with open data driven civil society and volunteer groups. The Statistical Office in Slovenia, for example, has been carrying out several activities to encourage the re- use of its statistical data, such as press conferences, engagement on social networks, and presentations of statistical data targeting different kind of interested re-user groups. In Sweden, around 45 organisations were connected to the Hack for Sweden59 to promote citizen-driven innovation and open data, and the Swedish Energy Agency organised an innovation contest on open data and mobility60 . In addition, the national challenge platform61 was launched, where public organisations can post innovation contests and challenges to solve with open data. The aim of the platform is to increase the re-use of open data and public administration documents and to facilitate public actors to highlight current societal challenges that can be solved with open and data-driven innovation. In Spain, the Castilla-León Open Data Competition62 and the Barcelona Open Data Challenge63 were organised last year. Both challenges took place at city level with the aim of promoting open data re-use and to support their community in the city. Another example of a public body initiative last year was Asedie’s annual International Conference on the Re-use of Public Sector Information across Spain64 , which served as a platform to share knowledge and experiences within the open data community and to promote public- private collaboration. 3.1.2 Measuring open data impact Beyond monitoring re-use, 15 of the EU28 (54%) Member States mention having a methodology in place to measure the impact of open data. When analysing their answers, however, it becomes clear that most countries lack a measurement framework, and impact assessment is unsystematic. Through surveys and web log analysis, countries gain insight into the re-use of open data, but it is much more complex to measure the impact that is derived by re-using. Measuring the number of downloads of open meteorological datasets, for example, does not represent how many citizens use predictions from the weather application - that is built with this data - to decide to take the train or the car to avoid bad weather. Open data might have a high impact on people’s daily life, but this impact is hard to quantify. Measurement frameworks can help countries to structure their approach in measuring open data impact in the fields of politics, society, environment, and economy. This year more than in previous years countries have increased their efforts in understanding the impact of open data re-use. Studies have been conducted on national as well as public body level and targeted different topics related to re-use, such as barriers, demands, and needs, as well as different areas or sector, such as studies into the use of geospatial open data. Studies conducted into the re-use and the political, social, environmental, and economic impact of open data are covered in the next sections of this chapter. 3.2 Political Impact “Political impact” refers to the impact of open data on the public sector and citizen engagement. Open data supports the public sector in improving their internal processes and services and to engage with citizens. In this field, open data has a specifically high impact in Cyprus, Finland, France, Germany, Ireland, Italy, Luxembourg, Slovenia, Spain and the United Kingdom, as reported by the countries’ open data teams. In 2019, 25 (89%) of the EU28 Member States confirmed that open data is used in policy-making processes in their country, for example as evidence for problem identification and policy formulation. In addition, 24 (86%) Member States confirm that open data is also used in decision-making processes, for example public 59 https://hackforsweden.se/ 60 https://challengesgov.se/sustainable-mobility-challenge/ 61 https://challengesgov.se/ 62 https://datosabiertos.jcyl.es/web/es/concurso-datos-abiertos/concurso-datos-abiertos.html 63 https://ajuntament.barcelona.cat/digital/en/digital-transformation/city-data-commons/open-data-challenge 64 https://datos.gob.es/es/eventos/ya-puedes-inscribirte-la-10a-conferencia-internacional-sobre-reutilizacion-de-la-informacion
  • 39. OPEN DATA MATURITY REPORT 2019 39 administrations making use of open data as a knowledge basis for their daily operations. This highlights the importance of open data re-use for governmental institutions. The following section specifically looks at the impact that open data has on increasing 1) transparency and accountability, 2) effectiveness (e.g. improving the quality of public service delivery) and 3) efficiency (e.g. reducing costs) in the public sector. Figure 3.1 shows the countries’ perceived impact of open data on transparency and accountability, effectiveness, and efficiency. The figure reveals that 20 (71%) of the EU28 Member States perceive a high impact of open data on transparency and accountability of governments, 15 (54%) a high impact on effectiveness and 12 (43%) a high impact on efficiency. In the following, the report looks at these three fields in more detail. 3.2.1 Transparency and accountability Publishing public sector information in an open format increases government transparency and enables citizens to hold their representatives accountable. In 2019, 20 (71%) of the EU28 Member States indicate that open data has a high impact on government transparency and accountability, while 5 Member States (Belgium, Bulgaria, Estonia, Lithuania, and Romania) indicate the impact as medium, and only Hungary as low65 . Two popular topics regarding increasing transparency and accountability through open data are providing insights into government expenditure (1) and providing insights into the behaviour of politicians and political parties and into elections (2). Insight into government expenditure A large number of websites and applications based on open data has been developed to enable citizens to understand how public money is spent. An example comes from Croatia, where the Association of Croatian Counties released the “Open Budget”66 project to raise the level of transparency of county budgets. The aim of the project is to support all counties visualise their budgets in a unified, consistent manner. The application enables citizen to monitor and compare local and regional budgets and spending and thereby increases their transparency. Another example is the Austrian website offenerhaushalt.at67 . The website presents all financial data of the country’s municipalities in an easy and understandable way. The website is created for both citizens as well as for civil servants to provide a clear overview of municipal finances. Also, the Finnish website tutkihankintoja.fi68 allows citizens, companies, and interest groups to explore public spending. It provides information on state spending on goods, supplies and services down to the purchase order level. The website improves transparency in the use of public funds and provides information on the market for those companies that aim to be suppliers to the government. Insight into the behaviour of politicians and political parties, and into elections Another popular area regarding transparency and accountability is the use of open data to gain insights into 65 Two Member States stated that they do not know. 66 https://www.internationalbudget.org/wp-content/uploads/croatia-open-budget-survey-2017-summary.pdf 67 https://www.offenerhaushalt.at/projektinfo 68 https://tutkihankintoja.fi/tietoa-palvelusta Figure 3.1: The political impact of open data Low Medium High 4% 11% 4% 18% 21% 36% 71% 54% 43% 0% 10% 20% 30% 40% 50% 60% 70% 80% 90% 100% Transparency Effectiveness Efficiency
  • 40. OPEN DATA MATURITY REPORT 2019 40 the behaviour of political parties and politicians, and into elections. Examples range from websites that allow fact-checking of political statements to applications visualising voting behaviour and election results. Politica.io69 is an innovative political analysis tool and interactive application developed by a Cyprus-based start-up. The application re-uses open data from the Lands Surveys Department and the Elections Service to provide graphic visualisation of election results. Also, a trend increase is observed in Cyprus to re-use datasets from data.gov.cy for data journalism, to analyse behaviour of political parties and politicians to increase transparency and accountability. Another example of how open data can inform citizen on political decisions is the application “Voordat Het Nieuws Was”70 (in English: “before it was news”) from the Netherlands. The application makes the public aware of political decisions by showing what has been done before something is decided at political level and becomes news. This is done by a browser plugin that shows the reader of a news article the policy documents that underlie the news, such as amendments, motions, and letters. 3.2.2 Increasing effectiveness Open data has the potential to increase government effectiveness, specifically in delivering public services. 15 (54%) of the Member States indicate that open data has a high impact on government effectiveness, while 6 (21%) indicate a medium impact and 3 (11%, Czech Republic, Portugal, and Poland) indicate the impact as low71 . There are multiple ways in which open data can improve the quality of public service delivery and make governments more effective. The EU28 Member States have improved their public service delivery by making it easier for citizens to interact with the government. In addition, public administrations make use of open data as evidence for their daily operations, problem identification and policy formulation, and therefore are able to provide more effective services. An example of open data re-use to increase government effectiveness comes from Spain. The application Almería Mantiene72 provided by the Almería City Council enables users to send and track notices and requests affecting the maintenance, and repair of public roads. This is a two-way real-time communication channel: for users, it is a way to communicate issues that must be addressed by the council, such as potholes, road damage, etc. For the council, on the other hand, it is a channel to notify users of possible issues on their routes and request additional information from users if necessary. Another example of open data re-use that supports informed decision-making and increases government effectiveness comes from France: it is the Secmar Map73 from the National System of Observation of the Safety of the Nautical Activities. Secmar Map is an interactive map showing accidents at sea. Through analysing this data, the government can better predict where accidents will happen and improve the location of lifeguards on the territory. In addition, the information from the map is used for awareness campaigns and advice on safety at sea. Estonia also re-uses open data to increase government effectiveness. The Agricultural Registers and Information Board (ARIB) map74 uses data from the European Space Agency’s Sentinel satellite system for remote sensing of the mowing and grazing of grassland to improve the administration of their geographical area-based financial support to farmers. The aim is to detect violations of legal requirements with minimal effort, increase the effectiveness of the supports, and save on administration costs. 3.2.3 Increasing efficiency Opening up data can also lead to more government efficiency, for example by reducing operational costs. Twelve (43%) of the Member States indicate that open data has a high impact on government efficiency, while 10 (36%) indicate that there is a medium impact and only Portugal indicates that there is a low impact75 . Publishing data in an open format gives re-users such as local administrations or citizens the opportunity to obtain data without having to explicitly request it. Data holders do not have to repeatedly go through the process of dealing with data requests, thus reducing operational costs. An example of this comes from Belgium, where the Federal Ministry of Finances published parts of the 69 https://www.politica.io 70 https://www.voordathetnieuwswas.nl/ 71 Four Member States stated that they do not know. 72 https://datos.gob.es/en/aplicaciones/almeria-mantiene 73 https://carte.snosan.fr/ 74 https://kls.pria.ee/kaart/ 75 Five Member States were not able to assess the impact.
  • 41. OPEN DATA MATURITY REPORT 2019 41 Cadastre data in the open. This enabled local administrations to re-use it without making requests and thereby saving time and money on both sides: the Ministry as well as the local administrations. Another example from Belgium is Lex.be76 : a legal search platform that provides easy access to documents from the judiciary and makes them searchable. The platform aims to help courts in developing a sound legal basis for their sentences and increase efficiency by lowering costs. It also increases transparency and accountability. 3.2.4 Monitoring the political impact of open data In 2019, 15 (54%) Member States have conducted some type of activity to monitor and showcase the political impact of open data in their country. Examples are presented below. Denmark published a study77 that shows examples of how government agencies can systematically open data. It provides examples and best practices, mainly from the Ministry of Energy, Supply and Climate, and the Ministry of Employment. The study linked the availability of data to its political impact and advocated the merits of open data for political transparency and efficiency. In Italy, results on the specific open data actions are included in the third action plan for Open Government 2016-2018 monitor political commitment in the international context of the OGP. Italy is in the process of drafting the 4th National Action Plan for the Open Government 2019-2021. In addition, the monitoring actions expected in the context of the indicators foreseen by the Partnership Agreement on Open Data objectives allows “political” feedback on the impact of open data on projects funded through the Partnership Agreement. In Spain, activities to monitor the impact of data and, specifically the political impact, include for example an online questionnaire78 where different public administration entities are asked to identify case studies in which data re-use has a political impact. Furthermore, the country reports news and success stories showing impact in the political field. Content is researched and created to showcase the impact, e.g. in use cases, news and an event calendar79 . 3.3 Social impact In this chapter, the impact of open data on society is examined, as well as the extent of using open data to address societal challenges. Figure 3.2 shows how the EU28 countries perceive the impact of open data through 2018 and 2019. The figure reveals that the percentage of countries perceiving a high social impact increased from 39% in 2018 to 46% in 2019. For medium impact, this slightly decreased from 39% to 32% and the for low impact the percentage decreased from 14% in 2018 to 2 countries (7%) in 2019 - Slovakia and the Czech Republic. Overall, the answers provided by the Member States show that the perceived social impact of open data increased compared to 2018, with, in 2019, more Member States indicating a high impact and fewer Member States indicating a low impact. 76 https://lex.be 77 https://www.ft.dk/~/media/sites/statsrevisorerne/dokumenter/2018/beretning-12-2018-om-aabne-data.ashx?la=da 78 https://datos.gob.es/es/evaluacion-del-ecosistema-de-los-datos-publicos-reutilizables-en-espana 79 https://datos.gob.es/en Figure 3.2: The social impact of open data 0% 10% 20% 30% 40% 50% 70% 60% 2018 2019 Low Medium High 100%
  • 42. OPEN DATA MATURITY REPORT 2019 42 A wide variety of open data initiatives and applications enable citizens to discover insights into different topics that concern society such as food waste, gender equality, noise pollution, etc. In 22 (79%) Member States there are civil society initiatives that are open data-driven and aim to tackle one or more problems in the social field. That is an increase of 8 countries (+36%) compared to last year, which clearly indicates a significant development. Within the broad field of social aspects and challenges, this year’s report specifically looks at housing in urban areas and the inclusion of marginalised groups. The results of the impact on these two aspects, as the Member States rate it, are presented in figure 3.3. The figure reveals that 46% of the Member States perceive a high impact of open data on housing in urban areas and 43% perceives a high impact of open data on the inclusion of marginalised groups in society. Whereas only 2 Member States (7%) perceive a low impact on housing in urban areas, 18% of the Member States rate the impact on inclusion of marginalised groups as low. 3.3.1 Housing in urban areas Aspects of housing - from availability to quality, to price - are becoming more important. Information about a neighbourhood and its facilities and characteristics helps citizens and companies make informed decisions about housing, living and doing business. When looking at the assessment of social impact enabled by open data to raise awareness concerning housing in the city, 13 (46%) countries rate the impact as high. Especially Finland, France, Germany, Ireland, Italy, Latvia, Lithuania, Netherlands, Poland, Slovenia, Spain and Estonia provided inspiring examples. 7 (25%) countries assessed the impact as medium, and 2 (7%) (the Czech Republic and Romania) described it as low80 . By cross-referencing these results with country and city population density or housing prices, there is no significant correlation observed. E.g., countries that have the most populated cities (France, Belgium, Greece, Spain) or highest housing prices (France, Austria, Sweden, Netherlands, the Czech Republic, Finland, Italy, Germany, Spain)81 do not necessarily show a higher maturity in using open data to address housing issues. In Estonia, open data is used to provides citizens insights about their neighbourhoods, such as crime rates82 , school locations83 , real estate prices84 , and children’s playgrounds and dog parks85 . The Spanish Urban Data Analytics86 is dedicated to segmented and geolocated real estate knowledge. The website combines the real estate sector with Big Data and Business Intelligence and provides a service with 190 indicators focused on real estate published both via APIs and interactively to offer instant knowledge 80 Six countries were not able to assess the impact. 81 https://www.statista.com/statistics/722905/average-residential-square-meter-prices-in-eu-28-per-country/ 82 https://www2.politsei.ee/et/organisatsioon/analuus-ja-statistika/avaandmed.dot 83 https://info.haridus.ee/Asutused/Kool 84 http://www.maaamet.ee/kinnisvara/htraru/ 85 https://www.manguvaljakud.tallinn.ee 86 http://www.urbandataanalytics.com/ 87 https://kurgyvenu.lt/ Figure 3.3: Addressing societal challenges with open data 100% 7% 18% 25% 21% 46% 43% 0% 10% 20% 30% 40% 50% 60% 70% 80% 90% Housing in urban areas Including marginalised groups Low Medium High
  • 43. OPEN DATA MATURITY REPORT 2019 43 of the property market and property portfolio to organisations. The Lithuanian website kurgyvenu.lt87 is a project that provides the most important information about real estate and quality of life in different place in the country. Open data, collected and structured from various source institutions, conveniently presents the market value of a particular real estate, heating costs, air pollution, noise and crime rates, distances to important locations, demographic situation and even the ranking of the nearest schools. 3.3.2 Inclusion of marginalised groups in society Inclusion of marginalised groups describes the process in which individuals or entire communities whose participation in politics and society was originally challenged, can now enjoy rights, opportunities and resources to better partake in social, cultural, and political life. Marginalised groups can be, for example, elderly people, people with disabilities, or minorities. When looking at the assessment of social impact enabled by open data to improve inclusion of marginalised communities, 12 (43%) countries, that is 4 more than last year and 10 more than in 2016, rate the impact as high. The countries are Cyprus, France, Greece, Ireland, Italy, Spain and this year also Croatia, Denmark, Finland, Netherlands, Poland and Sweden. Slovenia and the UK decreased their rating from high to medium impact on the inclusion of marginalised groups in 2019. In addition, 5 (18%) countries assessed it as medium, and another 5 (Austria, Belgium, the Czech Republic, Estonia, Germany) described it as low. A wide variety of websites, applications, and services based on open data have been developed with the aim to promote the inclusion of marginalised groups into society. Examples provided by EU28 Member States are mainly applications that make it easier for these groups to live their daily lives and participate in society in ways that are better integrated. Most applications focus on immigrants or on people with disabilities. Other applications focus, for example, on fighting poverty and on rural areas and population. The Canary Island Women Open Data Project88 , for example, aims to promote the use of open data to raise awareness on and facilitate gender equality, fostering work-life-free time balance and equal distribution of public and private responsibilities between men and women. In Cyprus, the Migrant Information Service (MIC) has developed an application called MiHub App89 based on open data to support the access to services and resources that meet migrants’ needs and to put emphasis on building new skills towards harmonically adjustment to the Cypriot cultural and social environment. The National Authority for Citizenship of Romania has upgraded its services for immigrants requiring citizenship, making use of and publicly available data90 . As part of the Open Government Partnership 2018-2020, the Ministry of Labour and Social Justice is updating and increasing the accessibility and usability of a platform dedicated to mapping existing social services. The commitment will also focus on the development of social inclusion policies and re-use of data. Inclusion of people with disabilities The C.I.D.-S.I.S.TE.M. project in Marsala, Italy, is an innovative organisational structure of the institutions in the planning and management of services to the disabled population, that uses also open data for the promotion of their rights and social well-being. The initiative is characterised by a multidisciplinary and innovative approach and a strong technological and participatory connotation, associated with a deep knowledge of the aspects of disability in the area. The city of Utrecht in the Netherlands provides citizens with a map91 that shows parking places reserved to disabled persons. Besides the location of parking spots in the city, users can also find additional information, such as the exact length and width of the parking spots and the type of surface. Another example comes from Germany, where the Federal Ministry of Labour and Social Affairs launched a website92 that provides information for persons with disabilities and their relatives. Included is data about institutions providing support for children and teenagers with disabilities. 88 https://www.opendatamujerescanarias.es/ 89 https://mihub.eu/en/, datasets at: https://www.data.gov.cy/dataset/%CE%BA%CE%B1%CF%84%CE%AC%CE%BB%CE%BF%CE%B3%CE%BF%CF %82-%CE%BA%CE%AD%CE%BD%CF%84%CF%81%CF%89%CE%BD-%CE%B5%CE%BE%CF%85%CF%80%CE%B7%CF%81%CE%AD%CF%84%CE %B7%CF%83%CE%B7%CF%82-%CE%BC%CE%B5%CF%84%CE%B1%CE%BD%CE%B1%CF%83%CF%84%CF%8E%CE%BD 90 https://portalgis.servicii-sociale.gov.ro/arcgis/apps/MapJournal/index.html?appid=80a803fabb834a67971c1053a65c18bd, http://ogp.gov.ro/ 91 https://www.utrecht.nl/wonen-en-leven/verkeer/fiets/fiets-stallen/p-route/ 92 https://www.einfach-teilhaben.de/DE/AS/Themen/KunstKultur/KinoundTheater/kinoundtheater_node.html
  • 44. OPEN DATA MATURITY REPORT 2019 44 In Slovenia, the State Electoral Commission presented statistical data on the attendance of the electoral polling stations by disabled persons. On the basis of that data - and a constitutional court decision-based in it - the legislation has been changed so that all of the polling stations must physically enable easy access to the disabled. Rural areas and population In 2019, the Spanish Ministry of Development and Environment of the Junta de Castilla y León published the “Open Data Guide: Publication and reuse of Open Data as an Open Government initiative in the Administration”93 . The guide is part of the Digital Rural Community, a collaborative project between Public Administrations of Portugal and Spain, with the objective to improve the technological innovation of rural institutions, promoting cooperation and competitiveness. The guide contains a dedicated chapter on examples of innovative solutions and success stories based on open data. Another example from Spain is the “Basque atlas by small areas”: a web portal created to monitor geographic inequality in health, social-economic, and environmental indicators in the Basque Country, taking the gender perspective into account. The maps displayed help to better understand the geographical distribution of health indicators and their decisive factors in the population. This fosters decision making and preparing policies designed to bring inequality to an end. 3.3.3 Monitoring the social impact of open data In 2019, 10 (36%) Member States (in 2018 it was 39%) report to have conducted activities to monitor the social impact of open data. Below are interesting examples of such conducted research. The Aportia Academy in Belgium published a white paper on Smart cities called “Livre blanc Smart cities: les données, la pierre angulaire des villes et communes du futur” (English: “Data, the cornerstone of cities and towns of the future”)94 in March 2019. The report researches and promotes the usefulness of open data for cities and municipalities to support their policies and improve citizens’ comfort. In addition, the report provides advice to local governments to start working concretely with their data. Open data DK and KL (KL is an interest organisation for the 98 municipal councils in Denmark), has launched a project aiming to shed light on the value of open data in the Danish municipalities. The project is especially interested in emphasising the social impact of open data. This is done by highlighting the impact and value of several use cases. The purpose is to illuminate concrete examples of open data re-use that are also relevant to smaller municipalities. Furthermore, the Irish Open Data Impact Series95 promotes awareness, adoption, and re-use of open data and aims to monitor impact in the country with a particular focus on social and economic aspects. The 4th series, for example, focused on open data supporting art, heritage and culture. 3.4 Environmental impact This indicator focuses on the activities that monitor and address environmental issues through open data, examples of how open data is used to raise awareness on environmental challenges, and the existence of open data-driven civil society initiatives that aim to address environmental challenges. Currently, there is a large amount of open environmental data that is available across Europe, including geospatial data, meteorological data, air and water quality data, weather data, and noise levels. These datasets have the potential to enable users to discover new insights into the environment and to increase citizens’ participation and awareness of different environmental issues. Figure 3.4 shows how the EU28 countries perceive the environmental impact of open data through 2018 and 2019. The figure shows that the percentage of countries perceiving a high impact increased from 39% in 2018 to 57% in 2019. The percentage of countries perceiving a medium environmental impact did not 93 https://datos.gob.es/sites/default/files/doc/file/open_data_publicacion_y_reutilizacion_de_datos_abiertos_como_iniciativa_de_gobierno_ abierto_en_la_administracion_compressed.pdf 94 https://www.agoria.be/fr/Livre-blanc-Smart-cities-les-donnees-la-pierre-angulaire-des-villes-et-commues-du-futur 95 https://data.gov.ie/it/blog/open-data-impact-series-4-open-data-supporting-arts-culture-and-heritage
  • 45. OPEN DATA MATURITY REPORT 2019 45 change and the percentage of countries perceiving a low impact decreased from 21% in 2018 to 14% in 2019. In conclusion, the answers provided by the EU28 Member States show that the perceived environmental impact increased, with in 2019 more Member States stating a high impact and less stating a low impact. 3.4.1 Open data to address environmental issues This year’s open data maturity report specifically focusses on the use of open data to address the following different environmental issues: (1) water and/or air quality, (2) waste management, (3) environmentally friendly transport offers, and (4) noise levels in cities. The percentage of EU28 Member States stating that there are services and applications available in the country that address these environmental issues can be seen in figure 3.5. It can be observed that 25 (89%) of the EU28 Member States report that they have a service or application that raises awareness on water and/or air quality. For example, the Municipality of Sofia in Bulgaria developed a platform96 that informs users on the quality of the air. The platform shows the level and daily average of a specific type of air pollution (PM10) from measuring stations across the city. In addition, the platform provides a two-day forecast for PM10 levels calculated from open data from the Department of Weather Forecasts. Access to this type of information, citizens can be informed of what the air quality will be and adjust their plans accordingly to avoid pollution. Regarding waste management and reduction, 24 (86%) of the EU28 Member States provide services that are based on open data. An example is Differenziata Teramo97 , an Italian website and application that uses open data to inform and develop awareness among users on aspects such as the correct separation of types of 96 https://air.sofia.bg/ 97 https://www.differenziatateramo.it/ Figure 3.4: The environmental impact of open data 0% 10% 20% 30% 40% 50% 60% 70% 2018 2019 Low Medium High 100% Figure 3.5: Addressing environmental challenges with open data 89% 86% 82% 75% 0% 10% 20% 30% 40% 50% 60% 70% 80% 90% 100% Water/Air auality Waste management Environmentally friendly transport Noise level
  • 46. OPEN DATA MATURITY REPORT 2019 46 urban waste for collection, and the timetable for their collection. The application also updates users on waste management news in Italy and guides users who have doubts on how to recycle different materials. Regarding environmentally friendly transport systems, 23 (82%) of the 28 EU Member States report that there exist applications, services or platforms based on open data that aim to raise awareness on the different sustainable mobility offers in their country. An example is Elmo98 from Estonia, a platform that informs users on the locations of charging stations for electric cars. Regarding noise levels, 21 (75%) of the EU28 countries report that there are applications using open data to raise awareness on noise levels and noise protection. For instance, the Austrian application and website Lärminfo.at99 , that alerts and updates users about noise levels caused by, among others, cars, trains, and airplanes. In addition, it provides news articles that are related to noise, such as new calculation methods for noise levels or technology for silent car tires. 3.4 2 Monitoring the environmental impact of open data Monitoring the impact of open data on the environment can be done through, for example, organising and participating in events, conducting studies to understand the impact of open data in the environmental field or sub-dimensions of this field, or identifying news and success stories that show the impact of open data re-use in the environmental field. In 2019, only about half (46%) of the EU28 Member States conducted such activities, whilst 5 (18%) do not conduct such activities and 10 (36%) are unsure. A good practice in this regard comes from Ireland. On 29 April 2019, the Irish open data portal team launched their third Open Data Impact Series100 with the theme ‘How open data can help the environment’. The event focused on how data is being used for different services, what challenges users are facing and what other environmental data could potentially be made available in the open. Ireland currently offers 2705 open environmental datasets (23 October 2019) - including meteorological, data, air, water and energy consumption data - that can be harnessed to discover new insights or used to create new services and applications. The Open Data Impact Series offered the Irish open data team an invaluable opportunity to observe how open environmental data is being used, how impact is being created by re-use, and brought together publishers and re-users to discuss the use of data in addressing environmental challenges. 3.5 Economic impact Measuring the economic impact of open data is particularly important as a basis to argue for additional resources or efforts, as quantifiable benefits can be weighed against the investment required to produce and publish it. Economic impact can be measured using different approaches and indicators. The most direct economic impact of open data is the costs saved by getting the data free of charge (or at a minimum cost). If the data was not available in the open, re-users would need to buy it or produce it themselves. In other cases, if the demanded data was not available, not even for sale, and the re-users were not able to produce it themselves, making the data open is the event that enabled the creation of a new or improved service or product or provided new insight. In these cases, the economic benefit is more complex to measure and intertwined with other factors. Indirect benefits can also be identified for example through jobs created, resources saved, productivity gained, etc. that have to be taken into account. This further confirms that the benefits due to open data availability are broader than just the money saved. However, measuring this benefit is, due to its complexity, challenging. Despite that, more than half of the Member States (57%) reported activities in the past year to monitor the economic impact of open data. Quantifying and showcasing the economic impact of open data is a key element for countries to rallying support for open data and to trigger publication and re-use. 98 http://elmo.ee/charging-network/ 99 https://www.laerminfo.at/ 100 https://data.gov.ie/blog/open-data-impact-series-3-how-open-data-can-help-the-environment
  • 47. OPEN DATA MATURITY REPORT 2019 47 In 2019, further progress in this regard can be observed, compared to previous years. Several studies have been conducted that assess the economic value of open data, at the forefront from Denmark, France, Germany, Ireland, Luxembourg, Poland, Spain, and the United Kingdom. Whereas in 2015 only 5 countries had conducted studies, in 2017 this number has increased to 9. In 2019- but also in 2018 - 13 countries conducted or commissioned studies to capture the economic value of open data on the macro level, 11 of which also investigated the micro-level. In addition, 11 countries conducted research on the economic benefits of open data specific to public administrations. Most studies are either conducted or commissioned by the government or by civil society and/or private organisations. 3.5.1 Studies to assess the impact of open data impact at a macro-economic level Macro-economic studies look at the overall market of open data re-use. In Spain, the 7th edition of the Infomediary Sector report101 , prepared by Asedie was published. The study analyses the economic and social value of companies that re-use data from the public and/or private sector to create added value products. It investigates the barriers businesses face when reusing this information and the benefits of opening these data may bring to the public sector. Asedie detected that the number of companies re- using open data in Spain has increased by 3.7% compared to 2018, that the Infomediary Sector turnover in Spain has risen by 5.4%, and the number of employees hired by these companies has increased by 4.6%. Moreover, the report also measures how long the companies have been operating, the sectors where they are most present and the type of information they re-used. Inaddition,theMinistryoftheEconomyandBusiness,throughtheSpanishObservatoryforTelecommunications and the Information Society (ONTSI) of Red.es, is conducting a study on the infomediary sector. It aims to discover the characteristics of this market and the businesses that belong to it, to understand the value they generate and, especially, the barriers they face. ESADE analyses the type of data used by businesses and their impact on these businesses in their report “Adoption and impact of Big Data and Advanced Analytics in Spain”.102 A public satisfaction survey study from Luxembourg, “Impacts of Open Data in Luxembourg and the Greater Region - 2019”103 investigates the economic impact of open data. The results show that the users of the open data portal consider that the available data leads to an economic impact due to new business opportunities in the ICT sector and the data science market, as well as the possibility to create new jobs or start-ups. The macro-economic study is based on the methods already used by other European countries to assess the potential scope of the public data market. These methods are based on ex-ante indicators that provide information on four major types of metrics defined by the report Creating Value Through Open Data104 . The German Federal Ministry for Economic Affairs and Energy is currently also undertaking a study concerning the economic impact of open government data. The study looks at the economic impact in Germany and finance models of municipalities. The Czech Republic, as well, is in the process of creating their Annual Report on the State of Publication of open data in the Czech Republic, which gathers and analyses information about the economic impact of open data. 3.5.2 Microeconomic and sector-specific studies Many studies that explore the economic benefit of open data focus on a micro level, investigating businesses or specific sectors, such as transport, forestry, or tourism. Others do focus on specific data, such as geospatial data. This kind of studies shows an increasing trend, as they allow for more granular results. Austria conducted, for example, a survey for companies in Vienna to monitor the economic impact of open data105 . The Finnish study “Benefits from Open Data” focused specifically on barriers of supply and demand of open data in private organizations106 . The Swedish Forest Agency calculated, according to an analysis performed by the European Association of Remote Sensing Companies (EARSC), the total direct economic 101 https://datos.gob.es/en/noticia/available-7th-edition-infomediary-sector-report 102 http://itemsweb.esade.edu/wi/Prensa/InformeESADE_AdopcionImpactoBigDataAdvancedAnalytics.pdf 103 https://data.public.lu/en/datasets/study-impacts-of-open-data-in-luxembourg-and-the-greater-region-2019/ 104 https://www.europeandataportal.eu/sites/default/files/edp_creating_value_through_open_data_0.pdf 105 https://www.data.gv.at/2018/01/19/umfrage-open-government-wien/ 106 https://lutpub.lut.fi/handle/10024/158560
  • 48. OPEN DATA MATURITY REPORT 2019 48 benefit of satellite Imagery for Sweden’s forest management on between €16.1m and €21.6m per annum.107 The Danish Geo Forum108 will analyse how, in the future, data and distribution solutions to create value for users in public administration and in companies. Poland carried out a study on the impact of open data on the economy as part of the Main Office of Geodesy and Cartography participation in the international OpenELS project109 , supported by geodesy and cartography offices from Poland, Norway, the Netherlands, Germany, Spain, Great Britain, Finland and Sweden, and the EuroGeographics association. The results show a steady increase in the interest and use of open geospatial data by a growing number of institutional and business users (up to 10-15%), contributing to the growth of the digital market’s growth rate on a European scale. The main areas in which the greatest impact of open data availability have been identified are 1) the improvement of existing products and services; 2) the development of new services and products based on geospatial data, and 3) the reduction of time and cost of data acquisition (up to 90%).110 Poland also conducted a study of the conditions and directions of spatial development of Gdańsk111 and on open data as a source of innovation-drive of enterprises - published by the Technical University of Lodz112 . According to a study commissioned by the Ministry of Digitisation, the Polish economy is expected to gain above-average benefits thanks to increased productivity and new business models, making investing in a data-based economy most advantageous.113 Latvia’s Jelgaca City investigated technologies that capture and analyse data on population movements, flood risks, and other infrastructure issues in the city as part of its Smart City initiative.114 Spain, as well, focused on the Smart City concept and explored the implications for tourism management in smart cities and tourist destinations due to the use of open data.115 3.5.3 Economic impact of open data for the public sector Some studies focus specifically on the economic impact of open data for the public sector. The Regional Government of Castile-León in Spain, for example, published a study116 on publication and re-use of open data as an Open Government initiative. A study from Tallinn University investigated the capability of Linked Open Statistical Data (LOSD) and Open Government Data (OGD) to drive the creation of new and innovative public services to provide higher levels of public value: “The Role of Linked Open Statistical Data in Public Service Co-Creation”117 . Latvia focused on Interinstitutional Data Exchange118 in their e-index survey about the publication of data as well as its use in the performance of their duties. The e-index119 is an assessment of the maturity of the digital environment in the work and service delivery of public administrations and municipalities. The e-index provides a fact-based assessment of how actively and fruitfully institutions and municipalities are using modern information and communication technologies and practices to improve the quality and accessibility of services provided to citizens and businesses, and the effectiveness and environmental friendliness of organisations. 107 http://earsc.org/news/what-is-the-economic-value-of-satellite-imagery-the-case-of-forest-management-in-sweden 108 https://geoforum.dk/ 109 https://openels.eu/ 110 https://openels.eu/wp-content/uploads/2019/04/Open_ELS_socio_economic_benefits_final_report_Website.pdf 111 https://www.gdansk.pl/download/2018-06/109370.pdf 112 https://www.polsl.pl/Wydzialy/ROZ/ZN/Documents/z120/Goli%C5%84ska-Pieszy%C5%84ska,%20Batorowicz.pdf 113 https://www.gov.pl/web/cyfryzacja/gospodarka-oparta-o-dane-przemysl- 114 https://www.tvnet.lv/4550022/gudra-un-drosa-pilseta-jelgava 115 https://investigacionesturisticas.ua.es/index 116 https://datos.gob.es/es/documentacion/open-data-publicacion-y-reutilizacion-de-datos-abiertos-como-iniciativa-de-gobierno 117 https://dl.acm.org/citation.cfm?id=3209415.3209446 118 http://www.varam.gov.lv/lat/darbibas_veidi/e_parv/vis/?doc=12652 119 https://mana.latvija.lv/e-indekss/
  • 49. OPEN DATA MATURITY REPORT 2019 49 France made their efforts concrete and sound by defining into law (in article 14 of the Digital Republic Bill) a series of “reference datasets”, that are mandated to be in open data because of their great economic impacts120 . A few of these include sensitive information such as personal data, but the country made the decision that the value of the reference datasets is more important to the country than the risk of disclosure and created any necessary legal basis to release them in any case, and without anonymisation121 . 3.6 Overall performance Figure 3.6 shows the EU28 average maturity on each of the 5 indicators of the impact dimension. The overall maturity level of the impact dimension is 57%, which is the lowest maturity level of the four open data dimensions. The most mature indicator within the impact dimension is the environmental impact of open data (69%), followed closely by the political impact of open data (67%), which shows that Member States are aware of the many services and applications that re-use open data to address environmental challenges and increasingly use it to increase government efficiency, effectiveness, and to provide transparency. Creating impact on society, however, seem to be more challenging for Member States. With an average score of 46% the social impact indicator is lagging behind. Measuring the economic impact of open data seem to be most difficult for Member States (28%). Although some countries conducted economic impact studies, most EU28 Member States did not recently address the economic value that can be derived from open data. The average score of 65% on strategic awareness shows that although EU28 countries are already making efforts to boost the re-use of open data, a strategic approach to monitor and measure the impact derived by the use of open data is needed. The open data maturity assessment broadened its scope in 2018 by including the impact and quality dimensions. Figure 3.7 shows that the impact dimension increased from 50% in 2018 to 57% in 2019. This is mainly caused by the steep increase of the environmental re-use and impact of open data, that increased from 48% in 2018 to 69% in 2019. 65% 67% 46% 69% 28% 0% 10% 20% 30% 40% 50% 60% 70% 80% 90% 100% Awareness Political Social Environmental Economic Figure 3.6: EU28 averages on open data impact dimension 120 https://www.data.gouv.fr/fr/reference 121 https://www.legifrance.gouv.fr/affichTexte.do;jsessionid=2358AE5E4D21392EF7E4F0C83C9E9934.tplgfr41s_1?cidTexte=JORFTEXT000037797147 &dateTexte= Figure 3.7: EU28 average development on open data impact 50% 57% 0 40% 50% 60% 70% 100% 2018 2019
  • 50. OPEN DATA MATURITY REPORT 2019 50 The country ranking of the impact dimension can be observed in the figure. Figure 3.8 reveals that 14 Member States score above the EU28 average of 57% and 14 Member States score below the EU28 average. The countries with the highest maturity levels on the impact dimension are Spain (100%), France and Ireland (both 92%), and Denmark and Italy (both 72%). Figure 3.8: EU28 open data impact maturity 0% 10% 20% 30% 40% 50% 60% 70% 80% 90% 100% Spain France IrelandD enm ark Italy Poland U nited Kingdom FinlandG erm any LatviaSlovenia C yprus N etherlandsSw eden EU 28 average G reece Estonia C roatia AustriaBelgium C zech RepublicBulgaria Luxem bourgLithuaniaRom aniaH ungary M altaPortugalSlovakia
  • 51. OPEN DATA MATURITY REPORT 2019 51 Open data quality Chapter 4
  • 52. OPEN DATA MATURITY REPORT 2019 52 The fourth assessment dimension “open data quality” focuses on the measures adopted by portal managers to ensure the systematic harvesting of metadata from sources across the country, as well as the currency of the available metadata and where possible the actual data, the monitoring of the compliance with the DCAT-AP metadata standard as well as the quality of deployment of the published data. The fourth dimension provides impulses for portal managers and policy-makers to enable open data publication that is good quality all round: using open data formats, machine-readable, high-quality and suitable to a linked data approach (the use of URI’s etc.). Metric Key elements Currency A systematic approach in place to ensure that metadata is up to date. Harvesters are programmed to ensure that changes at the source are reflected with the least amount of delay on the national portal. Monitoring and measures Mechanisms are in place to monitor the quality of the metadata and the compliance level in terms of correct licensing information. Measures are in place to assist publishers in publishing in high-quality metadata and choosing the right type of licence for their data. DCAT-AP Compliance Compliance to the DCAT-AP standard in terms of mandatory, recommended and optional classes is monitored. Guidelines and learning materials help publishers in ensuring compliance with DCAT-AP. Deployment and linked data The 5-star open data model or similar are used to assess the quality of data deployment. Percentage of published open data that complies with the requirements of the 5-stars Open Data model. 4.1 Currency This indicator analyses to what extent EU28 countries have a systematic approach in place to ensure that metadata, and where applicable the actual data, is up to date. The indicator looks specifically at automatic harvesting processes to ensure that changes at the source of the data are reflected with the least amount of delay on the national portal. Up-to-date metadata on the national portals are critical for users to obtain the correct information about the data that it describes. A vast majority of the EU28 Member States (75%) have a pre-defined approached in place to ensure that the metadata is kept up to date. How often metadata needs to be updated, however, depends on the characteristics of the data that it describes. Some datasets do not require frequent updates, as they do not change frequently, while other datasets change more often and therefore require more frequent updates to the metadata, too. For example, a gazetteer of city streets changes when new buildings and roads are built, or street names are changed, whereas the data on current weather conditions may be updated in real-time. In both cases, the way the metadata describes the date and time the data was last updates is instrumental to the re-user to understand the value of the dataset itself. The mechanisms in place to keep metadata up to date differ by country. EU28 countries often mention that the currency of the metadata is a responsibility of the data providers or the harvested portals itself. The Irish national open data portal harvests metadata automatically on a nightly basis from 14 data sources, capturing any new, updated, or deleted datasets. The Finnish national open data portal sends out annual reminders to all data publishers to check the currency of the descriptions, datasets, and the organisations that provide them. In addition, the Finnish portal sends out a weekly reminder to data publishers to update any broken links and sends out multiple reminders on datasets that have a set expiration date to update the data and check the descriptions before the data expires. In Italy, a generalised approach has been defined that provides for weekly harvesting of each federated catalogue, except for specific requests for more frequent updates. Chapter 4: Open data quality
  • 53. OPEN DATA MATURITY REPORT 2019 53 The ability to keep the metadata up to date depends, among others, on the extent to which metadata is obtained from its source automatically. Obtaining metadata from its source automatically enables automatic updates of the metadata when the data that it describes is updated. Figure 4.1 shows the percentage of the metadata that is obtained from its source automatically. Looking at the right side of the figure, it becomes clear that only in 3 (11%) countries - Belgium, Denmark, and Sweden, all metadata is uploaded in an automated way to the national portal. Additionally, 7 (25%) countries obtain between 90% and 99% of their metadata from the source automatically. Looking at the left side of the figure, however, it becomes clear that 11 (39%) countries obtain less than 30% of their metadata from its source automatically. This means that most of the metadata in these countries is edited manually to some degree, which becomes more time consuming as the amount and complexity of data grows. In addition, manual editing of metadata easily allows for errors and mistakes. Beyond the metadata, the currency of data too is critical to applications. Regarding the speed of updates to datasets available on the national data portals, figure 4.2 shows what percentage of the datasets is updated within 1 day from the update of its primary source. Looking at the right side of the figure, it becomes clear that 9 (32%) countries update more than 90% of the data within 1 day. These countries are Austria, the Czech Republic, Denmark, Estonia, Malta, the Netherlands, Portugal, Spain, and Sweden. Another 6 (21%) countries update 51% to 90% of their data within one day, 5 countries (18%) between 10% to 50% of their data, and 8 (29%) countries update less than 10% of their data within 1 day its primary source is updated. 4.2 Monitoring and measures This indicator analyses the extent to which mechanisms are in place to assess and boost the quality of metadata and the compliance level in terms of correct licensing information. In addition, the indicator looks Figure 4.1: The percentage of datasets obtained from its source automatically 39% 7% 11% 7% 25% 11% 0% 5% 10% 15% 20% 25% 30% 35% 40% 45% <30% 30-49% 50-69% 70-89% 90-99% 100% 100% %ofcountries Figure 4.2: The time it takes to update data from the moment its source is updated 29% 18% 21% 32% 0% 5% 10% 15% 20% 25% 30% 35% 40% 45% <10% 10-50% 51-90% >90% 100% %ofcountries
  • 54. OPEN DATA MATURITY REPORT 2019 54 at support, guidelines, and tools available to assist data publishers in publishing high-quality metadata and in choosing the right type of licence for their data. 4.2.1 Ensuring high-quality metadata Most EU28 countries (23 countries, 82%) monitor the quality of the metadata available on their national open data portal. Metadata often undergoes a quality control before being published on the national open data portals. The process of quality control differs per country. In Cyprus, there is a system in place that requires data publishers to provide a number of mandatory metadata fields when publishing on the national open data portal. No dataset can be published on the national portal unless the mandatory metadata fields are completed. The submitted datasets and the related metadata undergo a quality review for format compliance and metadata completeness. In France, a similar process is in place. Metadata is published after fulfilling a quality checklist, with questions such as: is the dataset described? Are keywords added? Is the format open? Is a channel for feedback to the data provide made available? Is the dataset up to date? Is the dataset available? In the Netherlands, data publishers also must fill in mandatory fields before data is published. In addition, a link checker shows if the link to the data is valid. In Lithuania, the quality of metadata is currently checked manually, but a tool to implement automatic quality control is planned for the renewed portal. Some countries, such as Belgium and Greece, have implemented the DCAT-AP validator122 into the national data portal that automatically checks metadata description of datasets for integrity and consistency against DCAT-AP specifications. In Spain, great efforts have been taken to implement a module that regularly checks if distribution URLs fail. A report is generated with all URLs with an error and the type of error. Just over half of the EU28 portals (54%) publish information on the quality of the metadata available on the portal itself. An example in this regard comes from the Czech Republic, that provides a designated area123 on the portal to show metadata quality. Portal visitors can, for example, find information on the number of datasets that do not specify the terms of use by the provider and the number of datasets with an invalid media file type. Another example comes from the Finnish portal, that shows the number of broken links124 , provides the URLs and reports when the error last occurred and was fixed. Also, the previously mentioned statistics page125 of the Irish national open data portal provides information on data quality, specifically on compliance with the standards as set out in the technical framework. The statistics page is updated monthly. In addition to tools to check metadata quality against standards, such as with DCAT-AP validators, 22 (79%) of the EU28 countries conduct regular activities to incentivise and assist data providers in the publication of high-quality metadata. Such activities include e-learning modules and materials, webinars, guidelines and meetings, trainings, and workshops with the main data providers. Especially in smaller countries, such as Luxembourg, it is possible to establish a direct dialogue with each of the data providers, keeping contact through regular mail exchanges, meetings, and dedicated courses. 4.2.2 Providing licensing information In order for data to be open, it should be accessible and licensed for anyone to access, use and share. An open data licence provides users with certainty that the data can be used and shared for a wide range of purposes. Without a licence, data may be publicly available, but users will not have clarity around what permission they have to access, use and share it under copyright or database laws. Member States are aware of the importance of providing licensing information, as can be seen by the high percentages of data available on the national portal that is accompanied by relevant licences. 122 E.g. see https://joinup.ec.europa.eu/solution/dcat-ap-validator or the European Data Portal’s own at https://www.europeandataportal.eu/shacl/ 123 https://opendata.gov.cz/statistika:datova-kvalita 124 https://data.ouka.fi/data/en_GB/report/broken-links/konsernihallinto 125 https://data.gov.ie/stats
  • 55. OPEN DATA MATURITY REPORT 2019 55 Although in an ideal world all data available on the open data portals should be accompanied by licensing information, in practice 15 (54%) Member States achieved 100% datasets available with licenses. Additionally, 8 (29%) Member States provide licensing information to 90-99% of their available data. Only in Sweden, Lithuania, and Malta this percentage is lower: in Sweden between 50% and 74% and in Lithuania and Malta less than 25% of the data is accompanied by licensing information. Hungary responded to the questionnaire around these topics by choosing “not applicable” because data providers give them metadata that does not include licensing information. Poland also chose the “not applicable” answer because they report that most data on the portal is available under a general statement about the data being provided without any conditions or under minimum conditions. Additionally, and in line with the Member States acknowledging the importance of providing licensing information, all EU28 publish guidelines and have tools in place to assist publishers in choosing an appropriate licence. The Dutch national open data portal, for example, obligates data publishers to choose a licence for the datasets they want to make available via the portal and provides a dedicated licence support area126 in which several licences are explained, e.g. to clarify if a licence is open or open with restrictions. When the data publisher is uncertain about the type of licence, they can temporarily choose to licence the data as “closed” or “undefined”. The data is then still discoverable on the portal, but not available as open data. In some other countries, such as Spain, guidance on open data licencing is part of general methodological guidelines for opening up data. This also applies to Slovakia, that additionally provides a video127 on how to publish open data. In Ireland, following a public consultation, the Creative Commons Attribution 4.0 International (CC BY 4.0) licence was chosen as the open licence for the country. The standards for the publication of data on the national portal are set out in the “Technical Framework”128 . This framework ensures that the publication of datasets on the portal is done in a consistent, persistent, and truly open way. Guidance on open data licencing is provided in the “Guide for Publishers”129 : a guide for existing and potential open data publishers who wish to publish open data on the portal. From time to time, Ireland gives specific assistance to some public bodies who experience issues with open data licensing. For example, they assisted Met Eireann130 (the Irish Meteorological Service) with legal advice for the drafting of a custom open data licence that was necessary to access some specific needs of their situation. Met Eireann now has published some 2000 datasets on the national portal. Similar to Ireland, a vast majority of the EU28 Member States (21 countries, 75%) recommend data publishers to use Creative Commons (CC) licences. Only France, Germany, Romania, Spain, and the UK recommend data publishers to use the country’s own developed open licence. In their response to the questionnaire, France mentions concerns that the CC licencing does not enable the re-use to be commercialised. That is the reason why Etalab - the French task force for open data - has adopted the Open Database Licence instead. In Germany, the licence “Datenlizenz Deutschland”131 was developed, that allows for completely free use and continued use of open data. The licence obliges the user to give credits and name the author or originator. In Romania, the custom Open Government Licence Romania132 (OGL-RO) was developed, similar to the Open Government Licence of the UK. The OGL-RO licence has slightly more restrictive conditions than the CC. Romania currently recommends the OGL-RO licence, but also provides information on CC licencing. As the CC4.0 licence is currently being translated to Romanian, they consider switching to the recommending CC in the near future. 126 https://data.overheid.nl/ondersteuning/data-publiceren/licentie-keuze 127 https://www.youtube.com/watch?v=trzJit8YQpQ&feature=youtu.be 128 https://data.gov.ie/pages/opendatatechnicalframework#open-data-licence 129 https://data.gov.ie/pages/guideforpublishers 130 https://www.met.ie/ 131 https://www.govdata.de/lizenzen 132 http://data.gov.ro/base/images/logoinst/OGL-ROU-1.0.pdf
  • 56. OPEN DATA MATURITY REPORT 2019 56 Spain is currently working to incorporate the use of CC licences for re-using public sector information into Spanish regulations and establish an equivalence between national conditions of use and CC licences. The current Spanish conditions of use are similar to the CC-BY licence. Member States are generally making efforts to publish data against a narrower and less complex set of licences on their portal, in the attempt to simplify the effort required of re-users to assess what their rights are in respect to the data. The distribution of difference licences can be found in figure 4.3. In 2019, 20 (71%) of the EU28 portals use between 1 and 5 different licences across all the data they distribute. In 2018, only 12 portals used between 1 and 5 different licences, which shows a trend towards narrowing down the set of different licences. In 2019, 4 Member States (14%) – Italy, the Netherlands, Portugal, and Slovakia – use between 6 and 10 different licences, Greece and Belgium (7%) between 11 and 15, Germany (4%) between 16 and 20, and the Czech Republic (4%) more than 20. 4.3 DCAT-AP compliance This indicator examines to what extent countries comply with the DCAT-AP standard for describing public sector datasets and what efforts are taken to assist data publishers in ensuring compliance with DCAT-AP. Compliance to DCAT-AP improves interoperability and fosters the discoverability and re-use of open data across European portals. The indicator assesses the national portals’ compliance in providing all classes specified as mandatory by the standard, but also values the availability of recommended and optional classes. EU28 countries are increasingly aware of the importance and benefits of DCAT-AP and take efforts to boost its correct use. Figure 4.4 shows the percentage of metadata on national data portals in Europe that is DCAT-AP compliant and that provide recommended and optional classes, too. When looking at the mandatory classes, the figure reveals that in 22 (79%) countries more than 90% of the metadata is compliant to mandatory classes (agent, catalogue, dataset, literal, resource). In 14 (50%) countries, more than 90% of the metadata meets the standards of recommended classes (category, category scheme, distribution, license document), and in 11 (39%) countries, more than 90% of the metadata meets the standards of optional classes (catalogue record, checksum, document, frequency). The trend is clear: countries are focusing on compliance by Figure 4.3: The number of different licences on the portal 71% 14% 7% 4% 4% 1-5 6-10 11-15 16-20 >20 Figure 4.4: The percentage of datasets compliant to DCAT-AP classes 7% 14% 18% 4% 4% 25% 7% 14% 7% 4% 18% 11% 79% 50% 39% 0% 10% 20% 30% 40% 50% 60% 70% 80% 90% 100% Mandatory Recommended Optional no priority <10% 10-50% 51-90% >90%
  • 57. OPEN DATA MATURITY REPORT 2019 57 providing metadata for the mandatory classes but investing limited effort in recommended and optional classes. It is worth mentioning that Poland and Bulgaria are currently in the process of implementing DCAT- AP standards into the national open data portal. In some countries, such as in Sweden, there is an automatic process in place that only allows the publication of metadata that is compliant to mandatory classes. Half of the EU28 Member States (14 countries) have extended the European DCAT-AP standard to better address their own legacy and needs. The national extension for Spain, for example, is described in the “Technical Interoperability Standard of Reuse of information resources”133 . This regulation determines, among others, the minimum mandatory metadata for open data in Spain. One of the main reasons why Spain has its own DCAT profile is that it was developed and officially approved in 2013, prior to the creation of European DCAT-AP. Primary differences are based on the taxonomy for identifying public entities and the taxonomy for geographical coverage, which are specific to Spain. An application guide and e-learning134 for the Spanish extension is available in order to help public administrations becoming DCAT-AP compliant. In the Netherlands, all dataset descriptions are validated against the DCAT-AP-NL model. Mandatory classes need to be filled before the data can be published on the portal. The DCAT-AP-NL makes more classes mandatory than the European DCAT-AP model. Therefore, violations of the European DCAT-AP are not allowed and do not occur. The Netherlands created the DCAT-AP-NL to keep the exchange of metadata within the Netherlands simple. The Netherlands also created a DCAT-NL-DONL for the national open data portal, which is even more restrictive than DCAT-AP-NL and which also determines which value lists to use to fill classes. Only values from pre-published value lists are allowed. 4.4 Deployment quality and linked data This indicator examines to what extent countries use a model such as the 5-Star Open Data135 to assess the quality of data. The 5-Star Open Data is a deployment quality model that enables countries to rate data against a 5 “stars” scale. To gain the maximum of 5 stars, data must (1) be available online under an open licence, (2) be in the form of structured data, (3) be machine-readable, (4) use URIs as its identifiers, (5) include links to other data sources. 4.4.1 The 5-Star Open Data model Figure 4.6 shows the percentage of data available in the Member States according to the requirements of the 5-Star Open Data model. The figure reveals that most data (above 50%) on the national data portals is available according to the requirements of the first three stars, but that data according to four and five stars is not common in Europe yet. Figure 4.6: The percentage of data provided according to the 5-Star Open Data model 7% 14% 18% 18% 75% 4% 4% 4% 4% 96% 21% 50% 64% 7% 68% 32% 14% 0% 10% 20% 30% 40% 50% 60% 70% 80% 90% 100% 1 star 2 stars 3 stars 4 stars 5 stars <10% 10-49% 50-90% >90% %ofcountries 133 https://datos.gob.es/es/documentacion/norma-tecnica-de-interoperabilidad-de-reutilizacion-de-recursos-de-informacion 134 https://datos.gob.es/es/documentacion/dcat-ap-y-la-norma-tecnica-de-interoperabilidad-de-reutilizacion-de-recursos-de 135 For more information: http://5stardata.info/en/ or https://joinup.ec.europa.eu/sites/default/files/inline-files/W3C04.pdf.
  • 58. OPEN DATA MATURITY REPORT 2019 58 1 star: open license The first star is attributed if data is available under an open licence. The star examines if data is accompanied with open licensing information that permits people to use the data in any way they want, including transforming, combining and sharing the data with others, even commercially. The results of the questionnaire show that in a majority of the EU28 countries - 19 countries (68%) - more than 90% of the published data is made available under an open licence. In order to be truly classified as open data, the data should be accompanied with an open licence. In some countries, however, the national open data portal does not only make available open data, but also “closed” data. From this perspective, not acquiring a first star does not necessarily mean that these countries are performing less well, but rather shows that the country has a more holistic approach to data sharing that does not only focus on providing open data on the portal. 2 stars: structured data In order to gain a second star, data does not only need to be available under an open licence, but also in a structured format. Whereas 19 countries have more than 90% of the data published under an open licence, only 9 (32%) countries also have more than 90% data published in a structured format. Gaining a second star for more than 90% of the data is achieved by: Belgium, the Czech Republic, Estonia, Finland, the Netherlands, Ireland, Italy, Portugal, and Romania. Besides these 9 countries, 14 (50%) other countries achieved a second star for 50% to 90% of the data. 3 stars: machine-readable format The third star is awarded when data is available under an open licence, in a structured format, and is machine-readable, i.e. in a format that can be automatically read and processed by computers. Data must be structured in order to be machine-readable. Therefore, acquiring a third star for more than 90% of the data is only possible for those countries who acquired a second star for more than 90% of the data. A total of 4 (14%) countries achieved this: the Czech Republic, Ireland, Italy, and the Netherlands. Besides these 4 countries, 18 (64%) other countries achieved a third star for 50% to 90% of their data. 4 stars: URIs as its identifiers The use of Uniform Resource Identifiers (URIs) in the public sector open data is not common in Europe yet. The percentage of datasets that is made available under an open licence, in a machine-readable format, and with consistent use of Uniform Resource Identifiers is less than 10% in 21 (75%) countries. In 4 (18%) countries (Finland, Italy, Germany and the Netherlands) the percentage ranges between 10% and 19%. Germany and the Netherlands made the best achievements in gaining 4 stars, in the Netherlands between 50% and 59% and in Germany 60% and 70% of the data is made available under an open licence, in a machine-readable format, and with the use of URI’s. 5 stars: links to other data sources Interlinking data to other data so that a person or a machine can explore the web of data is also not common in Europe yet. The percentage of linked open data is below 10% in 27 countries (96%). Only in Latvia, 10% to 19% of the data has 5 stars. 4.4.2 Promoting deployment quality A vast majority of the EU28 countries (21 countries, 75%) conduct activities to familiarise data providers with deployment quality models such as the 5-star Open Data and the linked data concept. In Croatia, for example, the Information Commissioner organises open data education for civil servants and provides a dedicated module on the 5-star Open Data quality model. Similarly to Croatia, Cyprus educates open data Liaison Officers via the “Structured Training Program” that contains training on the 5-star model. Sweden offered education to 45 organisations in 2019, where they also discussed the 5-star Open Data model and briefly discussed the concept of linked data. Slovenian civil servants and data publishers can learn about the 5-star Open Data at the courses at the Administrative Academy, where a whole chapter/segment is dedicated to 5-star Open Data. The Finnish open data portal team receives increasing feedback from data publishers and open data re-users that the 5-Star Open Data model is cumbersome and difficult and may become a barrier for publication. A lot of typical open data re-users (e.g. regular citizens and reporters in media) use open data in proprietary formats, such as Microsoft Excel. The Finnish national open data portal also considers it
  • 59. OPEN DATA MATURITY REPORT 2019 59 problematic that the 5-star Open Data model does not include a semantic dimension, that would instead be considered instrumental to foster interoperability of data at national (Finnish) and European levels. 4.5 Overall performance Figure 4.7 shows the EU28 average maturity on each of the 4 indicators of the quality dimension. The overall maturity level of the quality dimension is 65%. The most mature indicator within the quality dimension is the monitoring and measures in place to boost the quality of metadata and the compliance level in terms of correct licensing information (76%), followed by the level of DCAT-AP compliance of metadata (67%) and its currency (65%). The lowest scoring indicator within the quality dimension is the extent to which data provided on the portals is available under an open licence, in machine-readable format, with the use of URI’s, and linked to other relevant data (53%). The open data maturity assessment broadened its scope in 2018 by including the impact and quality dimensions. Figure 4.8 shows that the quality dimension slightly increased compared to 2019; from 62% to 65%. This is mainly caused by including in 2019 the new indicator that analyses the monitoring and measures in place to boost the quality of metadata publication. The results show that, although EU28 countries are taking efforts in boosting the quality of metadata, the actual deployment quality is insufficient, when evaluated by the 5-star Open Data model. 65% 76% 67% 53% 0% 10% 20% 30% 40% 50% 60% 70% 80% 90% 100% Currency Monitoring and measures DCAT-AP Compliance Deployment quality Figure 4.7: EU28 averages on quality dimension Figure 4.8: EU28 average open data quality development 62% 65% 0% 50% 60% 70% 80% 100% 2018 2019
  • 60. OPEN DATA MATURITY REPORT 2019 60 Figure 4.9: EU28 open data quality maturity 0% 10% 20% 30% 40% 50% 60% 70% 80% 90% 100% Ireland C zech Republic C yprus Spain Finland N etherlands FranceD enm ark Latvia Belgium Italy PolandSlovenia C roatia Estonia EU 28 averagePortugal AustriaG erm anyRom ania Luxem bourg G reeceSw edenBulgariaSlovakia M alta U nited KingdomLithuaniaH ungary The country ranking of the portal dimension can be observed in figure 4.9. The figure reveals that 15 Member States score above the EU28 average of 65% and 13 Member States score below the EU28 average. The countries with the highest maturity levels on the portal dimension are Ireland (92%), the Czech Republic (84%), and Cyprus (82%). Worth mentioning here is the high maturity level of the Czech Republic, that achieved a 100% score on DCAT-AP compliance.
  • 61. OPEN DATA MATURITY REPORT 2019 61 Open data maturity in the EFTA countries Chapter 5
  • 62. OPEN DATA MATURITY REPORT 2019 62 Similar to previous years, the open data landscaping exercise also assesses the open data maturity in the four European Free Trade Association (EFTA) countries - Iceland, Liechtenstein, Norway, and Switzerland. The maturity assessment follows the same four dimensions that are used to assess the open data maturity in the EU28 Member States: open data policy, open data portal, open data quality, and open data impact. 5.1 Open data policy Regarding a policy framework to foster open data in the EFTA countries, three of the four EFTA countries report that they have open data policies in place. In Iceland, there are currently no policies or strategies in place to boost open data publication and re-use in the country. Similarly to the EU28 countries, a trend is observed in the EFTA countries that open data legislation is embedded in different national digital agendas and programmes and tied into national legislation to ensure government transparency and promote an open government. In Norway, open data policy is embedded in the Digital Agenda that was published in 2016136 , which has a strong focus on data sharing. The importance of data sharing is identified as a central component of ensuring openness and transparency, a more efficient and effective government, and value creation in the private sector. The Digital Agenda prescribes that there should be specific open data strategies for five different areas: government spending, geospatial data, transport, research, and culture. Currently, four of these open data strategies137 are in place and only a dedicated open data strategy for government spending is not yet developed. In addition to the Digital Agenda, Norway published its Digital Strategy for the Public Sector138 in June 2019. The strategy defines the common goals and focuses areas for digitalisation activities towards 2025. One of the goals is that the public sector shall exploit the potential of sharing and the use of data to create user-friendly services, and to promote value creation in the business sector. To reach this goal, data shall be shared and re-used in the public sector to a greater degree. This greater degree is necessary because, despite Norway’s efforts to boost open data publication and re-use, at the turn of the year 2018/2019, it is estimated that only around 10% of relevant datasets have been made available. Norway also published its Fourth Norwegian Action Plan Open Government Partnership (OGP)139 in 2019. This plan, developed by the Ministry of Local Government and Modernisation in cooperation with several other ministries, has three main pillars: integrity and openness in public administration (1), open data and re- use of public data (2), and public procurement, information on the beneficial owners, and anticorruption (3). Regarding the area of open data and re-use, the country is now considering whether there are new areas in which one should establish dedicated strategies and action plans in relation to making data publicly available and fostering data sharing (besides the previously mentioned dedicated strategies for government spending, geodata, transport, research, and culture). The above-outlined policies, strategies, and action plans, together with the Digitisation Circular130 that specifies that each public body has to create, maintain, and share a data inventory, are setting the stage for data sharing and open data. Liechtenstein also published their Digital Agenda141 in 2019, which unifies the various objectives and measures of the ministries to push forward digital transformation. The Digital Agenda highlights the importance of open geospatial data. The objective is to ensure the sustainable availability of high-quality geospatial data and to facilitate its re-use. Therefore, Liechtenstein aims to provide free access to geospatial data in a machine-readable format. Apart from geospatial data, the country does not have policies or strategies in 136 https://www.regjeringen.no/no/dokumenter/meld.-st.-27-20152016/id2483795/ 137 Culture: https://www.regjeringen.no/no/dokumenter/kulturdepartementets-strategi-for-apne-data/id2576038/?q=strategi%20kultur; geospatial data https://www.geonorge.no/Geodataarbeid/geografisk-infrastruktur/Norge-digitalt/nasjonalgeodatastrategi/; research https://www.forskningsradet.no/servlet/Satellite?cid=1254023795613&pagename=VedleggPointer&target=_blank; transport https://www.regjeringen.no/no/dokumenter/strategi-for-tilgjengeliggjoring-av-offentlige-data--samferdselssektoren/id2598229/ 138 https://www.regjeringen.no/en/dokumenter/one-digital-public-sector/id2653874/sec1 139 https://www.regjeringen.no/en/dokumenter/norges-handlingsplan-4---open-government-partnership-ogp/id2638814/ 140 https://www.regjeringen.no/no/dokumenter/digitaliseringsrundskrivet/id2623277/ 141 https://www.regierung.li/media/attachments/ikr-DigitaleAgendaFL-A4-Einzelseiten-200dpi.pdf?t=636924885232021692 Chapter 5: Open data maturity in the EFTA countries
  • 63. OPEN DATA MATURITY REPORT 2019 63 place to foster the publication and re-use of other types of open data. In addition to the Digital Agenda, Liechtenstein also published the E-Government Strategy142 in 2019, that includes a vision, mission, and principles for implementation of digital services. In Switzerland, norms relating to open data are part of the national legislation to ensure government transparency. In November 2018, the Open Government Strategy 2019-2023143 was approved by the Federal Council. The strategy is the successor to the Open Government Strategy 2014-2018. The new strategy is legally binding for the federal administration but also a basis for continuous collaboration with other governments at regional and local level. One of the main objectives of the new strategy is the publication of open data by default. The strategy prescribes that data produced or commissioned by the public sector shall - subject to conflicting legal provisions - be regarded as Open Government Data and, as far as technically and legally possible, be published in machine-readable form as of 2020. This data will be freely accessible and gradually include other existing datasets. In Iceland, opening Public Sector Information is recommended by the government. According to the answers provided by the country representatives, there is no policy, strategy, action plan, or governance model in place to boost open data publication and re-use in the country. When looking at the type of governance that is practised in the four EFTA countries, a similar pattern can be observed as within the EU28 countries, where a majority (75%) of the countries opted for a hybrid governance model. This type of model allows for both central coordination and guidance as well as developing and pursuing initiatives at local level. In the EFTA, both Norway and Switzerland also opted for a hybrid governance model, while Iceland and Liechtenstein report to not have a governance model in place. Liechtenstein mentions that cities and villages are largely administratively independent and that there is no mechanism in place to monitor open data initiatives. The Norwegian system is characterised by strong local municipalities and regions with significant decentralisation. This is also reflected in their data governance model in which open data initiatives are mainly coordinated from the national level. At the same time, bottom-up initiatives are encouraged. Between 1% and 25% of the local or regional authorities in Norway conduct their own open data initiatives. Due to the fact that Norway is a relatively small country with a relatively small open data community, the national government can easily keep track of open data initiatives at regional and local levels. In Norway, national coordination and guidance includes, among others, a common “Framework for Information Management”144 , a guideline on the release of public sector information145 , a data-sharing manual146 , national open data events such as the hackathon for Norway147 , an annual meeting with data re-users and publishers, and regular meetings to support data publishers in opening up their data. Norway has also established a competence centre to support public organisations in sharing their data. In 2019 this support was limited to legal challenges but will be broadened to other areas from 2020. The main agencies and municipalities are involved in weekly meetings to discuss API-catalogue and concept-catalogue. There are a number of structures in place to ensure the involvement of different stakeholders in data sharing initiatives at national level. Examples include that the “Sharing of Data” project, that has a steering committee and reference groups with a broad representation from stakeholders, who are deeply involved in progress and plans for data sharing in the country. In Switzerland, the federal government has a leading role in open data but does not impose standards or practices. The only requirement is that all public data publishers must publish their data on the national open data portal. The federal administration organises round tables and other meetings to bring together different stakeholders, such as cantons (regions), cities, state-owned enterprises, and re-users. In addition, 142 https://www.regierung.li/media/attachments/ikr-eGovernmentStrategie-A4-D.PDF?t=636911057929590704 143 https://www.bfs.admin.ch/bfs/en/home/services/ogd/strategy.html 144 https://www.difi.no/fagomrader-og-tjenester/digitalisering-og-samordning/nasjonal-arkitektur/informasjonsforvaltning/rammeverk- informasjonsforvaltning 145 https://data.norge.no/retningslinjer-ved-tilgjengeliggj%C3%B8ring-av-offentlige-data 146 https://doc.difi.no/data/veileder-apne-data/ 147 http://hack4.no/
  • 64. OPEN DATA MATURITY REPORT 2019 64 a handbook148 is provided to assist data providers in their open data publication process and the newly constituted Open Government Data Secretary provides support and advice as well. The Open Government Data Strategy of Switzerland foresees the appointment of a data responsible at public level, that is responsible for open data publication in its own federal office or department. Of all four EFTA countries, Switzerland has the most open data initiatives at local or regional level. Between 26% and 50% of the local and regional government conduct open data initiatives, with the dedicated Open Data Strategy for the Geneva Administration149 as a good example in this regard. 5.2 Open data portal Three of the four EFTA countries have a national open data portal to make open data and Public Sector Information discoverable. Liechtenstein is the only EU28+ country that does not have national open data portal. Some public sector data can be found on dedicated open data portals, such as statistical data150 and geospatial data151 . Given that Liechtenstein does not yet have a national open data portal, the following section will only discuss the maturity of the national open data portals of Iceland, Norway and Switzerland. In terms of portal features, all three national open data portals offer the possibility for users to download datasets. The portals provide functions such as multiple field search, filter options, and searching by file format or data domain format. None of the EFTA countries, however, provide a SPARQL search function. Contrary to Iceland, the portals of Norway and Switzerland offer a designated area to showcase open data use cases, allow users to submit their own use case, and reference the datasets that the showcased use cases are based on. Although the portals of Norway and Switzerland offer a mechanism for users to provide general feedback, only the portal of Norway enables users to provide feedback at dataset level. In addition, only the Norwegian portal offers the possibility for users to receive notifications when new datasets are available, a preview function for tabular data, and shows what data exists but cannot be made available as open data. The screenshot below shows how users can see that a dataset is available on the Norwegian portal but is not available as open data. Contrary to many EU28 Member States, the EFTA portals do not provide portal visitors yet the opportunity to request datasets, to rate datasets, to preview geospatial data, or to discuss their issues and opinions in a discussion forum. In terms of portal usage, all three EFTA portals track the number of visitors on their national data portals. According to the answers provided, the Norwegian portal receives the most unique visitors per month, with an average of 9500. Switzerland follows with 7000 and Iceland with an average of 1700 unique visitors152 per month. However, when these numbers are weighted against the countries’ population153 , it becomes clear that the portal of Iceland is the one that attracts the largest share of the country’s population (0.005%), followed by the portal of Norway (0.002%), and lastly the portal of Switzerland (0.001%). If these figures were 148 https://handbook.opendata.swiss/de/pages/index 149 https://www.ge.ch/document/strategie-matiere-libre-acces-aux-donnees-publiques-administration-genevoise-open-data/telecharger 150 https://www.llv.li/inhalt/11480/amtsstellen/amt-fur-statistik 151 https://geodaten.llv.li/ 152 Unique visitors refer to the number of distinct individuals accessing pages on the website during a given period, regardless of how often they visit that website. Visits refer to the number of times a website is visited, no matter how many visitors make up those visits. 153 https://ec.europa.eu/eurostat/tgm/table.do?tab=table&init=1&language=en&pcode=tps00001&plugin=1 Screenshot 7: Datasets with limited publicity on the Norwegian national open data portal
  • 65. OPEN DATA MATURITY REPORT 2019 65 compared together with the rest of the EU28 Member States, then Iceland would be ranked as number 5, Norway as number 10, and Switzerland as number 15. Even though all three EFTA portals use log analytics to gain insights into usage, only Norway uses these insights for improvement. In addition, all three portals monitor what the most and least consulted pages are. Only Norway and Switzerland, however, monitor the most popular datasets. The most popular dataset in Norway is “Offentlige tilfluksrom” (public shelters) and the most popular dataset in Switzerland is “Messwerte Lufttemperatur 2m” (measurements air temperature). Regarding API access, both Norway and Switzerland mention that the metadata describing the datasets is accessible via a publicly available API, but only Norway runs log analytics on API usage. Norway does not know, however, what percentage of outgoing portal traffic is generated by API usage only. In terms of data provision, Norway is the only EFTA country that responded to the questionnaire by claiming that all public sector data providers contribute data to the portal. To assist data providers in their data publication process, general guidance and documentation are provided and advice is given on demand. In Switzerland, not all public sector data providers contribute to the national open data portal, and the ones that do not contribute to the national portal yet are identified for further action. Whereas 36% of the EU28 Member States offer the possibility to upload data on the national data portal that does not stem from official sources, none of the EFTA portals provide non-official data. In addition, whereas 89% of the EU28 Member States make real-time sources discoverable, in the EFTA countries only Norway and Switzerland do so. In Norway, 16% to 20% of data featured is real-time, while in Switzerland that is 1% to 5%. In terms of portal sustainability, none of the three data portals of the EFTA countries have sustainability strategies in place. This is not aligned with the EU28 Member States, where 79% of the open data portals do. In addition, and contrary to the EU28 Member States, none154 of the EFTA countries conduct activities to enhance the visibility of the portal by promoting the available features and data, although the national portals of Norway and Switzerland are active on social media. In addition, none of the EFTA portals have conducted a user satisfaction survey over the past year, while 43% of the Member States did. Norway and Switzerland both mention that they review their portals bi-annually. In Norway, data publishers regularly meet to improve the open data portal, based on the feedback of re-users and new technologies. Whereas 86% of the EU28 portals have a dashboard or similar section on their portal on which they showcase the main indexes concerning the volume and quality of their metadata, only Norway and Iceland provide such a dashboard. 5.3 Open data impact With regard to the activities to monitor and measure both the re-use and impact of open data, some efforts are visible in the four EFTA countries, but, compared to the EU28 Member States, these efforts remain relatively low. In line with this, but contrary to the EU28 Member States, open data re-use by public bodies is only defined as a priority at national level in Norway. Although in Liechtenstein open data re-use does not have such a priority, the country mentions seeing a trend in the public bodies towards the re-use of the data published by other public bodies. This trend is not observed in Iceland and Switzerland, according to the answers provided. Norway is the only EFTA country that states to conduct activities to support public bodies in monitoring the re-use of their own open data. This is done by the national open data portal by providing statistics on the use of specific datasets to public bodies. Beyond monitoring, Norway does not have any practices, frameworks, or methods in place to measure the impact of open data. Some public bodies in Norway have taken efforts to increase the re-use and impact of open data. An example in this regard is the Norwegian Public Roads Administration, that provides a database of information on national and county roads, municipal roads, private roads, and forest roads, and encourages the public to re-use the data. To gain insights into the re-use of the data, the authority monitors statistics such as API usage and the number of downloads. In addition, the blog vegdata.no shows the public how solutions have been developed based on this data. Examples of open data re-use provided by Norway show that it is re-used to address challenges in the political, societal, and environmental field. Norway states that the re-use of open data has a high impact on 154 Norway did not provide an answer to this question.
  • 66. OPEN DATA MATURITY REPORT 2019 66 increasing government efficiency. An example in this regard is that the re-use of data from the OpenPEPPOL155 project. Also, the Norwegian company register has supported a faster uptake of electronic invoicing and thereby contributed to a higher degree of efficiency and to lower costs. In addition, open data is, amongst other applications, re-used in decision-making and policy-making processes, to provide transparency on political actions and behaviour of politicians, to address housing issues in the cities, to raise awareness on noise levels and to reduce emission levels. Switzerland is the only EFTA country that has a monitoring framework156 in place to measure the impact of open data. However, the respondents to the survey reported that this was considered too theoretical to be effective. Therefore, a new version is currently being elaborated. Besides the framework, there are no other activities conducted to measure the re-use of open data. Some insights into open data re-use in Switzerland, however, can be gained by looking at the national open data portal, that provides a list of applications that are developed by using data from the portal. At the moment of writing (October 2019) the list contains 43 applications, with most of them providing solutions to address societal and environmental challenges. The portal also links the used datasets to each application. Iceland and Liechtenstein do not put explicit effort in increasing the re-use open data, according to the answers provided by these countries. Open data re-use is not defined as a priority at national level, and there are no mechanisms in place to monitor or measure open data re-use. It is unclear if and how open data is re-used in these countries, and both countries were not able to provide examples of applications or services built on open data. An example of open data re-use in Iceland can be found on the European Data Portal, where hundreds of open data use cases from all of Europe are featured. The application is called Iceland Aurora Alert157 , and allows users to monitor and learn more about northern lights activities. Coloured areas on the orbit tell users the likelihood that northern lights can be detected on the sky. Users can set alerts if aurora activity is expected in a specific area and can share the alerts with others. The application derives metrological data from multiple resources such as the Icelandic Meteorology Office and the National Oceanic and Atmospheric Administration. The Norwegian national open data portal provides a designated area to showcase applications and services that are based on open data. An example of how open data is re-used in Norway is the platform Air Quality158 , that provides information on local air quality and predicts air pollution with the help of open data. The platform is a cooperation between the Environment Directorate, the Norwegian Public Roads Administration Road Directorate, the Meteorological Institute, the Norwegian Institute of Public Health, and the Directorate of Health, who have the mission to reduce emissions to air and exposure to local air pollution. The Swiss national open data portal provides a designated area to showcase open data use cases. An example of open data re-use is the application Badimeter159 , that provides users with information on all public open indoor and outdoor pools of Zurich. Users find information on water temperature, opening hours and location, and current real-time occupancy and scheduled occupancy for the swimming pool. Badimeter uses real-time information from the sports department of the city of Zurich. 155 https://peppol.eu/who-is-who/peppol-certified-aps/ 156 http://digisus.com/blog/wp-content/uploads/2013/06/OGD-CH-IMF-DACHLI-Bericht-V04-DOWNLOAD-VERSION.pdf 157 https://www.europeandataportal.eu/sites/default/files/iceland_-_auroraalert.pdf 158 https://luftkvalitet.miljostatus.no/om-tjenesten 159 https://www.europeandataportal.eu/sites/default/files/switzerland_-_badimeter.pdf
  • 67. OPEN DATA MATURITY REPORT 2019 67 5.4 Open data quality Since Liechtenstein does not have a national open data portal yet, this dimension only assesses the open data quality and the efforts to increase quality in Liechtenstein, Norway, and Switzerland. When looking at automatic processes to ensure that changes at the source of the data are reflected with the least amount of delay on the national portal, in both Norway and Switzerland, between 70% and 89% of the metadata is uploaded automatically. In Iceland, only below 30% is uploaded automatically, which means that most metadata is edited manually instead. Due to, amongst others, the automation of the process of uploading metadata, more than 90% of the data on the national portal of Norway is updated within 1 day from when its primary source is updated. In Switzerland, this percentage is slightly lower, between 79% and 90%. Iceland was not able to provide information about this. Although 82% of the EU28 Member States have a mechanism in place to monitor the quality of metadata available on their national open data portals, from the EFTA countries, only Norway states to have such a mechanism. Switzerland does not monitor the quality of metadata yet, but a system for this is currently being developed and will be put in place for the near future. None of the EFTA countries publishes information on the quality of the metadata on their respective portals. Norway and Switzerland both mention that 100% of the data available on the national portal is accompanied by licensing information. In Switzerland, to be able to publish on the national open data portal, a publisher must choose one of the portal’s defined licences. Iceland was not able to assess the share of data accompanied by licensing information. Norway and Switzerland assist publishers in choosing an appropriate licence for their data by providing information about open licensing in their general guidelines and handbooks. Both these countries mention that, in line with 79% of EU28 Member States, between 1 and 5 different open licences are used on the national open data portal. In terms of compliance with the DCAT-AP standard, both Norway and Switzerland present good levels of compliance to mandatory, and the support to recommended, and optional classes. In Norway, more than 90% of the metadata is compliant, more than 90% uses recommended classes, and between 31% and 50% optional classes. In Switzerland, more than 90% of the metadata is compliant, but there is no information available on to the use of recommended and optional classes. Both countries developed a national extension of the DCAT-AP standard to better fit their national context. One of the reasons for the national extension in Norway was to be able to be more ambitious when it comes to mandatory and recommended classes, but also to better cover relations to the Norwegian law for restricted and non- public datasets. The national extension of the DCAT-AP in Switzerland includes more optional fields, and more attributes are defined as mandatory. When looking at models such as the 5-Star Open Data to assess the quality of deployment of data in the countries, none of the EFTA countries report to use such models, and only Switzerland conducts activities to familiarise data providers with deployment quality models such as the 5-star Open Data or the linked data concept. The Swiss Federal Archives coordinates with different data publishers “linked data showcases”, to experiment with this technology and to show its potential. Currently, they are also building a linked data infrastructure, to encourage and directly support the publication of linked data. When looking at the quality of data on the national portals of the EFTA countries, it becomes clear that in Norway more than 90% of the available data is made available under an open licence and in an open and machine-readable format (3 stars in the 5-stars model). In Switzerland, this percentage is lower, between 30% and 39%. In addition, in Norway, between 10% and 19% of the data is made available under an open licence, in an open and machine-readable format, and uses consistently Uniform Resource Identifiers (4 stars in the 5-stars model). In Switzerland, this percentage is slightly lower, between 0% and 9%. Just like in 27 Member States, only 0% and 9% of the data on the portal links to other renowned sources to provide additional context for the users (5 stars in the 5-stars model).
  • 68. OPEN DATA MATURITY REPORT 2019 68 5.5 Overall performance Figure 5.1 shows the average maturity level of the EFTA countries on each of the four open data dimensions. When looking at the EFTA averages of the open data maturity per dimension, then the same observation as in the case of the EU28 can be made for the EFTA countries. The dimensions policy and portal are the most mature, while the dimensions impact and quality are lagging behind. An exception here is the maturity level of open data quality in Norway. With an average score of 68% on this dimension, Norway scores higher than the EU28 average of 65%. In terms of the overall maturity level, the 2019 results in figure 5.2 show a mixed picture in the EFTA countries. Whereas Norway and Switzerland reach overall open data maturity levels of 65% and respectively 45%, Iceland and Liechtenstein only show very modest results of 8% and respectively 6%. All the four EFTA countries score below the EU28 average of 66%, although it is worth mentioning here that the overall maturity score of Norway only differs very slightly (1 percentage point) from the EU28 average open data maturity score. When looking at the maturity development over the years, the 2019 results in figure 5.3 show a mixed picture in the EFTA countries. The open data maturity development in Norway follows the same pattern as in the EU28 Member States, that is an acceleration of open data maturity between 2015 and 2017, a decrease in 2018 when the two new dimensions impact and quality were added to the assessment, and an increase in 2019 again. The open maturity level in Switzerland stays stable over the years. With an average score Figure 5.1: EFTA averages on the four open data dimensions 0% 10% 20% 30% 40% 50% 60% 70% 80% 90% 100% Policy Portal Impact Quality Norway Switzerland Iceland Liechtenstein EU28 average EFTA average Figure 5.2: EFTA open data maturity development 2015-2019 65% 45% 8% 6% 0% 10% 20% 30% 40% 50% 60% 70% 80% 90% 100% Norway Switzerland Iceland Liechtenstein 31% EFTA average 66% EU28 average
  • 69. OPEN DATA MATURITY REPORT 2019 69 between 45% and 56% each year, the open data field is not developing as fast as in the EU28 Member States. The open data maturity level in Iceland and Liechtenstein are not significantly increasing over the years. On the contrary, Iceland’s scores are decreasing since 2017. Figure 5.3: EFTA open data maturity 2019 0% 10% 20% 30% 40% 50% 60% 70% 80% 90% 100% 2015 2016 2017 2018 2019 Norway Switzerland Iceland Liechtenstein EU28 average EFTA average
  • 70. OPEN DATA MATURITY REPORT 2019 70 Clustering the EU28+ countries Chapter 6
  • 71. OPEN DATA MATURITY REPORT 2019 71 The 2019 clustering exercise follows the previous year’s grouping of countries and distinguishes between the following levels of maturity, from the most performing to the least: open data Trend-Setters, Fast- Trackers, Followers and Beginners. 6.1 Clustering profiles The indicative profiles that exemplify the level of maturity you may expect from the countries according to clusters they belong to are specified below. Trend-Setter The country has an advanced open data policy in place with a strong coordination of open data activities throughout at all levels of government. The national portal provides a wide range of features and caters for the needs of advanced users and publishers. The level of quality of open data in the country is very good, with various initiatives in place to ensure the publication of high- quality data and compliance with DCAT-AP. There are different open data ecosystems developed around data domains, with a high level of interaction and reuse within these domains. Activities to measure re-use are conducted, with methodologies in place to assess the impact in different domains. Little to no limitations to publication or re-use are observable. Fast-Tracker The country shows a good level of maturity against all dimensions. Overall the country showcases activities to boost data publication, with a strategic approach to increase the quality of published data and a high level of compliance with standards is achieved. The national portal provides a good level of functionalities to cover the needs of advanced and basic users. Limited efforts are made to monitor the impact of open data. However, a stronger focus is given to tracking and boosting re-use. Some issues can still be observed, but measures are in place to tackle them. Follower The country has already an open data policy in place and is conducting activities to ensure a fair level of coordination of open data activities. The portal showcases standard features, but also a limited number of features that cater for the needs of more advanced users. There are a few activities conducted to boost the publication of high-quality data from different providers, however, there is no systematic approach to ensure a higher quality of publication across the board. Only very limited activities to monitor re-use and measure the impact of open data are performed. A fair number of limitations in terms of data publication and re-use still exist Beginner The country shows an early stage of maturity on the four dimensions or - alternatively - was not able to develop at the same pace as the counties in other, better performing clusters. Progress is more prominent in the open data policy dimension. There is no open data portal or, if existent, the portal showcases limited features or a limited number of datasets, compared to the country’s potential. None or very limited activities are performed to monitor the reuse of open data in the country and no monitoring is done to assess impact. In terms of data quality, the country is taking little action to enable the publication of data in higher quality, and little effort is spent to ensure the adoption of DCAT-AP. Visible limitations in terms of open data publication exist, with limited reuse examples. Chapter 6: Clustering the EU28+ countries
  • 72. OPEN DATA MATURITY REPORT 2019 72 The names of the clusters are an exemplification and do not intend to represent literally the achievements and history of open data developments in the respective countries, e.g. you may find among the “Beginners” countries that have been investing in open data for years, though with less significant results than others. 6.2 The 2019 clustering The visual analysis of clustering the overall maturity scores of the EU28+ Member States are presented in figure 6.1. The figure shows the most mature countries on the left side and the least mature countries on the right side. This year more than last year the clustering exercise shows clear distances between the four different groups and minimal distances within the groups. The groups consist of the following number of countries: 3 Trend-Setters (9%), 8 Fast-Trackers (25%), 14 Followers (44%), and 7 Beginners. 6.2.1 Open data Trend-Setters With overall maturity scores between 89% and 91%, this year only 3 countries belong to the Trend-Setters group. Ireland maintains its top position in Europe, with an overall maturity of 91%, followed by Spain with 90%, and France with 89%. Last year, Cyprus and Italy were also qualified as open data Trend-Setters. Although these countries achieved similar scores to last year (around 80%), they have been pushed back to the Fast-Trackers group due to the speed of open data transformation in Ireland, Spain, and France. Ireland increased its score from 88% to 91%, Spain from 87% to 90%, and France from 83% to 89%. This year, the maturity scores of the trendsetters range from 89% to 91%, while last year this range was from 80% to 88%, which underpins the minimal distances within the group this year. 6.2.2 Open data Fast-Trackers With overall maturity scores between 75% and 80%, this year 8 countries belong to the Fast-Trackers group. This is a decrease of 8 countries compared to 2018 when 16 countries belonged to this group. Ranked from the lowest to the highest scores within the Fast-Trackers group, these countries in 2019 are: Latvia, Slovenia, Finland, Italy, Poland, Denmark, the Netherlands, and Cyprus. The only country that moved upwards from being a follower into being a Fast-Tracker, is Denmark. The other 7 countries in this cluster were already a Fast-Tracker last year (Latvia, Slovenia, Finland, Poland, and the Netherlands), or fell back from being a Trend- Setter into being a Fast-Tracker (Italy and Cyprus). It is worth mentioning here that in 2018, the Fast-Trackers group consisted of countries scoring between 62% and 79%, while in 2019 the group consists of countries scoring between 75% and 80%. This again shows that this year the differences within the clusters are minor. 6.2.3 Open data Followers With overall maturity scores between 53% and 69%, this year 14 countries belong to the Follower’s group. This is an increase of 8 countries compared to 2018, when only 6 countries belonged to the follower’s group. The Follower’s group is the densest group this year, while in 2018 this was the Fast-Trackers group. Ranked from the lowest to the highest scores within the Follower’s group, these countries in 2019 are: Lithuania, Sweden, Romania, Bulgaria, United Kingdom, Luxembourg, Czech Republic, Norway, Belgium, Figure 6.1: Open data maturity clustering 2019 100% 90% 80% 70% 60% 50% 40% 30% 20% 10% 0% BeginnersFollowersTrend-setters Fast-trackers AT NO HR CZ HU IS SK LI CY IT NL FR IE DK PLES LV SL FI BE BG LT SE MT PTCHRO EE GR LU UK DE
  • 73. OPEN DATA MATURITY REPORT 2019 73 Austria, Greece, Estonia, Germany, and Croatia. It is worth mentioning here that the Follower’s group last year consisted of countries with an overall open data maturity score between 37% and 62%, while this year the group consists of countries scoring between 53% and 69%. This shows that the group of Followers have moved forward (with lowest scores increasing from 37% to 53%, and highest scores increasing from 62% to 69%) and that the scores of countries within the group differ less than last year. 6.2.4 Open data Beginners With overall maturity scores below 45%, this year 7 countries belong to the Beginner’s group. This is an increase from 4 countries compared to 2018 when Iceland, Liechtenstein, and Malta belonged to the beginner’s group. Ranked from the lowest to the highest scores within the Beginner’s group, these countries in 2019 are: Liechtenstein, Iceland, Hungary, Slovakia, Malta, Portugal, and Switzerland. The distances between the countries in the Beginner’s cluster are larger than the distances between the countries in the other 3 clusters, which shows that the open data maturity level in the 7 countries belonging to the Beginner’s cluster differ quite a lot from each other. There is a clear distinction between true beginners - Iceland and Liechtenstein - and the other countries in the cluster that are already further in their open data transformation. Iceland and Liechtenstein score the lowest since these countries are not yet prioritising open data publication and re-use and lack dedicated policies and strategies to boost open data transformation in the country. It is worth mentioning here that Liechtenstein published their Digital Agenda in 2019 with a specific focus on making available geodata in an open and machine-readable format, which shows that Iceland is taking steps in opening up public sector information. Frontrunner in the beginner’s group is Switzerland (45%), followed by Portugal and Malta (both 42%). These countries are not at the beginning of their open data journey but are not progressing as fast as other countries. It is worth mentioning here that the beginner’s group in the previous year consisted of countries with an overall open data maturity score lower than 20%, while this year the group is made up by countries scoring lower than 45%. While Switzerland and Portugal achieved similar scores as last year, they have been pushed back to the beginner’s group due to the speed of open data transformation in other countries. 6.3 Development of the clusters 2015-2019 The development of the clusters can be seen in figure 6.2. When looking at the Beginner’s cluster (light blue), it becomes clear that each year this is the smallest group, which means that each year only a few countries can be qualified as Beginners. Only this year the beginner’s group is not the smallest group. For the first time since 2015, there are more Beginners than Trend-Setters. When looking at the Follower’s cluster (dark blue), it becomes clear that the number of countries in this group decreased each year but increased for the first time in 2019. In this year, the group of Followers more than doubled compared to 2018. When looking at the cluster of Fast-Trackers (light orange), it becomes clear that the cluster consists of approximately the same number of countries every year but only included more than half of the Member States in 2018. When looking at the Trend-Setters cluster (dark orange), it becomes clear that - except for in 2017 - the group is getting smaller each year. In 2019, the Trend-Setters group only consists of 3 countries, which is the lowest number since 2015. Figure 6.2: EU28 average open data maturity per dimension 0% 10% 20% 30% 40% 50% 60% 70% 80% 90% 100% 2015 2016 2017 2018 2019 BeginnersFollowersFast-trackesTrend-setters
  • 74. OPEN DATA MATURITY REPORT 2019 74 Recommendations Chapter 7
  • 75. OPEN DATA MATURITY REPORT 2019 75 Since 2018, the EU28+ countries are clustered against their level of maturity, to identify affinities between their progress and challenges. Clustering also enables us to provide focused advice, re-using and building on the best practices and successes of those the countries who moved first, or perform better. This year, this exercise is refined in light of the latest results and learnings. Of course, the recommendations cannot change dramatically from one year of the other. The open data maturity report continues to evolve these lists of actions through EU28+ countries’ experimentation and contribution. 7.1 Trend-setters Maintain the ecosystem, experiment, and share the knowledge Enhance and consolidate the open data ecosystem you developed already and consolidate any ‘sectoral depth’. Enable the development of ‘thematic data ecosystems’ around domains defined in the recent Directive on Open Data and the re-use of Public Sector Information for what concerns high-value datasets (thematic categories such as statistics, meteorological, mobility). Pilot activities to develop a thematic ecosystem of publishers and re-users. Transfer the practices to help create a new ecosystem around another field of interest. Foster the creation of online exchange channels and tools to further develop knowledge, such as wikis on topics of interest for the open data community. 2 Steer the network of open data stewards towards activities to enable data-driven policy-making in their organisations and commission research to showcase the value of re-use in the public sector itself, e.g. in terms of efficiency gains. Decentralise monitoring activities to the network of stewards within your country. Monitoring should address elements that are relevant to enabling more high-quality data publication as well as to boosting reuse and impact. Such monitoring includes monitoring on charging practices for open data publication within the stewards’ organisation, degree of reuse of open data within the organisation, as well as monitoring of progress against the defined data publication plans. Encourage the publication of structured data by mature, data-aware organisations. Increase awareness around the use of URIs and RDF for metadata and enable its publication. 3 Define a strategy to ensure the Open Data portal’s sustainability. Experiment with alternative funding models beyond state funding, e.g. pay for value-added services on the portal. Share the outcome of your experimentation with the other countries. 4 Engage universities and research institutions to develop country-specific metrics to measure impact. Be aware of the characteristics of each industry and sector in your assessment. Focus on data domains in which both data publication and re-use have reached a high level of maturity. Define and understand clearly the ‘impact’ to be measured in those areas. Operationalise monitoring the metrics and assessing impact. Rely on a mix of methods (e.g. ex-ante and ex-post analyses, structured/semi-structured interviews, use cases, log analyses from the national portal…) to ensure a variety of insights. Improve the metrics iteratively over time. Do not be afraid to try and fail. 5 Conduct research to assess the economic impact of open data, at both micro and macro levels. Take advantage of the European Commission’s upcoming impact assessment on the list of high- value datasets160 to learn from and re-use its economic impact assessment methodology. Iterate annually or biannually to observe change and refine activities and goals. Leverage the momentum created by showcasing the results and rally stronger political support. 6 Harness the wisdom of the crowd by enabling the broader open data community to contribute more to the national open data programmes. Enable re-users to upload their own data and showcase their ideas and creations on the national portal. Enable users to comment on and rate datasets and embed their feedback and ratings in the search algorithms. Enable publishers to improve their data publication, based on re-users’ feedback and ratings. 1 2 3 4 5 6 160 Project SMART 2019/0025, https://etendering.ted.europa.eu/cft/cft-display.html?cftId=4676 Chapter 7: Recommendations for the countries
  • 76. OPEN DATA MATURITY REPORT 2019 76 Continue the work on improving the quality of both metadata and data by boosting the use of tools on your portal (e.g. for the validation of metadata). Enable automated notifications to publishers to notify them of issues. Provide tools to enable data conversion into alternative formats, possibly replacing non-machine-readable, proprietary formats. 8 Link to a variety of sources of real-time data and evaluate means of incentivising custodians of real-time data to enable publishing, given the higher costs that publication of such data implies (bandwidth, processing power, etc). 9 Work with training institutions on providing advanced open data courses and training and tailor training curriculum to involved more advanced elements (e.g. linked data and the use of Uniform Resource Identifiers and Resource Description Frameworks . Enable such courses to be formally recognised as ‘continuing education’ and provide certification to civil servants upon successful completion of these trainings. 10 Share your knowledge and results of your experimentation with other countries and enable them to learn from your best practices and contribute to your research, e.g. in areas of focus you share, or where you experience similar barriers. Reach out and cooperate with other countries on developing solutions to common challenges, including basic, re-usable elements such as open source software that your platforms share (e.g. portal extensions). 7.2 Fast-trackers Graduate from traction to impact 1. Assist the development of open data initiatives at local and regional level and coordinate more intensively with the local and regional open data teams. 2. Activate the network of open data officers and enable them to set up monitoring activities within their organisation (e.g. develop plans for data publication and monitor charging practice). Track progress against these plans and assist open data officers to alleviate barriers to data publication identified in their organisation. 3. Ensure that existing open data courses and training materials are promoted and extensively used. Cooperate with training organisations to develop new course offerings tailored to the needs of your national, regional and local administrations. Enable such courses to be formally recognised as ‘continuing education’ and provide certification for civil servants upon successful completion. Ensure more financial resources are allocated at all administrative levels to enable more civil servants to benefit from such training activities. 4. Focus on organising activities that better target the delivery of sustainable solutions. Move beyond creativity-stimulating formats (e.g. hackathons) to formats that privilege enabling business opportunities for medium- to long-term engagement (e.g. data challenges). Ensure funding and political sponsorship (e.g. organisation as ‘patron’) for winning ideas. 5. Promote and follow-up on the performance of developed products and/or services. Develop strategic awareness of reuse and impact of open data. If useful, focus your resources on a specified field or sector, to start demonstrating impact, and take the opportunity to from the early work developed to specify the upcoming high-value datasets for inspiration and prioritisation. Pilot thematic workshops in these areas. Create a framework for knowledge exchange and enable the development of a community of practice between publishers and re-users. Increase your knowledge on the publication and reuse of data in that domain and start thinking of a definition of impact in that field that can be operationalised into metrics. 6. Update the national open data portal to better engage your audience. Include features that enable online interaction between data publishers and re-users. Showcase re-use examples prominently on the national portal and promote the datasets used to develop those use cases. Consider the opportunity to promote the developers as well. 7 8 9 10 1 2 3 4 5 6
  • 77. OPEN DATA MATURITY REPORT 2019 77 7. Monitor access and usage of the portal and enhance knowledge in your team around the profiles of your portal’s typical users. Enable such insights to flow into improving the portals features, the access to data and improve the variety of data published in your country. 8. Prepare to address the requirements of the recent Open Data and Public Sector Information Directive by revising and enhancing the portal’s support for real-time data sources. Identify the main real-time data holders in your country and promote the publication of their data. Deepen the understanding amongst real-time data holders of the concept of high-value datasets (e.g. for enabling societal development within the broader vision of smart cities and with most of high-value sectors becoming real-time). Understand the concerns and costs of publication and work together with publishers to enable the data publication process. Start with a small range of datasets. 9. Think of ways to ensure the portal’s sustainability by enabling more contributions from the open data community (e.g. contributions in terms of own datasets, developed use cases, news and blog items written by the community), by providing value-added features, as well as by exploring additional funding options. 10. Enforce minimum standards to quality of metadata and data by using analytics tools to monitor data publication - at both metadata (compliance with the DCAT-AP schema) and data (formats of publication) level. Develop validation schemas for your national portal and send out reports on published datasets to data providers. Act on the findings of these reports and provide tailored assistance to publishers to increase the quality of their data publication, both in terms of metadata and data. 7.3 Followers Strengthen governance, boost engagement 1. Update the national strategy for open data to reflect technical and policy developments at EU level. In particular, prepare to address the requirements of the latest Open Data and Public Sector Information Directive by identifying high-priority domains and high-value datasets for publication, through APIs and free whenever possible. Support publication through legislation where suitable. 2. Set up a governance structure that accounts for the characteristics of your country. Engage potential re-use groups (e.g. data companies, research institutions, NGO’s) into the open data governance in your country. This will enable a co-ownership around a common vision and buy-in on the actions for each sector. 3. Develop a yearly plan for activities (events, conferences…) at national level to promote open data. Focus on formats that promote publication as well as re-use by both public and private sector. Experiment with formats that both leverage creativity (e.g. hackathons) and enable the development of business opportunities on medium- to long-term engagements (e.g. data challenges). Ensure funding and political sponsorship for the winning ideas. Promote and follow up on the performance of developed products and/or services. 4. Identify communities of re-users and conduct awareness-raising activities around open data within these groups (e.g. universities, data start-ups and data companies, research institutes, NGOs, journalists). 5. Encourage the network of open data liaison officers to set up data publication plans and monitor progress against these plans. Enable the open data officers to monitor charging practices within their organisation and exchange within the network on practices to alleviate such barriers. Deepen the understanding within the network of open data officers of the benefits of open data re-use by the public sector. 7 8 9 10 1 2 3 4 5
  • 78. OPEN DATA MATURITY REPORT 2019 78 6. Ensure that pre-existing open data courses and training materials are used and cooperate with public administrations and training organisations to develop open data training curricula for national, regional and local administrations. Enable such courses to be formally recognised as ‘continuing education’ and provide certification upon completion. Ensure financial resources are allocated at all administrative levels to training activities for civil servants working with data. 7. Enablemeet-upsandengagementbetweenre-usersandpublishers.Developadeeperunderstanding of open data demand side and work together with data publishers to prioritise data publication in line with this demand. Focus on fostering open data reuse by both public and private sector and encourage the community to share their reuse cases. Promote these open data use cases more prominently on the national portal, ideally in a section directly accessible from the homepage. 8. Conduct regular updates to the national portal to reflect the users’ needs. Include features such as feedback and interaction mechanisms at dataset level, designated login areas for users, access via SPARQL query or/and API in general. Consider integrating data visualisation and analytics tools to allow portal visitors to gain insights from data via interactive charts and other visualisation tools. Monitor access and usage of the portal. Draw insights from this data and enhance awareness around it within your team. 9. Increase understanding of the variety of data that your portal features (historical vs. current data) and work towards improving it. Identify data holders that do not publish their data or do not reach to their full potential, understand what friction they are experiencing and plan to address it. Think of the future and on enabling publication of real-time data in your country. 10. Provide trainings and online materials that focus on metadata and data quality. Promote the DCAT-AP standard and existing guidelines to foster compliance. Create understanding around the importance of publishing data in machine-readable, non-proprietary formats as well as regarding the licensing of data. Develop knowledge around existing open source tools to clean up data and validators for metadata compliance. 7.4 Beginners Think big, act small 1. Rally support to the open data programme and political leadership from top level of government. Showcase international research around the value of open data. Present research of market value of open but also commercial data for your country (e.g. from the European Data Market Value Monitoring161 ) to emphasise economic benefits of data exploitation. 2. Develop a national strategy for open data and align it with broader strategies at national level (e.g. national digital strategy, national strategy for the modernisation of public sector). 3. Set up a team at national level in charge of open data to ensure coordination of activities within the country and set up ‘road-shows’ to promote the team’s scope and activities with the main public administrations in the country. Include both national, and -if applicable - regional and local - administrations in this process. 4. Organise a series of open data events at national level and focus on engaging both data publishers and re-users in your country. Prioritise the promotion of data publication best practices and re-use cases during such events. 5. Set up relevant communication channels and contact persons for data publication within public administrations (if applicable, the open data liaison officers) and foster the exchange between these. Maintain an active dialogue with the open data liaison officers and enable regular exchange of knowledge amongst them, through offline and online channels (meetings, online forums etc.) 6 7 8 9 10 1 2 3 4 5 161 http://datalandscape.eu/european-data-market-monitoring-tool
  • 79. OPEN DATA MATURITY REPORT 2019 79 6. Identify the main data holders in the country and understand the main concerns and barriers to data publication. Take the first steps to overrun these barriers and unlock the publication of data. 7. Organise workshops and awareness-raising sessions with the main data holders. Re-use materials already developed in other countries and at European level as source of inspiration to cover the basics of open data publication. 8. Develop guidelines to enable publication of data, of its metadata and the take-up of suitable licensing conditions. If standard licences are not suitable, reflect on the need to develop a national licence for Open Government Data publication in your country. Learn from European best practices and reach out to colleagues in other countries when setting out to develop such guidelines. Raise awareness amongst main data publishers around the importance of metadata and promote the DCAT-AP standard, specifications and existing guidelines developed at European level. 9. Make sure you run a modern portal that enables publication and discoverability of open data. Scout for European best practices and compare existing infrastructure to choose the most adequate to support your scope and mission. Set up dedicated news and blog sections to promote relevant developments as well as to showcase open data re-use examples. Ensure feedback channels are seamlessly integrated into the national portal. 10. Ensure that the national open data strategy guarantees scoping, management and funding of the portal. Ensure that sufficient resources are allocated to open data awareness-raising activities with both publishers and potential re-users. 6 7 8 9 10
  • 80. OPEN DATA MATURITY REPORT 2019 80 Conclusions
  • 81. OPEN DATA MATURITY REPORT 2019 81 Conclusions This report presents an extensive overview of the open data maturity levels across the EU28 and the EFTA countries. It assesses the level of maturity against four dimensions: policy, portal, impact, and quality. The study clusters countries into four different groups from the most mature to the least: trend-setters, fast-trackers, followers, and beginners. It includes recommendations tailored to the level of maturity and characteristics of each of these groups. By doing so, the report provides policy-makers and portal owners with actionable guidance to push forward and harness sustainable digital transformation through open data in the years to come. The report emphasises that the acceleration in open data maturity observed since the first assessment in 2015 has evolved into a steadier trend of improvement and consolidation. Dedicated open data policies and strategies together with increasingly advanced national open data portals have laid down the foundation for making open data available and discoverable throughout Europe. This year in particular, the EU28+ countries have made great efforts in ensuring the governance of open data at all government levels by appointing dedicated open data stewards and providing training and guidance to civil servants in national, regional, and local administrations. Furthermore, and in particular this year, countries have made more advanced features available on the national portals to make open data better discoverable and to create channels that connect re-users to data providers and re-users between themselves. Making open data available and discoverable through increasingly advanced national portals, however, is just a component of a mature strategy and implementation. Enabling open data re-use and generating impact are integral parts to this. To steer open data initiatives towards their next phase of maturity, there is an urgency to increase the quality of both data and metadata to make the former more suitable for re- use. In addition, there is a need to better understand and capture how value is created with open data and to gain insights into re-users’ demands and needs. The more mature countries have already expanded and intensified their efforts to address the more challenging dimensions of open data: quality and impact. They are becoming more engaged with the community of re-users, listening to their feedback, striving to address their needs, and creating frameworks to measure impact. Less mature countries, however, need to step up their efforts and move beyond the basic requirements of the Public Sector Information Directive if they want to truly harvest the benefits of open data. The results of this year’s clustering exercise have shown an increasing divide between the trend-setters, fast- trackers, followers, and beginners. In order to prevent the gap from further increasing, more collaboration between the countries and a better transfer of knowledge and expertise are necessary. Collaboration and ensuring more cohesive and consistent open data and shared data spaces in Europe are getting even more important with the upcoming challenge to publish the selected “high-value datasets” as truly open data under the Open Data Directive in the coming years. Countries will need to cooperate with the European Commission throughout 2020 in order to reach a common definition of high-value datasets and to standardise their specifications, thus facilitating re-use across borders. To move forward, it is up to the EU28+ countries to capitalise on the experience of the other countries, captured through this report’s insights and recommendations. This document enables policy-makers and civil servants to see their progress in the perspective of the commitment and results of their peers across Europe, whether at national, regional or local level. They can better understand the level of maturity of their open data achievements in the European context and identify the areas for improvement. Finally, they can be inspired by the work done in other countries, learn from it, and initiate further cross- border collaboration. This is a fundamental prerequisite in further realising the benefits of open data and contributing to the European data economy.
  • 82. OPEN DATA MATURITY REPORT 2019 82 Annex: country factsheets Complementary to this report, country factsheets are available on the European Data Portal’s dashboard at https://www.europeandataportal.eu/en/dashboard. The factsheets provide a more detailed insight at national level into the results of the four open data dimensions (policy, portal, impact, and quality) in comparison with EU28 average and with the results from previous years. Examples of content you will find in the country factsheets can be seen below. Example from Denmark Example from Norway Example from Ireland
  • 83. OPEN DATA MATURITY REPORT 2019 83 Links to countryfactsheets. Austria Belgium Bulgaria Croatia Cyprus Czech Republic Denmark Estonia Finland France Germany Greece Hungary Iceland Ireland Italy Latvia Liechtenstein Lithuania Luxembourg Malta Norway Netherlands Poland Portugal Romania Slovakia Slovenia Spain Sweden Switzerland United Kingdom