SlideShare a Scribd company logo
Visualizing and Discovering Non-Trivial
Patterns in Large Time Series Databases
Quan Le
HCI Lab
23th Mar, 2015
Jessica Lin, Eamonn Keogh, Stefano Lonardi, Jeffrey P. Lankford, Daonna M. Nystrom
Computer Science & Engineering Department University of California, Riverside, CA 92521
Proceedings of the 30th VLDB Conference, Toronto, Canada, 2004
Contents
 Introduction
 Background
 Time series data mining tasks
 Visualizing Time Series
 VizTree
 Evaluation
 Conclusion
2
Fig 1. Time Series Visualization
Introduction
Introduction
Background
Time Series data mining tasks
Visualizing Time Series
VizTree
Evaluation
Conclusion- Data visualization techniques are very important for data
analysis.
- Visualizing massive time series datasets.
- VizTree – a time series pattern discovery and visualization
system based on augment suffix trees.
 Occurring pattern (Motif Discovery)
 Surprising Pattern (Anomaly Discovery)
 Query by content
 Measures the dissimilarity between any two time series
3
Introduction
Introduction
Background
Time Series data mining tasks
Visualizing Time Series
VizTree
Evaluation
Conclusion- DoD – The U.S Department of Defense and The Aerospace
Corp (TAC)
- There are two major directions of research area:
 Producing better technique to mine the archival launch
data from previous missions (mining stage).
 Producing better techniques to visualize the streaming
telemetry data in the hours before launch (monitor
stage)
- Dr. Ben Shneiderman of Uni. of Maryland – “Overview, zoom
& filter, details-on-demand”.
4
Background
 Time Series data mining tasks
 Visualization Time Series
5
Introduction
Background
Time Series data mining tasks
Visualizing Time Series
VizTree
Evaluation
Conclusion
Time Series data mining tasks
 Subsequence matching
 Motifs Discovery
 Anomaly detection
6
Introduction
Background
Time Series data mining tasks
Visualizing Time Series
VizTree
Evaluation
Conclusion
Subsequence Matching
- Sequence matching has long been divided into two categories:
whole matching and subsequence matching.
- Subsequence matching: a short query subsequence time series
is matched against longer time series by sliding it along the
longer sequence, looking for the best matching location.
- Chunking – the process where a time series is broken into
individual time series by either specific period.
7
Introduction
Background
Time Series data mining tasks
Visualizing Time Series
VizTree
Evaluation
Conclusion
Fig 2. A weekly map of drought conditions in Texas
Time Series Motif Discovery
- A substantial body of literature has been devoted to
techniques to discover frequently recurring, overrepresented
patterns in time series.
8
Introduction
Background
Time Series data mining tasks
Visualizing Time Series
VizTree
Evaluation
Conclusion
Fig 3. Time series Subsequence Motifs Discovery
Anomaly Detection
9
Introduction
Background
Time Series data mining tasks
Visualizing Time Series
VizTree
Evaluation
Conclusion- The problem of detecting anomalous/surprising patterns has
attracted much attention.
- Keogh’s definition – “whose frequently of occurrences differs
substantially from that expected or given previously seen
data”.
Fig 4. Illustration of Anomalous Series Detection ( Red represents anomalous time series)
Visualizing Time Series
10
Introduction
Background
Time Series data mining tasks
Visualizing Time Series
VizTree
Evaluation
Conclusion TimeSearcher
 Cluster and Calendar-based visualization
 Spirals
TimeSearcher
11
Introduction
Background
Time Series data mining tasks
Visualizing Time Series
VizTree
Evaluation
Conclusion- A time series exploratory and visualization tool that allows
user to retrieve time series by creating queries.
Fig 5. The TimeSearcher visual query interface.
User can filter away sequence that are not
interesting by insisting that all sequences have
at least on data point within the query box.
http://www.cs.umd.edu/hcil/timesearcher/vide
os/TimeSearcherDemo.mp4
 Flexibility
 Specify different regions
to compare.
Cluster and Calendar-based visualization
12
Introduction
Background
Time Series data mining tasks
Visualizing Time Series
VizTree
Evaluation
Conclusion- The time series data are chunked into sequences of day
patterns.
- This visualization system displays patterns represented
calendar with each day color-coded by the cluster that it
belongs to.
Fig 6. The cluster and calendar-based
visualization on employee working
hours data. It shows 6 clusters,
representing different working day
patterns.
 Good overview
 Limited to calendar-
based data
Spirals
13
Introduction
Background
Time Series data mining tasks
Visualizing Time Series
VizTree
Evaluation
Conclusion- Weber developed this tool to visualize time series on spirals.
- Identify periodic structures in the data.
- Do not exhibit periodic behaviors of time series data.
- Requires pixel space in length of time series.
Fig 7. The Spiral visualization approach of Weber applied to the power usage
dataset
VizTree - Motivation
14
Introduction
Background
Time Series data mining tasks
Visualizing Time Series
VizTree
Evaluation
Conclusion
Here are two sets of bit strings.
Which set is generated by human and
which one is generated by a computer?
0101100101111001101001000010001010
0110110101110000101010111011111000
1101101101111110100110010010001101
0001111001101101000101111000101101
0011011001101000000100110001001110
000011101001100101100001010010
1000100010100100010101010000101010
0010101110111101011010010111010010
1010011101010101001010010101011101
0101001010101011010101001011001011
1011110100011100001010000100111010
100011100001010101100101110101
VizTree - Motivation
15
Introduction
Background
Time Series data mining tasks
Visualizing Time Series
VizTree
Evaluation
Conclusion
Fig 8. (Left) Computer-generated random bits presented as an augmented suffix tree.
(Right) Human-constructed bits presented as an augmented suffix tree.
0
1
(0,1,0)
(1,0,1)
(0,1,1)
1000100010100100010101010000101010
0010101110111101011010010111010010
1010011101010101001010010101011101
0101001010101011010101001011001011
1011110100011100001010000100111010
100011100001010101100101110101
0101100101111001101001000010001010
0110110101110000101010111011111000
1101101101111110100110010010001101
0001111001101101000101111000101101
0011011001101000000100110001001110
000011101001100101100001010010
VizTree - Motivation
16
Introduction
Background
Time Series data mining tasks
Visualizing Time Series
VizTree
Evaluation
Conclusion- The strings represented in the tree are in fact “subsequences”
rather than “suffixes”.
- Using a time-series discretization method.
- Given the same parameters, the tree has the same overall
shape for any dataset.
Fig 9. VizTree Tool
Discretizing time series method
17
Introduction
Background
Time Series data mining tasks
Visualizing Time Series
VizTree
Evaluation
Conclusion
SAX
Symbolic Aggregate ApproXimation
baabccbc
18
Introduction
Background
Time Series data mining tasks
Visualizing Time Series
VizTree
Evaluation
Conclusion
Discretizing time series method
Convert
time series
to PAA
Convert PAA
to symbols
PAA = Piecewise Aggregate Approximation
Fig 10. A summarization of the notation used
19
Introduction
Background
Time Series data mining tasks
Visualizing Time Series
VizTree
Evaluation
Conclusion
Discretizing time series method
Fig 11. A time series dataset of electrical consumption (of length 1024) is
converted into an eight-symbol string “acdcbdba”. Note that the general
shape is the time series is preserved, in spite of the massive amount of
dimensionality reduction.
20
Introduction
Background
Time Series data mining tasks
Visualizing Time Series
VizTree
Evaluation
Conclusion
VizTree – First Look
Fig 12. A screenshot of VizTree
The parameter
setting area
The actual
subsequence
when the
technician clicks
on a branch
The input time series
The subsequence
tree for the time
series
Zoom-in window
VizTree
21
 Motifs Discovery
 Anomaly Detection
 Diff-Tree (Surprising Patterns)
Introduction
Background
Time Series data mining tasks
Visualizing Time Series
VizTree
Evaluation
Conclusion
22
Introduction
Background
Time Series data mining tasks
Visualizing Time Series
VizTree
Evaluation
Conclusion
Motif Discovery
Fig 13. Example of Motif discovery on the winding dataset. Two nearly identical
subsequences are identified, among the other motifs.
23
Introduction
Background
Time Series data mining tasks
Visualizing Time Series
VizTree
Evaluation
Conclusion
Anomaly Detection
Fig 14. Heart-beat data with anomaly is shown. While the subsequence tree can be
used to identify motifs, it can be used for simple anomaly detection as well.
24
Introduction
Background
Time Series data mining tasks
Visualizing Time Series
VizTree
Evaluation
Conclusion
Diff-Tree (Surprising Patterns)
Fig 15. The blue ECG data is the reference data and the green ECG data is the testing
data. The resulting tree show the difference in pattern distributions of two datasets. The
surprising patterns are ranked with the red one.
25
Introduction
Background
Time Series data mining tasks
Visualizing Time Series
VizTree
Evaluation
Conclusion
Evaluation
 Subsequence Matching & Motifs Discovery: Human
motion data of Yoga Postures
 Anomaly Detection: Power consumption data
26
Introduction
Background
Time Series data mining tasks
Visualizing Time Series
VizTree
Evaluation
Conclusion
Yoga Postures – Subsequence Matching
- A model postured yoga routines in front of a green screen.
- The motion capture is transformed into a time series.
- The length of the time series is approximately 26.000.
Fig 16. The sample yoga sequence that we are interested in finding
27
Introduction
Background
Time Series data mining tasks
Visualizing Time Series
VizTree
Evaluation
Conclusion
Yoga Postures – Subsequence Matching
- A model postured yoga routines in front of a green screen.
- The motion capture is transformed into a time series.
- The length of the time series is approximately 26.000.
Fig 17. Matches for the yoga sequence. The
bottom right corner shows how similar
these two subsequences are
28
Introduction
Background
Time Series data mining tasks
Visualizing Time Series
VizTree
Evaluation
Conclusion
Yoga Postures – Motif Discovery
- Identify approximately motifs by examining the subsequences
represented by thick three paths.
Fig 18. Example of Motifs discovery
on the winding dataset. Two nearly
identical subsequences are identified,
among the other motifs.
29
Introduction
Background
Time Series data mining tasks
Visualizing Time Series
VizTree
Evaluation
Conclusion
Power Consumption – Anomaly Detection
- Electricity consumption is recorded every 15 minutes, in 1997
Fig 19. Anomaly detection on power
consumption data. The anomaly
shown here is a short week during
Christmas.
30
Introduction
Background
Time Series data mining tasks
Visualizing Time Series
VizTree
Evaluation
Conclusion
Conclusion
- Proposed VizTree as a visualization framework for massive
time series datasets.
- Mining and monitoring purposes.
- Process new data arrive.
Thank you!

More Related Content

PPTX
Time series data mining techniques
PDF
Time series-mining-slides
PDF
Table of Useful R commands.
PDF
Using Principal Component Analysis to Remove Correlated Signal from Astronomi...
PPTX
Principal component analysis
PDF
Graph Based Clustering
PDF
Principal component analysis and matrix factorizations for learning (part 1) ...
PDF
Introduction to spatstat
Time series data mining techniques
Time series-mining-slides
Table of Useful R commands.
Using Principal Component Analysis to Remove Correlated Signal from Astronomi...
Principal component analysis
Graph Based Clustering
Principal component analysis and matrix factorizations for learning (part 1) ...
Introduction to spatstat

What's hot (20)

PDF
Chaos Suppression and Stabilization of Generalized Liu Chaotic Control System
PPTX
Clustering techniques
PDF
CLIM Program: Remote Sensing Workshop, Optimization for Distributed Data Syst...
PPT
The study on mining temporal patterns and related applications in dynamic soc...
PDF
Ml srhwt-machine-learning-based-superlative-rapid-haar-wavelet-transformation...
PPT
5.4 randomized datastructures
PDF
Anti-differentiating approximation algorithms: A case study with min-cuts, sp...
PDF
Machine learning (11)
PDF
My presentation at University of Nottingham "Fast low-rank methods for solvin...
PDF
Program on Mathematical and Statistical Methods for Climate and the Earth Sys...
PDF
Neural Networks: Principal Component Analysis (PCA)
PDF
Tensorizing Neural Network
PPTX
presentation_btp
PDF
PSF_Introduction_to_R_Package_for_Pattern_Sequence (1)
PDF
Hyperparameter optimization with approximate gradient
PDF
Smooth Pinball based Quantile Neural Network
PDF
A General Framework for Enhancing Prediction Performance on Time Series Data
PDF
Download-manuals-water quality-wq-training-44howtocarryoutcorrelationandspec...
PDF
Exploring the feature space of large collections of time series
Chaos Suppression and Stabilization of Generalized Liu Chaotic Control System
Clustering techniques
CLIM Program: Remote Sensing Workshop, Optimization for Distributed Data Syst...
The study on mining temporal patterns and related applications in dynamic soc...
Ml srhwt-machine-learning-based-superlative-rapid-haar-wavelet-transformation...
5.4 randomized datastructures
Anti-differentiating approximation algorithms: A case study with min-cuts, sp...
Machine learning (11)
My presentation at University of Nottingham "Fast low-rank methods for solvin...
Program on Mathematical and Statistical Methods for Climate and the Earth Sys...
Neural Networks: Principal Component Analysis (PCA)
Tensorizing Neural Network
presentation_btp
PSF_Introduction_to_R_Package_for_Pattern_Sequence (1)
Hyperparameter optimization with approximate gradient
Smooth Pinball based Quantile Neural Network
A General Framework for Enhancing Prediction Performance on Time Series Data
Download-manuals-water quality-wq-training-44howtocarryoutcorrelationandspec...
Exploring the feature space of large collections of time series
Ad

Similar to [PDF] Visualizing and discovering non trivial patterns in large time-series databases (20)

PDF
Visualization of big time series data
PPT
20IT501_DWDM_PPT_Unit_V.ppt
PDF
01-pengantar.pdf
PPTX
Time series
PDF
Una introducción a la minería de series temporales
PDF
OBJECT IDENTIFICATION
PDF
0912f50eedb48e44d7000000
PDF
S01732110114
PDF
Frequent Pattern Mining with Serialization and De-Serialization
PDF
S01732110114
PPTX
Masters Thesis Defense Presentation
PDF
International Journal of Engineering Research and Development (IJERD)
PDF
Reproducibility for IR evaluation
PDF
Reproducibility for IR evaluation
PDF
solved mcq- project cycle ARTIFICIAL INTELLIGENCE.pdf
PPTX
Seminar -I PPT Vivek RT-Object Detection.pptx
PDF
AUDIBERT_Julien_2021.pdf
PPTX
2019 Project Showcase - Alexander Adam Laurence
PDF
The Heatmap
 - Why is Security Visualization so Hard?
PDF
How Semantic Technologies can help to cure Hearing Loss?
Visualization of big time series data
20IT501_DWDM_PPT_Unit_V.ppt
01-pengantar.pdf
Time series
Una introducción a la minería de series temporales
OBJECT IDENTIFICATION
0912f50eedb48e44d7000000
S01732110114
Frequent Pattern Mining with Serialization and De-Serialization
S01732110114
Masters Thesis Defense Presentation
International Journal of Engineering Research and Development (IJERD)
Reproducibility for IR evaluation
solved mcq- project cycle ARTIFICIAL INTELLIGENCE.pdf
Seminar -I PPT Vivek RT-Object Detection.pptx
AUDIBERT_Julien_2021.pdf
2019 Project Showcase - Alexander Adam Laurence
The Heatmap
 - Why is Security Visualization so Hard?
How Semantic Technologies can help to cure Hearing Loss?
Ad

Recently uploaded (20)

PDF
TFEC-4-2020-Design-Guide-for-Timber-Roof-Trusses.pdf
PPTX
Internet of Things (IOT) - A guide to understanding
PPT
CRASH COURSE IN ALTERNATIVE PLUMBING CLASS
PPTX
FINAL REVIEW FOR COPD DIANOSIS FOR PULMONARY DISEASE.pptx
PPTX
bas. eng. economics group 4 presentation 1.pptx
PPTX
Geodesy 1.pptx...............................................
PPTX
web development for engineering and engineering
PDF
Enhancing Cyber Defense Against Zero-Day Attacks using Ensemble Neural Networks
PPTX
Welding lecture in detail for understanding
PDF
Mohammad Mahdi Farshadian CV - Prospective PhD Student 2026
PDF
R24 SURVEYING LAB MANUAL for civil enggi
PDF
Well-logging-methods_new................
DOCX
573137875-Attendance-Management-System-original
PPTX
IOT PPTs Week 10 Lecture Material.pptx of NPTEL Smart Cities contd
PDF
SM_6th-Sem__Cse_Internet-of-Things.pdf IOT
PPTX
M Tech Sem 1 Civil Engineering Environmental Sciences.pptx
PDF
Evaluating the Democratization of the Turkish Armed Forces from a Normative P...
PPTX
CARTOGRAPHY AND GEOINFORMATION VISUALIZATION chapter1 NPTE (2).pptx
PDF
BMEC211 - INTRODUCTION TO MECHATRONICS-1.pdf
PDF
Mitigating Risks through Effective Management for Enhancing Organizational Pe...
TFEC-4-2020-Design-Guide-for-Timber-Roof-Trusses.pdf
Internet of Things (IOT) - A guide to understanding
CRASH COURSE IN ALTERNATIVE PLUMBING CLASS
FINAL REVIEW FOR COPD DIANOSIS FOR PULMONARY DISEASE.pptx
bas. eng. economics group 4 presentation 1.pptx
Geodesy 1.pptx...............................................
web development for engineering and engineering
Enhancing Cyber Defense Against Zero-Day Attacks using Ensemble Neural Networks
Welding lecture in detail for understanding
Mohammad Mahdi Farshadian CV - Prospective PhD Student 2026
R24 SURVEYING LAB MANUAL for civil enggi
Well-logging-methods_new................
573137875-Attendance-Management-System-original
IOT PPTs Week 10 Lecture Material.pptx of NPTEL Smart Cities contd
SM_6th-Sem__Cse_Internet-of-Things.pdf IOT
M Tech Sem 1 Civil Engineering Environmental Sciences.pptx
Evaluating the Democratization of the Turkish Armed Forces from a Normative P...
CARTOGRAPHY AND GEOINFORMATION VISUALIZATION chapter1 NPTE (2).pptx
BMEC211 - INTRODUCTION TO MECHATRONICS-1.pdf
Mitigating Risks through Effective Management for Enhancing Organizational Pe...

[PDF] Visualizing and discovering non trivial patterns in large time-series databases

  • 1. Visualizing and Discovering Non-Trivial Patterns in Large Time Series Databases Quan Le HCI Lab 23th Mar, 2015 Jessica Lin, Eamonn Keogh, Stefano Lonardi, Jeffrey P. Lankford, Daonna M. Nystrom Computer Science & Engineering Department University of California, Riverside, CA 92521 Proceedings of the 30th VLDB Conference, Toronto, Canada, 2004
  • 2. Contents  Introduction  Background  Time series data mining tasks  Visualizing Time Series  VizTree  Evaluation  Conclusion 2 Fig 1. Time Series Visualization
  • 3. Introduction Introduction Background Time Series data mining tasks Visualizing Time Series VizTree Evaluation Conclusion- Data visualization techniques are very important for data analysis. - Visualizing massive time series datasets. - VizTree – a time series pattern discovery and visualization system based on augment suffix trees.  Occurring pattern (Motif Discovery)  Surprising Pattern (Anomaly Discovery)  Query by content  Measures the dissimilarity between any two time series 3
  • 4. Introduction Introduction Background Time Series data mining tasks Visualizing Time Series VizTree Evaluation Conclusion- DoD – The U.S Department of Defense and The Aerospace Corp (TAC) - There are two major directions of research area:  Producing better technique to mine the archival launch data from previous missions (mining stage).  Producing better techniques to visualize the streaming telemetry data in the hours before launch (monitor stage) - Dr. Ben Shneiderman of Uni. of Maryland – “Overview, zoom & filter, details-on-demand”. 4
  • 5. Background  Time Series data mining tasks  Visualization Time Series 5 Introduction Background Time Series data mining tasks Visualizing Time Series VizTree Evaluation Conclusion
  • 6. Time Series data mining tasks  Subsequence matching  Motifs Discovery  Anomaly detection 6 Introduction Background Time Series data mining tasks Visualizing Time Series VizTree Evaluation Conclusion
  • 7. Subsequence Matching - Sequence matching has long been divided into two categories: whole matching and subsequence matching. - Subsequence matching: a short query subsequence time series is matched against longer time series by sliding it along the longer sequence, looking for the best matching location. - Chunking – the process where a time series is broken into individual time series by either specific period. 7 Introduction Background Time Series data mining tasks Visualizing Time Series VizTree Evaluation Conclusion Fig 2. A weekly map of drought conditions in Texas
  • 8. Time Series Motif Discovery - A substantial body of literature has been devoted to techniques to discover frequently recurring, overrepresented patterns in time series. 8 Introduction Background Time Series data mining tasks Visualizing Time Series VizTree Evaluation Conclusion Fig 3. Time series Subsequence Motifs Discovery
  • 9. Anomaly Detection 9 Introduction Background Time Series data mining tasks Visualizing Time Series VizTree Evaluation Conclusion- The problem of detecting anomalous/surprising patterns has attracted much attention. - Keogh’s definition – “whose frequently of occurrences differs substantially from that expected or given previously seen data”. Fig 4. Illustration of Anomalous Series Detection ( Red represents anomalous time series)
  • 10. Visualizing Time Series 10 Introduction Background Time Series data mining tasks Visualizing Time Series VizTree Evaluation Conclusion TimeSearcher  Cluster and Calendar-based visualization  Spirals
  • 11. TimeSearcher 11 Introduction Background Time Series data mining tasks Visualizing Time Series VizTree Evaluation Conclusion- A time series exploratory and visualization tool that allows user to retrieve time series by creating queries. Fig 5. The TimeSearcher visual query interface. User can filter away sequence that are not interesting by insisting that all sequences have at least on data point within the query box. http://www.cs.umd.edu/hcil/timesearcher/vide os/TimeSearcherDemo.mp4  Flexibility  Specify different regions to compare.
  • 12. Cluster and Calendar-based visualization 12 Introduction Background Time Series data mining tasks Visualizing Time Series VizTree Evaluation Conclusion- The time series data are chunked into sequences of day patterns. - This visualization system displays patterns represented calendar with each day color-coded by the cluster that it belongs to. Fig 6. The cluster and calendar-based visualization on employee working hours data. It shows 6 clusters, representing different working day patterns.  Good overview  Limited to calendar- based data
  • 13. Spirals 13 Introduction Background Time Series data mining tasks Visualizing Time Series VizTree Evaluation Conclusion- Weber developed this tool to visualize time series on spirals. - Identify periodic structures in the data. - Do not exhibit periodic behaviors of time series data. - Requires pixel space in length of time series. Fig 7. The Spiral visualization approach of Weber applied to the power usage dataset
  • 14. VizTree - Motivation 14 Introduction Background Time Series data mining tasks Visualizing Time Series VizTree Evaluation Conclusion Here are two sets of bit strings. Which set is generated by human and which one is generated by a computer? 0101100101111001101001000010001010 0110110101110000101010111011111000 1101101101111110100110010010001101 0001111001101101000101111000101101 0011011001101000000100110001001110 000011101001100101100001010010 1000100010100100010101010000101010 0010101110111101011010010111010010 1010011101010101001010010101011101 0101001010101011010101001011001011 1011110100011100001010000100111010 100011100001010101100101110101
  • 15. VizTree - Motivation 15 Introduction Background Time Series data mining tasks Visualizing Time Series VizTree Evaluation Conclusion Fig 8. (Left) Computer-generated random bits presented as an augmented suffix tree. (Right) Human-constructed bits presented as an augmented suffix tree. 0 1 (0,1,0) (1,0,1) (0,1,1) 1000100010100100010101010000101010 0010101110111101011010010111010010 1010011101010101001010010101011101 0101001010101011010101001011001011 1011110100011100001010000100111010 100011100001010101100101110101 0101100101111001101001000010001010 0110110101110000101010111011111000 1101101101111110100110010010001101 0001111001101101000101111000101101 0011011001101000000100110001001110 000011101001100101100001010010
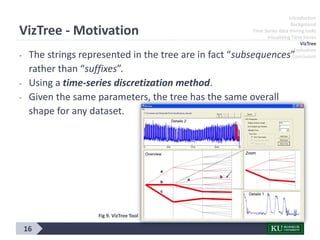
  • 16. VizTree - Motivation 16 Introduction Background Time Series data mining tasks Visualizing Time Series VizTree Evaluation Conclusion- The strings represented in the tree are in fact “subsequences” rather than “suffixes”. - Using a time-series discretization method. - Given the same parameters, the tree has the same overall shape for any dataset. Fig 9. VizTree Tool
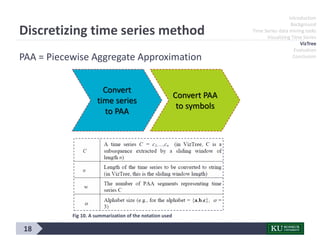
  • 17. Discretizing time series method 17 Introduction Background Time Series data mining tasks Visualizing Time Series VizTree Evaluation Conclusion SAX Symbolic Aggregate ApproXimation baabccbc
  • 18. 18 Introduction Background Time Series data mining tasks Visualizing Time Series VizTree Evaluation Conclusion Discretizing time series method Convert time series to PAA Convert PAA to symbols PAA = Piecewise Aggregate Approximation Fig 10. A summarization of the notation used
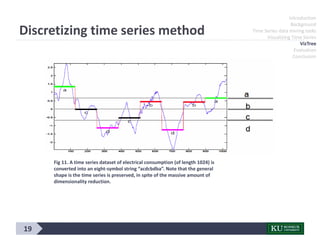
  • 19. 19 Introduction Background Time Series data mining tasks Visualizing Time Series VizTree Evaluation Conclusion Discretizing time series method Fig 11. A time series dataset of electrical consumption (of length 1024) is converted into an eight-symbol string “acdcbdba”. Note that the general shape is the time series is preserved, in spite of the massive amount of dimensionality reduction.
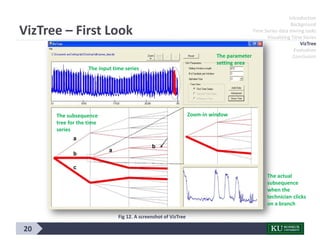
  • 20. 20 Introduction Background Time Series data mining tasks Visualizing Time Series VizTree Evaluation Conclusion VizTree – First Look Fig 12. A screenshot of VizTree The parameter setting area The actual subsequence when the technician clicks on a branch The input time series The subsequence tree for the time series Zoom-in window
  • 21. VizTree 21  Motifs Discovery  Anomaly Detection  Diff-Tree (Surprising Patterns) Introduction Background Time Series data mining tasks Visualizing Time Series VizTree Evaluation Conclusion
  • 22. 22 Introduction Background Time Series data mining tasks Visualizing Time Series VizTree Evaluation Conclusion Motif Discovery Fig 13. Example of Motif discovery on the winding dataset. Two nearly identical subsequences are identified, among the other motifs.
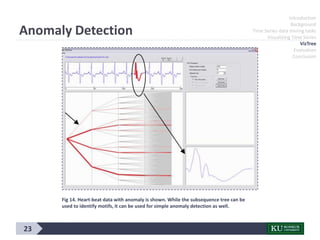
  • 23. 23 Introduction Background Time Series data mining tasks Visualizing Time Series VizTree Evaluation Conclusion Anomaly Detection Fig 14. Heart-beat data with anomaly is shown. While the subsequence tree can be used to identify motifs, it can be used for simple anomaly detection as well.
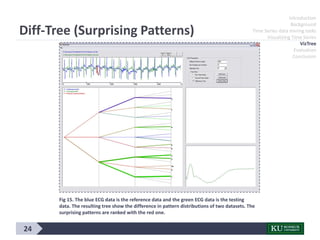
  • 24. 24 Introduction Background Time Series data mining tasks Visualizing Time Series VizTree Evaluation Conclusion Diff-Tree (Surprising Patterns) Fig 15. The blue ECG data is the reference data and the green ECG data is the testing data. The resulting tree show the difference in pattern distributions of two datasets. The surprising patterns are ranked with the red one.
  • 25. 25 Introduction Background Time Series data mining tasks Visualizing Time Series VizTree Evaluation Conclusion Evaluation  Subsequence Matching & Motifs Discovery: Human motion data of Yoga Postures  Anomaly Detection: Power consumption data
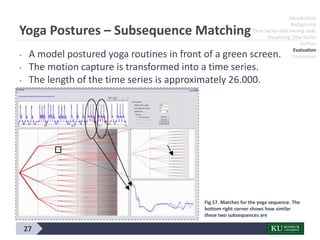
  • 26. 26 Introduction Background Time Series data mining tasks Visualizing Time Series VizTree Evaluation Conclusion Yoga Postures – Subsequence Matching - A model postured yoga routines in front of a green screen. - The motion capture is transformed into a time series. - The length of the time series is approximately 26.000. Fig 16. The sample yoga sequence that we are interested in finding
  • 27. 27 Introduction Background Time Series data mining tasks Visualizing Time Series VizTree Evaluation Conclusion Yoga Postures – Subsequence Matching - A model postured yoga routines in front of a green screen. - The motion capture is transformed into a time series. - The length of the time series is approximately 26.000. Fig 17. Matches for the yoga sequence. The bottom right corner shows how similar these two subsequences are
  • 28. 28 Introduction Background Time Series data mining tasks Visualizing Time Series VizTree Evaluation Conclusion Yoga Postures – Motif Discovery - Identify approximately motifs by examining the subsequences represented by thick three paths. Fig 18. Example of Motifs discovery on the winding dataset. Two nearly identical subsequences are identified, among the other motifs.
  • 29. 29 Introduction Background Time Series data mining tasks Visualizing Time Series VizTree Evaluation Conclusion Power Consumption – Anomaly Detection - Electricity consumption is recorded every 15 minutes, in 1997 Fig 19. Anomaly detection on power consumption data. The anomaly shown here is a short week during Christmas.
  • 30. 30 Introduction Background Time Series data mining tasks Visualizing Time Series VizTree Evaluation Conclusion Conclusion - Proposed VizTree as a visualization framework for massive time series datasets. - Mining and monitoring purposes. - Process new data arrive.