SlideShare a Scribd company logo
QUANTITATIVE AND ASSET MANAGEMENT
WORKSHOP 2016
Combining F-atoms with A-atoms to exploit investment opportunities
around global economies
Gianni POLA,PhD
Senior Portfolio Manager– Head of Quantitative Research
Multiasset& MultimanagerDivision
ANIMA SGR
25-26 Febbraio - Marittima Centro Congressi Terminal 103 - Venezia
ANIMA - highlights
Source: ANIMA; as ofDec31st, 2015
AuM
66.9
€ bn
#1
Largest independent asset manager inItaly
 €67 bn of Assets under management and 1 million customers
 Anima Holding: a public company, listed on Borsa Italiana (ANIM:IM)
Distinctiveinvestmentexpertise
 Over 50 professionals in portfolio managementand productengineering based in
Milan and Dublin
 Excellent track record both on relative and absolute return products
Highly effectivedistributionnetwork
 Long term strategic partnerships with 4 banking groups
 Long term commercial agreement with Poste Italiane
 Over 130 distribution agreements with banks and FA networks
Unique business model
 An integrated platformof tools and services for distribution partners/networks
 Over 50 professionals dedicated to supportand services
2
ANIMA - highlights
2011
35.0
2012
40.7
2013
46.6
2014
57.1
Source: ANIMA -Total AuM, including assets delegatedto Third parties
Assets under Management (€bn)
2015
66.9
3
ANIMA - highlights
* Includes institutional andretaildiscretionary mandates
Source: ANIMA
Products Clients
Mutual funds/SICAV
Asset under Management, December 31st, 2015
100% = 66.9 €bn
Retail
Institutional
Asset under Management,December 31st, 2015
100% = 66.9 €bn
Individualportfolio management*
4
75%
25%
59%
41%
ANIMA – Multiasset & Multimanager Division
5
Investment philosophy Investment solutions & financial services
 Capital appreciation with low bias towards
macro environments
 to overcome adverse market conditions
 to catch up the risk-premia available in
the market
 Beta investment on strategic horizon to get
exposure to risk premia
 Alpha strategies to tactically adapt the
asset allocation to changing regime in the
macro space
 Flagship product: multi-asset flexible
 unconstrainedapproach
 exposure to non-traditionalassets
 style: quant + discretionary
 risk profile:KIID 4 (vol.5% - 10%)
 Traditional (long-only) multiasset products
 Advisory to institutional clients
 measuringimplicit macro diversification
 enhancingdiversificationin asset
idiosyncraticriskby means of entropy
metrics
6
 A new paradigmfor asset allocation
 Assets are like molecules that can be
broken down in atoms of different
nature
 F-atoms refer to global and local
macro factors
 A-atoms refer to asset specific risk
7
 Are we risk-parity?
 we like the idea of balancingrisk
 BUT risk is not volatility,macro
risk is more relevant
 moreover traditionalrisk-parity
suffers from estimationrisk(Pola,
2014)
 This work develops further some
ideas previously published on
research papers by
 introducingthe local F-atoms
 enrichingthe investment
opportunity set with A-atoms
8
Unexpected returns
The recent crises have brought increasing
uncertainty in the exercise of forecastingexpected
returns due to:
 some market variables (interestrates)are in
uncharted territory
 non-conventionalmonetarypolicies ofCentral
Banks
 recent fallingoil prices & China slowdown
The uniquenessof the level reached by many financial variablesshould at least convince us to lower
our confidence on predictabilityof asset risk premia (see de Laguiche & Pola,2012)
0
2
4
6
8
10
12
14
16
1790
1800
1810
1820
1830
1840
1850
1860
1870
1880
1890
1900
1910
1920
1930
1940
1950
1960
1970
1980
1990
2000
2010
US 10 yrs bond yield
Source: GLOBALFINANCIAL DATA
9
Academia & Research Industry
 Bayesian approaches (e.g. Black &
Litterman, 1990)
 Robust Allocations (Tütüncü & Koenig,
2004)
 Robust Bayesian Allocations (Meucci,
2011)
 Forecast-free investment solutions
(minimum variance, maximum
diversification, and risk-parity; Russo,
2013)
 Entropy-based diversified portfolios
(Meucci, 2009; Pola, 2013c; Pola,
2014; Pola, 2016)
 Factor Investing (Fama & French,
1992; Webster 2015)
 Global Macro Approach (Pola &
Facchinato, 2016)
How to handle uncertainty in portfolio
management?
10
Most of asset dynamics can be captured by
variations of levels of macro variables (growth and inflation)
and the risk-premia available in the market
“Markets move based on shifts in conditions relative to the conditions that are priced in”
(Bridgewater)
11
Practical implications on Asset Allocation
…
Robust Asset Allocationto navigateuncertainmarket conditions
Efficient investing on globaland localmacro themes
Hedging against the fallingoil prices or recent China slowdown
New insights in crisis management
Portfolio diagnosis for advisory activity
Deepening our understandingof asset correlation
12
Macro scenarios, and their quasi-ortogonality
rising
growth
falling
growth
rising
inflation
falling
inflation
rising
risk
premia
falling
risk
premia
 As variations of levels are more relevant
than levels themselves we define rising
and falling scenarios
  .
)()(
),(
log),()()(||),(
21, 21
21
212121 
ff fPfP
ffP
ffPfPfPffPD
* Analysis based on a non-parametric statisticaltest (Bootstrap-based) ontheKL pseudo-distance.
 We measured the “orthogonality” of factors
via the Kullback-Leibler pseudo distance:
 Factors are not strictly-orthogonal*,
however we prefer to work with quasi-
orthogonal axes that are stable over time
and easily related to macroeconomic
dynamics
13
Asset sensitivity to macro dynamics.
A Conceptual Experiment
▪ NOMINAL BONDS
▪ INFLATION BONDS
▪ EQUITY
▪ GOLD
▪ OIL
▪ INFRASTRUCTURE
▪ CREDIT IG
▪ CREDIT HY
▪ EMERGING EQUITY
▪ EMERGING DEBT
▪ CURRENCIES
▪ HFs
▪ CTAs
▪ PRIVATE EQUITY
▪ REAL ESTATE
DECELERATING
GROWTH
INFLATION
DISINFLATION
14
Polarization Analysis.
Let’s start with the S&P 500 (1/2)
1
10
100
1000
10000
100000
1000000
10000000
100000000
1800
1805
1810
1815
1820
1825
1830
1835
1840
1845
1850
1855
1860
1865
1870
1875
1880
1885
1890
1895
1900
1905
1910
1915
1920
1925
1930
1935
1940
1945
1950
1955
1960
1965
1970
1975
1980
1985
1990
1995
2000
2005
2010
2015
S&P 500 (total return) from 1/1800 to 1/2016
Source: GLOBALFINANCIAL DATA
Computationsfrom ANIMA–Multiasset &Multimanager Division
15
Polarization Analysis.
Let’s start with the S&P 500 (2/2)
0.00%
0.50%
1.00%
1.50%
2.00%
2.50%
3.00%
3.50%
whole
sample
rising
growth
falling
growth
rising
inflation
falling
inflation
Averagequarterly excess returnof S&P500 overrisk-free
conditional tomacro scenarios
G I
Source: GLOBALFINANCIAL DATA & Fama-French Website
Computationsfrom ANIMA–Multiasset &Multimanager Division
16
Polarization Analysis.
An indicator to measure asset sensitivity
 Is the result statistically robust?
 The polarization coefficient P (parametric and non-parametric approaches) to evaluate
asset sensitivity to macro factors
 Main properties are:
 P is in-between -1 and +1
 sign(P) indicates preference for rising or falling scenario
 abs(P) quantifies the probability to polarize
 The polarization coefficients for the S&P 500 are:
 growth +99.27%
 inflation -81.10%
Source: GLOBALFINANCIAL DATA & Fama-French Website
Computationsfrom ANIMA–Multiasset &Multimanager Division
Looking intrasectors
17
Asset Segmentation (1/2)
119 assets inthe US including traditional and
alternativeassetclasses
 Nominal bonds
 Inflation-linked bonds
 Credit market (IG, HY, EMDH, EMDL)
 Zero-duration Creditmarket
 Equity sectors & styles
 Equity sectors & styles – beta-neutral
 Currencies
 Volatility
 Commodity
 Hedge-fund strategies & trend followers
Clustering AnalysisonMacroSimilarity
Source: Bloomberg,Datastream, GLOBAL FINANCIAL DATA, Fama &Frenchwebsite
Computations from ANIMA – Multiasset & Multimanager Division. The dendrogram is a tree
diagram illustrating the clusters produced by a metric quantifying the “distance”among assets. It
has been obtained with standard algorithm provided by MathWorks. In particular the hierarchy
between asset classes has been derived according to a Minkowski metric with p=1 in the bi-
dimensional space spanned by the polarization coefficients on growth and inflation, and the
clustering protocol ofun-weighted averagedistance.
INFLATION-LINKEDBOND
NOMINALBOND
EQUITY
COMMODITY
18
Asset Segmentation (2/2)
Clustering AnalysisonMacroSimilarity
G+ I-
 Equity
 Equity Financials,
Utilities, Industrials
 …
G+ I+
 OIL
 Industrial Metals
 Equity Energy, Material
 Emerging Debt Local
currency
 Commodity currencies
 …
G- I-
 Nominal Bonds
 Credit IG
 CTAs
 VIX
 …
G- I+
 Inflation linked bonds
G
I
19
Polarization Analysis.
Beyond Asset Returns (1/2)
DECELERATING
GROWTH
INFLATION
DISINFLATION
return distribution
20
Polarization Analysis.
Beyond Asset Returns (2/2)
Moments of the return distribution of the S&P 500 conditioned to macro scenarios (excess return
over risk-free and quarterly frequency)
whole sample risinggrowth fallinggrowth risinginflation fallinginflation
mean 1.70% 2.87% 0.56% 1.31% 2.11%
standarddeviation 7.98% 7.93% 7.90% 7.49% 8.48%
skewness -0.59 -0.50 -0.72 -0.57 -0.64
kurtosis 3.94 3.66 4.27 4.42 3.68
Source: GLOBALFINANCIAL DATA
Computationsfrom ANIMA–Multiasset &Multimanager Division
21
Constructing the F-atoms
GLOBAL
INFLATION
GLOBAL
RISK
PREMIA
(MN ptf)
GLOBAL
GROWTH
Three macro axes
 Risk Premia (MN ptf)
 Growth
 Inflation
LOCAL
INFLATION
LOCAL
RISK
PREMIA
LOCAL
GROWTH
7 geographical axes +
1 global
 Global
 US
 Canada
 Eurozone
 UK
 Japan
 Australia
 Emerging
22
F-atoms, 2011
Focus on Global, US and Eurozone Risk Premia (MN ptf)
Source: Bloomberg
Computationsfrom ANIMA–Multiasset &Multimanager Division
23
F-atoms, 2015
Focus on Global, US and Eurozone Risk Premia (MN ptf)
Source: Bloomberg
Computationsfrom ANIMA–Multiasset &Multimanager Division
24
F-atoms, YtD as of February 3rd, 2016
-8.00%
-3.00%
2.00%
GLOBAL US CANADA EURO UK JAPAN AUSTRALIA
Risk Premia (MN ptf)
-8.00%
-3.00%
2.00%
GLOBAL US CANADA EURO UK JAPAN AUSTRALIA
Growth
-8.00%
-3.00%
2.00%
GLOBAL US CANADA EURO UK JAPAN AUSTRALIA
Inflation
Source: Bloomberg
Computationsfrom ANIMA–Multiasset &Multimanager Division
25
F-atoms, Draghi speech on December 3rd, 2015
-3.50%
-1.50%
GLOBAL US CANADA EURO UK JAPAN AUSTRALIA
Risk Premia (MN ptf)
-3.50%
-1.50%
0.50%
GLOBAL US CANADA EURO UK JAPAN AUSTRALIA
Growth
-3.50%
-1.50%
0.50%
GLOBAL US CANADA EURO UK JAPAN AUSTRALIA
Inflation
Source: Bloomberg
Computationsfrom ANIMA–Multiasset &Multimanager Division
26
Correlation among F-atoms:
Unconditional VS Conditional to Stress Environments*
Source: Bloomberg
Computations from ANIMA – Multiasset& Multimanager Division.Time-series (daily) from31/12/1997 to 5/2/2016.
*Stress environments include:the Russian defaultand collapseof LTMC (7/98, 9/98), Dot-com bubble burst(3/00, 3/01), 9/11 and market downturn of 2002 (9/01,
2/03), US subprimeand collapseof Lehman (9/08, 3/09), Euro Sovereign Debt crisis 1 (3/10,9/10), Euro Sovereign Debt crisis 2 (5/11,6/11), Taper Tantrum (5/13,
6/13), Greek Debt crisis (9/14,5/15),China slowdown (5/15, 8/15)
conditional to stress
environments*
unconditional
 Correlation are stable over crisis
environments
 Inflation dynamics across countries
were more heterogeneous (avg corr
0.15) with respect to risk-premia (avg
corr 0.41) and growth (avg corr 0.48)
27
Why introducing the A-atoms component?
 Main investment motivations are
 to include specific investment themes (e.g. robotics, automobile sectors, …)
 sometimes and in specific market conditions idiosyncratic risk plays a central
role (e.g. CHF, Volkswagen, Italian Banks, …)
 Main benefits:
 it diversifies the model risk embedded in the F-atoms construction
 it makes our approach more flexible to generate decorrelated alpha
 A-atoms construction is based on entropy metrics that balance high convinction bets
with market uncertainty
28
Factor
analysis
Macro-
Neutral
portfolio
Risk
premium
Macro
outlook
Alpha
generation
Macro-diversified
active portfolio
 Understanding the
key global and local
macro factors
 Growth, Inflation,
Risk Premium
 Diversifying
macro factors
and idiosyncratic
risk
 Embracing macro
dynamics
 Managing risk
premiumexposure
A
C
D
B
E
Anima Global Macro Diversified.
The investment process
Portfolio diagnosis: the 60/40
29
Capital Allocation
A 60/40 allocation with a euro bias (50% euro +
50% global)
Portfolio diagnosis
 Globalfactors explain 83%of theportfolio
variance, adding localadjstumentswereach
87%
 87% can bebroken down as follows:
5%
29%
15%
Bond Euro (20%) Bond Global (20%)
Equity Euro (30%) Equity Global (30%)
GLOBAL RISK-PREMIA (47%) LOCAL (ADJ) RISK-PREMIA (4%)
GLOBAL GROWTH (27%) LOCAL (ADJ) GROWTH (15%)
GLOBAL INFLATION (7%) LOCAL (ADJ) INFLATION (0.1%)
Source: Bloomberg
Computations from ANIMA –Multiasset &Multimanager Division
Portfolio allocatedin jpmgemlc,jhucgbig, msdlemu, mxwo.
Timeseries from31/12/1997to 31/12/2015(monthly obs).
Conclusions
 F-atoms and A-atoms are the building blocks of asset returns, they are
complementary as they diversify
 the investment opportunityset
 the model risk
 The ANIMA Global Macro approach is able
 to decipher complex patternsof many assets in terms of few factors
 to capture the market risk premium without being exposed to macroeconomic
dynamicsand asset idiosyncraticrisk
30
Main references
31
..
GLOBAL MACRO APPROACH
1.Pola,G.,& Facchinato,S.,2016.«CombiningF-atomswithA-atomsto exploitinvestmentopportunitiesaround global economies”,in preparation2016
2.Pola,G.,2013a.“Rethinking Strategic AssetAllocation interms of DiversificationAcross MacroeconomicScenarios”,Amundi Cross AssetSpecialFocus May 2013
3.Pola,G.,2013b.“Managinguncertaintywith DAMS.Assetsegmentation in responseto macroeconomic changes”,Amundi Working PaperWP-034-2013
4. Pola, G., & Facchinato, S., 2014. “Managing uncertainty with DAMS: from Asset Segmentation to Portfolio Management”, AMUNDI Discussion Paper DP-06-
2014
5. Pola, G., & Facchinato, S., 2015. “Factor investing through DAMS: from Asset Segmentation to Portfolio Management”, AMUNDI Cross Asset Special Focus,
January 2015
6. Pola, G.,& Taze-bernard, E., 2015. . “Assetallocation in a context of falling oil prices: the case of institutions in commodity-exporting countries”, AMUNDI Cross
AssetSpecial Focus,January 2015
DIVERSIFICATION MEASURES &ESTIMATION RISK
7.Pola,G.,2016.“On entropy and portfolio diversification”,accepted forpublicationto Journal of AssetManagement,2016
8.Pola,G.,Zerrad,A.,Massoli,G.,Barucci,.E.,2016.“Theroleof estimationrisk inportfolio diversification”,in preparation2016
9.Pola,G.,& Nastaj,M.,2016. “On assetdependency and portfoliodiversification”, in preparation 2016
10.Pola,G.,& Gianni,M,2016. “Asset-basedAllocation vs.FactorInvesting:a differentperspective”, in preparation 2016
11. Pola, G., 2013c. “Diversification Measures for Portfolio Selection”, book chapter in "Stock Markets: Emergence, Macroeconomic Factors and Recent
Developments”,NOVA publisher(NewYork),2013
12.Pola,G.,2014.“Isyourportfolio effectivelydiversified? Various perspectives on portfoliodiversification”,Amundi Working PaperWP-040-2014
13.Pola,G.,& Zerrad,A.,2014.“Diversification,EntropyandtheInefficientFrontier”,Amundi Cross AssetSpecialFocus,April 2014
EXPECTEDRETURNS
14. de Laguiche, S., Pola, G., & Taze-bernard, E., 2013. . “Forecasting returns on assets in an environment of uncertainty”, AMUNDI Cross Asset Special Focus,
January 2013
15. de Laguiche, S., & G. Pola, 2012. “Unexpected Returns. Methodological Considerations on Expected Returns in Uncertainty”, Amundi Working Paper WP-032-
2012
16.deLaguiche,2014.“« Risk-free» assets:whatlong-termnormalized return? “,Amundi Discussion PaperDP-02-2014
Il presente materiale non può in nessun caso essere interpretato come consulenza, invito all’investimento, offerta o raccomandazione per l’acquisto o la vendita di strumenti
finanziari, né costituisce sollecitazione al pubblico risparmio. ANIMA è esonerata da qualsiasi responsabilità derivante da un uso improprio del presente materiale al pubblico,
effettuato in violazione delle disposizioni degli Organi di Vigilanza anche in materia di pubblicità. I rendimenti passati non sono indicativi di quelli futuri. Prima di aderire leggere
il Prospetto, disponibile presso la sede della società, i collocatori e sul sito www.animasgr.it.
This document is not intended to be an offer or solicitation, investment advice or recommendation for the purchase or sell any financial instruments and it cannot be disclosed to
third parties and/or distributed to the public.This is an informative report and its content is not intended and cannot be used improperly, also as advertising, for the placement
of any fund managed by ANIMA Sgr, accordingly to Italian law. The Company assumes the hereby given information as accurate and reliable, but it does not guarantee its
precision and it shaIlnot therefore be liable for its use by the addressees. Past performance is not indicative of future returns.
For detailed information, please consult the sales prospectusavailable at ANIMAHeadquarter, third partiesdistributorsand on our corporate website www.animasgr.it.

More Related Content

PPT
FIXatdl and the 2010 Flash Crash presented at Princeton Qwafafew
PPTX
Financial Risk Mgt - Lec 2 by Dr. Syed Muhammad Ali Tirmizi
PDF
[EN] A detailed look at the treatment of convertible bonds under the new Solv...
PDF
[EN] The use of convertible bonds in the asset allocation process
PDF
[EN] Strategy Brief / Global Convertible Opportunities / December 2015
PDF
European Additional Tier 1 CoCo Bonds Market
PDF
Credit Default Models
PDF
VaR Methodologies Jp Morgan
FIXatdl and the 2010 Flash Crash presented at Princeton Qwafafew
Financial Risk Mgt - Lec 2 by Dr. Syed Muhammad Ali Tirmizi
[EN] A detailed look at the treatment of convertible bonds under the new Solv...
[EN] The use of convertible bonds in the asset allocation process
[EN] Strategy Brief / Global Convertible Opportunities / December 2015
European Additional Tier 1 CoCo Bonds Market
Credit Default Models
VaR Methodologies Jp Morgan

Viewers also liked (6)

DOCX
Foundation Paper Revisions and Reflection - E Valdivia
PDF
Portfolios and Risk Premia for the Long Run
PDF
EDHEC_Publication_Factor_Investing_and_Risk_Allocation
PPT
Monte Carlo Simulations
PDF
Monte carlo simulation
PPTX
Merger & acquisition with case study
Foundation Paper Revisions and Reflection - E Valdivia
Portfolios and Risk Premia for the Long Run
EDHEC_Publication_Factor_Investing_and_Risk_Allocation
Monte Carlo Simulations
Monte carlo simulation
Merger & acquisition with case study
Ad

Similar to POLA_QUANT.IT_2016_v5 (20)

PDF
Qwafafew meeting 4
PDF
Quantifi newsletter Insight autumn 2015
PDF
Quant BC Fund
PDF
eltonpickford-data
PDF
IPE Article
PDF
Financial Intermediation Resource allocation and macroeconomic interdependence
PDF
Preparing for Resilience
PPTX
Insurability Of Natural Catastrophic Risks - 6th International Istanbul Insur...
PDF
Primer on Managed Futures
PDF
Introducing-the-Two-Sigma-Factor-Lens.10.18.pdf
PDF
Hedge Fund Liquidity Risk
PDF
Euro Dissolution Panel Discussion: Giving Treasury the Tools to Take the Lead
PDF
White paper risk management in exotic derivatives trading - ch cie gra
PDF
Risk management in exotic derivatives trading
PDF
White paper risk management in exotic derivatives trading - ch cie gra -- vdef
PDF
[UK] The use of convertible bonds in the asset allocation process
PDF
[JP] The use of convertible bonds in the asset allocation process
PDF
[LATAM EN] The use of convertible bonds in the asset allocation process
PDF
[CH] The use of convertible bonds in the asset allocation process
PDF
[LU] Mindscope / The use of convertible bonds in the asset allocation process
Qwafafew meeting 4
Quantifi newsletter Insight autumn 2015
Quant BC Fund
eltonpickford-data
IPE Article
Financial Intermediation Resource allocation and macroeconomic interdependence
Preparing for Resilience
Insurability Of Natural Catastrophic Risks - 6th International Istanbul Insur...
Primer on Managed Futures
Introducing-the-Two-Sigma-Factor-Lens.10.18.pdf
Hedge Fund Liquidity Risk
Euro Dissolution Panel Discussion: Giving Treasury the Tools to Take the Lead
White paper risk management in exotic derivatives trading - ch cie gra
Risk management in exotic derivatives trading
White paper risk management in exotic derivatives trading - ch cie gra -- vdef
[UK] The use of convertible bonds in the asset allocation process
[JP] The use of convertible bonds in the asset allocation process
[LATAM EN] The use of convertible bonds in the asset allocation process
[CH] The use of convertible bonds in the asset allocation process
[LU] Mindscope / The use of convertible bonds in the asset allocation process
Ad

POLA_QUANT.IT_2016_v5

  • 1. QUANTITATIVE AND ASSET MANAGEMENT WORKSHOP 2016 Combining F-atoms with A-atoms to exploit investment opportunities around global economies Gianni POLA,PhD Senior Portfolio Manager– Head of Quantitative Research Multiasset& MultimanagerDivision ANIMA SGR 25-26 Febbraio - Marittima Centro Congressi Terminal 103 - Venezia
  • 2. ANIMA - highlights Source: ANIMA; as ofDec31st, 2015 AuM 66.9 € bn #1 Largest independent asset manager inItaly  €67 bn of Assets under management and 1 million customers  Anima Holding: a public company, listed on Borsa Italiana (ANIM:IM) Distinctiveinvestmentexpertise  Over 50 professionals in portfolio managementand productengineering based in Milan and Dublin  Excellent track record both on relative and absolute return products Highly effectivedistributionnetwork  Long term strategic partnerships with 4 banking groups  Long term commercial agreement with Poste Italiane  Over 130 distribution agreements with banks and FA networks Unique business model  An integrated platformof tools and services for distribution partners/networks  Over 50 professionals dedicated to supportand services 2
  • 3. ANIMA - highlights 2011 35.0 2012 40.7 2013 46.6 2014 57.1 Source: ANIMA -Total AuM, including assets delegatedto Third parties Assets under Management (€bn) 2015 66.9 3
  • 4. ANIMA - highlights * Includes institutional andretaildiscretionary mandates Source: ANIMA Products Clients Mutual funds/SICAV Asset under Management, December 31st, 2015 100% = 66.9 €bn Retail Institutional Asset under Management,December 31st, 2015 100% = 66.9 €bn Individualportfolio management* 4 75% 25% 59% 41%
  • 5. ANIMA – Multiasset & Multimanager Division 5 Investment philosophy Investment solutions & financial services  Capital appreciation with low bias towards macro environments  to overcome adverse market conditions  to catch up the risk-premia available in the market  Beta investment on strategic horizon to get exposure to risk premia  Alpha strategies to tactically adapt the asset allocation to changing regime in the macro space  Flagship product: multi-asset flexible  unconstrainedapproach  exposure to non-traditionalassets  style: quant + discretionary  risk profile:KIID 4 (vol.5% - 10%)  Traditional (long-only) multiasset products  Advisory to institutional clients  measuringimplicit macro diversification  enhancingdiversificationin asset idiosyncraticriskby means of entropy metrics
  • 6. 6  A new paradigmfor asset allocation  Assets are like molecules that can be broken down in atoms of different nature  F-atoms refer to global and local macro factors  A-atoms refer to asset specific risk
  • 7. 7  Are we risk-parity?  we like the idea of balancingrisk  BUT risk is not volatility,macro risk is more relevant  moreover traditionalrisk-parity suffers from estimationrisk(Pola, 2014)  This work develops further some ideas previously published on research papers by  introducingthe local F-atoms  enrichingthe investment opportunity set with A-atoms
  • 8. 8 Unexpected returns The recent crises have brought increasing uncertainty in the exercise of forecastingexpected returns due to:  some market variables (interestrates)are in uncharted territory  non-conventionalmonetarypolicies ofCentral Banks  recent fallingoil prices & China slowdown The uniquenessof the level reached by many financial variablesshould at least convince us to lower our confidence on predictabilityof asset risk premia (see de Laguiche & Pola,2012) 0 2 4 6 8 10 12 14 16 1790 1800 1810 1820 1830 1840 1850 1860 1870 1880 1890 1900 1910 1920 1930 1940 1950 1960 1970 1980 1990 2000 2010 US 10 yrs bond yield Source: GLOBALFINANCIAL DATA
  • 9. 9 Academia & Research Industry  Bayesian approaches (e.g. Black & Litterman, 1990)  Robust Allocations (Tütüncü & Koenig, 2004)  Robust Bayesian Allocations (Meucci, 2011)  Forecast-free investment solutions (minimum variance, maximum diversification, and risk-parity; Russo, 2013)  Entropy-based diversified portfolios (Meucci, 2009; Pola, 2013c; Pola, 2014; Pola, 2016)  Factor Investing (Fama & French, 1992; Webster 2015)  Global Macro Approach (Pola & Facchinato, 2016) How to handle uncertainty in portfolio management?
  • 10. 10 Most of asset dynamics can be captured by variations of levels of macro variables (growth and inflation) and the risk-premia available in the market “Markets move based on shifts in conditions relative to the conditions that are priced in” (Bridgewater)
  • 11. 11 Practical implications on Asset Allocation … Robust Asset Allocationto navigateuncertainmarket conditions Efficient investing on globaland localmacro themes Hedging against the fallingoil prices or recent China slowdown New insights in crisis management Portfolio diagnosis for advisory activity Deepening our understandingof asset correlation
  • 12. 12 Macro scenarios, and their quasi-ortogonality rising growth falling growth rising inflation falling inflation rising risk premia falling risk premia  As variations of levels are more relevant than levels themselves we define rising and falling scenarios   . )()( ),( log),()()(||),( 21, 21 21 212121  ff fPfP ffP ffPfPfPffPD * Analysis based on a non-parametric statisticaltest (Bootstrap-based) ontheKL pseudo-distance.  We measured the “orthogonality” of factors via the Kullback-Leibler pseudo distance:  Factors are not strictly-orthogonal*, however we prefer to work with quasi- orthogonal axes that are stable over time and easily related to macroeconomic dynamics
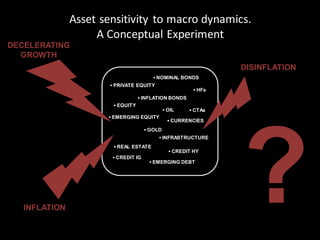
  • 13. 13 Asset sensitivity to macro dynamics. A Conceptual Experiment ▪ NOMINAL BONDS ▪ INFLATION BONDS ▪ EQUITY ▪ GOLD ▪ OIL ▪ INFRASTRUCTURE ▪ CREDIT IG ▪ CREDIT HY ▪ EMERGING EQUITY ▪ EMERGING DEBT ▪ CURRENCIES ▪ HFs ▪ CTAs ▪ PRIVATE EQUITY ▪ REAL ESTATE DECELERATING GROWTH INFLATION DISINFLATION
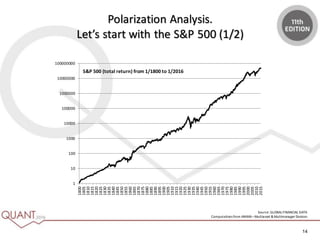
  • 14. 14 Polarization Analysis. Let’s start with the S&P 500 (1/2) 1 10 100 1000 10000 100000 1000000 10000000 100000000 1800 1805 1810 1815 1820 1825 1830 1835 1840 1845 1850 1855 1860 1865 1870 1875 1880 1885 1890 1895 1900 1905 1910 1915 1920 1925 1930 1935 1940 1945 1950 1955 1960 1965 1970 1975 1980 1985 1990 1995 2000 2005 2010 2015 S&P 500 (total return) from 1/1800 to 1/2016 Source: GLOBALFINANCIAL DATA Computationsfrom ANIMA–Multiasset &Multimanager Division
  • 15. 15 Polarization Analysis. Let’s start with the S&P 500 (2/2) 0.00% 0.50% 1.00% 1.50% 2.00% 2.50% 3.00% 3.50% whole sample rising growth falling growth rising inflation falling inflation Averagequarterly excess returnof S&P500 overrisk-free conditional tomacro scenarios G I Source: GLOBALFINANCIAL DATA & Fama-French Website Computationsfrom ANIMA–Multiasset &Multimanager Division
  • 16. 16 Polarization Analysis. An indicator to measure asset sensitivity  Is the result statistically robust?  The polarization coefficient P (parametric and non-parametric approaches) to evaluate asset sensitivity to macro factors  Main properties are:  P is in-between -1 and +1  sign(P) indicates preference for rising or falling scenario  abs(P) quantifies the probability to polarize  The polarization coefficients for the S&P 500 are:  growth +99.27%  inflation -81.10% Source: GLOBALFINANCIAL DATA & Fama-French Website Computationsfrom ANIMA–Multiasset &Multimanager Division Looking intrasectors
  • 17. 17 Asset Segmentation (1/2) 119 assets inthe US including traditional and alternativeassetclasses  Nominal bonds  Inflation-linked bonds  Credit market (IG, HY, EMDH, EMDL)  Zero-duration Creditmarket  Equity sectors & styles  Equity sectors & styles – beta-neutral  Currencies  Volatility  Commodity  Hedge-fund strategies & trend followers Clustering AnalysisonMacroSimilarity Source: Bloomberg,Datastream, GLOBAL FINANCIAL DATA, Fama &Frenchwebsite Computations from ANIMA – Multiasset & Multimanager Division. The dendrogram is a tree diagram illustrating the clusters produced by a metric quantifying the “distance”among assets. It has been obtained with standard algorithm provided by MathWorks. In particular the hierarchy between asset classes has been derived according to a Minkowski metric with p=1 in the bi- dimensional space spanned by the polarization coefficients on growth and inflation, and the clustering protocol ofun-weighted averagedistance. INFLATION-LINKEDBOND NOMINALBOND EQUITY COMMODITY
  • 18. 18 Asset Segmentation (2/2) Clustering AnalysisonMacroSimilarity G+ I-  Equity  Equity Financials, Utilities, Industrials  … G+ I+  OIL  Industrial Metals  Equity Energy, Material  Emerging Debt Local currency  Commodity currencies  … G- I-  Nominal Bonds  Credit IG  CTAs  VIX  … G- I+  Inflation linked bonds G I
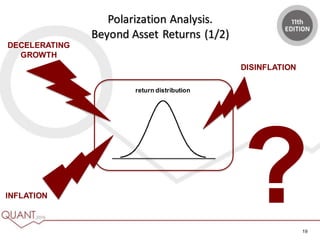
  • 19. 19 Polarization Analysis. Beyond Asset Returns (1/2) DECELERATING GROWTH INFLATION DISINFLATION return distribution
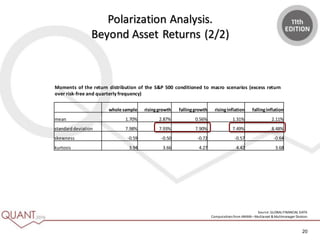
  • 20. 20 Polarization Analysis. Beyond Asset Returns (2/2) Moments of the return distribution of the S&P 500 conditioned to macro scenarios (excess return over risk-free and quarterly frequency) whole sample risinggrowth fallinggrowth risinginflation fallinginflation mean 1.70% 2.87% 0.56% 1.31% 2.11% standarddeviation 7.98% 7.93% 7.90% 7.49% 8.48% skewness -0.59 -0.50 -0.72 -0.57 -0.64 kurtosis 3.94 3.66 4.27 4.42 3.68 Source: GLOBALFINANCIAL DATA Computationsfrom ANIMA–Multiasset &Multimanager Division
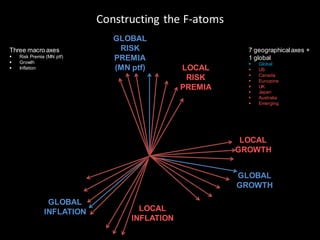
  • 21. 21 Constructing the F-atoms GLOBAL INFLATION GLOBAL RISK PREMIA (MN ptf) GLOBAL GROWTH Three macro axes  Risk Premia (MN ptf)  Growth  Inflation LOCAL INFLATION LOCAL RISK PREMIA LOCAL GROWTH 7 geographical axes + 1 global  Global  US  Canada  Eurozone  UK  Japan  Australia  Emerging
  • 22. 22 F-atoms, 2011 Focus on Global, US and Eurozone Risk Premia (MN ptf) Source: Bloomberg Computationsfrom ANIMA–Multiasset &Multimanager Division
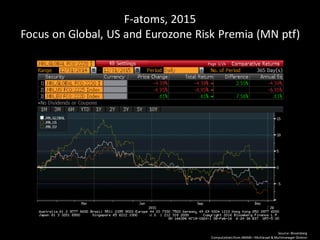
  • 23. 23 F-atoms, 2015 Focus on Global, US and Eurozone Risk Premia (MN ptf) Source: Bloomberg Computationsfrom ANIMA–Multiasset &Multimanager Division
  • 24. 24 F-atoms, YtD as of February 3rd, 2016 -8.00% -3.00% 2.00% GLOBAL US CANADA EURO UK JAPAN AUSTRALIA Risk Premia (MN ptf) -8.00% -3.00% 2.00% GLOBAL US CANADA EURO UK JAPAN AUSTRALIA Growth -8.00% -3.00% 2.00% GLOBAL US CANADA EURO UK JAPAN AUSTRALIA Inflation Source: Bloomberg Computationsfrom ANIMA–Multiasset &Multimanager Division
  • 25. 25 F-atoms, Draghi speech on December 3rd, 2015 -3.50% -1.50% GLOBAL US CANADA EURO UK JAPAN AUSTRALIA Risk Premia (MN ptf) -3.50% -1.50% 0.50% GLOBAL US CANADA EURO UK JAPAN AUSTRALIA Growth -3.50% -1.50% 0.50% GLOBAL US CANADA EURO UK JAPAN AUSTRALIA Inflation Source: Bloomberg Computationsfrom ANIMA–Multiasset &Multimanager Division
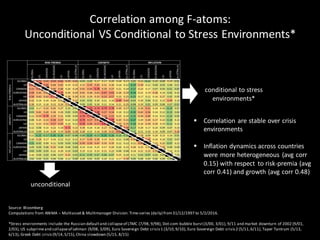
  • 26. 26 Correlation among F-atoms: Unconditional VS Conditional to Stress Environments* Source: Bloomberg Computations from ANIMA – Multiasset& Multimanager Division.Time-series (daily) from31/12/1997 to 5/2/2016. *Stress environments include:the Russian defaultand collapseof LTMC (7/98, 9/98), Dot-com bubble burst(3/00, 3/01), 9/11 and market downturn of 2002 (9/01, 2/03), US subprimeand collapseof Lehman (9/08, 3/09), Euro Sovereign Debt crisis 1 (3/10,9/10), Euro Sovereign Debt crisis 2 (5/11,6/11), Taper Tantrum (5/13, 6/13), Greek Debt crisis (9/14,5/15),China slowdown (5/15, 8/15) conditional to stress environments* unconditional  Correlation are stable over crisis environments  Inflation dynamics across countries were more heterogeneous (avg corr 0.15) with respect to risk-premia (avg corr 0.41) and growth (avg corr 0.48)
  • 27. 27 Why introducing the A-atoms component?  Main investment motivations are  to include specific investment themes (e.g. robotics, automobile sectors, …)  sometimes and in specific market conditions idiosyncratic risk plays a central role (e.g. CHF, Volkswagen, Italian Banks, …)  Main benefits:  it diversifies the model risk embedded in the F-atoms construction  it makes our approach more flexible to generate decorrelated alpha  A-atoms construction is based on entropy metrics that balance high convinction bets with market uncertainty
  • 28. 28 Factor analysis Macro- Neutral portfolio Risk premium Macro outlook Alpha generation Macro-diversified active portfolio  Understanding the key global and local macro factors  Growth, Inflation, Risk Premium  Diversifying macro factors and idiosyncratic risk  Embracing macro dynamics  Managing risk premiumexposure A C D B E Anima Global Macro Diversified. The investment process
  • 29. Portfolio diagnosis: the 60/40 29 Capital Allocation A 60/40 allocation with a euro bias (50% euro + 50% global) Portfolio diagnosis  Globalfactors explain 83%of theportfolio variance, adding localadjstumentswereach 87%  87% can bebroken down as follows: 5% 29% 15% Bond Euro (20%) Bond Global (20%) Equity Euro (30%) Equity Global (30%) GLOBAL RISK-PREMIA (47%) LOCAL (ADJ) RISK-PREMIA (4%) GLOBAL GROWTH (27%) LOCAL (ADJ) GROWTH (15%) GLOBAL INFLATION (7%) LOCAL (ADJ) INFLATION (0.1%) Source: Bloomberg Computations from ANIMA –Multiasset &Multimanager Division Portfolio allocatedin jpmgemlc,jhucgbig, msdlemu, mxwo. Timeseries from31/12/1997to 31/12/2015(monthly obs).
  • 30. Conclusions  F-atoms and A-atoms are the building blocks of asset returns, they are complementary as they diversify  the investment opportunityset  the model risk  The ANIMA Global Macro approach is able  to decipher complex patternsof many assets in terms of few factors  to capture the market risk premium without being exposed to macroeconomic dynamicsand asset idiosyncraticrisk 30
  • 31. Main references 31 .. GLOBAL MACRO APPROACH 1.Pola,G.,& Facchinato,S.,2016.«CombiningF-atomswithA-atomsto exploitinvestmentopportunitiesaround global economies”,in preparation2016 2.Pola,G.,2013a.“Rethinking Strategic AssetAllocation interms of DiversificationAcross MacroeconomicScenarios”,Amundi Cross AssetSpecialFocus May 2013 3.Pola,G.,2013b.“Managinguncertaintywith DAMS.Assetsegmentation in responseto macroeconomic changes”,Amundi Working PaperWP-034-2013 4. Pola, G., & Facchinato, S., 2014. “Managing uncertainty with DAMS: from Asset Segmentation to Portfolio Management”, AMUNDI Discussion Paper DP-06- 2014 5. Pola, G., & Facchinato, S., 2015. “Factor investing through DAMS: from Asset Segmentation to Portfolio Management”, AMUNDI Cross Asset Special Focus, January 2015 6. Pola, G.,& Taze-bernard, E., 2015. . “Assetallocation in a context of falling oil prices: the case of institutions in commodity-exporting countries”, AMUNDI Cross AssetSpecial Focus,January 2015 DIVERSIFICATION MEASURES &ESTIMATION RISK 7.Pola,G.,2016.“On entropy and portfolio diversification”,accepted forpublicationto Journal of AssetManagement,2016 8.Pola,G.,Zerrad,A.,Massoli,G.,Barucci,.E.,2016.“Theroleof estimationrisk inportfolio diversification”,in preparation2016 9.Pola,G.,& Nastaj,M.,2016. “On assetdependency and portfoliodiversification”, in preparation 2016 10.Pola,G.,& Gianni,M,2016. “Asset-basedAllocation vs.FactorInvesting:a differentperspective”, in preparation 2016 11. Pola, G., 2013c. “Diversification Measures for Portfolio Selection”, book chapter in "Stock Markets: Emergence, Macroeconomic Factors and Recent Developments”,NOVA publisher(NewYork),2013 12.Pola,G.,2014.“Isyourportfolio effectivelydiversified? Various perspectives on portfoliodiversification”,Amundi Working PaperWP-040-2014 13.Pola,G.,& Zerrad,A.,2014.“Diversification,EntropyandtheInefficientFrontier”,Amundi Cross AssetSpecialFocus,April 2014 EXPECTEDRETURNS 14. de Laguiche, S., Pola, G., & Taze-bernard, E., 2013. . “Forecasting returns on assets in an environment of uncertainty”, AMUNDI Cross Asset Special Focus, January 2013 15. de Laguiche, S., & G. Pola, 2012. “Unexpected Returns. Methodological Considerations on Expected Returns in Uncertainty”, Amundi Working Paper WP-032- 2012 16.deLaguiche,2014.“« Risk-free» assets:whatlong-termnormalized return? “,Amundi Discussion PaperDP-02-2014
  • 32. Il presente materiale non può in nessun caso essere interpretato come consulenza, invito all’investimento, offerta o raccomandazione per l’acquisto o la vendita di strumenti finanziari, né costituisce sollecitazione al pubblico risparmio. ANIMA è esonerata da qualsiasi responsabilità derivante da un uso improprio del presente materiale al pubblico, effettuato in violazione delle disposizioni degli Organi di Vigilanza anche in materia di pubblicità. I rendimenti passati non sono indicativi di quelli futuri. Prima di aderire leggere il Prospetto, disponibile presso la sede della società, i collocatori e sul sito www.animasgr.it. This document is not intended to be an offer or solicitation, investment advice or recommendation for the purchase or sell any financial instruments and it cannot be disclosed to third parties and/or distributed to the public.This is an informative report and its content is not intended and cannot be used improperly, also as advertising, for the placement of any fund managed by ANIMA Sgr, accordingly to Italian law. The Company assumes the hereby given information as accurate and reliable, but it does not guarantee its precision and it shaIlnot therefore be liable for its use by the addressees. Past performance is not indicative of future returns. For detailed information, please consult the sales prospectusavailable at ANIMAHeadquarter, third partiesdistributorsand on our corporate website www.animasgr.it.