SlideShare a Scribd company logo
4
Most read
12
Most read
18
Most read
HYDROLOGY (L6) By Cg. Dk. Malia Pg. Hj. Damit. Geography Department
HYDROLOGY DEFINITION hydrology Hydrological cycle SYSTEM OPENED CLOSED D.BASIN HYDROLOGICAL CYCLE 1.1. DRAINAGE BASIN DEFINITION DIAGRAM FLOW DIAGRAM WATER  BALANCE 1.2.STORM  HYDROGRAPH
Evapotranspiration Condensation Liquid water turns into a vapour as it absorbed by air. Plants release Water through tiny  Holes (stomata) on  Underside of leaves. Combined water Loss by evaporation  & transpiration. A general term for all  Water moving through the atmosphere in liquid or solid form towards the Earth’s surface . HYDROLOGICAL CYCLE : the circular system by which water is transferred Between the oceans and the land masses.   As the air cools water vapour  turns into tiny droplets of Water  called cloud.
DRAINAGE BASIN A  drainage basin  is a region of land where water from  rain  or  snow  melt drains downhill into a body of water, such as a  river ,  lake ,  dam ,  estuary ,  wetland ,  sea  or  ocean .
Interception   : first raindrops of a rainfall event will fall on  vegetation.  Infiltration   : Water that reaches ground surface will soak into  soil. Overland flow   : water moving over the ground. Throughfall   : water that drip down leaf to leaf.  Percolation   : Some water sinks deep into the earth (percolates)  through openings in the soil.  Stemflow   : water that flow down tree thrunks or plant stems. Groundwater   : water transfer through permeable rocks from  the soil above. Baseflow   : water flows from groundwater stores to the stream Throughflow    : water moving through the soil. Surface run-off   :  water that flows over the land surface. TERMS
FLOW DIAGRAM THROUGH A DRAINAGE BASIN TRANSPIRATION INTERCEPTION SURFACE  STORAGE SOIL WATER STORAGE EVAPORATION GROUNDWATER STORAGE CHANNEL  STORAGE RIVER  RUNOFF VEGETATION STORAGE PERCIPITATION inputs storage outputs stemflow infiltration percolation baseflow throughflow Surface flow Channel flow
Interpreting a storm Hydrograph
Storm Hydrograph River discharge : amount of water originated as  precipitation which reaches the channel by surface  run-off, throughflow and baseflow. Hydrograph:  showing the discharge of a river at a  given point over a short period of time. Storm hydrograph : shows discharge of a river response to an individual rainfall event.
Storm Hydrograph. Approach segment:  discharge of a river before the storm (antecendent  flow rate), when storm begins river response is negligible some rain not  fall directly into channel, most fall elsewhere & take time to reach  channel. Rising limb : initial surface run-off occur, and throughflow reach river  rapid increase in discharge occur.  (the steeper the rising limb, faster response to rainfall i.e. water reach  the channel more quickly) Peak discharge (peak flow) occur when river reaches highest level.
Lag time:  the period between maximum precipitation & peak discharge. (river with shorter lag time had higher peak discharge more prone to  flooding)  Falling limb/recessing limb : segment of the graph where discharge is  decreasing and river level start to fall. (less steep than rising limb  because throughflow is being released slowly into channel) Storm flow : is the discharge, both surface and subsurface flow  attributed to a single storm. Baseflow : very slow respond to a storm, continually releasing ground  water, maintain river flow during periods of low precipitation. Bankfull discharge  occurs when the river’s water level reaches the top  of its channel; any increase in discharge will result in flooding of land.
PERMEABLE ROCK: Porous: e.g. sandstones & chalk (more pores able to fill up and store water) Pervious: carboniferous limestone (water flow along bedding planes & joints) although rocks impermeable. (both type of rock allow much infiltration thus little surface run off, low  surface streams) IMPERMEABLE ROCK: Granite do not allow water to infiltrate thus produce more surface  Streams. FACTORS INFLUENCING STORM HYDROGRAPH: (1) ROCK TYPES:
FACTORS INFLUENCING STORM HYDROGRAPH: (2) BASIN CHARACTERISTICS :  Basin shape : Elongated basin: less dramatic graph. (longer lag time & low peak flow) Circular basin: more dramatic graph. (shorter lag time & high peak flow) Water takes longer to reach the trunk  stream in a large, round basin than  in does in a small, narrow one.
FACTORS INFLUENCING STORM HYDROGRAPH: ( 2) BASIN CHARACTERISTICS:  Drainage density: (no of streams) Basin with high drainage density: more dramatic graph. (impermeable rocks and clay) –shorter lag time and higher peak) Basin with low drainage density: less dramatic graph. (permeable rocks and sand)-longer lag time and low peak flow. Areas of permeable rocks and soil allow  more infiltration and so less surface run off.
FACTORS INFLUENCING STORM HYDROGRAPH: ( 2) BASIN CHARACTERISTICS:  Relief: (a) Steeper long profile: more dramatic graph. (water reach river more quickly) (b) Gentle long profile: less dramatic graph. Where gradients are steep, water runs off faster,  reaches the river more quickly and causes a steep rising limb. Prolonged heavy rain causes more overland flow than light drizzly rain.
(3) PRECIPITATION: Prolonged rainfall: flooding most frequently occurs, ground saturated and overland flow occurs. Intense rainfall: high surface runoff producing rapid rise in river levels ( flash floods occur) (4) TEMPERATURE : Extreme temperature (very cold in winter & hot and dry in summer) increase surface run-off. Less surface run off if high rate of evaporation. (5) VEGETATION: Tropical rainforest intercepts 80 % rainfall, arable intercepts only 10%. Plant roots (trees) reduce throughflow by taking up water from soil. FACTORS INFLUENCING STORM HYDROGRAPH:
STORM HYDROGRAPH OF 2 RIVERS. GRASSLAND VS FORESTED. Grassland area: more dramatic (shorter lag time & high peak flow)-rapid run off. Forested area: less dramatic (longer lag time & low peak flow)-less rapid run off more rainfall intercept. vegetation intercepts precipitation and allows  evaporation to take place directly into the  atmosphere so reducing the amount of water  available for overland flow.
STORM HYDROGRAPH OF 2 RIVERS . URBANISATION: Increase flood risk, water can’t infiltrate through concrete &  tarmac & concrete, gutter /drains carry water more  quickly to nearest stream. (more run-off) (to solve problems-small streams either canalised or culverted)
WATER BALANCE. Water balance  shows the relationship between inputs and outputs of a drainage basin.  Precipitation = Q (run-off/discharge) + E (evaporation) +/- changes in  storage. Importance: A water balance can be used to help manage water supply and predict  where there may be water shortages. It is also used in  irrigation , flood  control and pollution control.  The water balance can be illustrated using a  water balance graph  which plots levels of precipitation  and  evapotranspiration  often on a monthly scale.
Water balance graph A: Soil moisture recharge B: Soil moisture utilisation C: Water surplus D: Water deficit
WATER BALANCE VARY OVER TIME SEASONAL NATURE PRECIPITATION 2.  SEASONAL REQUIREMENTS OF PLANTS, ANIMALS AND MAN (UPTAKE & ABSTRACTION WHICH CAN AFFECT STORES. (E.G. IRRIGATION, DAM, WELL ETC)

More Related Content

PPTX
Groundwater Hydrology
PDF
Introduction to Hydrology
PPTX
1 introduction to hydrology
PPTX
Module 2 ch-1 heytograph and hydrology analysis
PPT
Flood estimation
PPTX
Reservoir Planning
PPT
Meandering Rivers
PPTX
Hydrology cycle and ground water (GT&AG)
Groundwater Hydrology
Introduction to Hydrology
1 introduction to hydrology
Module 2 ch-1 heytograph and hydrology analysis
Flood estimation
Reservoir Planning
Meandering Rivers
Hydrology cycle and ground water (GT&AG)

What's hot (20)

PPTX
PDF
Sediment transport
PPTX
Flood frequency analyses
PPTX
Hydrology
PPTX
Unit hydrograph
PPT
Groundwater Management
PPTX
Runoff & Flood Frequency Analysis
PPTX
Hyetograph and hydrograph analysis
PPTX
Flood routing
PPTX
Unit hydrograph by anwar
PPT
Dam safety & Safety Devices
PPTX
The hydrological cycle
PPTX
Open Channel Flow
PDF
RESERVOIR SEDIMENTATION
PPTX
Infiltration equations and index
PPTX
Regulation Works
PDF
Lecture 11. groundwater hydrology
PPTX
Unit 4-canal
PPT
Precipitation and rain gauges
PPTX
Sediment transport
Flood frequency analyses
Hydrology
Unit hydrograph
Groundwater Management
Runoff & Flood Frequency Analysis
Hyetograph and hydrograph analysis
Flood routing
Unit hydrograph by anwar
Dam safety & Safety Devices
The hydrological cycle
Open Channel Flow
RESERVOIR SEDIMENTATION
Infiltration equations and index
Regulation Works
Lecture 11. groundwater hydrology
Unit 4-canal
Precipitation and rain gauges
Ad

Similar to Presentation Hydrology (20)

PPTX
Geography AS Level full revision notes
PPTX
Storm Hydrographs
PPTX
Hydrology and Fluvial Geo morphology for CAMBRIDGE AS level
PPTX
AS Level Physical Geography - Hydrology and Fluvial Geomorphology
PPTX
AS Geography (AQA) - Rivers
PPT
Flooding
PPT
HYDROGRAPH AND HYDROLOGICAL ANALYSIS.ppt
PDF
Hydrology_intro 1 by Getachew Tege@ACEWM
PPTX
What is the river discharge and what factors
PPTX
What causes a flood?
PPTX
Geography as revision rivers floods and management
PPTX
Grade Geography 10 Notes to explain how floods affect people and the environment
PPTX
1.2 rainfall discharge basin
PDF
Assignment on: Runoff and flooding (Drainage Pattern, Stream Flow Velocity, R...
PPT
flooding.ppt
PDF
ANALYSIS OF RAINFALL RUNOFF IN HYDROLOGY
PPTX
CAMBRIDGE AS GEOGRAPHY REVISION: HYDROLOGY AND FLUVIAL GEOMORPHOLOGY - 1.2 RA...
PPTX
UNIT 1 - SURFACE WATER- Hydrological cycle, Rainfall and rain gauges
PPTX
Elements of surface hydrology by Akshay D Raut
PPTX
Civil 4th year-2.pptx
Geography AS Level full revision notes
Storm Hydrographs
Hydrology and Fluvial Geo morphology for CAMBRIDGE AS level
AS Level Physical Geography - Hydrology and Fluvial Geomorphology
AS Geography (AQA) - Rivers
Flooding
HYDROGRAPH AND HYDROLOGICAL ANALYSIS.ppt
Hydrology_intro 1 by Getachew Tege@ACEWM
What is the river discharge and what factors
What causes a flood?
Geography as revision rivers floods and management
Grade Geography 10 Notes to explain how floods affect people and the environment
1.2 rainfall discharge basin
Assignment on: Runoff and flooding (Drainage Pattern, Stream Flow Velocity, R...
flooding.ppt
ANALYSIS OF RAINFALL RUNOFF IN HYDROLOGY
CAMBRIDGE AS GEOGRAPHY REVISION: HYDROLOGY AND FLUVIAL GEOMORPHOLOGY - 1.2 RA...
UNIT 1 - SURFACE WATER- Hydrological cycle, Rainfall and rain gauges
Elements of surface hydrology by Akshay D Raut
Civil 4th year-2.pptx
Ad

More from Malia Damit (19)

DOCX
Tourism flow diagram revision 2014
PPTX
Atmosphere revision booklet 2014 cg malia
PPTX
Rock and weathering booklet
DOC
Hjulstrom Curve Notes
PPT
Plate Tectonics, Earthquake & Volcano
PPT
River Channel Processes & Landforms
DOC
Understanding Instructions And Command Terms
DOC
Coastal Environments New Notes 5 12 07
PPT
Limestone Landscapes
PPT
Stability & Instability
PPT
Slope Movement
PPT
Environmental Hazards
PPT
River Presentation
PPT
Presentation1 Mobility
PPT
Resource
PPT
Tourism
PPT
Coastal Processes And Landforms
PPT
Coastal Features Created By Erosion Sherry
PPT
Hydrology & Fluvial Geomorphology
Tourism flow diagram revision 2014
Atmosphere revision booklet 2014 cg malia
Rock and weathering booklet
Hjulstrom Curve Notes
Plate Tectonics, Earthquake & Volcano
River Channel Processes & Landforms
Understanding Instructions And Command Terms
Coastal Environments New Notes 5 12 07
Limestone Landscapes
Stability & Instability
Slope Movement
Environmental Hazards
River Presentation
Presentation1 Mobility
Resource
Tourism
Coastal Processes And Landforms
Coastal Features Created By Erosion Sherry
Hydrology & Fluvial Geomorphology

Recently uploaded (20)

PDF
Profit Center Accounting in SAP S/4HANA, S4F28 Col11
PDF
Optimiser vos workloads AI/ML sur Amazon EC2 et AWS Graviton
PDF
Dropbox Q2 2025 Financial Results & Investor Presentation
DOCX
The AUB Centre for AI in Media Proposal.docx
PDF
The Rise and Fall of 3GPP – Time for a Sabbatical?
PDF
Chapter 3 Spatial Domain Image Processing.pdf
PPTX
Machine Learning_overview_presentation.pptx
PPT
“AI and Expert System Decision Support & Business Intelligence Systems”
PPTX
VMware vSphere Foundation How to Sell Presentation-Ver1.4-2-14-2024.pptx
PPTX
MYSQL Presentation for SQL database connectivity
PDF
Encapsulation_ Review paper, used for researhc scholars
PPTX
Cloud computing and distributed systems.
PPT
Teaching material agriculture food technology
PDF
Network Security Unit 5.pdf for BCA BBA.
PPTX
Big Data Technologies - Introduction.pptx
PDF
Architecting across the Boundaries of two Complex Domains - Healthcare & Tech...
PDF
Approach and Philosophy of On baking technology
PDF
Building Integrated photovoltaic BIPV_UPV.pdf
PPTX
Spectroscopy.pptx food analysis technology
PPTX
A Presentation on Artificial Intelligence
Profit Center Accounting in SAP S/4HANA, S4F28 Col11
Optimiser vos workloads AI/ML sur Amazon EC2 et AWS Graviton
Dropbox Q2 2025 Financial Results & Investor Presentation
The AUB Centre for AI in Media Proposal.docx
The Rise and Fall of 3GPP – Time for a Sabbatical?
Chapter 3 Spatial Domain Image Processing.pdf
Machine Learning_overview_presentation.pptx
“AI and Expert System Decision Support & Business Intelligence Systems”
VMware vSphere Foundation How to Sell Presentation-Ver1.4-2-14-2024.pptx
MYSQL Presentation for SQL database connectivity
Encapsulation_ Review paper, used for researhc scholars
Cloud computing and distributed systems.
Teaching material agriculture food technology
Network Security Unit 5.pdf for BCA BBA.
Big Data Technologies - Introduction.pptx
Architecting across the Boundaries of two Complex Domains - Healthcare & Tech...
Approach and Philosophy of On baking technology
Building Integrated photovoltaic BIPV_UPV.pdf
Spectroscopy.pptx food analysis technology
A Presentation on Artificial Intelligence

Presentation Hydrology

  • 1. HYDROLOGY (L6) By Cg. Dk. Malia Pg. Hj. Damit. Geography Department
  • 2. HYDROLOGY DEFINITION hydrology Hydrological cycle SYSTEM OPENED CLOSED D.BASIN HYDROLOGICAL CYCLE 1.1. DRAINAGE BASIN DEFINITION DIAGRAM FLOW DIAGRAM WATER BALANCE 1.2.STORM HYDROGRAPH
  • 3. Evapotranspiration Condensation Liquid water turns into a vapour as it absorbed by air. Plants release Water through tiny Holes (stomata) on Underside of leaves. Combined water Loss by evaporation & transpiration. A general term for all Water moving through the atmosphere in liquid or solid form towards the Earth’s surface . HYDROLOGICAL CYCLE : the circular system by which water is transferred Between the oceans and the land masses. As the air cools water vapour turns into tiny droplets of Water called cloud.
  • 4. DRAINAGE BASIN A drainage basin is a region of land where water from rain or snow melt drains downhill into a body of water, such as a river , lake , dam , estuary , wetland , sea or ocean .
  • 5. Interception : first raindrops of a rainfall event will fall on vegetation. Infiltration : Water that reaches ground surface will soak into soil. Overland flow : water moving over the ground. Throughfall : water that drip down leaf to leaf. Percolation : Some water sinks deep into the earth (percolates) through openings in the soil. Stemflow : water that flow down tree thrunks or plant stems. Groundwater : water transfer through permeable rocks from the soil above. Baseflow : water flows from groundwater stores to the stream Throughflow : water moving through the soil. Surface run-off : water that flows over the land surface. TERMS
  • 6. FLOW DIAGRAM THROUGH A DRAINAGE BASIN TRANSPIRATION INTERCEPTION SURFACE STORAGE SOIL WATER STORAGE EVAPORATION GROUNDWATER STORAGE CHANNEL STORAGE RIVER RUNOFF VEGETATION STORAGE PERCIPITATION inputs storage outputs stemflow infiltration percolation baseflow throughflow Surface flow Channel flow
  • 7. Interpreting a storm Hydrograph
  • 8. Storm Hydrograph River discharge : amount of water originated as precipitation which reaches the channel by surface run-off, throughflow and baseflow. Hydrograph: showing the discharge of a river at a given point over a short period of time. Storm hydrograph : shows discharge of a river response to an individual rainfall event.
  • 9. Storm Hydrograph. Approach segment: discharge of a river before the storm (antecendent flow rate), when storm begins river response is negligible some rain not fall directly into channel, most fall elsewhere & take time to reach channel. Rising limb : initial surface run-off occur, and throughflow reach river rapid increase in discharge occur. (the steeper the rising limb, faster response to rainfall i.e. water reach the channel more quickly) Peak discharge (peak flow) occur when river reaches highest level.
  • 10. Lag time: the period between maximum precipitation & peak discharge. (river with shorter lag time had higher peak discharge more prone to flooding) Falling limb/recessing limb : segment of the graph where discharge is decreasing and river level start to fall. (less steep than rising limb because throughflow is being released slowly into channel) Storm flow : is the discharge, both surface and subsurface flow attributed to a single storm. Baseflow : very slow respond to a storm, continually releasing ground water, maintain river flow during periods of low precipitation. Bankfull discharge occurs when the river’s water level reaches the top of its channel; any increase in discharge will result in flooding of land.
  • 11. PERMEABLE ROCK: Porous: e.g. sandstones & chalk (more pores able to fill up and store water) Pervious: carboniferous limestone (water flow along bedding planes & joints) although rocks impermeable. (both type of rock allow much infiltration thus little surface run off, low surface streams) IMPERMEABLE ROCK: Granite do not allow water to infiltrate thus produce more surface Streams. FACTORS INFLUENCING STORM HYDROGRAPH: (1) ROCK TYPES:
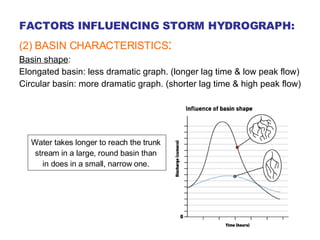
  • 12. FACTORS INFLUENCING STORM HYDROGRAPH: (2) BASIN CHARACTERISTICS : Basin shape : Elongated basin: less dramatic graph. (longer lag time & low peak flow) Circular basin: more dramatic graph. (shorter lag time & high peak flow) Water takes longer to reach the trunk stream in a large, round basin than in does in a small, narrow one.
  • 13. FACTORS INFLUENCING STORM HYDROGRAPH: ( 2) BASIN CHARACTERISTICS: Drainage density: (no of streams) Basin with high drainage density: more dramatic graph. (impermeable rocks and clay) –shorter lag time and higher peak) Basin with low drainage density: less dramatic graph. (permeable rocks and sand)-longer lag time and low peak flow. Areas of permeable rocks and soil allow more infiltration and so less surface run off.
  • 14. FACTORS INFLUENCING STORM HYDROGRAPH: ( 2) BASIN CHARACTERISTICS: Relief: (a) Steeper long profile: more dramatic graph. (water reach river more quickly) (b) Gentle long profile: less dramatic graph. Where gradients are steep, water runs off faster, reaches the river more quickly and causes a steep rising limb. Prolonged heavy rain causes more overland flow than light drizzly rain.
  • 15. (3) PRECIPITATION: Prolonged rainfall: flooding most frequently occurs, ground saturated and overland flow occurs. Intense rainfall: high surface runoff producing rapid rise in river levels ( flash floods occur) (4) TEMPERATURE : Extreme temperature (very cold in winter & hot and dry in summer) increase surface run-off. Less surface run off if high rate of evaporation. (5) VEGETATION: Tropical rainforest intercepts 80 % rainfall, arable intercepts only 10%. Plant roots (trees) reduce throughflow by taking up water from soil. FACTORS INFLUENCING STORM HYDROGRAPH:
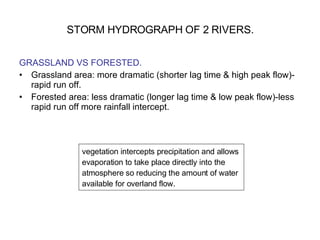
  • 16. STORM HYDROGRAPH OF 2 RIVERS. GRASSLAND VS FORESTED. Grassland area: more dramatic (shorter lag time & high peak flow)-rapid run off. Forested area: less dramatic (longer lag time & low peak flow)-less rapid run off more rainfall intercept. vegetation intercepts precipitation and allows evaporation to take place directly into the atmosphere so reducing the amount of water available for overland flow.
  • 17. STORM HYDROGRAPH OF 2 RIVERS . URBANISATION: Increase flood risk, water can’t infiltrate through concrete & tarmac & concrete, gutter /drains carry water more quickly to nearest stream. (more run-off) (to solve problems-small streams either canalised or culverted)
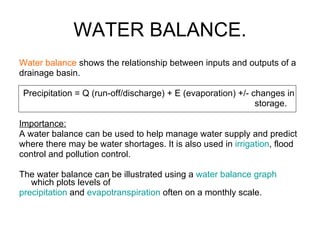
  • 18. WATER BALANCE. Water balance shows the relationship between inputs and outputs of a drainage basin. Precipitation = Q (run-off/discharge) + E (evaporation) +/- changes in storage. Importance: A water balance can be used to help manage water supply and predict where there may be water shortages. It is also used in irrigation , flood control and pollution control. The water balance can be illustrated using a water balance graph which plots levels of precipitation and evapotranspiration often on a monthly scale.
  • 19. Water balance graph A: Soil moisture recharge B: Soil moisture utilisation C: Water surplus D: Water deficit
  • 20. WATER BALANCE VARY OVER TIME SEASONAL NATURE PRECIPITATION 2. SEASONAL REQUIREMENTS OF PLANTS, ANIMALS AND MAN (UPTAKE & ABSTRACTION WHICH CAN AFFECT STORES. (E.G. IRRIGATION, DAM, WELL ETC)