SlideShare a Scribd company logo
Progression by Regression:
How to increase your A/B Test Velocity
August 2018
Aaron Bradley
linkedin.com/in/abradle2
Stefan Krawczyk
@stefkrawczyk
linkedin.com/in/skrawczyk
Contents
What is Stitch Fix?
Why A/B Test?
Why is A/B Test velocity important?
Formulating an Opinion
Those t-tests
Regression
Regression @ Stitch Fix
In Conclusion
Who: we’re data platform engineers working on Stitch Fix’s Expt. Platform
Who are you?
What is Stitch Fix?
Try out Stitch Fix → goo.gl/Q3tCQ3
Personal Styling Service
Lots of opportunity for experimentation!
At your own leisure
Algorithms Tour:
- https://algorithms-tour.stitchfix.com/
Multithreaded Blog:
- https://multithreaded.stitchfix.com/algorithms/blog/
Why A/B Test?
Confidence!
https://www.flickr.com/photos/frederickhomesforsale/16241388115
Progression by Regression: How to increase your A/B Test Velocity
To attempt to infer causality for the purpose of
having confidence in making decisions
Goal of A/B Testing
Goal of A/B Testing: Example
http://blog.twn.ee/sites/default/files/inline-images/02.png.pagespeed.ce_.BmWcShEZAM.png
Goal of A/B Testing: Example
http://blog.twn.ee/sites/default/files/inline-images/02.png.pagespeed.ce_.BmWcShEZAM.png
https://pixabay.com/en/decision-choice-path-road-1697537/
?
Why is A/B test
velocity important?
The faster this cycle is:
“The more you can learn about your business model”
The faster this cycle is:
“The more you can learn about your business model”
The faster this cycle is:
Specifically this means
We want to complete experiments
at a faster cadence!
vs
?
Formulating an
opinion
How do we formulate an opinion?
http://blog.twn.ee/sites/default/files/inline-images/02.png.pagespeed.ce_.BmWcShEZAM.png
https://pixabay.com/en/decision-choice-path-road-1697537/
?
?
“Can we reject the null hypothesis?”
Formal Statistical Phrasing
“Given the observed data,
how likely could these differences
have occurred by chance?”
In Plain English
To name some:
● Chi-squared
● Binomial proportions
● ANOVA
● Regression
● Wald test
● Welch’s t-test
● One sample t-test
● Two sample t-test
● Paired t-test
● Z-test
● Generalized estimating
equations
There are a bunch of statistical tests
Choosing one depends on things
like:
● Type of data, e.g. binomial or
continuous
● Amount of data
● Independence assumptions of
the data
● Outcome that you’re testing
● Whether you’re a statistician...
Choosing one depends on things
like:
● Type of data, e.g. binomial or
continuous
● Amount of data
● Independence assumptions of
the data
● Outcome that you’re testing
● Whether you’re a statistician...
To name some:
● Chi-squared
● Binomial proportions
● ANOVA
● Regression
● Wald test
● Welch’s t-test
● One sample t-test
● Two sample t-test
● Paired t-test
● Z-test
● Generalized estimating
equations
There are a bunch of statistical tests
Those t-tests
The t-test is the most common method used in A/B testing.
A t-test is a way to compare two means.
It relates to the T-distribution.
General form:
What is a t-test?
The t-test is the most common method used in A/B testing.
A t-test is a way to compare two means.
It relates to the T-distribution.
General form:
What is a t-test?
Difference of means
Standard Error:
Contains standard
deviation and sample
size.
Use this value to get a
measure of probability of
seeing this result by chance
using T-distribution
The t-test is the most common method used in A/B testing.
A t-test is a way to compare two means.
It relates to the T-distribution.
General form:
What is a t-test?
Difference of means
Standard Error*:
Use this value to get a
measure of probability of
seeing this result by chance
using T-distribution
There are a few different variations of the t-test.
People most likely use/refer to the two-sample t-test.
A t-test is assumed to be only used for comparing continuous data:
E.g.:
● Height
● Weight
● Time spent on page
● Lifetime value (LTV)
● etc.
Two Sample t-test
There are a few different variations of the t-test.
People most likely use/refer to the two-sample t-test.
A t-test is assumed to be only used for comparing continuous data:
E.g.:
● Height
● Weight
● Time spent on page
● Lifetime value (LTV)
● etc.
Two Sample t-test
But using the Central Limit Theorem
you can also use it for:
● Proportions
● Count data
● ...
There are a few different T-tests.
People most likley use/refer to the two-sample t-test.
A t-test is assumed to be only used for comparing continuous data:
E.g.:
● Height
● Weight
● Time spent on page
● Lifetime value (LTV)
● etc.
Two Sample t-test
But using the Central Limit Theroem
you can also use it for:
● Proportions
● Count data
● ...
One reason for its widespread use is that it is easy to calculate:
● Just need to be able to sum, divide, square, and square root!
○ You can even do it in SQL … !
There are some assumptions on:
● Independence
● Normally distributed
● Homogeneity of variances*
Two Sample t-test
One reason for its widespread use is that it is easy to calculate:
● Just need to be able to sum, divide, square, and square root!
○ You can even do it in SQL … !
There are some assumptions on:
● Independence
● Normally distributed
● Homogeneity of variances
Two Sample t-test
Slow downs with the t-test
Type I Errors
(False Positives)
vs
Type II Errors
(False Negatives)
α β
We need to balance:
Type I Errors (false positives):
“Rejecting the null hypothesis while it is true”
Type II Errors (false negatives):
“Incorrectly retaining the null hypothesis.”
Reasons that slow us down
Controlling for Type I Errors == Significance == α
Typically set at 0.05 or 5%
→ so 1 / 20 False Positives
This where a p-value of 0.05 being significant comes from.
Typically you don’t change this threshold to go faster.
Reasons that slow us down
Controlling for Type I Errors == Significance == α
Typically set at 0.05 or 5%
→ so 1 / 20 False Positives
This where a p-value of 0.05 being significant comes from.
Typically you don’t change this threshold to go faster.
Reasons that slow us down
Controlling for Type II Errors == Power == (1 - 𝛃)
“Probability that you correctly rejected the null hypothesis.”
Standard is 0.8 or 80%
→ 4 / 5 times if there was an effect you’d be able to
detect it.
Power is affected by:
● Effect size.
● Sample size.
● Variation of the data
Reasons that slow us down
} Standard Error
Tangent: What is an underpowered expt.?
http://rpsychologist.com/d3/NHST/
Tangent: What is an underpowered expt.?
http://rpsychologist.com/d3/NHST/
So how can we move faster?
1. Only make bigger changes
So how can we move faster?
1. Only make bigger changes
→ Need bigger ideas / more resources.
…
So how can we move faster?
1. Only make bigger changes
→ Need bigger ideas / more resources.
1. Increase sample size
So how can we move faster?
1. Only make bigger changes
→ Need bigger ideas / more resources.
1. Increase sample size
→ Run longer tests.
So how can we move faster?
1. Only make bigger changes
→ Need bigger ideas / more resources.
1. Increase sample size
→ Run longer tests.
1. Reduce variability
So how can we move faster?
1. Only make bigger changes
→ Need bigger ideas / more resources.
1. Increase sample size
→ Run longer tests.
1. Reduce variability
→ Detect smaller changes / run shorter tests!
So how can we move faster?
1. Only make bigger changes
→ Need bigger ideas / more resources.
1. Increase sample size
→ Run longer tests.
1. Reduce variability
→ Detect smaller changes / run shorter tests!
→ Reduce the standard deviation term!
So how can we move faster?
1. Only make bigger changes
→ Need bigger ideas / more resources.
1. Increase sample size
→ Run longer tests.
1. Reduce variability
→ Detect smaller changes / run shorter tests!
→ Reduce the standard deviation term!
But you can’t do this with a two sample t-test!
Regression
How regression does and doesn’t help
Regression enables:
● Increasing power with
covariates
● Increased test velocity
● Bias correction*
● Handling of more complex
correlation structure*
Regression does not:
● Allow you to skip your power
analysis (you are running power
analyses, right? I’m sure you are)
● Allow you to run
underpowered experiments
● Remove the need for good
experimental design
● Solve peeking or multiple
comparisons concerns*
● Automatically enable
sequential testing*
● Adjust for winner’s curse**Not covered in this talk
People often think of regression for prediction, t-tests for
inference.
But t-tests are a special case of linear regression.
You can use regression in place of t-tests, and it opens the door to
new levers - efficiency.
What to get out of this section
You can use regression instead of t-tests. But why?
Using regression for hypothesis testing
within condition variability
between condition variability
You can use regression instead of t-tests. But why?
Using regression for hypothesis testing
Cell A Cell B
within condition variability
between condition variability
You can use regression instead of t-tests. But why?
Using regression for hypothesis testing
Cell A Cell B
within condition variability
between condition variability
You can use regression instead of t-tests. But why?
Using regression for hypothesis testing
Cell A Cell B
within condition variability
between condition variability
Using regression for hypothesis testing
β
^
H0: β = 0
Ha: β ≠ 0
within condition variability
between condition variability
You can use linear regression instead of t-tests. But why?
Regression gives us a lever to
decrease variance without
increasing n by modeling out
some within-condition variability
Using regression for hypothesis testing
shrinking within-condition
variability
same between-condition
variability
Example - Client Email Campaign
Control Variant
Are users who receive the new variant of a marketing email more likely
have an increased Average Order Value (AOV) on their next shipment?
Example - Client Email Campaign
Control Variant
What explains a higher order value for a client?
Between condition variability
● The treatment (hopefully!)
Within condition variability
● How long they’ve been a client
● A client’s order value on their last shipment
● Delay between when they received the
email and when they opened it
Example - Client Email Campaign
Control Variant
Between condition variability
● The treatment (hopefully!)
Within condition variability
● How long they’ve been a client
● A client’s order value on their last shipment
● Delay between when they received the
email and when they opened it
What explains a higher order value for a client?
Example - Client Email Campaign
Control Variant
Between condition variability
● The treatment (hopefully!)
Within condition variability
● How long they’ve been a client
● A client’s order value on their last shipment
● Delay between when they received the
email and when they opened it
aov ~ 1 + cell_id + client_tenure + ov_previous_shipment
https://exp-platform.com/Documents/2013-02-CUPED-ImprovingSensitivityOfControlledExperiments.pdf
Getting increased power by controlling for covariates requires you to find covariates
which decrease between-condition variability
● Make sure they aren’t correlated with the treatment
○ Rule of thumb: only use pre-experiment data
● Best covariates are highly correlated with your outcome variable
○ Often the pre-experiment value of your outcome is best one
● Visitor / conversion experiments: let us know what you find!
Covariates: what to use
https://exp-platform.com/Documents/2013-02-CUPED-ImprovingSensitivityOfControlledExperiments.pdf
Regression @ Stitch Fix
Regression: How we do it
● Model computed on-the-fly in
metrics-service
● Simple python app fetching data
from presto
● statsmodels / patsy for regression
● BYOD for more complex models
(bootstrapping, hierarchical
mixed models, gee, etc)
Metrics Service Data
Warehouse
Presto Nightly ETLs
Regression: Things we’ve tried
● R vs Spark vs Python
● Data size: big vs small.
● Nightly ETL vs Online
● Slice & Dice vs Preset Filters
Regression: How we do it
● Metrics defined in yaml file
● Model is specified via type,
family, link, label column
(response), and covariates
● SQL query to provide necessary
columns from underlying
experiments tables
order_value ~ 1 + cell_id + tenure
python: statsmodels + patsy
import pandas as pd
import statsmodels.api as sm
import statsmodels.formula.api as smf
# fetch data somehow. returned data frame has columns cell_id, order_value
df = get_data()
# make cell_id categorical
df.cell_id = df.cell_id.astype('category', categories=[1,2])
# intercept term is implicit in following formula
model = smf.ols(formula='order_value ~ cell_id', data=df)
model_fit = model.fit()
print(model_fit.summary())
control_cell_estimate = model_fit.params['Intercept']
treatment_cell_estimate = model_fit.params['Intercept'] + model_fit.params['cell_id[T.2]']
p = model_fit.pvalues['cell_id[T.2]']
Linear Regression: Example Code
Gotchas
● cell_id must be categorical - needs to be
dummy encoded
● continuous covariates: mean-center
● discrete covariates: think about proper
contrast coding
● be careful about 1 vs 2 sided hypotheses
● think about correlations between your
randomization units
Statsmodels summary() output:
==============================================================================
coef std err t P>|t| [0.025 0.975] ---------------------------------------------------------
--------------------------------
x1 0.4639 0.162 2.864 0.008 0.132 0.796
x2 0.0105 0.019 0.539 0.594 -0.029 0.050
x3 0.3786 0.139 2.720 0.011 0.093 0.664
const -1.4980 0.524 -2.859 0.008 -2.571 -0.425
==============================================================================
Linear Regression: Example Output
In Conclusion
● You can use regression in place of a t-test today!
76
Conclusion
● You can use regression in place of a t-test today!
● Regression gives you the tools to better control
variance.
77
Conclusion
78
MOAR POWER!
● You can use regression in place of a t-test today!
● Regression gives you the tools to better control
variance.
● Moar Power!
● With increased power you can conclude more
tests faster.
79
Conclusion
● You can use regression in place of a t-test today!
● Regression gives you the tools to better control
variance.
● Moar Power!
● With increased power you can conclude more
tests faster.
● Or, you can measure smaller changes better.
80
Conclusion
81
We’re also hiring!
Thanks!
Questions?
Feedback?

More Related Content

PPTX
Learning a Personalized Homepage
PDF
Personalizing the listening experience
PDF
Past, Present & Future of Recommender Systems: An Industry Perspective
PDF
Entity2rec recsys
PPTX
Tutorial on People Recommendations in Social Networks - ACM RecSys 2013,Hong...
PDF
Tutorial on Deep Learning in Recommender System, Lars summer school 2019
PDF
Building a Search Intent-Driven Website Architecture (SEO Mastery Summit 2022...
PDF
Recommending for the World
Learning a Personalized Homepage
Personalizing the listening experience
Past, Present & Future of Recommender Systems: An Industry Perspective
Entity2rec recsys
Tutorial on People Recommendations in Social Networks - ACM RecSys 2013,Hong...
Tutorial on Deep Learning in Recommender System, Lars summer school 2019
Building a Search Intent-Driven Website Architecture (SEO Mastery Summit 2022...
Recommending for the World

What's hot (20)

PDF
Time, Context and Causality in Recommender Systems
PDF
Homepage Personalization at Spotify
PDF
How To Harness First-Party Data & Win In A Cookieless Future
PPTX
Darren Shaw - User Behavior and Local Search - Dallas State of Search 2014
PDF
Deep Learning for Recommender Systems
PDF
How To Forecast SEO With Better Precision & Transparency
PDF
Crafting Recommenders: the Shallow and the Deep of it!
PDF
Kdd 2014 Tutorial - the recommender problem revisited
PDF
Contextualization at Netflix
PDF
Machine Learning At Tubi
PPTX
Managing Expectations with Impossible Keywords - Jess Maloney - BrightonSEO ...
PDF
Learned Embeddings for Search and Discovery at Instacart
PDF
Sequential Decision Making in Recommendations
PPT
Diversity and novelty for recommendation system
PPTX
How to overcome the fear of taking time off.pptx
PDF
Tutorial on Sequence Aware Recommender Systems - ACM RecSys 2018
PPTX
Crawl Budget: Everything you Need to Know
PDF
SEO Low hanging Fruit: Identifying SEO Opportunities to Achieve Results Fast ...
PDF
Algorithmic Music Recommendations at Spotify
PPT
Lean analytics: Five lessons beyond the basics
Time, Context and Causality in Recommender Systems
Homepage Personalization at Spotify
How To Harness First-Party Data & Win In A Cookieless Future
Darren Shaw - User Behavior and Local Search - Dallas State of Search 2014
Deep Learning for Recommender Systems
How To Forecast SEO With Better Precision & Transparency
Crafting Recommenders: the Shallow and the Deep of it!
Kdd 2014 Tutorial - the recommender problem revisited
Contextualization at Netflix
Machine Learning At Tubi
Managing Expectations with Impossible Keywords - Jess Maloney - BrightonSEO ...
Learned Embeddings for Search and Discovery at Instacart
Sequential Decision Making in Recommendations
Diversity and novelty for recommendation system
How to overcome the fear of taking time off.pptx
Tutorial on Sequence Aware Recommender Systems - ACM RecSys 2018
Crawl Budget: Everything you Need to Know
SEO Low hanging Fruit: Identifying SEO Opportunities to Achieve Results Fast ...
Algorithmic Music Recommendations at Spotify
Lean analytics: Five lessons beyond the basics
Ad

Similar to Progression by Regression: How to increase your A/B Test Velocity (20)

PPTX
Dowhy: An end-to-end library for causal inference
DOCX
TEST #1Perform the following two-tailed hypothesis test, using a.docx
PDF
Setting up an A/B-testing framework
PDF
신뢰할 수 있는 A/B 테스트를 위해 알아야 할 것들
PDF
Andrii Belas: A/B testing overview: use-cases, theory and tools
PDF
Faster and cheaper, smart ab experiments - public ver.
PPTX
GIAF UK Winter 2015 - Analytical techniques: A practical guide to answering b...
PPTX
The Finishing Line
PPTX
I love the smell of data in the morning (getting started with data science) ...
PDF
Supercharge your AB testing with automated causal inference - Community Works...
PDF
Being Intentional: Privacy Engineering and A/B Testing
PDF
Shift-Left Testing: QA in a DevOps World by David Laulusa
PPTX
Planning of experiment in industrial research
PDF
Optimizely Workshop: Take Action on Results with Statistics
PPTX
shubhampresentation-180430060134.pptx
PDF
The Art of Unit Testing Feedback
PPTX
6 Evaluating Predictive Performance and ensemble.pptx
PPTX
Building a Testing Playbook by Andrew Richardson
PPTX
Statistical Learning and Model Selection (1).pptx
PDF
Introduction to Artificial Intelligence_ Lec 10
Dowhy: An end-to-end library for causal inference
TEST #1Perform the following two-tailed hypothesis test, using a.docx
Setting up an A/B-testing framework
신뢰할 수 있는 A/B 테스트를 위해 알아야 할 것들
Andrii Belas: A/B testing overview: use-cases, theory and tools
Faster and cheaper, smart ab experiments - public ver.
GIAF UK Winter 2015 - Analytical techniques: A practical guide to answering b...
The Finishing Line
I love the smell of data in the morning (getting started with data science) ...
Supercharge your AB testing with automated causal inference - Community Works...
Being Intentional: Privacy Engineering and A/B Testing
Shift-Left Testing: QA in a DevOps World by David Laulusa
Planning of experiment in industrial research
Optimizely Workshop: Take Action on Results with Statistics
shubhampresentation-180430060134.pptx
The Art of Unit Testing Feedback
6 Evaluating Predictive Performance and ensemble.pptx
Building a Testing Playbook by Andrew Richardson
Statistical Learning and Model Selection (1).pptx
Introduction to Artificial Intelligence_ Lec 10
Ad

More from Stitch Fix Algorithms (11)

PPTX
Deep recommendations in PyTorch
PDF
Tracking data lineage at Stitch Fix
PDF
Improving ad hoc and production workflows at Stitch Fix
PDF
A compute infrastructure for data scientists
PPTX
Moment-based estimation for hierarchical models in Apache Spark
PDF
Production model deployment
PPTX
Optimizing Spark
PPTX
When We Spark and When We Don’t: Developing Data and ML Pipelines
PPTX
Incrementality
PDF
Apache Spark & ML Workflows
PDF
Enabling full stack data scientists
Deep recommendations in PyTorch
Tracking data lineage at Stitch Fix
Improving ad hoc and production workflows at Stitch Fix
A compute infrastructure for data scientists
Moment-based estimation for hierarchical models in Apache Spark
Production model deployment
Optimizing Spark
When We Spark and When We Don’t: Developing Data and ML Pipelines
Incrementality
Apache Spark & ML Workflows
Enabling full stack data scientists

Recently uploaded (20)

PDF
Blue Purple Modern Animated Computer Science Presentation.pdf.pdf
PDF
MIND Revenue Release Quarter 2 2025 Press Release
PPT
“AI and Expert System Decision Support & Business Intelligence Systems”
PDF
Machine learning based COVID-19 study performance prediction
PDF
Approach and Philosophy of On baking technology
PDF
The Rise and Fall of 3GPP – Time for a Sabbatical?
PPTX
Programs and apps: productivity, graphics, security and other tools
PPTX
KOM of Painting work and Equipment Insulation REV00 update 25-dec.pptx
PDF
Build a system with the filesystem maintained by OSTree @ COSCUP 2025
PDF
Dropbox Q2 2025 Financial Results & Investor Presentation
DOCX
The AUB Centre for AI in Media Proposal.docx
PDF
Architecting across the Boundaries of two Complex Domains - Healthcare & Tech...
PDF
Advanced methodologies resolving dimensionality complications for autism neur...
PDF
NewMind AI Weekly Chronicles - August'25 Week I
PDF
TokAI - TikTok AI Agent : The First AI Application That Analyzes 10,000+ Vira...
PDF
Agricultural_Statistics_at_a_Glance_2022_0.pdf
PPTX
VMware vSphere Foundation How to Sell Presentation-Ver1.4-2-14-2024.pptx
PPT
Teaching material agriculture food technology
PDF
7 ChatGPT Prompts to Help You Define Your Ideal Customer Profile.pdf
PDF
Encapsulation theory and applications.pdf
Blue Purple Modern Animated Computer Science Presentation.pdf.pdf
MIND Revenue Release Quarter 2 2025 Press Release
“AI and Expert System Decision Support & Business Intelligence Systems”
Machine learning based COVID-19 study performance prediction
Approach and Philosophy of On baking technology
The Rise and Fall of 3GPP – Time for a Sabbatical?
Programs and apps: productivity, graphics, security and other tools
KOM of Painting work and Equipment Insulation REV00 update 25-dec.pptx
Build a system with the filesystem maintained by OSTree @ COSCUP 2025
Dropbox Q2 2025 Financial Results & Investor Presentation
The AUB Centre for AI in Media Proposal.docx
Architecting across the Boundaries of two Complex Domains - Healthcare & Tech...
Advanced methodologies resolving dimensionality complications for autism neur...
NewMind AI Weekly Chronicles - August'25 Week I
TokAI - TikTok AI Agent : The First AI Application That Analyzes 10,000+ Vira...
Agricultural_Statistics_at_a_Glance_2022_0.pdf
VMware vSphere Foundation How to Sell Presentation-Ver1.4-2-14-2024.pptx
Teaching material agriculture food technology
7 ChatGPT Prompts to Help You Define Your Ideal Customer Profile.pdf
Encapsulation theory and applications.pdf

Progression by Regression: How to increase your A/B Test Velocity

  • 1. Progression by Regression: How to increase your A/B Test Velocity August 2018 Aaron Bradley linkedin.com/in/abradle2 Stefan Krawczyk @stefkrawczyk linkedin.com/in/skrawczyk
  • 2. Contents What is Stitch Fix? Why A/B Test? Why is A/B Test velocity important? Formulating an Opinion Those t-tests Regression Regression @ Stitch Fix In Conclusion
  • 3. Who: we’re data platform engineers working on Stitch Fix’s Expt. Platform
  • 5. What is Stitch Fix? Try out Stitch Fix → goo.gl/Q3tCQ3
  • 8. Lots of opportunity for experimentation!
  • 9. At your own leisure Algorithms Tour: - https://algorithms-tour.stitchfix.com/ Multithreaded Blog: - https://multithreaded.stitchfix.com/algorithms/blog/
  • 13. To attempt to infer causality for the purpose of having confidence in making decisions Goal of A/B Testing
  • 14. Goal of A/B Testing: Example http://blog.twn.ee/sites/default/files/inline-images/02.png.pagespeed.ce_.BmWcShEZAM.png
  • 15. Goal of A/B Testing: Example http://blog.twn.ee/sites/default/files/inline-images/02.png.pagespeed.ce_.BmWcShEZAM.png https://pixabay.com/en/decision-choice-path-road-1697537/ ?
  • 16. Why is A/B test velocity important?
  • 17. The faster this cycle is:
  • 18. “The more you can learn about your business model” The faster this cycle is:
  • 19. “The more you can learn about your business model” The faster this cycle is:
  • 20. Specifically this means We want to complete experiments at a faster cadence! vs ?
  • 22. How do we formulate an opinion? http://blog.twn.ee/sites/default/files/inline-images/02.png.pagespeed.ce_.BmWcShEZAM.png https://pixabay.com/en/decision-choice-path-road-1697537/ ? ?
  • 23. “Can we reject the null hypothesis?” Formal Statistical Phrasing
  • 24. “Given the observed data, how likely could these differences have occurred by chance?” In Plain English
  • 25. To name some: ● Chi-squared ● Binomial proportions ● ANOVA ● Regression ● Wald test ● Welch’s t-test ● One sample t-test ● Two sample t-test ● Paired t-test ● Z-test ● Generalized estimating equations There are a bunch of statistical tests Choosing one depends on things like: ● Type of data, e.g. binomial or continuous ● Amount of data ● Independence assumptions of the data ● Outcome that you’re testing ● Whether you’re a statistician...
  • 26. Choosing one depends on things like: ● Type of data, e.g. binomial or continuous ● Amount of data ● Independence assumptions of the data ● Outcome that you’re testing ● Whether you’re a statistician... To name some: ● Chi-squared ● Binomial proportions ● ANOVA ● Regression ● Wald test ● Welch’s t-test ● One sample t-test ● Two sample t-test ● Paired t-test ● Z-test ● Generalized estimating equations There are a bunch of statistical tests
  • 28. The t-test is the most common method used in A/B testing. A t-test is a way to compare two means. It relates to the T-distribution. General form: What is a t-test?
  • 29. The t-test is the most common method used in A/B testing. A t-test is a way to compare two means. It relates to the T-distribution. General form: What is a t-test? Difference of means Standard Error: Contains standard deviation and sample size. Use this value to get a measure of probability of seeing this result by chance using T-distribution
  • 30. The t-test is the most common method used in A/B testing. A t-test is a way to compare two means. It relates to the T-distribution. General form: What is a t-test? Difference of means Standard Error*: Use this value to get a measure of probability of seeing this result by chance using T-distribution
  • 31. The t-test is the most common method used in A/B testing. A t-test is a way to compare two means. It relates to the T-distribution. General form: What is a t-test? Difference of means Standard Error*: Use this value to get a measure of probability of seeing this result by chance using T-distribution
  • 32. There are a few different variations of the t-test. People most likely use/refer to the two-sample t-test. A t-test is assumed to be only used for comparing continuous data: E.g.: ● Height ● Weight ● Time spent on page ● Lifetime value (LTV) ● etc. Two Sample t-test
  • 33. There are a few different variations of the t-test. People most likely use/refer to the two-sample t-test. A t-test is assumed to be only used for comparing continuous data: E.g.: ● Height ● Weight ● Time spent on page ● Lifetime value (LTV) ● etc. Two Sample t-test But using the Central Limit Theorem you can also use it for: ● Proportions ● Count data ● ...
  • 34. There are a few different T-tests. People most likley use/refer to the two-sample t-test. A t-test is assumed to be only used for comparing continuous data: E.g.: ● Height ● Weight ● Time spent on page ● Lifetime value (LTV) ● etc. Two Sample t-test But using the Central Limit Theroem you can also use it for: ● Proportions ● Count data ● ...
  • 35. One reason for its widespread use is that it is easy to calculate: ● Just need to be able to sum, divide, square, and square root! ○ You can even do it in SQL … ! There are some assumptions on: ● Independence ● Normally distributed ● Homogeneity of variances* Two Sample t-test
  • 36. One reason for its widespread use is that it is easy to calculate: ● Just need to be able to sum, divide, square, and square root! ○ You can even do it in SQL … ! There are some assumptions on: ● Independence ● Normally distributed ● Homogeneity of variances Two Sample t-test
  • 37. Slow downs with the t-test
  • 38. Slow downs with the t-test Type I Errors (False Positives) vs Type II Errors (False Negatives) α β
  • 39. We need to balance: Type I Errors (false positives): “Rejecting the null hypothesis while it is true” Type II Errors (false negatives): “Incorrectly retaining the null hypothesis.” Reasons that slow us down
  • 40. Controlling for Type I Errors == Significance == α Typically set at 0.05 or 5% → so 1 / 20 False Positives This where a p-value of 0.05 being significant comes from. Typically you don’t change this threshold to go faster. Reasons that slow us down
  • 41. Controlling for Type I Errors == Significance == α Typically set at 0.05 or 5% → so 1 / 20 False Positives This where a p-value of 0.05 being significant comes from. Typically you don’t change this threshold to go faster. Reasons that slow us down
  • 42. Controlling for Type II Errors == Power == (1 - 𝛃) “Probability that you correctly rejected the null hypothesis.” Standard is 0.8 or 80% → 4 / 5 times if there was an effect you’d be able to detect it. Power is affected by: ● Effect size. ● Sample size. ● Variation of the data Reasons that slow us down } Standard Error
  • 43. Tangent: What is an underpowered expt.? http://rpsychologist.com/d3/NHST/
  • 44. Tangent: What is an underpowered expt.? http://rpsychologist.com/d3/NHST/
  • 45. So how can we move faster?
  • 46. So how can we move faster? 1. Only make bigger changes
  • 47. So how can we move faster? 1. Only make bigger changes → Need bigger ideas / more resources. …
  • 48. So how can we move faster? 1. Only make bigger changes → Need bigger ideas / more resources. 1. Increase sample size
  • 49. So how can we move faster? 1. Only make bigger changes → Need bigger ideas / more resources. 1. Increase sample size → Run longer tests.
  • 50. So how can we move faster? 1. Only make bigger changes → Need bigger ideas / more resources. 1. Increase sample size → Run longer tests. 1. Reduce variability
  • 51. So how can we move faster? 1. Only make bigger changes → Need bigger ideas / more resources. 1. Increase sample size → Run longer tests. 1. Reduce variability → Detect smaller changes / run shorter tests!
  • 52. So how can we move faster? 1. Only make bigger changes → Need bigger ideas / more resources. 1. Increase sample size → Run longer tests. 1. Reduce variability → Detect smaller changes / run shorter tests! → Reduce the standard deviation term!
  • 53. So how can we move faster? 1. Only make bigger changes → Need bigger ideas / more resources. 1. Increase sample size → Run longer tests. 1. Reduce variability → Detect smaller changes / run shorter tests! → Reduce the standard deviation term! But you can’t do this with a two sample t-test!
  • 55. How regression does and doesn’t help Regression enables: ● Increasing power with covariates ● Increased test velocity ● Bias correction* ● Handling of more complex correlation structure* Regression does not: ● Allow you to skip your power analysis (you are running power analyses, right? I’m sure you are) ● Allow you to run underpowered experiments ● Remove the need for good experimental design ● Solve peeking or multiple comparisons concerns* ● Automatically enable sequential testing* ● Adjust for winner’s curse**Not covered in this talk
  • 56. How regression does and doesn’t help Regression enables: ● Increasing power with covariates ● Increased test velocity ● Bias correction* ● Handling of more complex correlation structure* Regression does not: ● Allow you to skip your power analysis (you are running power analyses, right? I’m sure you are) ● Allow you to run underpowered experiments ● Remove the need for good experimental design ● Solve peeking or multiple comparisons concerns* ● Automatically enable sequential testing* ● Adjust for winner’s curse**Not covered in this talk
  • 57. People often think of regression for prediction, t-tests for inference. But t-tests are a special case of linear regression. You can use regression in place of t-tests, and it opens the door to new levers - efficiency. What to get out of this section
  • 58. You can use regression instead of t-tests. But why? Using regression for hypothesis testing within condition variability between condition variability
  • 59. You can use regression instead of t-tests. But why? Using regression for hypothesis testing Cell A Cell B within condition variability between condition variability
  • 60. You can use regression instead of t-tests. But why? Using regression for hypothesis testing Cell A Cell B within condition variability between condition variability
  • 61. You can use regression instead of t-tests. But why? Using regression for hypothesis testing Cell A Cell B within condition variability between condition variability
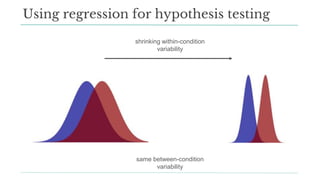
  • 62. Using regression for hypothesis testing β ^ H0: β = 0 Ha: β ≠ 0 within condition variability between condition variability You can use linear regression instead of t-tests. But why? Regression gives us a lever to decrease variance without increasing n by modeling out some within-condition variability
  • 63. Using regression for hypothesis testing shrinking within-condition variability same between-condition variability
  • 64. Example - Client Email Campaign Control Variant Are users who receive the new variant of a marketing email more likely have an increased Average Order Value (AOV) on their next shipment?
  • 65. Example - Client Email Campaign Control Variant What explains a higher order value for a client? Between condition variability ● The treatment (hopefully!) Within condition variability ● How long they’ve been a client ● A client’s order value on their last shipment ● Delay between when they received the email and when they opened it
  • 66. Example - Client Email Campaign Control Variant Between condition variability ● The treatment (hopefully!) Within condition variability ● How long they’ve been a client ● A client’s order value on their last shipment ● Delay between when they received the email and when they opened it What explains a higher order value for a client?
  • 67. Example - Client Email Campaign Control Variant Between condition variability ● The treatment (hopefully!) Within condition variability ● How long they’ve been a client ● A client’s order value on their last shipment ● Delay between when they received the email and when they opened it aov ~ 1 + cell_id + client_tenure + ov_previous_shipment https://exp-platform.com/Documents/2013-02-CUPED-ImprovingSensitivityOfControlledExperiments.pdf
  • 68. Getting increased power by controlling for covariates requires you to find covariates which decrease between-condition variability ● Make sure they aren’t correlated with the treatment ○ Rule of thumb: only use pre-experiment data ● Best covariates are highly correlated with your outcome variable ○ Often the pre-experiment value of your outcome is best one ● Visitor / conversion experiments: let us know what you find! Covariates: what to use https://exp-platform.com/Documents/2013-02-CUPED-ImprovingSensitivityOfControlledExperiments.pdf
  • 70. Regression: How we do it ● Model computed on-the-fly in metrics-service ● Simple python app fetching data from presto ● statsmodels / patsy for regression ● BYOD for more complex models (bootstrapping, hierarchical mixed models, gee, etc) Metrics Service Data Warehouse Presto Nightly ETLs
  • 71. Regression: Things we’ve tried ● R vs Spark vs Python ● Data size: big vs small. ● Nightly ETL vs Online ● Slice & Dice vs Preset Filters
  • 72. Regression: How we do it ● Metrics defined in yaml file ● Model is specified via type, family, link, label column (response), and covariates ● SQL query to provide necessary columns from underlying experiments tables order_value ~ 1 + cell_id + tenure
  • 73. python: statsmodels + patsy import pandas as pd import statsmodels.api as sm import statsmodels.formula.api as smf # fetch data somehow. returned data frame has columns cell_id, order_value df = get_data() # make cell_id categorical df.cell_id = df.cell_id.astype('category', categories=[1,2]) # intercept term is implicit in following formula model = smf.ols(formula='order_value ~ cell_id', data=df) model_fit = model.fit() print(model_fit.summary()) control_cell_estimate = model_fit.params['Intercept'] treatment_cell_estimate = model_fit.params['Intercept'] + model_fit.params['cell_id[T.2]'] p = model_fit.pvalues['cell_id[T.2]'] Linear Regression: Example Code Gotchas ● cell_id must be categorical - needs to be dummy encoded ● continuous covariates: mean-center ● discrete covariates: think about proper contrast coding ● be careful about 1 vs 2 sided hypotheses ● think about correlations between your randomization units
  • 74. Statsmodels summary() output: ============================================================================== coef std err t P>|t| [0.025 0.975] --------------------------------------------------------- -------------------------------- x1 0.4639 0.162 2.864 0.008 0.132 0.796 x2 0.0105 0.019 0.539 0.594 -0.029 0.050 x3 0.3786 0.139 2.720 0.011 0.093 0.664 const -1.4980 0.524 -2.859 0.008 -2.571 -0.425 ============================================================================== Linear Regression: Example Output
  • 76. ● You can use regression in place of a t-test today! 76 Conclusion
  • 77. ● You can use regression in place of a t-test today! ● Regression gives you the tools to better control variance. 77 Conclusion
  • 79. ● You can use regression in place of a t-test today! ● Regression gives you the tools to better control variance. ● Moar Power! ● With increased power you can conclude more tests faster. 79 Conclusion
  • 80. ● You can use regression in place of a t-test today! ● Regression gives you the tools to better control variance. ● Moar Power! ● With increased power you can conclude more tests faster. ● Or, you can measure smaller changes better. 80 Conclusion