SlideShare a Scribd company logo
2
Most read
3
Most read
5
Most read
PROPERTIES OF
ESTIMATORS (BLUE)
KSHITIZ GUPTA
WHAT IS AN ESTIMATOR?
• In statistics, an estimator is a rule for calculating an
estimate of a given quantity based on observed data
• Example-
i. X follows a normal distribution, but we do not know the
parameters of our distribution, namely mean (μ) and
variance (σ2 )
ii. To estimate the unknowns, the usual procedure is to
draw a random sample of size ‘n’ and use the sample
data to estimate parameters.
TWO TYPES OF ESTIMATORS
• Point Estimators
A point estimate of a population parameter is a single value of a
statistic.
For example, the sample mean x is a point estimate of the
population mean μ. Similarly, the sample proportion p is a point
estimate of the population proportion P.
• Interval Estimators
An interval estimate is defined by two numbers, between which
a population parameter is said to lie. For example, a < x < b is
an interval estimate of the population mean μ. It indicates that
the population mean is greater than a but less than b.
PROPERTIES OF BLUE
• B-BEST
• L-LINEAR
• U-UNBIASED
• E-ESTIMATOR
An estimator is BLUE if the following hold:
1. It is linear (Regression model)
2. It is unbiased
3. It is an efficient estimator(unbiased estimator with least
variance)
LINEARITY
• An estimator is said to be a linear estimator of (β) if it is a
linear function of the sample observations
• Sample mean is a linear estimator because it is a linear
function of the X values.
UNBIASEDNESS
• A desirable property of a distribution of estimates iS that
its mean equals the true mean of the variables being
estimated
• Formally, an estimator is an unbiased estimator if its
sampling distribution has as its expected value equal to
the true value of population.
• We also write this as follows:
Similarly, if this is not the case, we say that the estimator is
biased
• Similarly, if this is not the case, we say that the estimator
is biased
• Bias=E( ) - β
Properties of estimators (blue)
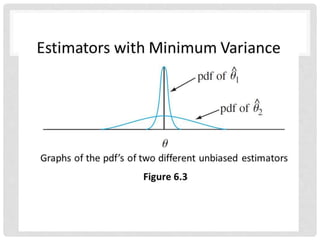
MINIMUM VARIANCE
• Just as we wanted the mean of the sampling distribution to be
centered around the true population , so too it is desirable for
the sampling distribution to be as narrow (or precise) as
possible.
– Centering around “the truth” but with high variability might be of
very little use
• One way of narrowing the sampling distribution is to increase
the sampling size
Properties of estimators (blue)
BLUE

More Related Content

PPTX
National Income
PPTX
Ols by hiron
PPTX
Blue property assumptions.
DOCX
7 classical assumptions of ordinary least squares
PPTX
Fiscal policy
PDF
Regression Analysis
PPT
Basic econometrics lectues_1
PDF
International business | Hand Written Notes | B.com | by Ritish bedi #RVIRGO
National Income
Ols by hiron
Blue property assumptions.
7 classical assumptions of ordinary least squares
Fiscal policy
Regression Analysis
Basic econometrics lectues_1
International business | Hand Written Notes | B.com | by Ritish bedi #RVIRGO

What's hot (20)

PPTX
Heteroscedasticity
PPTX
Distributed lag model
PPT
Auto Correlation Presentation
PPTX
Heteroscedasticity
PPTX
HO THEORY MODERN THEORY OF INTERNATIONAL TRADE
PPTX
Autocorrelation
PPT
Unit Root Test
PDF
Advanced Econometrics by Sajid Ali Khan Rawalakot: 0334-5439066
PPTX
Lesson 2 stationary_time_series
PPTX
R square vs adjusted r square
PPT
Autocorrelation- Concept, Causes and Consequences
PPT
Lecture 4
DOCX
Dummy variable
PPTX
Multicolinearity
PPTX
Mills theory of reciprocal demand
PPTX
Overview of econometrics 1
PPTX
Types of data by kamran khan
PPTX
INDICATORS OF ECONOMIC DEVELOPMENT.pptx
PPTX
Moving average method maths ppt
PPTX
Introduction to Econometrics
Heteroscedasticity
Distributed lag model
Auto Correlation Presentation
Heteroscedasticity
HO THEORY MODERN THEORY OF INTERNATIONAL TRADE
Autocorrelation
Unit Root Test
Advanced Econometrics by Sajid Ali Khan Rawalakot: 0334-5439066
Lesson 2 stationary_time_series
R square vs adjusted r square
Autocorrelation- Concept, Causes and Consequences
Lecture 4
Dummy variable
Multicolinearity
Mills theory of reciprocal demand
Overview of econometrics 1
Types of data by kamran khan
INDICATORS OF ECONOMIC DEVELOPMENT.pptx
Moving average method maths ppt
Introduction to Econometrics
Ad

Similar to Properties of estimators (blue) (20)

PDF
R training4
PPT
Ch. 2 (B) Theory of Estimation ABOUT MARKETING
PPTX
BIOSTATISTICS.pptx
PDF
DOTE 2011 Lecture9 - Estimation - 0930.pdf
PPTX
stats for 1st sem MBA atudents hypothesis testing notes
PPTX
Statistics-3 : Statistical Inference - Core
PPTX
Basic stat analysis using excel
PPTX
Sampling distribution
DOCX
Planning-Data-Analysis-CHOOSING-STATISTICAL-TOOL.docx
PPT
Review of Chapters 1-5.ppt
PPTX
1 introduction to psychological statistics
PPTX
inferencial statistics
PPTX
Statistics
PPTX
Univariate Analysis
PPTX
Estimation and hypothesis
PPT
Chapter34
PPTX
Sampling fundamentals
PPTX
Descriptive Analysis.pptx
PPTX
statistics in psychology and education for studentds
PDF
Statistics of engineer’s with basic concepts in statistics
R training4
Ch. 2 (B) Theory of Estimation ABOUT MARKETING
BIOSTATISTICS.pptx
DOTE 2011 Lecture9 - Estimation - 0930.pdf
stats for 1st sem MBA atudents hypothesis testing notes
Statistics-3 : Statistical Inference - Core
Basic stat analysis using excel
Sampling distribution
Planning-Data-Analysis-CHOOSING-STATISTICAL-TOOL.docx
Review of Chapters 1-5.ppt
1 introduction to psychological statistics
inferencial statistics
Statistics
Univariate Analysis
Estimation and hypothesis
Chapter34
Sampling fundamentals
Descriptive Analysis.pptx
statistics in psychology and education for studentds
Statistics of engineer’s with basic concepts in statistics
Ad

Recently uploaded (20)

PPTX
Qualitative Qantitative and Mixed Methods.pptx
PPT
Miokarditis (Inflamasi pada Otot Jantung)
PDF
Galatica Smart Energy Infrastructure Startup Pitch Deck
PDF
TRAFFIC-MANAGEMENT-AND-ACCIDENT-INVESTIGATION-WITH-DRIVING-PDF-FILE.pdf
PPTX
Supervised vs unsupervised machine learning algorithms
PPTX
iec ppt-1 pptx icmr ppt on rehabilitation.pptx
PPTX
AI Strategy room jwfjksfksfjsjsjsjsjfsjfsj
PDF
Mega Projects Data Mega Projects Data
PPTX
The THESIS FINAL-DEFENSE-PRESENTATION.pptx
PPT
ISS -ESG Data flows What is ESG and HowHow
PPTX
advance b rammar.pptxfdgdfgdfsgdfgsdgfdfgdfgsdfgdfgdfg
PPTX
Introduction to Firewall Analytics - Interfirewall and Transfirewall.pptx
PPTX
Business Acumen Training GuidePresentation.pptx
PPTX
Introduction-to-Cloud-ComputingFinal.pptx
PPTX
Business Ppt On Nestle.pptx huunnnhhgfvu
PPTX
STUDY DESIGN details- Lt Col Maksud (21).pptx
PDF
BF and FI - Blockchain, fintech and Financial Innovation Lesson 2.pdf
PDF
“Getting Started with Data Analytics Using R – Concepts, Tools & Case Studies”
PPTX
IB Computer Science - Internal Assessment.pptx
Qualitative Qantitative and Mixed Methods.pptx
Miokarditis (Inflamasi pada Otot Jantung)
Galatica Smart Energy Infrastructure Startup Pitch Deck
TRAFFIC-MANAGEMENT-AND-ACCIDENT-INVESTIGATION-WITH-DRIVING-PDF-FILE.pdf
Supervised vs unsupervised machine learning algorithms
iec ppt-1 pptx icmr ppt on rehabilitation.pptx
AI Strategy room jwfjksfksfjsjsjsjsjfsjfsj
Mega Projects Data Mega Projects Data
The THESIS FINAL-DEFENSE-PRESENTATION.pptx
ISS -ESG Data flows What is ESG and HowHow
advance b rammar.pptxfdgdfgdfsgdfgsdgfdfgdfgsdfgdfgdfg
Introduction to Firewall Analytics - Interfirewall and Transfirewall.pptx
Business Acumen Training GuidePresentation.pptx
Introduction-to-Cloud-ComputingFinal.pptx
Business Ppt On Nestle.pptx huunnnhhgfvu
STUDY DESIGN details- Lt Col Maksud (21).pptx
BF and FI - Blockchain, fintech and Financial Innovation Lesson 2.pdf
“Getting Started with Data Analytics Using R – Concepts, Tools & Case Studies”
IB Computer Science - Internal Assessment.pptx

Properties of estimators (blue)

  • 2. WHAT IS AN ESTIMATOR? • In statistics, an estimator is a rule for calculating an estimate of a given quantity based on observed data • Example- i. X follows a normal distribution, but we do not know the parameters of our distribution, namely mean (μ) and variance (σ2 ) ii. To estimate the unknowns, the usual procedure is to draw a random sample of size ‘n’ and use the sample data to estimate parameters.
  • 3. TWO TYPES OF ESTIMATORS • Point Estimators A point estimate of a population parameter is a single value of a statistic. For example, the sample mean x is a point estimate of the population mean μ. Similarly, the sample proportion p is a point estimate of the population proportion P. • Interval Estimators An interval estimate is defined by two numbers, between which a population parameter is said to lie. For example, a < x < b is an interval estimate of the population mean μ. It indicates that the population mean is greater than a but less than b.
  • 4. PROPERTIES OF BLUE • B-BEST • L-LINEAR • U-UNBIASED • E-ESTIMATOR An estimator is BLUE if the following hold: 1. It is linear (Regression model) 2. It is unbiased 3. It is an efficient estimator(unbiased estimator with least variance)
  • 5. LINEARITY • An estimator is said to be a linear estimator of (β) if it is a linear function of the sample observations • Sample mean is a linear estimator because it is a linear function of the X values.
  • 6. UNBIASEDNESS • A desirable property of a distribution of estimates iS that its mean equals the true mean of the variables being estimated • Formally, an estimator is an unbiased estimator if its sampling distribution has as its expected value equal to the true value of population. • We also write this as follows: Similarly, if this is not the case, we say that the estimator is biased
  • 7. • Similarly, if this is not the case, we say that the estimator is biased • Bias=E( ) - β
  • 9. MINIMUM VARIANCE • Just as we wanted the mean of the sampling distribution to be centered around the true population , so too it is desirable for the sampling distribution to be as narrow (or precise) as possible. – Centering around “the truth” but with high variability might be of very little use • One way of narrowing the sampling distribution is to increase the sampling size
  • 11. BLUE

Editor's Notes

  • #3: Suppose there is a fixed parameter  that needs to be estimated. Then an "estimator" is a function that maps the sample space to a set of sample estimates. An estimator of  is usually denoted by the symbol .