1. PTAR: A Novel Marker for
Predicting Upper
Gastrointestinal Bleeding
Severity
Upper gastrointestinal bleeding (UGIB) is a life-threatening emergency
requiring rapid assessment and intervention. Early risk stratification is
crucial for determining effective management strategies. This
presentation introduces the International Normalized Ratio-to-Albumin
Ratio (PTAR) as a novel marker for predicting UGIB severity and
compares its performance with existing prognostic tools.
PT
by PLS DO NOT CHANGE THIS
2. The Impact of Upper Gastrointestinal Bleeding
$1B+
Annual Cost
Direct medical costs in the United States alone
26.4%
Variceal Bleeding
Percentage of patients with variceal bleeding in the study
36.2%
Ulcer Bleeding
Percentage of patients with ulcer bleeding in the study
37.4%
Other Causes
Including Mallory-Weiss tear, gastric cancer, angiodysplasia
UGIB represents a significant healthcare burden, requiring frequent hospitalizations and carrying substantial morbidity and
mortality risks. Early and accurate risk assessment is essential for optimizing patient outcomes and resource allocation.
3. Current Prognostic Tools for UGIB
Glasgow-Blatchford Score
(GBS)
Validated as an accurate tool for
assessing early UGIB severity.
Includes heart rate, systolic blood
pressure, blood urea nitrogen, and
hemoglobin levels. One of the most
commonly used assessment tools.
Rockall Score
Includes both pre- and post-
endoscopic components. Has high
predictive capability for mortality but
requires several components, making
it challenging to use in emergency
settings.
AIMS65 Score
Good predictor for hospitalization
length and in-hospital mortality.
Calculated using albumin level, INR,
mental status, systolic blood pressure,
and age. Simple but effective,
especially in patients with cirrhosis.
4. Limitations of Current Prognostic Tools
1 Complex Variables
Many current assessment tools require multiple clinical and laboratory variables, making
them difficult to calculate quickly in emergency settings when rapid decisions are crucial.
2 Need for Endoscopy
Some scoring systems like the complete Rockall score require endoscopy results, which
delays risk stratification and immediate decision-making in the emergency department.
3 Varying Performance
The predictive performance of existing tools can vary depending on patient populations
and specific outcomes (mortality, rebleeding, need for intervention), limiting their
universal applicability.
4 Resource Intensity
Comprehensive assessment using established scores may require resources that aren't
readily available in all emergency settings, particularly in resource-limited environments.
5. Introducing PTAR: A Novel Marker
Definition
PTAR (Prothrombin Time-
International Normalized Ratio-to-
Albumin Ratio) is an objective liver
function score model that divides the
PT-INR value by the albumin value.
Previous Applications
PTAR has been used for risk
stratification in hepatic cellular
carcinoma and sepsis, showing
strong correlations with outcomes in
liver-related conditions.
Liver Function Connection
Decreased liver function is associated
with higher mortality and morbidity
in UGIB patients, making liver
function assessment crucial in the
emergency department.
The simplicity of PTAR calculation makes it particularly attractive for emergency settings where rapid assessment is needed.
By combining measures of coagulation (PT-INR) and liver synthetic function (albumin), PTAR provides a comprehensive yet
straightforward evaluation of a patient's condition.
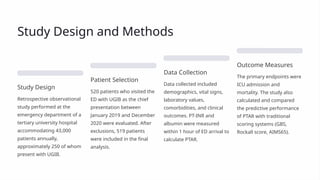
6. Study Design and Methods
Study Design
Retrospective observational
study performed at the
emergency department of a
tertiary university hospital
accommodating 43,000
patients annually,
approximately 250 of whom
present with UGIB.
Patient Selection
520 patients who visited the
ED with UGIB as the chief
presentation between
January 2019 and December
2020 were evaluated. After
exclusions, 519 patients
were included in the final
analysis.
Data Collection
Data collected included
demographics, vital signs,
laboratory values,
comorbidities, and clinical
outcomes. PT-INR and
albumin were measured
within 1 hour of ED arrival to
calculate PTAR.
Outcome Measures
The primary endpoints were
ICU admission and
mortality. The study also
calculated and compared
the predictive performance
of PTAR with traditional
scoring systems (GBS,
Rockall score, AIMS65).
7. Patient Characteristics
Characteristic All patients (n=519) Non-ICU (n=356) ICU (n=163) p-Value
Age (years) 63.86 ± 17.04 63.84 ± 18.31 63.91 ± 13.93 0.533
Male, n (%) 343 (66.1%) 216 (60.7%) 127 (77.9%) ≤0.001
SBP, mmHg 116 (53-254) 121 (53-222) 106 (53-254) ≤0.001
Hemoglobin, g/dL 9.6 (2.9-18.1) 10.4 (3.6-17.5) 8.2 (2.9-18.1) ≤0.001
PT-INR 1.11 (0.75-6.63) 1.08 (0.75-6.63) 1.26 (0.86-5.49) ≤0.001
Albumin, g/dL 3.5 (1.1-5.8) 3.7 (1.7-5.8) 3.1 (1.1-5.6) ≤0.001
The study population included 519 patients with UGIB: 137 (26.4%) with variceal bleeding, 188 (36.2%) with ulcer bleeding, and 194
(37.4%) with other causes. There were significant differences between ICU and non-ICU patients in multiple parameters, particularly
those related to bleeding severity and liver function.
8. Comparison: ICU vs. Non-ICU Patients
Vital Signs
ICU patients had significantly lower
systolic blood pressure (106 mmHg vs.
121 mmHg, p 0.001), indicating more
≤
severe hemodynamic compromise.
1
Hematologic Measures
ICU patients showed lower hemoglobin
(8.2 g/dL vs. 10.4 g/dL, p 0.001) and
≤
platelet count (164,000 vs. 214,000,
p 0.001), reflecting greater blood loss
≤
and potential coagulopathy.
2
Renal Function
Higher blood urea nitrogen (33.9 mg/dL
vs. 30.1 mg/dL, p 0.001) and creatinine
≤
(1.18 mg/dL vs. 0.96 mg/dL, p 0.001) in
≤
ICU patients suggested compromised
renal function.
3
Liver Function
ICU patients had higher PT-INR (1.26 vs.
1.08, p 0.001) and lower albumin levels
≤
(3.1 g/dL vs. 3.7 g/dL, p 0.001),
≤
indicating more significant liver
dysfunction.
4
The comparison reveals that ICU patients presented with more severe clinical and laboratory abnormalities across multiple organ
systems, particularly related to cardiovascular stability, hematologic parameters, and liver function.
9. Comparison: Survivors vs. Non-Survivors
Hemodynamic Status
Non-survivors showed
significantly lower systolic
blood pressure (100
mmHg vs. 117 mmHg,
p 0.001), indicating more
≤
severe shock and
cardiovascular
compromise.
Blood Loss Severity
The mortality group had
lower hemoglobin levels
(7.7 g/dL vs. 9.6 g/dL,
p 0.001), suggesting
≤
more severe bleeding and
potentially greater
transfusion requirements.
Organ Dysfunction
Non-survivors
demonstrated higher
creatinine (1.5 mg/dL vs.
0.98 mg/dL, p 0.001),
≤
higher PT-INR (1.50 vs.
1.10, p 0.001), and lower
≤
albumin (2.9 g/dL vs. 3.6
g/dL, p 0.001).
≤
Comorbidity Burden
All patients in the
mortality group (100%)
had comorbidities
compared to 85.7% in the
survivor group (p=0.032),
highlighting the impact of
pre-existing conditions on
outcomes.
10. Influencing Factors of ICU Admission
After adjusting for confounding factors (age, sex, systolic blood pressure, comorbidities, hemoglobin, and platelet count), PTAR emerged as the strongest predictor of ICU
admission with an adjusted odds ratio of 8.376 (95% CI: 2.722-25.774). This significantly outperformed traditional scoring systems, with AIMS65 having the next highest
adjusted odds ratio at 1.699 (95% CI: 1.318-2.192).
11. Influencing Factors of Mortality
PTAR Impact
PTAR demonstrated the highest
adjusted odds ratio for
mortality at 27.846 (95% CI:
8.701-89.116), making it the
strongest predictor of fatal
outcomes among all evaluated
metrics.
AIMS65 Performance
The AIMS65 score showed the
second highest adjusted odds
ratio at 2.154 (95% CI: 1.473-
3.149), confirming its
established utility in predicting
mortality.
Pre-Endoscopy Rockall
This score had moderate
predictive value with an
adjusted odds ratio of 1.647
(95% CI: 1.048-2.589),
supporting its continued use in
initial assessment.
GBS Limitations
After adjustment, the Glasgow-
Blatchford Score did not show
statistical significance for
mortality prediction,
highlighting its limitations in
this specific outcome.
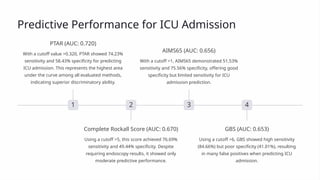
12. Predictive Performance for ICU Admission
1
PTAR (AUC: 0.720)
With a cutoff value >0.320, PTAR showed 74.23%
sensitivity and 58.43% specificity for predicting
ICU admission. This represents the highest area
under the curve among all evaluated methods,
indicating superior discriminatory ability.
2
Complete Rockall Score (AUC: 0.670)
Using a cutoff >5, this score achieved 76.69%
sensitivity and 49.44% specificity. Despite
requiring endoscopy results, it showed only
moderate predictive performance.
3
AIMS65 (AUC: 0.656)
With a cutoff >1, AIMS65 demonstrated 51.53%
sensitivity and 75.56% specificity, offering good
specificity but limited sensitivity for ICU
admission prediction.
4
GBS (AUC: 0.653)
Using a cutoff >6, GBS showed high sensitivity
(84.66%) but poor specificity (41.01%), resulting
in many false positives when predicting ICU
admission.
13. Predictive Performance for Mortality
1
PTAR (AUC: 0.816)
Highest predictive accuracy
2
AIMS65 (AUC: 0.764)
Strong mortality prediction
3
Complete Rockall (AUC: 0.741)
Good but requires endoscopy
4
Pre-endoscopy Rockall (AUC: 0.736)
Reliable early assessment
5
GBS (AUC: 0.657)
Limited mortality prediction
For mortality prediction, PTAR demonstrated superior performance with a cutoff value >0.358, yielding 85.71% sensitivity and 64.88% specificity. This significantly
outperformed all traditional scoring methods, including AIMS65 which showed the second-best performance. These findings suggest PTAR offers clinicians a more
accurate tool for identifying high-mortality-risk patients early in their presentation.
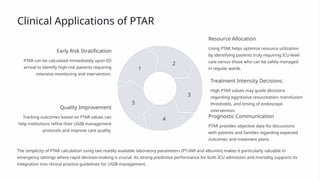
14. Clinical Applications of PTAR
Early Risk Stratification
PTAR can be calculated immediately upon ED
arrival to identify high-risk patients requiring
intensive monitoring and intervention.
1
Resource Allocation
Using PTAR helps optimize resource utilization
by identifying patients truly requiring ICU-level
care versus those who can be safely managed
in regular wards.
2
Treatment Intensity Decisions
High PTAR values may guide decisions
regarding aggressive resuscitation, transfusion
thresholds, and timing of endoscopic
intervention.
3
Prognostic Communication
PTAR provides objective data for discussions
with patients and families regarding expected
outcomes and treatment plans.
4
Quality Improvement
Tracking outcomes based on PTAR values can
help institutions refine their UGIB management
protocols and improve care quality.
5
The simplicity of PTAR calculation using two readily available laboratory parameters (PT-INR and albumin) makes it particularly valuable in
emergency settings where rapid decision-making is crucial. Its strong predictive performance for both ICU admission and mortality supports its
integration into clinical practice guidelines for UGIB management.
15. Conclusions and Future Directions
Simple Yet Powerful
PTAR represents a simple calculation using
two readily available laboratory parameters
(PT-INR and albumin) that outperforms more
complex scoring systems in predicting UGIB
outcomes.
Early Application
Unlike scoring systems requiring endoscopy
or multiple clinical variables, PTAR can be
calculated immediately upon ED arrival,
enabling rapid risk stratification when it
matters most.
Future Research
Prospective validation studies across diverse
patient populations and healthcare settings
are needed, as are investigations into whether
PTAR-guided interventions can improve
patient outcomes.
The PTAR measured in the emergency department is an independent factor strongly associated with ICU admission and mortality in patients with
UGIB. Its superior predictive capability compared to conventional scoring methods supports its use as a risk stratification marker in early
emergency settings. Further research should explore its applicability across different patient populations and whether PTAR-guided management
strategies can improve outcomes.