Python business intelligence (PyData 2012 talk)
66 likes22,564 views

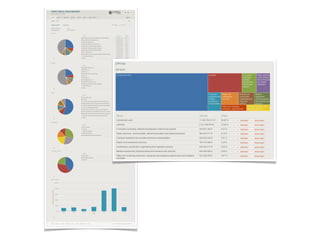
The document discusses the application of Python in business intelligence, focusing on data extraction, transformation, and loading (ETL) processes. It highlights how Python can enhance traditional data warehousing tasks, while also addressing community perceptions of its capabilities in handling scientific and financial data. The conclusion emphasizes the importance of maintaining a balance between people, technology, and processes in business intelligence.


![Scientific Data
T1[s] T2[s] T3[s] T4[s]
P1 112,68 941,67 171,01 660,48
P2 96,15 306,51 725,88 877,82
P3 313,39 189,31 41,81 428,68
P4 760,62 983,48 371,21 281,19
P5 838,56 39,27 389,42 231,12
n-dimensional array of numbers](https://image.slidesharecdn.com/pythonbusinessintelligencecubes-pydata2012-121203161809-phpapp02/85/Python-business-intelligence-PyData-2012-talk-26-320.jpg)


![transformation = [
('fiscal_year', {"w function": int,
". field":"fiscal_year"}),
('region_code', {"4 mapping": region_map,
". field":"region"}),
('borrower_country', None),
('project_name', None),
('procurement_type', None),
('major_sector_code', {"4 mapping": sector_code_map,
". field":"major_sector"}),
('major_sector', None),
('supplier', None),
('contract_amount', {"w function": currency_to_number,
". field": 'total_contract_amount'}
]
target fields source transformations](https://image.slidesharecdn.com/pythonbusinessintelligencecubes-pydata2012-121203161809-phpapp02/85/Python-business-intelligence-PyData-2012-talk-40-320.jpg)

![Model
{
“name” = “My Model”
“description” = ....
“cubes” = [...]
“dimensions” = [...]
}
cubes dimensions
measures levels, attributes, hierarchy](https://image.slidesharecdn.com/pythonbusinessintelligencecubes-pydata2012-121203161809-phpapp02/85/Python-business-intelligence-PyData-2012-talk-43-320.jpg)


![browser.aggregate(o cell,
. drilldown=[9 "sector"])
drill-down](https://image.slidesharecdn.com/pythonbusinessintelligencecubes-pydata2012-121203161809-phpapp02/85/Python-business-intelligence-PyData-2012-talk-46-320.jpg)
![for row in result.table_rows(“sector”):
row.record["amount_sum"]
q row.label k row.key](https://image.slidesharecdn.com/pythonbusinessintelligencecubes-pydata2012-121203161809-phpapp02/85/Python-business-intelligence-PyData-2012-talk-47-320.jpg)
![whole cube
o cell = Cell(cube)
browser.aggregate(o cell)
Total
browser.aggregate(o cell,
drilldown=[9 “date”])
2006 2007 2008 2009 2010
✂ cut = PointCut(9 “date”, [2010])
o cell = o cell.slice(✂ cut)
browser.aggregate(o cell,
drilldown=[9 “date”])
Jan Feb Mar Apr March April May ...](https://image.slidesharecdn.com/pythonbusinessintelligencecubes-pydata2012-121203161809-phpapp02/85/Python-business-intelligence-PyData-2012-talk-48-320.jpg)


Python business intelligence (PyData 2012 talk)
- 1. Python for Business Intelligence Štefan Urbánek ■ @Stiivi ■ stefan.urbanek@continuum.io ■ PyData NYC, October 2012
- 3. Results Q/A and articles with Java solution references (not listed here)
- 5. Why?
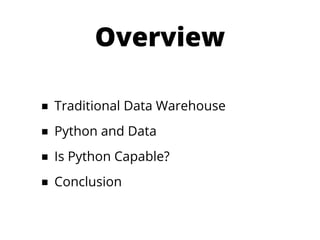
- 6. Overview ■ Traditional Data Warehouse ■ Python and Data ■ Is Python Capable? ■ Conclusion
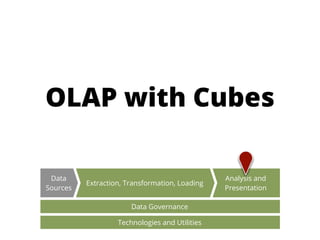
- 9. Data Analysis and Extraction, Transformation, Loading Sources Presentation Data Governance Technologies and Utilities
- 10. Traditional Data Warehouse
- 11. ■ Extracting data from the original sources ■ Quality assuring and cleaning data ■ Conforming the labels and measures in the data to achieve consistency across the original sources ■ Delivering data in a physical format that can be used by query tools, report writers, and dashboards. Source: Ralph Kimball – The Data Warehouse ETL Toolkit
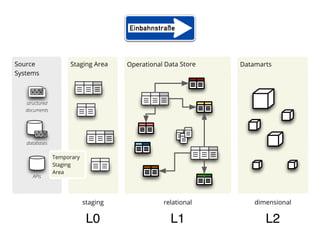
- 12. Source Staging Area Operational Data Store Datamarts Systems structured documents databases Temporary Staging Area APIs staging relational dimensional L0 L1 L2
- 13. real time = daily
- 14. Multi-dimensional Modeling
- 16. aggregation browsing slicing and dicing
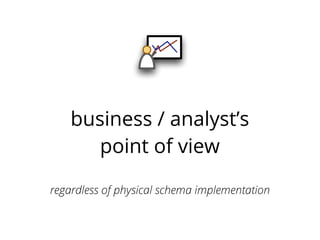
- 17. business / analyst’s point of view regardless of physical schema implementation
- 18. Facts measurable fact fact data cell most detailed information
- 19. location type time dimensions
- 20. Dimension ■ provide context for facts ■ used to filter queries or reports ■ control scope of aggregation of facts
- 21. Pentaho
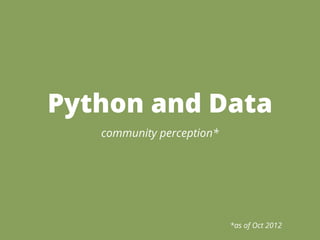
- 22. Python and Data community perception* *as of Oct 2012
- 24. Python
- 25. Data Analysis and Extraction, Transformation, Loading Sources Presentation Data Governance Technologies and Utilities
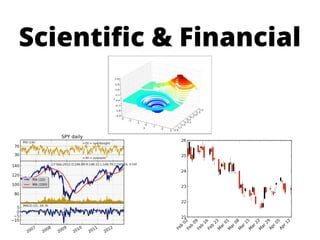
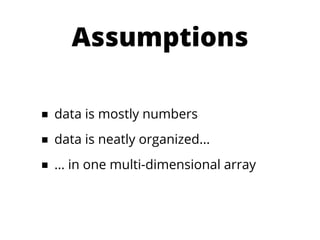
- 26. Scientific Data T1[s] T2[s] T3[s] T4[s] P1 112,68 941,67 171,01 660,48 P2 96,15 306,51 725,88 877,82 P3 313,39 189,31 41,81 428,68 P4 760,62 983,48 371,21 281,19 P5 838,56 39,27 389,42 231,12 n-dimensional array of numbers
- 27. Assumptions ■ data is mostly numbers ■ data is neatly organized... ■ … in one multi-dimensional array
- 28. Data Analysis and Extraction, Transformation, Loading Sources Presentation Data Governance Technologies and Utilities
- 29. Business Data
- 30. multiple snapshots of one source multiple representations categories are of same data changing
- 31. ❄
- 32. Is Python Capable? very basic examples
- 33. Data Pipes with SQLAlchemy Data Analysis and Extraction, Transformation, Loading Sources Presentation Data Governance Technologies and Utilities
- 34. ■ connection: create_engine ■ schema reflection: MetaData, Table ■ expressions: select(), insert()
- 35. src_engine = create_engine("sqlite:///data.sqlite") src_metadata = MetaData(bind=src_engine) src_table = Table('data', src_metadata, autoload=True) target_engine = create_engine("postgres://localhost/sandbox") target_metadata = MetaData(bind=target_engine) target_table = Table('data', target_metadata)
- 36. clone schema: for column in src_table.columns: target_table.append_column(column.copy()) target_table.create() copy data: insert = target_table.insert() for row in src_table.select().execute(): insert.execute(row)
- 38. text file (CSV) to table: reader = csv.reader(file_stream) columns = reader.next() for column in columns: table.append_column(Column(column, String)) table.create() for row in reader: insert.execute(row)
- 39. Simple T from ETL Data Analysis and Extraction, Transformation, Loading Sources Presentation Data Governance Technologies and Utilities
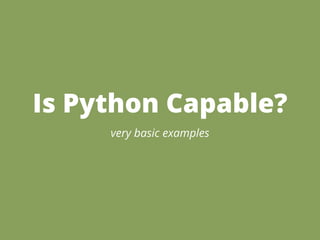
- 40. transformation = [ ('fiscal_year', {"w function": int, ". field":"fiscal_year"}), ('region_code', {"4 mapping": region_map, ". field":"region"}), ('borrower_country', None), ('project_name', None), ('procurement_type', None), ('major_sector_code', {"4 mapping": sector_code_map, ". field":"major_sector"}), ('major_sector', None), ('supplier', None), ('contract_amount', {"w function": currency_to_number, ". field": 'total_contract_amount'} ] target fields source transformations
- 41. Transformation for row in source: result = transform(row, [ transformation) table.insert(result).execute()
- 42. OLAP with Cubes Data Analysis and Extraction, Transformation, Loading Sources Presentation Data Governance Technologies and Utilities
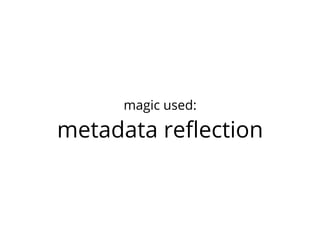
- 43. Model { “name” = “My Model” “description” = .... “cubes” = [...] “dimensions” = [...] } cubes dimensions measures levels, attributes, hierarchy
- 44. logical physical ❄
- 45. 1 load_model("model.json") Application ∑ 3 model.cube("sales") 4 workspace.browser(cube) cubes Aggregation Browser backend 2 create_workspace("sql", model, url="sqlite:///data.sqlite")
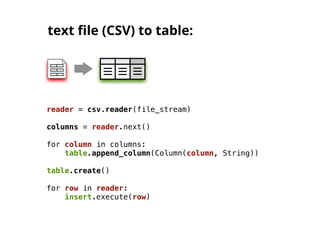
- 46. browser.aggregate(o cell, . drilldown=[9 "sector"]) drill-down
- 47. for row in result.table_rows(“sector”): row.record["amount_sum"] q row.label k row.key
- 48. whole cube o cell = Cell(cube) browser.aggregate(o cell) Total browser.aggregate(o cell, drilldown=[9 “date”]) 2006 2007 2008 2009 2010 ✂ cut = PointCut(9 “date”, [2010]) o cell = o cell.slice(✂ cut) browser.aggregate(o cell, drilldown=[9 “date”]) Jan Feb Mar Apr March April May ...
- 49. How can Python be Useful
- 50. just the Language ■ saves maintenance resources ■ shortens development time ■ saves your from going insane
- 51. Source Staging Area Operational Data Store Datamarts Systems structured documents databases faster Temporary Staging Area APIs staging relational dimensional L0 L1 L2
- 52. faster advanced Data Analysis and Extraction, Transformation, Loading Sources Presentation Data Governance Technologies and Utilities understandable, maintainable
- 53. Conclusion
- 54. BI is about… people technology processes
- 56. Future who is going to fix your COBOL Java tool if you have only Python guys around?
- 57. is capable, let’s start
- 58. Thank You [t Twitter: @Stiivi DataBrewery blog: blog.databrewery.org Github: github.com/Stiivi