Cubes - Lightweight Python OLAP (EuroPython 2012 talk)
43 likes12,899 views

Cubes provides lightweight OLAP capabilities for analytical modeling and reporting. It allows users to slice and dice analytical data using an aggregation browser and supports SQL backends for storage and querying. The logical model defines cubes, dimensions, and measures, which are then mapped to physical storage such as a SQL database for browsing and analysis.


![Model
{
“name” = “My Model”
“description” = ....
“cubes” = [...]
“dimensions” = [...]
}
cubes dimensions
measures levels, attributes, hierarchy](https://image.slidesharecdn.com/cubes-europython2012talk-120706022921-phpapp02/85/Cubes-Lightweight-Python-OLAP-EuroPython-2012-talk-13-320.jpg)


![Dimension
■ levels and attributes “dimensions” = [
{
■ hierarchy* “name”:”date”,
“levels”: ...
■ key attributes },
“hierarchy”: ...
...
■ label attributes ]
*partial support for multiple hierarchies](https://image.slidesharecdn.com/cubes-europython2012talk-120706022921-phpapp02/85/Cubes-Lightweight-Python-OLAP-EuroPython-2012-talk-18-320.jpg)

![Cube
“cubes” = [
{
“name”:”contracts”,
“dimensions”: [ “date”,
“category” ]
“measures”: [
■ dimensions {
“name”: “amount”,
“label”: “Contract Amount”,
■ measures }
“aggregations”: [“sum”]
]
},
...
]
*partial support for multiple hierarchies](https://image.slidesharecdn.com/cubes-europython2012talk-120706022921-phpapp02/85/Cubes-Lightweight-Python-OLAP-EuroPython-2012-talk-20-320.jpg)
!["attributes": [
{
"name":"group",
"label": "Group code"
localizable },
{
"name":"group_label",
model and attributes "label": "Group",
"locales": ["en", "sk"]
}
]](https://image.slidesharecdn.com/cubes-europython2012talk-120706022921-phpapp02/85/Cubes-Lightweight-Python-OLAP-EuroPython-2012-talk-21-320.jpg)


![Path
[45,2]
[2012, 6]
list of level keys](https://image.slidesharecdn.com/cubes-europython2012talk-120706022921-phpapp02/85/Cubes-Lightweight-Python-OLAP-EuroPython-2012-talk-30-320.jpg)


![browser.aggregate(o cell,
. drilldown=[9 "sector"])
drill-down](https://image.slidesharecdn.com/cubes-europython2012talk-120706022921-phpapp02/85/Cubes-Lightweight-Python-OLAP-EuroPython-2012-talk-34-320.jpg)
![for row in result.drilldown:
row["amount_sum"]
row[q label_attribute] row[k key]](https://image.slidesharecdn.com/cubes-europython2012talk-120706022921-phpapp02/85/Cubes-Lightweight-Python-OLAP-EuroPython-2012-talk-35-320.jpg)


![cut types
✂
point set range
[[2010,10], from=[2010,10]
[2010]
[2010,12]] to=[2010,12]](https://image.slidesharecdn.com/cubes-europython2012talk-120706022921-phpapp02/85/Cubes-Lightweight-Python-OLAP-EuroPython-2012-talk-40-320.jpg)

![whole cube
o cell = Cell(cube)
browser.aggregate(o cell)
Total
browser.aggregate(o cell,
drilldown=[9 “date”])
2006 2007 2008 2009 2010
✂ cut = PointCut(9 “date”, [2010])
o cell = o cell.slice(✂ cut)
browser.aggregate(o cell,
drilldown=[9 “date”])
Jan Feb Mar Apr March April May ...](https://image.slidesharecdn.com/cubes-europython2012talk-120706022921-phpapp02/85/Cubes-Lightweight-Python-OLAP-EuroPython-2012-talk-42-320.jpg)
![Drill-down Level
. drilldown = [9 "date"]
implicit: next from o cell
. drilldown = {9 "date": "month"}
explicit](https://image.slidesharecdn.com/cubes-europython2012talk-120706022921-phpapp02/85/Cubes-Lightweight-Python-OLAP-EuroPython-2012-talk-43-320.jpg)


![rows = ["item.category",
"item.subcategory"]
columns = ["year"]
measures = ["amount_sum"]
table = result.cross_table(
rows,
columns,
measures
)](https://image.slidesharecdn.com/cubes-europython2012talk-120706022921-phpapp02/85/Cubes-Lightweight-Python-OLAP-EuroPython-2012-talk-46-320.jpg)


![[server]
backend: sql
log_level: info
[model]
path: model.json
locales: en,sk
[workspace]
url: postgres://localhost/database
schema: datamart
fact_prefix: ft_
dimension_prefix: dm_
w](https://image.slidesharecdn.com/cubes-europython2012talk-120706022921-phpapp02/85/Cubes-Lightweight-Python-OLAP-EuroPython-2012-talk-51-320.jpg)

![GET aggregate
{
"cell": [],
"drilldown": [],
"summary": {
"record_count": 62,
"amount_sum": 1116860
}
}](https://image.slidesharecdn.com/cubes-europython2012talk-120706022921-phpapp02/85/Cubes-Lightweight-Python-OLAP-EuroPython-2012-talk-53-320.jpg)

![GET aggregate?cut=year:2010
{
"cell": [
{
"path": ["2010"],
"type": "point",
"dimension": "year",
"level_depth": 1
}
],
"drilldown": [],
"summary": {
"record_count": 31,
"amount_sum": 566020
}
}](https://image.slidesharecdn.com/cubes-europython2012talk-120706022921-phpapp02/85/Cubes-Lightweight-Python-OLAP-EuroPython-2012-talk-55-320.jpg)
![GET aggregate?drilldown=year
{
"cell": [],
"total_cell_count": 2,
"drilldown": [
{
"record_count": 31,
"amount_sum": 550840,
"year": 2009
},
{
"record_count": 31,
"amount_sum": 566020,
"year": 2010
}
],
"summary": {
"record_count": 62,
"amount_sum": 1116860
}
}](https://image.slidesharecdn.com/cubes-europython2012talk-120706022921-phpapp02/85/Cubes-Lightweight-Python-OLAP-EuroPython-2012-talk-56-320.jpg)
![GET report
Content-Type: application/json
list of cuts {
"cell": [
{
"dimension": "date",
"type": "range",
"from": [2009],
"to": [2011,6]
}
],
"queries": {
list of "by_segment": {
named queries "query": "aggregate",
"drilldown": ["segment"]
},
"by_year": {
"query": "aggregate",
"drilldown": {"date":"year"}
}
}
}](https://image.slidesharecdn.com/cubes-europython2012talk-120706022921-phpapp02/85/Cubes-Lightweight-Python-OLAP-EuroPython-2012-talk-57-320.jpg)


Cubes - Lightweight Python OLAP (EuroPython 2012 talk)
- 1. Cubes light-weight OLAP Stefan Urbanek ■ @Stiivi ■ stefan.urbanek@gmail.com ■ July 2012
- 2. source github.com/Stiivi/cubes documentation packages.python.org/cubes/
- 3. Overview ■ purpose ■ analytical modelling and OLAP ■ slicing and dicing ■ OLAP server ■ SQL backend
- 4. analytical data modelling lightweight
- 6. aggregation browsing slicing and dicing
- 7. modelling reporting aggregation browsing
- 8. Architecture
- 9. ✂ model browser http backends server
- 10. Logical Model multidimensional, analytical
- 11. business/analyst’s point of view
- 12. transactions analysis OLTP OLAP application (operational) data analytical data
- 13. Model { “name” = “My Model” “description” = .... “cubes” = [...] “dimensions” = [...] } cubes dimensions measures levels, attributes, hierarchy
- 14. Facts measurable fact fact data cell most detailed information
- 15. location type time dimensions
- 16. Dimension ■ provide context for facts ■ used to filter queries or reports ■ control scope of aggregation of facts
- 17. Hierarchy 2010 May 1st levels
- 18. Dimension ■ levels and attributes “dimensions” = [ { ■ hierarchy* “name”:”date”, “levels”: ... ■ key attributes }, “hierarchy”: ... ... ■ label attributes ] *partial support for multiple hierarchies
- 19. label attribute key attribute for links to slices
- 20. Cube “cubes” = [ { “name”:”contracts”, “dimensions”: [ “date”, “category” ] “measures”: [ ■ dimensions { “name”: “amount”, “label”: “Contract Amount”, ■ measures } “aggregations”: [“sum”] ] }, ... ] *partial support for multiple hierarchies
- 21. "attributes": [ { "name":"group", "label": "Group code" localizable }, { "name":"group_label", model and attributes "label": "Group", "locales": ["en", "sk"] } ]
- 22. Aggregation Browser ∑
- 23. ∑ measures
- 24. get more details
- 25. Aggregation Browser SQL Snowflake SQL Denormalized Some HTTP Data MongoDB Browser Browser Browser Service Browser ? “batteries” that are included
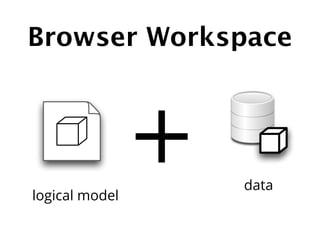
- 26. Browser Workspace logical model + data
- 27. Cell
- 29. cell
- 30. Path [45,2] [2012, 6] list of level keys
- 31. 1 load_model("model.json") Application ∑ 3 model.cube("sales") 4 workspace.browser(cube) cubes Aggregation Browser backend 2 create_workspace("sql", model, url="sqlite:///data.sqlite")
- 33. browser.aggregate(o cell) summary
- 34. browser.aggregate(o cell, . drilldown=[9 "sector"]) drill-down
- 35. for row in result.drilldown: row["amount_sum"] row[q label_attribute] row[k key]
- 36. received_amount_sum measure aggregation record_count
- 37. browser.facts(o cell) browser.values(o cell, 9 dimension) browser.cell_details(o cell)
- 38. ✂ Slicing and Dicing ✂
- 39. ✂ ✂ April 2012 constructi on work construction work in april 2012 type supplier date
- 40. cut types ✂ point set range [[2010,10], from=[2010,10] [2010] [2010,12]] to=[2010,12]
- 41. Implicit Hierarchy drilldown
- 42. whole cube o cell = Cell(cube) browser.aggregate(o cell) Total browser.aggregate(o cell, drilldown=[9 “date”]) 2006 2007 2008 2009 2010 ✂ cut = PointCut(9 “date”, [2010]) o cell = o cell.slice(✂ cut) browser.aggregate(o cell, drilldown=[9 “date”]) Jan Feb Mar Apr March April May ...
- 43. Drill-down Level . drilldown = [9 "date"] implicit: next from o cell . drilldown = {9 "date": "month"} explicit
- 44. Cross Table experimental interface
- 45. 2009 2010 Assets Due from Banks 3044 1803 Assets Investments 41012 36012 Assets Loans Outstanding 103657 118104 Assets Nonnegotiable 1202 1123 Assets Other Assets 2247 3071 Assets Other Receivables 984 811 Assets Receivables 176 171 Assets Securities 33 289 Equity Capital Stock 11491 11492 Equity Deferred Amounts 359 313 Equity Other -1683 -3043 Equity Retained Earnings 29870 28793 Liabilities Borrowings 110040 128577 Liabilities Derivative Liabilities 115642 110418 Liabilities Other 57 8 Liabilities Other Liabilities 7321 5454 Liabilities Sold or Lent 2323 998
- 46. rows = ["item.category", "item.subcategory"] columns = ["year"] measures = ["amount_sum"] table = result.cross_table( rows, columns, measures )
- 47. Slicer The HTTP OLAP Server ✂
- 48. Application HTTP JSON Slicer ∑ Aggregation Browser
- 49. GET /model GET /aggregate GET /values GET /report
- 50. w logical model configuration data $ slicer serve slicer.ini
- 51. [server] backend: sql log_level: info [model] path: model.json locales: en,sk [workspace] url: postgres://localhost/database schema: datamart fact_prefix: ft_ dimension_prefix: dm_ w
- 52. ∑ amount GET /aggregate
- 53. GET aggregate { "cell": [], "drilldown": [], "summary": { "record_count": 62, "amount_sum": 1116860 } }
- 54. ∑ amount ✂ GET /aggregate?cut=date:2010
- 55. GET aggregate?cut=year:2010 { "cell": [ { "path": ["2010"], "type": "point", "dimension": "year", "level_depth": 1 } ], "drilldown": [], "summary": { "record_count": 31, "amount_sum": 566020 } }
- 56. GET aggregate?drilldown=year { "cell": [], "total_cell_count": 2, "drilldown": [ { "record_count": 31, "amount_sum": 550840, "year": 2009 }, { "record_count": 31, "amount_sum": 566020, "year": 2010 } ], "summary": { "record_count": 62, "amount_sum": 1116860 } }
- 57. GET report Content-Type: application/json list of cuts { "cell": [ { "dimension": "date", "type": "range", "from": [2009], "to": [2011,6] } ], "queries": { list of "by_segment": { named queries "query": "aggregate", "drilldown": ["segment"] }, "by_year": { "query": "aggregate", "drilldown": {"date":"year"} } } }
- 58. SQL Backend What data it works with?
- 59. ★ or ❄
- 60. ★ dimensions fact table
- 61. ❄ fact table dimensions
- 63. Aggregation Browser Browsing Context Snowflake Denormalized or Mapper Mapper denormalized view snowflake ❄
- 64. logical physical ❄
- 65. SQL Features ■ does not require DB write access ■ denormalisation ■ denormalised browsing, indexing ■ simple date datatype dimension ■ extraction of date parts during mapping ■ multiple schema support
- 67. ■ model validation slicer model validate model.json ■ model translation slicer model translate model.json translation.json ■ workspace testing slicer test config.ini ■ denormalization slicer denormalize --materialize --index config.ini
- 68. Future
- 69. ■ formatters for visualisation libraries ■ JavaScript library* help needed ■ backends ■ derived measures *http://github.com/Stiivi/cubes-js
- 70. Open Data ■ shared repository of models ■ shared repository of dimensions ■ public cubes open Slicer HTTP APIs http://github.com/Stiivi/cubes/wiki
- 71. stay light Nutrition Facts Serving Size 1 cube Amount Per Serving % Daily Value Total Fat 0g 0% Saturated Fat 0g Trans Fat 0g
- 72. Thank You source: github.com/Stiivi/cubes documentation: packages.python.org/cubes/ examples: github.com/Stiivi/cubes-examples
- 73. Backup
- 74. Transactions Reporting multidimensional object–relational modelling modelling ORM mapping logical model (and mapping) database connection browser database engine workspace
- 75. Limitations ■ one cut per dimension in a cell ■ logical conjunction of cuts (cut1 AND cut2 AND cut3 ...) ■ dimension-only selection ■ one - default hierarchy ■ some internals are ready for multiple
Editor's Notes
- #2: OLAP and Logical Model, Architecture, Slicing and Dicing, HTTP Server, SQL Backend\n\n
- #3: \n
- #4: \n
- #5: Q: Who is familiar with OLAP?\n
- #6: quick setup and reporting\ndoes not cover everything (intentionally)\n
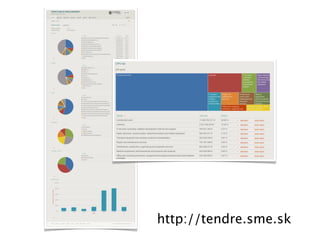
- #7: example application - public procurements of slovakia\n
- #8: quick setup and reporting\ndoes not cover everything (intentionally)\n
- #9: will talk about modelling first, then reporting, then going to mix\n
- #10: how it looks like and what it does?\n
- #11: FIXME: add slicer tool here\n
- #12: not going into details, but just to align terminology and define context\n
- #13: not so rare we see creating reports directly from what is available, instead of starting with business needs and tryig to find a way how to derive it from what is available\n
- #14: different approach to data use, different needs\nwhile in apps you are focusing on transactions - trans data/oltp, in reporting you are focusing on analysis -> analytical data\nlogically separate (does not have to be physically separate)\n
- #15: \n
- #16: \n
- #17: \n
- #18: CONTEXT: where did the sale happened? who signed the contract?\nFILTER: how much was spent for construction work?\nAGGREGATION SCOPE: what was the revenue by country?\n\nused for ordering or sorting\ndefine master-detail relationships\n
- #19: \n
- #20: \n
- #21: provides metadata to easily create apps\n
- #22: \n
- #23: \n
- #24: \n
- #25: \n
- #26: \n
- #27: \n
- #28: what the browser does?\n
- #29: aggregating measures\n
- #30: \n
- #31: aggregation browser has to have concrete backend implementation\n
- #32: + bunch of other stuff\n
- #33: context\n
- #34: before I will talk about aggregation browser, I have to introduce a cell\n
- #35: \n
- #36: \n
- #37: our filter/selection defines the cell\nthis is kind of multidimensional “breadcrumbs”\n
- #38: path - taken from file system terminology for easier understanding\nthose are keys\nnote that displayed is level label, not a key\n
- #39: ... let’s put it into a picture\n
- #40: \n
- #41: “aggregation result” was created according to usual report look\n
- #42: FIXME: add picture\n
- #43: you can specify multiple dimensions and explicit level to be drilled down (for example “month” level of a date dimension)\n
- #44: it provides list of records, which are represented as dictionaries \nyou have to find out which one is level attribute or the key\n\n
- #45: no need to find the context of dimension of interest\nif not sufficient, one can still fall-back to the manual method\n
- #46: \n
- #47: facts – get details\nvalues - can be used to create selection boxes, also level can be specified\ncell_details is used for creating the multidimensional breadcrumbs mentioned before - it contains data to humanly describe current context of interest\nordering and pagination is supported\n
- #48: what was that “cell” thing?\n
- #49: \n
- #50: also show hierarchy\n
- #51: \n
- #52: \n
- #53: same drilldown, different cell\n
- #54: implicit: raises error if current level is the last one\nexample: you are exploring year 2010 (cell) and would like to see split by year (higher level)\n
- #55: \n
- #56: \n
- #57: \n
- #58: \n
- #59: \n
- #60: \n
- #61: \n
- #62: \n
- #63: just to name a few...\n
- #64: \n
- #65: \n
- #66: \n
- #67: \n
- #68: \n
- #69: \n
- #70: \n
- #71: \n
- #72: \n
- #73: powered by sqlalchemy\n
- #74: powered by great abstraction framework\nconstruction of SQL statements\n
- #75: \n
- #76: \n
- #77: \n
- #78: denormalized\n
- #79: thanks to new browser and browsing context it is possible to transparently switch between original snowflake and generated denormalized view (which can be materialized and indexed based on dimension level keys)\n
- #80: in which table and which column is the attribute?\n
- #81: \n
- #82: \n
- #83: \n
- #84: \n
- #85: if someone would like to contribute with his skills, he is more than welcome and I will help\n
- #86: so if you have OS app, like Django that more users use, you can publish reporting model for others.\nput your cube in the Wiki\n
- #87: \n
- #88: MIT license\n
- #89: \n
- #90: \n
- #91: \n