SlideShare a Scribd company logo
Quality by Design for ANDAs:
An Example for
Immediate-Release Dosage Forms
Introduction to the Example
This is an example pharmaceutical development report illustrating how ANDA applicants can
move toward implementation of Quality by Design (QbD). The purpose of the example is to
illustrate the types of pharmaceutical development studies ANDA applicants may use as they
implement QbD in their generic product development and to promote discussion on how OGD
would use this information in review.
Although we have tried to make this example as realistic as possible, the development of a real
product may differ from this example. The example is for illustrative purposes and, depending on
applicants’ experience and knowledge, the degree of experimentation for a particular product
may vary. The impact of experience and knowledge should be thoroughly explained in the
submission. The risk assessment process is one avenue for this explanation. At many places in
this example, alternative pharmaceutical development approaches would also be appropriate.
Notes to the reader are included in italics throughout the text. Questions and comments may be
sent to GenericDrugs@fda.hhs.gov
April 2012 1
Example QbD IR Tablet Module 3 Quality 3.2.P.2 Pharmaceutical Development
Pharmaceutical Development Report
Example QbD for IR Generic Drugs
Table of Contents
1.1 Executive Summary.................................................................................................................. 4
1.2 Analysis of the Reference Listed Drug Product ....................................................................... 6
1.2.1 Clinical .................................................................................................................................6
1.2.2 Pharmacokinetics..................................................................................................................7
1.2.3 Drug Release ........................................................................................................................7
1.2.4 Physicochemical Characterization........................................................................................8
1.2.5 Composition .........................................................................................................................8
1.3 Quality Target Product Profile for the ANDA Product ............................................................ 9
1.4 Dissolution Method Development and Pilot Bioequivalence Studies.................................... 13
1.4.1 Dissolution Method Development......................................................................................13
1.4.2 Pilot Bioequivalence Study ................................................................................................14
2.1 Components of Drug Product ................................................................................................. 18
2.1.1 Drug Substance...................................................................................................................18
2.1.1.1 Physical Properties.......................................................................................................18
2.1.1.2 Chemical Properties .....................................................................................................21
2.1.1.3 Biological Properties ....................................................................................................22
2.1.2 Excipients ...........................................................................................................................25
2.1.2.1 Excipient Compatibility Studies....................................................................................25
2.1.2.2 Excipient Grade Selection.............................................................................................27
2.2 Drug Product........................................................................................................................... 28
2.2.1 Formulation Development..................................................................................................28
2.2.1.1 Initial Risk Assessment of the Formulation Variables..................................................28
2.2.1.2 Drug Substance Particle Size Selection for Product Development ..............................30
2.2.1.3 Process Selection ..........................................................................................................32
2.2.1.4 Formulation Development Study #1..............................................................................33
2.2.1.5 Formulation Development Study #2..............................................................................44
2.2.1.6 Formulation Development Conclusions........................................................................47
2.2.1.7 Updated Risk Assessment of the Formulation Variables..............................................48
2.2.2 Overages.............................................................................................................................49
2.2.3 Physicochemical and Biological Properties .......................................................................49
2.3 Manufacturing Process Development..................................................................................... 49
2.3.1 Initial Risk Assessment of the Drug Product Manufacturing Process ...............................52
2.3.2 Pre-Roller Compaction Blending and Lubrication Process Development.........................54
2.3.3 Roller Compaction and Integrated Milling Process Development.....................................62
2.3.4 Final Blending and Lubrication Process Development......................................................77
2.3.5 Tablet Compression Process Development........................................................................80
2.3.6 Scale-Up from Lab to Pilot Scale and Commercial Scale..................................................90
2.3.6.1 Scale-Up of the Pre-Roller Compaction Blending and Lubrication Process ...............91
2.3.6.2 Scale-Up of the Roller Compaction and Integrated Milling Process ...........................92
2.3.6.3 Scale-Up of the Final Blending and Lubrication Process ............................................94
April 2012 2
Example QbD IR Tablet Module 3 Quality 3.2.P.2 Pharmaceutical Development
2.3.6.4 Scale-Up of the Tablet Compression Process...............................................................95
2.3.7 Exhibit Batch......................................................................................................................95
2.3.8 Updated Risk Assessment of the Drug Product Manufacturing Process ...........................97
2.4 Container Closure System....................................................................................................... 99
2.5 Microbiological Attributes...................................................................................................... 99
2.6 Compatibility .......................................................................................................................... 99
2.7 Control Strategy.................................................................................................................... 100
2.7.1 Control Strategy for Raw Material Attributes..................................................................104
2.7.2 Control Strategy for Pre-Roller Compaction Blending and Lubrication..........................104
2.7.3 Control Strategy for Roller Compaction and Integrated Milling .....................................105
2.7.4 Control Strategy for Final Blending and Lubrication.......................................................105
2.7.5 Control Strategy for Tablet Compression.........................................................................105
2.7.6 Product Lifecycle Management and Continual Improvement..........................................106
List of Abbreviations .................................................................................................................. 107
April 2012 3
Example QbD IR Tablet Module 3 Quality 3.2.P.2 Pharmaceutical Development
1.1 Executive Summary
The following pharmaceutical development report summarizes the development of Generic
Acetriptan Tablets, 20 mg, a generic version of the reference listed drug (RLD), Brand
Acetriptan Tablets, 20 mg. The RLD is an immediate release (IR) tablet indicated for the relief of
moderate to severe physiological symptoms. We used Quality by Design (QbD) to develop
generic acetriptan IR tablets that are therapeutically equivalent to the RLD.
Initially, the quality target product profile (QTPP) was defined based on the properties of the
drug substance, characterization of the RLD product, and consideration of the RLD label and
intended patient population. Identification of critical quality attributes (CQAs) was based on the
severity of harm to a patient (safety and efficacy) resulting from failure to meet that quality
attribute of the drug product. Our investigation during pharmaceutical development focused on
those CQAs that could be impacted by a realistic change to the drug product formulation or
manufacturing process. For generic acetriptan tablets, these CQAs included assay, content
uniformity, dissolution and degradation products.
Acetriptan is a poorly soluble, highly permeable Biopharmaceutics Classification System (BCS)
Class II compound. As such, initial efforts focused on developing a dissolution method that
would be able to predict in vivo performance. The developed in-house dissolution method uses
900 mL of 0.1 N HCl with 1.0% w/v sodium lauryl sulfate (SLS) in USP apparatus 2 stirred at
75 rpm. This method is capable of differentiating between formulations manufactured using
different acetriptan particle size distributions (PSD) and predicting their in vivo performance in
the pilot bioequivalence (BE) study.
Risk assessment was used throughout development to identify potentially high risk formulation
and process variables and to determine which studies were necessary to achieve product and
process understanding in order to develop a control strategy. Each risk assessment was then
updated after development to capture the reduced level of risk based on our improved product
and process understanding.
For formulation development, an in silico simulation was conducted to evaluate the potential
effect of acetriptan PSD on in vivo performance and a d90 of 30 µm or less was selected. Roller
compaction (RC) was selected as the granulation method due to the potential for thermal
degradation of acetriptan during the drying step of a wet granulation process. The same types of
excipients as the RLD product were chosen. Excipient grade selection was based on experience
with previously approved ANDA 123456 and ANDA 456123 which both used roller
compaction. Initial excipient binary mixture compatibility studies identified a potential
interaction between acetriptan and magnesium stearate. However, at levels representative of the
final formulation, the interaction was found to be negligible. Furthermore, the potential
interaction between acetriptan and magnesium stearate is limited by only including extragranular
magnesium stearate.
Two formulation development design of experiments (DOE) were conducted. The first DOE
investigated the impact of acetriptan PSD and levels of intragranular lactose, microcrystalline
cellulose and croscarmellose sodium on drug product CQAs. The second DOE studied the levels
April 2012 4
Example QbD IR Tablet Module 3 Quality 3.2.P.2 Pharmaceutical Development
April 2012 5
of extragranular talc and magnesium stearate on drug product CQAs. The formulation
composition was finalized based on the knowledge gained from these two DOE studies.
An in-line near infrared (NIR) spectrophotometric method was validated and implemented to
monitor blend uniformity and to reduce the risk associated with the pre-roller compaction
blending and lubrication step. Roller pressure, roller gap and mill screen orifice size were
identified as critical process parameters (CPPs) for the roller compaction and integrated milling
process step and acceptable ranges were identified through the DOE. Within the ranges studied
during development of the final blending and lubrication step, magnesium stearate specific
surface area (5.8-10.4 m2
/g) and number of revolutions (60-100) did not impact the final product
CQAs. During tablet compression, an acceptable range for compression force was identified and
force adjustments should be made to accommodate the ribbon relative density (0.68-0.81)
variations between batches in order to achieve optimal hardness and dissolution.
Scale-up principles and plans were discussed for scaling up from lab (5.0 kg) to pilot scale (50.0
kg) and then proposed for commercial scale (150.0 kg). A 50.0 kg cGMP exhibit batch was
manufactured at pilot scale and demonstrated bioequivalence in the pivotal BE study. The
operating ranges for identified CPPs at commercial scale were proposed and will be qualified
and continually verified during routine commercial manufacture.
Finally, we proposed a control strategy that includes the material attributes and process
parameters identified as potentially high risk variables during the initial risk assessments. Our
control strategy also includes in-process controls and finished product specifications. The
process will be monitored during the lifecycle of the product and additional knowledge gained
will be utilized to make adjustments to the control strategy as appropriate.
The development time line for Generic Acetriptan Tablets, 20 mg, is presented in Table 1.
Example QbD IR Tablet Module 3 Quality 3.2.P.2 Pharmaceutical Development
Table 1. Development of Generic Acetriptan Tablets, 20 mg, presented in chronological order
Study Scale Page
Analysis of the Reference Listed Drug product N/A 6
Evaluation of the drug substance properties N/A 18
Excipient compatibility N/A 25
In silico simulation to select acetriptan PSD for product
development
N/A 30
Attempted direct compression of RLD formulation Lab (1.0 kg) 32
Lab scale roller compaction process feasibility study Lab (1.0 kg) 65
Formulation Development Study #1: Effect of acetriptan PSD,
MCC/Lactose ratio and CCS level
Lab (1.0 kg) 33
Dissolution testing using FDA-recommended method N/A 36
In-house dissolution method development N/A 13
Formulation Development Study #2: Effect of extragranular
magnesium stearate and talc level
Lab (1.0 kg) 44
Formulations with different acetriptan PSD for pilot BE study Lab (1.0 kg) 14
Dissolution testing of formulations for pilot BE study N/A 16
Pilot BE Study #1001 N/A 14
Pre-roller compaction blending and lubrication process
development: effect of acetriptan PSD and number of revolutions
Lab (5.0 kg) 56
Development of in-line NIR method for blending endpoint
determination
Lab (5.0 kg) 59
Roller compaction and integrated milling process development:
effect of roller pressure, roller gap, mill speed and mill screen
orifice size
Lab (5.0 kg) 65
Final blending and lubrication process development: effect of
magnesium stearate specific surface area and number of revolutions
Lab (5.0 kg) 79
Tablet compression process development: effect of main
compression force, press speed, and ribbon relative density
Lab (5.0 kg) 83
Scale-up strategy from lab to pilot and commercial scale N/A 90
Exhibit batch for pivotal BE study Pilot (50.0 kg) 95
1.2 Analysis of the Reference Listed Drug Product
1.2.1 Clinical
The Reference Listed Drug (RLD) is Brand Acetriptan Tablets, 20 mg, and was approved in the
United States in 2000 (NDA 211168) for therapeutic relief of moderate to severe symptoms. The
RLD is an unscored immediate release (IR) tablet with no cosmetic coating. The tablet needs to
be swallowed “as is” without any intervention. Thus, the proposed generic product will also be
an unscored IR tablet with no cosmetic coating. The maximum daily dose in the label is 40 mg
(i.e., one tablet twice per day). A single tablet is taken per dose with or without food. Brand
Acetriptan Tablets, 20 mg, should be swallowed whole with a glass of water.
April 2012 6
Example QbD IR Tablet Module 3 Quality 3.2.P.2 Pharmaceutical Development
1.2.2 Pharmacokinetics
Acetriptan is well absorbed after oral administration. The median Tmax is 2.5 hours (h) in
patients. The mean absolute bioavailability of acetriptan is approximately 40%. The AUC and
Cmax of acetriptan are increased by approximately 8% to 12% following oral dosing with a high
fat meal. The terminal elimination half-life of acetriptan is approximately 4 hours.
1.2.3 Drug Release
Drug release is usually the rate limiting process for absorption of a Biopharmaceutics
Classification System (BCS) Class II compound like acetriptan due to its low solubility.
Therefore, the dissolution of the RLD tablets was thoroughly evaluated. Initially, the dissolution
method recommended in the FDA dissolution methods database for this product was utilized
(900 mL of 0.1 N HCl with 2.0% w/v sodium lauryl sulfate (SLS) using USP apparatus 2
(paddle) at 75 rpm). The temperature of the dissolution medium was maintained at 37 ± 0.5 °C
and the drug concentration was determined using UV spectroscopy at a wavelength of 282 nm.
The drug release of RLD tablets was also obtained at different medium pH (pH 4.5 acetate buffer
and pH 6.8 phosphate buffer) with 2.0% w/v SLS. As shown in Figure 1, RLD tablets exhibited a
very rapid dissolution using the FDA-recommended method without any sensitivity to medium
pH.
0
10
20
30
40
50
60
70
80
90
100
0 10 20 30 40 50 6
Time (min)
DrugDissolved(%)
0
0.1 N HCl with 2.0% w/v SLS, 75 rpm
pH 4.5 Acetate Buffer with 2.0% w/v SLS, 75 rpm
pH 6.8 Phopshate Buffer with 2.0% w/v SLS, 75 rpm
Figure 1. RLD dissolution profile in 900 mL of medium (pH as shown) with 2.0% w/v SLS using USP apparatus 2 at 75 rpm
April 2012 7
Example QbD IR Tablet Module 3 Quality 3.2.P.2 Pharmaceutical Development
1.2.4 Physicochemical Characterization
The physicochemical characterization of the RLD tablet is summarized in Table 2.
Characterization included determination of the level of ACE12345, a known degradant, in near
expiry product.
Table 2. Physicochemical characterization of Brand Acetriptan Tablets, 20 mg
Description White round tablet debossed with ACE
Batch No. A6970R
Expiry date November 2011
Strength (mg) 20
Average weight (mg) 201.2
Score No
Coating Uncoated
Diameter (mm) 8.02-8.05
Thickness (mm) 2.95-3.08
Volume (mm3
) 150.02 average measured using image analysis
Hardness (kP) 7.4-10.1
Disintegration time (min) 1.4-1.6
Disintegration observation Rapidly disintegrates into fine powder
Assay (% w/w of label claim) 99.7-100.2
Related Compound 1 (RC1) (%) ND
Related Compound 2 (RC2)
identified as ACE12345 (%)
0.41-0.44
Related Compound 3 (RC3) (%) ND
Related Compound 4 (RC4) (%) ND
Highest individual unknown (%) 0.07-0.09
1.2.5 Composition
Based on the RLD labeling, patent literature and reverse engineering, Table 3 lists the
composition of Brand Acetriptan Tablets, 20 mg. The level provided for each excipient is
consistent with previous experience and is below the level listed in the inactive ingredient
database (IID) for FDA-approved oral solid dosage forms.
Table 3. Composition of Brand Acetriptan Tablets, 20 mg
Component Function
Unit
(mg per tablet)
Unit
(% w/w)
Acetriptan, USP Active 20.0 10
Lactose Monohydrate, NF Filler 64-86 32-43
Microcrystalline Cellulose (MCC), NF Filler 72-92 36-46
Croscarmellose Sodium (CCS), NF Disintegrant 2-10 1-5
Magnesium Stearate, NF* Lubricant 2-6 1-3
Talc, NF Glidant/Lubricant 1-10 0.5-5
Total tablet weight 200 100
*Magnesium stearate level estimated by EDTA titration of magnesium.
April 2012 8
Example QbD IR Tablet Module 3 Quality 3.2.P.2 Pharmaceutical Development
1.3 Quality Target Product Profile for the ANDA Product
Note to Reader: The quality target product profile (QTPP) is “a prospective summary of the
quality characteristics of a drug product that ideally will be achieved to ensure the desired
quality, taking into account safety and efficacy of the drug product.” 1
The QTPP is an essential
element of a QbD approach and forms the basis of design of the generic product. For ANDAs,
the target should be defined early in development based on the properties of the drug substance
(DS), characterization of the RLD product and consideration of the RLD label and intended
patient population. The QTPP includes all product attributes that are needed to ensure
equivalent safety and efficacy to the RLD. This example is for a simple IR tablet; other products
would include additional attributes in the QTPP. By beginning with the end in mind, the result of
development is a robust formulation and manufacturing process with a control strategy that
ensures the performance of the drug product.
A critical quality attribute (CQA) is “a physical, chemical, biological, or microbiological
property or characteristic that should be within an appropriate limit, range, or distribution to
ensure the desired product quality.”1
The identification of a CQA from the QTPP is based on the
severity of harm to a patient should the product fall outside the acceptable range for that
attribute.
All quality attributes are target elements of the drug product and should be achieved through a
good quality management system as well as appropriate formulation and process design and
development. From the perspective of pharmaceutical development, we only investigate the
subset of CQAs of the drug product that also have a high potential to be impacted by the
formulation and/or process variables. Our investigation culminates in an appropriate control
strategy.
Based on the clinical and pharmacokinetic (PK) characteristics as well as the in vitro dissolution
and physicochemical characteristics of the RLD, a quality target product profile (QTPP) was
defined for Generic Acetriptan Tablets, 20 mg (see Table 4).
1
ICH Harmonised Tripartite Guideline: Q8(R2) Pharmaceutical Development. August 2009.
April 2012 9
Example QbD IR Tablet Module 3 Quality 3.2.P.2 Pharmaceutical Development
April 2012 10
Table 4. Quality Target Product Profile (QTPP) for Generic Acetriptan Tablets, 20 mg
QTPP Elements Target Justification
Dosage form Tablet
Pharmaceutical equivalence
requirement: same dosage form
Dosage design
Immediate release tablet
without a score or coating
Immediate release design needed
to meet label claims
Route of administration Oral
Pharmaceutical equivalence
requirement: same route of
administration
Dosage strength 20 mg
Pharmaceutical equivalence
requirement: same strength
Pharmacokinetics
Immediate release enabling
Tmax in 2.5 hours or less;
Bioequivalent to RLD
Bioequivalence requirement
Needed to ensure rapid onset and
efficacy
Stability
At least 24-month shelf-life at
room temperature
Equivalent to or better than RLD
shelf-life
Drug product
quality attributes
Physical Attributes
Pharmaceutical equivalence requirement: Must meet the same
compendial or other applicable (quality) standards (i.e., identity,
assay, purity, and quality).
Identification
Assay
Content Uniformity
Dissolution
Degradation Products
Residual Solvents
Water Content
Microbial Limits
Container closure system
qualified as suitable for this
drug product
Needed to achieve the target
shelf-life and to ensure tablet
integrity during shipping
Administration/Concurrence with labeling Similar food effect as RLD
RLD labeling indicates that a high
fat meal increases the AUC and
Cmax by 8-12%. The product can
be taken without regard to food.
Alternative methods of administration None None are listed in the RLD label.
Table 5 summarizes the quality attributes of generic acetriptan tablets and indicates which
attributes were classified as drug product critical quality attributes (CQAs). For this product,
assay, content uniformity (CU), dissolution and degradation products are identified as the subset
of CQAs that have the potential to be impacted by the formulation and/or process variables and,
therefore, will be investigated and discussed in detail in subsequent formulation and process
development studies.
On the other hand, CQAs including identity, residual solvents and microbial limits which are
unlikely to be impacted by formulation and/or process variables will not be discussed in detail in
the pharmaceutical development report. However, these CQAs are still target elements of the
QTPP and are ensured through a good pharmaceutical quality system and the control strategy.
Example QbD IR Tablet Module 3 Quality 3.2.P.2 Pharmaceutical Development
Table 5. Critical Quality Attributes (CQAs) of Generic Acetriptan Tablets, 20 mg
Quality Attributes
of the Drug Product
Target
Is this a
CQA?
Justification
Physical
Attributes
Appearance
Color and shape
acceptable to the
patient. No visual tablet
defects observed.
No
Color, shape and appearance are not directly linked to safety and efficacy. Therefore,
they are not critical. The target is set to ensure patient acceptability.
Odor No unpleasant odor No
In general, a noticeable odor is not directly linked to safety and efficacy, but odor can
affect patient acceptability. For this product, neither the drug substance nor the
excipients have an unpleasant odor. No organic solvents will be used in the drug
product manufacturing process.
Size Similar to RLD No
For comparable ease of swallowing as well as patient acceptance and compliance with
treatment regimens, the target for tablet dimensions is set similar to the RLD.
Score
configuration
Unscored No
The RLD is an unscored tablet; therefore, the generic tablet will be unscored. Score
configuration is not critical for the acetriptan tablet.
Friability NMT 1.0% w/w No
Friability is a routine test per compendial requirements for tablets. A target of NMT
1.0% w/w of mean weight loss assures a low impact on patient safety and efficacy and
minimizes customer complaints.
Identification Positive for acetriptan Yes*
Though identification is critical for safety and efficacy, this CQA can be effectively
controlled by the quality management system and will be monitored at drug product
release. Formulation and process variables do not impact identity. Therefore, this CQA
will not be discussed during formulation and process development.
Assay
100% w/w of label
claim
Yes
Assay variability will affect safety and efficacy. Process variables may affect the assay
of the drug product. Thus, assay will be evaluated throughout product and process
development.
Content Uniformity
(CU)
Conforms to USP
<905> Uniformity of
Dosage Units
Yes
Variability in content uniformity will affect safety and efficacy. Both formulation and
process variables impact content uniformity, so this CQA will be evaluated throughout
product and process development.
Dissolution
NLT 80% at 30 minutes
in 900 mL of 0.1 N HCl
with 1.0% w/v SLS
using USP apparatus 2
at 75 rpm
Yes
Failure to meet the dissolution specification can impact bioavailability. Both
formulation and process variables affect the dissolution profile. This CQA will be
investigated throughout formulation and process development.
April 2012 11
Example QbD IR Tablet Module 3 Quality 3.2.P.2 Pharmaceutical Development
April 2012 12
Quality Attributes
of the Drug Product
Target
Is this a
CQA?
Justification
Degradation Products
ACE12345:
NMT 0.5%,
Any unknown impurity:
NMT 0.2%,
Total impurities:
NMT 1.0%
Yes
Degradation products can impact safety and must be controlled based on compendial/ICH
requirements or RLD characterization to limit patient exposure. ACE12345 is a
common degradant of acetriptan and its target is based on the level found in near
expiry RLD product. The limit for total impurities is also based on RLD analysis. The
target for any unknown impurity is set according to the ICH identification threshold for
this drug product. Formulation and process variables can impact degradation products.
Therefore, degradation products will be assessed during product and process
development.
Residual Solvents USP <467> option 1 Yes*
Residual solvents can impact safety. However, no solvent is used in the drug product
manufacturing process and the drug product complies with USP <467> Option 1.
Therefore, formulation and process variables are unlikely to impact this CQA.
Water Content NMT 4.0% w/w No
Generally, water content may affect degradation and microbial growth of the drug
product and can be a potential CQA. However, in this case, acetriptan is not sensitive
to hydrolysis and moisture will not impact stability.
Microbial Limits
Meets relevant
pharmacopoeia criteria
Yes*
Non-compliance with microbial limits will impact patient safety. However, in this
case, the risk of microbial growth is very low because roller compaction (dry
granulation) is utilized for this product. Therefore, this CQA will not be discussed in
detail during formulation and process development.
*Formulation and process variables are unlikely to impact the CQA. Therefore, the CQA will not be investigated and discussed in detail in subsequent risk
assessment and pharmaceutical development. However, the CQA remains a target element of the drug product profile and should be addressed accordingly.
Example QbD IR Tablet Module 3 Quality 3.2.P.2 Pharmaceutical Development
1.4 Dissolution Method Development and Pilot Bioequivalence Studies
Note to Reader: A pharmaceutical development report should document the selection of the
dissolution method used in pharmaceutical development. This method (or methods) may differ
from the FDA-recommended dissolution method and the quality control method used for release
testing.
1.4.1 Dissolution Method Development
Acetriptan is a BCS Class II compound displaying poor aqueous solubility (less than 0.015
mg/mL) across the physiological pH range. As such, development of a dissolution method that
can act as the best available predictor of equivalent pharmacokinetics to the RLD was pursued to
allow assessment of acetriptan tablets manufactured during development.
The target is an immediate release product, so dissolution in the stomach and absorption in the
upper small intestine is expected suggesting the use of dissolution medium with low pH.
Development began with the quality control dissolution method recommended for this product
by the FDA: 900 mL of 0.1 N HCl with 2.0% w/v SLS using USP apparatus 2 at 75 rpm. Initial
development formulations (Batches 1-11) exhibited rapid dissolution (NLT 90% dissolved in 30
minutes (min)) and were comparable to the RLD. It became a challenge for the team to select the
formulations which might perform similarly to the RLD in vivo. The solubility of acetriptan in
various media was determined (Table 6) and suggests that the solubility of acetriptan in 0.1 N
HCl with 1.0% w/v SLS is similar to its solubility in biorelevant media.
Table 6. Acetriptan solubility in different media
Media Solubility
-- (mg/mL)
Biorelevant FaSSGF2
0.12
Biorelevant FaSSIF-V22
0.18
0.1 N HCl with 0.5% SLS 0.075
0.1 N HCl with 1.0% SLS 0.15
0.1 N HCl with 2.0% SLS 0.3
Figure 2 presents the dissolution of the RLD in 0.1 N HCl with different SLS concentrations.
April 2012 13
2
Jantratid E, Janssen N, Reppas C, and Dressman JB. Dissolution Media Simulating Conditions in the Proximal
Human Gastrointestinal Tract: An Update. Pharm Res 25:1663-1676, 2008.
Example QbD IR Tablet Module 3 Quality 3.2.P.2 Pharmaceutical Development
0
10
20
30
40
50
60
70
80
90
100
110
0 10 20 30 40 50
Time (min)
DrugDissolved(%)
60
0.5% w/v SLS
1.0% w/v SLS
2.0% w/v SLS
Figure 2. RLD dissolution profile in 900 mL of 0.1 N HCl with various SLS concentrations using USP apparatus 2 at 75 rpm
The dissolution method selected for product development uses 900 mL of 0.1 N HCl with 1.0%
w/v SLS in a dissolution apparatus equipped with paddles (speed 75 rpm) and maintained at a
temperature of 37°C, followed by UV spectroscopy at a wavelength of 282 nm. Dissolution in
1.0% w/v SLS is not sensitive to medium pH (similar in 0.1 N HCl, pH 4.5 buffer and pH 6.8
buffer) (data not shown). Additionally, this method is capable of detecting dissolution changes in
the drug product caused by deliberately varying the drug substance (DS) particle size distribution
(PSD) (see Section 1.4.2).
1.4.2 Pilot Bioequivalence Study
Note to Reader: For low solubility drugs, pilot bioequivalence (BE) studies are invaluable to
demonstrate that the in vitro dissolution used is appropriate. When pilot bioequivalence studies
are conducted, the following is an example of how they should be described in the development
report to support controls on critical attributes such as particle size and to understand the
relationship between in vitro dissolution and in vivo performance. Inclusion of formulations that
perform differently will help to determine if there is a useful in vivo in vitro relationship.
The formulation development studies identified drug substance particle size distribution as the
most significant factor that impacts drug product dissolution (see Section 2.2.1.4). In order to
understand the potential clinical relevance of drug substance particle size distribution on in vivo
performance, a pilot bioequivalence (BE) study (Study # 1001) was performed in 6 healthy
subjects (four-way crossover: three prototypes and the RLD at a dose of 20 mg).
The formulation used to produce the three prototypes and the composition is shown in Table 7.
The only difference between each prototype was the drug substance particle size distribution.
Drug substance Lot #2, #3 and #4 with a d90 of 20 μm, 30 μm and 45 μm was used for prototype
April 2012 14
Example QbD IR Tablet Module 3 Quality 3.2.P.2 Pharmaceutical Development
Batch 18, 19, and 20, respectively. Characterization of the drug substance lots is provided in
Section 2.2.1.2, Table 19.
Table 7. Formulation of Generic Acetriptan Tablets, 20 mg, used in Pilot BE Study #1001
Ingredient Function Composition
(mg per tablet) (% w/w)
Acetriptan Active 20.0 10.0
Intragranular Excipients
Lactose Monohydrate, NF Filler 79.0 39.5
Microcrystalline Cellulose (MCC), NF Filler 79.0 39.5
Croscarmellose Sodium (CCS), NF Disintegrant 10.0 5.0
Talc, NF Glidant/lubricant 5.0 2.5
Extragranular Excipients
Magnesium Stearate, NF Lubricant 1.2 0.6
Talc, NF Glidant/lubricant 5.8 2.9
Total Weight 200.0 100
The pharmacokinetic results are presented in Figure 3 and Table 8.
0
40
80
120
160
200
240
0 2 4 6 8 10 12 14 16 18 20 22 24
Time (h)
PlasmaConcentration(ng/mL)
RLD
d90 20 μm
d90 30 μm
d90 45 μm
Figure 3. Mean PK profiles obtained from Pilot BE Study #1001
April 2012 15
Example QbD IR Tablet Module 3 Quality 3.2.P.2 Pharmaceutical Development
Table 8. Pharmacokinetic parameters (geometric mean) from Pilot BE Study #1001
Pharmacokinetic Parameters
Lot #2
(d90 20 μm)
Lot #3
(d90 30 μm)
Lot #4
(d90 45 μm)
N/A
(RLD)
Drug Product Batch No. 18 19 20 A6971R
AUC∞ (ng/ml h) 2154.0 2070.7 1814.6 2095.3
AUC0-t (ng/ml h) 1992.8 1910.6 1668.0 1934.5
Cmax (ng/ml) 208.55 191.07 158.69 195.89
Tmax (h) 2.0 2.5 3.0 2.5
t1/2(h) 6.0 6.0 6.0 6.0
Test/Reference AUC∞ Ratio 1.028 0.988 0.866 --
Test/Reference AUC0-t Ratio 1.030 0.988 0.862 --
Test/Reference Cmax Ratio 1.065 0.975 0.810 --
According to the literature3
, when the mean Cmax and AUC responses of 2 drug products differ
by more than 12-13%, they are unlikely to meet the bioequivalence limits of 80-125%.
Therefore, the predefined selection criterion was a mean particle size that yielded both a Cmax
ratio and an AUC ratio for test to reference between 0.9 and 1.11. The results of the PK study
indicated that a drug substance particle size distribution with a d90 of 30 µm or less showed
similar in vivo performance based on test to reference ratio calculations for AUC and Cmax. A
drug substance particle size distribution with a d90 of 45 µm did not meet the predefined criterion
of a test to reference ratio for Cmax and AUC between 0.9 and 1.11. The results confirmed the in
silico simulation data obtained during preformulation work (see Section 2.2.1.2).
In order to understand the relationship between in vitro dissolution and in vivo performance, the
dissolution test was performed on the three prototypes and the RLD using the in-house versus the
FDA-recommended dissolution method. The results are presented in Figure 4 and Figure 5,
respectively. The data indicated that the in-house dissolution method (with 1.0% w/v SLS) is
capable of differentiating formulations manufactured using different drug substance particle size
distributions. However, the FDA-recommended dissolution method (with 2.0% w/v SLS) is not
sensitive to deliberate formulation changes in the drug substance particle size distribution for this
BCS class II compound.
April 2012 16
3
B.M. Davit, et al. Comparing generic and innovator drugs: a review of 12 years of bioequivalence data from the
United States Food and Drug Administration. The Annals of Pharmacotherapy, 2009, 43: 1583-1597.
Example QbD IR Tablet Module 3 Quality 3.2.P.2 Pharmaceutical Development
0
10
20
30
40
50
60
70
80
90
100
0 10 20 30 40 50 60
Time (min)
DrugDissolved(%)
RLD
d90 20 μm
d90 30 μm
d90 45 μm
Figure 4. Dissolution of acetriptan tablets (RLD and three prototypes) using in-house method
(900 mL of 0.1 N HCl with 1.0% w/v SLS using USP apparatus 2 at 75 rpm)
0
10
20
30
40
50
60
70
80
90
100
110
0 10 20 30 40 50 60
Time (min)
DrugDissolved(%)
RLD
d90 20 μm
d90 30 μm
d90 45 μm
Figure 5. Dissolution of acetriptan tablets (RLD and three prototypes) using FDA-recommended method
(900 mL of 0.1 N HCl with 2.0% w/v SLS using USP apparatus 2 at 75 rpm)
The AUC0-t ratio and Cmax ratio between the prototypes and the RLD were plotted versus the
percentage of drug dissolved using both the in-house and FDA-recommended dissolution
methods. The results are presented in Figure 6 and suggest that dissolution testing in medium
with 1.0% w/v SLS and a 30 minute endpoint is predictive of the in vivo performance. However,
the dissolution testing in medium with 2.0% w/v SLS was not able to predict the in vivo
performance differences due to the drug substance particle size changes.
April 2012 17
Example QbD IR Tablet Module 3 Quality 3.2.P.2 Pharmaceutical Development
0.75
0.85
0.95
1.05
1.15
0 10 20 30 40 50 60 70 80 90 100
Drug Dissolved in 30 min (%)
PKParameterRatio
AUC0-t Ratio, medium with 1.0% w/v SLS
Cmax Ratio, medium with 1.0% w/v SLS
AUC0-t Ratio, medium with 2.0% w/v SLS
Cmax Ratio, medium with 2.0% w/v SLS
Figure 6. AUC0-t ratio and Cmax ratio as a function of the percentage of drug dissolved in 30 minutes
A dissolution rate of not less than (NLT) 80% in 30 minutes in 0.1 N HCl with 1.0% w/v SLS
was set as the target for pharmaceutical development studies based on the fact that Batch 19 (d90
30 μm) showed 80.8% dissolution in 30 minutes and demonstrated comparable pharmacokinetic
profiles to the RLD in the pilot BE study.
2.1 Components of Drug Product
2.1.1 Drug Substance
2.1.1.1 Physical Properties
Physical description:
The following physical description is for acetriptan Form III.
Appearance: White to off-white, crystalline powder
Particle morphology: Plate-like crystals
Particle size distribution: PSD of drug substance Lot #2 was measured using Malvern
Mastersizer. The results were as follows: d10 – 7.2 μm; d50 – 12 μm; d90 – 20 µm.
This is representative of the drug substance PSD selected for the final drug
product formulation.
Solid state form:
To date, three different crystalline forms (Form I, II and III) have been identified and reported in
the literature. The three different forms were prepared using different solvents and crystallization
conditions. The solubility and the melting point are different for each of the three polymorphs.
Polymorphic Form III is the most stable form and has the highest melting point. The DMF holder
provides acetriptan polymorphic Form III consistently based on in-house batch analysis data
April 2012 18
Example QbD IR Tablet Module 3 Quality 3.2.P.2 Pharmaceutical Development
obtained by XRPD and DSC. Stress testing confirmed that no polymorphic conversion was
observed (Table 10) and Form III is stable under the stress conditions of high temperatures, high
humidity, UV light and mechanical stress. Since it is the most stable form, no phase
transformation during the manufacturing process is expected. The Form III melting point and
characteristic 2θ values are included in the drug substance specification as a part of the control
strategy.
To confirm its physical stability, the final drug product was sampled during lab scale studies to
evaluate whether processing conditions affected the polymorphic form of the drug substance.
The XRPD data showed that the characteristics 2θ peaks of Form III of the drug substance are
retained in the final drug product. Representative profiles are shown in Figure 7. An advanced
XRPD technique was utilized to detect the possible phase transition in the drug product since the
level of drug substance was 10% in the drug product.
Drug
Substance
Figure 7. The XRPD profiles of drug product, MCC, lactose and drug substance
The most stable polymorph (Form III) exhibits plate-like morphology as shown in Figure 8.
April 2012 19
Example QbD IR Tablet Module 3 Quality 3.2.P.2 Pharmaceutical Development
Figure 8. SEM picture of acetriptan
Melting point: Approximately 186 °C (Form III)
Aqueous solubility as a function of pH:
The solubility of acetriptan Form III in aqueous media as a function of pH was measured and is
presented in Table 9. The aqueous solubility of acetriptan is low (~0.015 mg/mL) and constant
across the physiological pH range due to the lipophilic nature of the molecule.
Table 9. Solubility of acetriptan Form III in various media with different pH
Media Solubility
-- (mg/mL)
0.1 N HCl 0.015
pH 4.5 buffer 0.015
pH 6.8 buffer 0.015
Hygroscopicity:
Acetriptan Form III is non-hygroscopic and requires no special protection from humidity during
handling, shipping or storage. Hygroscopicity studies were carried out using a vapor sorption
analyzer. The temperature was maintained at 25 °C. The material was exposed to stepwise
increases in relative humidity from 10% to 90% for up to 150 minutes at each condition. The
drug substance was non-hygroscopic, adsorbing less than 0.2% w/w at 90% RH.
Density (Bulk, Tapped, and True) and Flowability:
The bulk, tapped and true density as well as the flowability of acetriptan Form III (Lot #2 : d10 –
7.2 μm; d50 – 12 μm; d90 – 20 µm) were measured.
Bulk density: 0.27 g/cc
Tapped density: 0.39 g/cc
True density: 0.55 g/cc
The flow function coefficient (ffc) was 2.95 and the Hausner ratio was 1.44 which both indicate
poor flow properties. The cohesiveness of the drug substance was also studied using a powder
rheometer. The specific energy (12 mJ/g) of the drug substance indicates that the drug substance
is cohesive.
April 2012 20
Example QbD IR Tablet Module 3 Quality 3.2.P.2 Pharmaceutical Development
2.1.1.2 Chemical Properties
pKa: Acetriptan is a weak base with a pKa of 9.2.
Chemical stability in solid state and in solution:
Stress testing (forced degradation) was carried out on acetriptan to study its impurity profile,
degradation pathway and to facilitate the development of a stability-indicating method. In
addition, knowledge obtained from the forced degradation studies was used during formulation
and process design and development to prevent impurities from being generated. The specified
stress conditions were intended to achieve approximately 5-20% degradation (if possible) of
acetriptan or to represent a typical stress condition even though less than 5% degradation was
achieved due to its inherent stability. The stressed samples were compared to the unstressed
sample (control). Stress conditions and results are listed in Table 10 below.
Table 10. Acetriptan Form III stability under stress conditions
Stress Conditions Assay Degradation Products Solid State Form
(% w/w) (% w/w)
RC1 RC2 RC3 RC4
Untreated 99.4 ND ND ND ND Crystalline Form III
Saturated Solution
0.1 N HCl (RT, 14 days) 96.9 ND 2.3 1.1 ND N/A
0.1 N NaOH (RT, 14 days) 97.3 ND 2.1 0.9 ND N/A
3% H2O2 (RT, 7 days) 86.7 ND 9.9 1.3 ND N/A
Purified water (RT, 14 days) 96.8 ND 1.9 1.2 ND N/A
Photostability
(ICH Q1B Option 1)
90.6 ND 7.5 2.1 ND N/A
Heat (60 °C, 24 h) 93.4 ND 5.2 ND 1.5 N/A
Solid State Material
Humidity
(open container, 90% RH, 25 °C, 7 days)
99.4 ND 0.1 0.1 ND No change
Humidity and heat
(open container, 90% RH, 40 °C, 7 days)
99.9 ND 0.1 0.1 ND No change
Humidity and heat
(open container, 90% RH, 60 °C, 7 days)
95.9 ND 2.7 0.2 1.4 No change
Photostability
(ICH Q1B Option 1)
95.5 ND 3.2 1.4 ND No change
Dry heat (60 °C, 7 days) 95.8 ND 4.1 ND 0.9 No change
Dry heat (105 °C, 96 h) 82.5 ND 3.9 ND 13.7 No change
Mechanical stress
(Grinding and compression)
99.2 ND 0.1 0.1 ND No change
ND: Not Detected; N/A: Not Applicable
Samples were analyzed by HPLC equipped with a peak purity analyzer (photodiode array).
Degradation peaks were well resolved from the main peak (acetriptan). The peak purity of the
main peak and monitored degradants RC2 (ACE12345), RC3 (RRT = 0.68) and RC4
(RRT=0.79) were greater than 0.99. For each degradant, the peak purity angle was less than the
peak purity threshold, suggesting that there was no interference of degradants with the main
April 2012 21
Example QbD IR Tablet Module 3 Quality 3.2.P.2 Pharmaceutical Development
peak. Degradant RC1 was not observed. Degradant RC2 was formed due to oxidation and
degradant RC3 was the result of further oxidation. Based on the results of the forced degradation
studies, RC2 and RC3 were identified as the principal degradation products under the stress
conditions. RC3 was not found under long-term stability conditions. With prolonged exposure to
excessive high temperature (105 ºC, 96 hours), 14% of RC4 was observed.
Overall, acetriptan is susceptible to dry heat, UV light and oxidative degradation.
2.1.1.3 Biological Properties
Partition coefficient: Log P 3.55 (25 °C, pH 6.8)
Caco-2 permeability: 34 × 10-6
cm/s
The Caco-2 permeability is higher than the reference standard, metoprolol, which has a Caco-2
permeability of 20 × 10-6
cm/s. Therefore, acetriptan is highly permeable.
Biopharmaceutics Classification:
Literature and in-house experimental data support the categorization of acetriptan as a highly
permeable drug substance. Based on its solubility across physiological pH (Table 9) acetriptan is
designated as a low solubility drug substance. The calculated dose solubility volume is as
follows:
20 mg (highest strength)/(0.015 mg/mL) = 1333 mL > 250 mL
Therefore, acetriptan is considered a BCS Class II compound (low solubility and high
permeability) according to the BCS guidance.
2.1.1.4 Risk Assessment of Drug Substance Attributes
A risk assessment of the drug substance attributes was performed to evaluate the impact that
each attribute could have on the drug product CQAs. The outcome of the assessment and the
accompanying justification is provided as a summary in the pharmaceutical development report.
The relative risk that each attribute presents was ranked as high, medium or low. The high risk
attributes warranted further investigation whereas the low risk attributes required no further
investigation. The medium risk is considered acceptable based on current knowledge. Further
investigation for medium risk may be needed in order to reduce the risk. The same relative risk
ranking system was used throughout pharmaceutical development and is summarized in Table
11. For each risk assessment performed, the rationale for the risk assessment tool selection and
the details of the risk identification, analysis and evaluation are available to the FDA Reviewer
upon request.
April 2012 22
Example QbD IR Tablet Module 3 Quality 3.2.P.2 Pharmaceutical Development
Table 11. Overview of Relative Risk Ranking System
Low Broadly acceptable risk. No further investigation is needed.
Medium Risk is acceptable. Further investigation may be needed in order to reduce the risk.
High Risk is unacceptable. Further investigation is needed to reduce the risk.
Note to Reader: According to ICH Q9 Quality Risk Management, it is important to note that “it
is neither always appropriate nor always necessary to use a formal risk management process
(using recognized tools and/or internal procedures e.g., standard operating procedures). The use
of informal risk management processes (using empirical tools and/or internal procedures) can
also be considered acceptable. Appropriate use of quality risk management can facilitate but
does not obviate industry’s obligation to comply with regulatory requirements and does not
replace appropriate communications between industry and regulators.”4
The two primary principles should be considered when implementing quality risk management:
• The evaluation of the risk to quality should be based on scientific knowledge and ultimately link
to the protection of the patient; and
• The level of effort, formality and documentation of the quality risk management process should
be commensurate with the level of risk.
Based upon the physicochemical and biological properties of the drug substance, the initial risk
assessment of drug substance attributes on drug product CQAs is shown in Table 12.
Table 12. Initial risk assessment of the drug substance attributes
Drug
Product
CQAs
Drug Substance Attributes
Solid
State
Form
Particle Size
Distribution
(PSD)
Hygroscopicity Solubility
Moisture
Content
Residual
Solvents
Process
Impurities
Chemical
Stability
Flow
Properties
Assay Low Medium Low Low Low Low Low High Medium
Content
Uniformity
Low High Low Low Low Low Low Low High
Dissolution High High Low High Low Low Low Low Low
Degradation
Products
Medium Low Low Low Low Low Low High Low
The justification for the assigned level of risk is provided in Table 13.
April 2012 23
4
ICH Harmonised Tripartite Guideline: Q9 Quality Risk Management. November 2005.
Example QbD IR Tablet Module 3 Quality 3.2.P.2 Pharmaceutical Development
Table 13. Justification for the initial risk assessment of the drug substance attributes
Drug Substance
Attributes
Drug Products CQAs Justification
Solid State Form
Assay Drug substance solid state form does not affect tablet assay and CU.
The risk is low.Content Uniformity
Dissolution
Different polymorphic forms of the drug substance have different
solubility and can impact tablet dissolution. The risk is high.
Acetriptan polymorphic Form III is the most stable form and the DMF
holder consistently provides this form. In addition, pre-formulation
studies demonstrated that Form III does not undergo any polymorphic
conversion under the various stress conditions tested. Thus, further
evaluation of polymorphic form on drug product attributes was not
conducted.
Degradation Products
Drug substance with different polymorphic forms may have different
chemical stability and may impact the degradation products of the
tablet. The risk is medium.
Particle Size
Distribution (PSD)
Assay
A small particle size and a wide PSD may adversely impact blend
flowability. In extreme cases, poor flowability may cause an assay
failure. The risk is medium.
Content Uniformity
Particle size distribution has a direct impact on drug substance
flowability and ultimately on CU. Due to the fact that the drug
substance is milled, the risk is high.
Dissolution
The drug substance is a BCS class II compound; therefore, PSD can
affect dissolution. The risk is high.
Degradation Products
The effect of particle size reduction on drug substance stability has
been evaluated by the DMF holder. The milled drug substance
exhibited similar stability as unmilled drug substance. The risk is low.
Hygroscopicity
Assay
Acetriptan is not hygroscopic. The risk is low.
Content Uniformity
Dissolution
Degradation Products
Solubility
Assay
Solubility does not affect tablet assay, CU and degradation products.
Thus, the risk is low.Content Uniformity
Degradation Products
Dissolution
Acetriptan exhibited low (~0.015 mg/mL) and constant solubility
across the physiological pH range. Drug substance solubility strongly
impacts dissolution. The risk is high. Due to pharmaceutical
equivalence requirements, the free base of the drug substance must be
used in the generic product. The formulation and manufacturing
process will be designed to mitigate this risk.
Moisture Content
Assay Moisture is controlled in the drug substance specification (NMT
0.3%). Thus, it is unlikely to impact assay, CU and dissolution. The
risk is low.
Content Uniformity
Dissolution
Degradation Products
The drug substance is not sensitive to moisture based on forced
degradation studies. The risk is low.
April 2012 24
Example QbD IR Tablet Module 3 Quality 3.2.P.2 Pharmaceutical Development
Drug Substance
Attributes
Drug Products CQAs Justification
Residual Solvents
Assay Residual solvents are controlled in the drug substance specification
and comply with USP <467>. At ppm level, residual solvents are
unlikely to impact assay, CU and dissolution. The risk is low.
Content Uniformity
Dissolution
Degradation Products
There are no known incompatibilities between the residual solvents
and acetriptan or commonly used tablet excipients. As a result, the risk
is low.
Process Impurities
Assay Total impurities are controlled in the drug substance specification
(NMT 1.0%). Impurity limits comply with ICH Q3A
recommendations. Within this range, process impurities are unlikely
to impact assay, CU and dissolution. The risk is low.
Content Uniformity
Dissolution
Degradation Products
During the excipient compatibility study, no incompatibility between
process impurities and commonly used tablet excipients was observed.
The risk is low.
Chemical Stability
Assay
The drug substance is susceptible to dry heat, UV light and oxidative
degradation; therefore, acetriptan chemical stability may affect drug
product assay and degradation products. The risk is high.
Content Uniformity
Tablet CU is mainly impacted by powder flowability and blend
uniformity. Tablet CU is unrelated to drug substance chemical
stability. The risk is low.
Dissolution
Tablet dissolution is mainly impacted by drug substance solubility and
particle size distribution. Tablet dissolution is unrelated to drug
substance chemical stability. The risk is low.
Degradation Products The risk is high. See justification for assay.
Flow Properties
Assay
Acetriptan has poor flow properties. In extreme cases, poor flow may
impact assay. The risk is medium.
Content Uniformity
Acetriptan has poor flow properties which may lead to poor tablet CU.
The risk is high.
Dissolution The flowability of the drug substance is not related to its degradation
pathway or solubility. Therefore, the risk is low.Degradation Products
2.1.2 Excipients
The excipients used in acetriptan tablets were selected based on the excipients used in the RLD,
excipient compatibility studies and prior use in approved ANDA products that utilize roller
compaction (RC). A summary of the excipient-drug substance compatibility studies and the
selection of each excipient grade is provided in the following section.
2.1.2.1 Excipient Compatibility Studies
Note to Reader: Excipient compatibility is an important part of understanding the role of
inactive ingredients in product quality. The selection of excipients for the compatibility study
should be based on the mechanistic understanding of the drug substance and its impurities,
excipients and their impurities, degradation pathway and potential processing conditions for the
drug product manufacture. A scientifically sound approach should be used in constructing the
compatibility studies. The commercial grades of the excipients are not provided in this example
April 2012 25
Example QbD IR Tablet Module 3 Quality 3.2.P.2 Pharmaceutical Development
to avoid endorsement of specific products. However, in an actual pharmaceutical development
report, the names of the commercial grades are expected.
Excipient-drug substance compatibility was assessed through HPLC analysis of binary mixtures
of excipient and drug substance at a 1:1 ratio in the solid state. Samples were stored at 25 °C/60
% RH and 40 °C/75 % RH in both open and closed containers for 1 month. Common excipients
functioning as filler, disintegrant, and lubricant were evaluated in the excipient compatibility
study. Table 14 summarizes the results.
Table 14. Excipient compatibility (binary mixtures)*
Mixture
Assay Degradants
(% w/w) (% w/w)
Lactose Monohydrate/DS (1:1) 99.8% ND
Lactose Anhydrous/DS (1:1) 99.6% ND
Microcrystalline Cellulose (MCC)/DS (1:1) 98.4% ND
Dibasic Calcium Phosphate/DS (1:1) 99.3% ND
Mannitol/DS (1:1) 101.1% ND
Pregelatinized Starch/DS (1:1) 100.5% ND
Croscarmellose Sodium (CCS)/DS (1:1) 99.7% ND
Crospovidone (1:1) 99.3% ND
Sodium Starch Glycolate (1:1) 98.8% ND
Talc/DS (1:1) 99.5% ND
Magnesium Stearate/DS (1:1) 95.1% AD1: 4.4%
*Conditions: 40 °C/75 % RH, open container, 1 month
Loss in assay or detection of degradants indicative of an incompatibility was not observed for the
selected excipients except magnesium stearate. An interaction was seen with magnesium stearate
at 40 °C/75 % RH. This interaction caused lower assay results for acetriptan. The mechanism for
this interaction was indentified as formation of a magnesium stearate-acetriptan adduct (AD1)
involving stearic acid. To further evaluate if this potential interaction could cause drug
instability, an additional experiment was performed in which several different mixtures of drug
and excipients were prepared. Only the excipient types used in the RLD formulation were
selected for this study. The first mixture consisted of drug and all excipients in the ratio
representative of the finished product. In subsequent mixtures, one excipient was removed at a
time. These mixtures were stored at 25 °C/60% RH and 40 °C/75% RH in both open and closed
containers for 1 month. Table 15 presents the results of the study.
Table 15. Excipient compatibility (interaction study)*
Mixture
Assay Degradants
(% w/w) (% w/w)
All excipients 99.4% ND
All excipients except Lactose Monohydrate 99.2% ND
All excipients except Microcrystalline Cellulose (MCC) 99.8% ND
All excipients except Croscarmellose Sodium (CCS) 99.9% ND
All excipients except Talc 99.3% ND
All excipients except Magnesium Stearate 99.6% ND
*Conditions: 40 °C/75 % RH, open container, 1 month
April 2012 26
Example QbD IR Tablet Module 3 Quality 3.2.P.2 Pharmaceutical Development
No loss in assay was observed in any of these mixtures at 40 °C/75% RH or at 25 °C/60% RH.
There is no incompatibility with the selected excipients except for the noted interaction with
magnesium stearate in the binary mixture study. Therefore, magnesium stearate was still
selected, but contact of the drug substance with magnesium stearate was limited by only using
extragranular magnesium stearate. Intragranular lubrication required for the roller compaction
process was achieved by using talc. Subsequent assurance of compatibility was provided by
long-term stability data for formulations used in the pilot BE study and the ongoing prototype
stability studies using the formulation proposed for commercialization. The impurity method is
able to identify and quantify AD1. Adduct formation was below the limit of quantitation in the
long-term stability study and is controlled by the limit for any unspecified impurity.
2.1.2.2 Excipient Grade Selection
Based on the results of excipient compatibility studies, identical excipient types to the RLD
formulation were selected for the generic product development. The selection of excipient grade
and supplier was based on previous formulation experience and knowledge about excipients that
have been used successfully in approved products manufactured by roller compaction as given in
Table 16. The level of excipients used in the formulation were studied in subsequent formulation
development studies.
Table 16. Initial selection of excipient type, grade and supplier
Excipient Supplier Grade Prior Use in Roller Compaction
Lactose Monohydrate A A01 ANDA 123456, ANDA 456123
Microcrystalline Cellulose (MCC) B B02 ANDA 123456, ANDA 456123
Croscarmellose Sodium (CCS) C C03 ANDA 123456
Talc D D04 ANDA 123456
Magnesium Stearate E E05 ANDA 123456, ANDA 456123
Microcrystalline cellulose and lactose monohydrate comprise about 80% of the total drug
product composition. Microcrystalline cellulose and lactose monohydrate are among the
commonly used fillers for dry granulation formulations, both individually and in combination
with each other, because they exhibit appropriate flow and compression properties. The particle
size distribution, particle morphology, aspect ratio, bulk density and flowability of different
grades have the potential to affect drug product content uniformity. Therefore, additional particle
size controls above those in the pharmacopoeia are included in the specifications for the two
major excipients: lactose monohydrate (d50: 70-100 µm) and microcrystalline cellulose (d50: 80-
140 µm). Material within these ranges was used in all further formulation studies.
Lactose Monohydrate: Lactose monohydrate is commonly used as a filler. The potential
impurities of lactose are melamine and aldehydes. The supplier has certified that the lactose is
free of melamine and has provided a certificate of suitability for TSE/BSE. Lactose monohydrate
Grade A01 from supplier A was selected based on successful product development in approved
ANDA 123456 and ANDA 456123, both of which used roller compaction. The selected grade
provides acceptable flow and compression properties when used in combination with
microcrystalline cellulose.
April 2012 27
Example QbD IR Tablet Module 3 Quality 3.2.P.2 Pharmaceutical Development
Microcrystalline Cellulose (MCC): Microcrystalline cellulose is widely used as a filler for
direct compression and roller compaction. Though it is reported in the literature that MCC may
physically bind or adsorb drug substance, no such physical interaction was evident in the
formulation dissolution studies. It is known from the literature that MCC undergoes plastic
deformation during compaction since it is a fibrous material and ductile in nature. Not all grades
of MCC may be suitable for use in roller compaction. Microcrystalline cellulose Grade B02 from
supplier B was selected based on the acceptable flow and compression properties when used in
combination with lactose monohydrate as demonstrated in approved ANDA 123456 and ANDA
456123.
Croscarmellose Sodium (CCS): Acetriptan is a BCS class II drug so rapid disintegration is
necessary to ensure maximum bioavailability. Being a superdisintegrant, croscarmellose sodium
is hygroscopic in nature. It swells rapidly to about 4-8 times its original volume when it comes in
contact with water. Grade C03 from supplier C was selected.
Talc: Talc is a common metamorphic mineral and is used as a glidant and/or lubricant both
intragranularly and extragranularly in the formulation. Intragranular talc was used to prevent
sticking during the roller compaction process. Because of the interaction between magnesium
stearate and acetriptan, talc was also added extragranularly to reduce the level of magnesium
stearate needed for the lubrication. Grade D04 from supplier D was selected.
Magnesium Stearate: It is the most commonly used lubricant for tablets. Because magnesium
stearate interacts with acetriptan to form an adduct, it is used only extragranularly. Magnesium
stearate grade E05 from supplier E was selected and is of vegetable origin.
2.2 Drug Product
2.2.1 Formulation Development
2.2.1.1 Initial Risk Assessment of the Formulation Variables
Note to Reader: In this initial risk assessment for formulation development, the detailed
manufacturing process has not been established. Thus, risks were rated assuming that for each
formulation attribute that changed, an optimized manufacturing process would be established.
The results of the initial risk assessment of the formulation variables are presented in Table 17
and the justification for the risk assignment is presented in Table 18.
April 2012 28
Example QbD IR Tablet Module 3 Quality 3.2.P.2 Pharmaceutical Development
Table 17. Initial risk assessment of the formulation variables
Drug Product
CQA
Formulation Variables
Drug Substance
PSD
MCC/Lactose
Ratio
CCS
Level
Talc
Level
Magnesium
Stearate Level
Assay Medium Medium Low Low Low
Content Uniformity High High Low Low Low
Dissolution High Medium High Low High
Degradation Products Low Low Low Low Medium
Table 18. Justification for the initial risk assessment of the formulation variables
Formulation
Variables
Drug Products CQAs Justification
Drug Substance
PSD
Assay
See Justifications provided in Table 13.
Content Uniformity
Dissolution
Degradation Products
MCC/Lactose
Ratio
Assay
MCC/Lactose ratio can impact the flow properties of the
blend. This, in turn, can impact tablet CU. The risk is high.
Occasionally, poor CU can also adversely impact assay. The
risk is medium.Content Uniformity
Dissolution
MCC/lactose ratio can impact dissolution via tablet
hardness. However, hardness can be controlled during
compression. The risk is medium.
Degradation Products
Since both MCC and lactose are compatible with the drug
substance and will not impact drug product degradation, the
risk is low.
CCS Level
Assay Since the level of CCS used is low and its impact on flow is
minimal, it is unlikely to impact assay and CU. The risk is
low.Content Uniformity
Dissolution
CCS level can impact the disintegration time and,
ultimately, dissolution. Since achieving rapid disintegration
is important for a drug product containing a BCS class II
compound, the risk is high.
Degradation Products
CCS is compatible with the drug substance and will not
impact drug product degradation. Thus, the risk is low.
Talc Level
Assay Generally, talc enhances blend flowability. A low level of
talc is not likely to impact assay and CU. The risk is low.Content Uniformity
Dissolution
Compared to magnesium stearate, talc has less impact on
disintegration and dissolution. The low level of talc used in
the formulation is not expected to impact dissolution. The
risk is low.
Degradation Products
Talc is compatible with the drug substance and will not
impact degradation products. The risk is low.
April 2012 29
Example QbD IR Tablet Module 3 Quality 3.2.P.2 Pharmaceutical Development
Formulation
Variables
Drug Products CQAs Justification
Magnesium
Stearate Level
Assay Since the level of magnesium stearate used is low and its
impact on flow is minimal, it is unlikely to impact assay and
CU. The risk is low.Content Uniformity
Dissolution
Over-lubrication due to excessive lubricant may retard
dissolution. The risk is high.
Degradation Products
Though it formed an adduct with the drug substance in the
binary mixture compatibility study (magnesium stearate/DS
ratio 1:1), the interaction compatibility study showed that
the adduct formation is negligible when magnesium stearate
is used at a level representative of the finished drug product
composition (magnesium stearate/DS ratio 1:10). Thus, the
risk is medium.
2.2.1.2 Drug Substance Particle Size Selection for Product Development
In general, for drug substance with plate-like morphology and particle size in the micrometer
range, a larger drug substance particle size improves manufacturability because it has better
flow. However, for a BCS II compound like acetriptan, larger drug substance particle size may
significantly decrease dissolution and negatively impact the in vivo performance. With an aim to
identify the appropriate drug substance particle size distribution range for further study, an in
silico simulation was conducted to estimate the impact of the drug substance mean particle size,
d50, on the Cmax ratio and AUC ratio between the test product and the RLD.5
The predefined
selection criterion was a mean particle size that yielded both a Cmax ratio and an AUC ratio
between 0.9 and 1.11. The result of the simulation for d50 ranging from 1 µm to 200 µm is
presented graphically in Figure 9. The data indicate that a d50 of 30 µm or less met the predefined
criterion and exhibited a limited effect on the pharmacokinetic profile when compared to the
RLD.
April 2012 30
5
W. Huang, S. Lee and L.X. Yu. Mechanistic Approaches to Predicting Oral Drug Absorption. The AAPS Journal,
2009, 11(2): 217-224.
Example QbD IR Tablet Module 3 Quality 3.2.P.2 Pharmaceutical Development
0.0
0.1
0.2
0.3
0.4
0.5
0.6
0.7
0.8
0.9
1.0
1.1
1 10 100 1000
Test/RLDRatio
Cmax Ratio
AUC0-t Ratio
Drug Substance Mean Particle Size (d50, μm)
Figure 9. In silico simulation of pharmacokinetic profiles versus drug substance mean particle size
Based on the results of the simulation, drug substance lots with four different particle size
distributions were selected for formulation development. Ultimately, the goal was to test the
formulations in a pilot PK study to finalize the drug substance particle size distribution for
commercialization. Both physical and flow properties of the four drug substance lots were
evaluated and are summarized in Table 19. In this development report, d90 is used to describe the
drug substance particle size distribution. The acetriptan d90 of 10 µm, 20 µm, 30 µm and 45 µm
correspond to a d50 of 6 µm, 12 µm, 24 µm and 39 µm, respectively.
April 2012 31
Example QbD IR Tablet Module 3 Quality 3.2.P.2 Pharmaceutical Development
Table 19. Drug substance lots used for formulation development
Physical Properties Interpretation of Data
Lot
#1
Lot
#2
Lot
#3
Lot
#4
d90 (µm) -- 10 20 30 45
d50 (µm) -- 6 12 24 39
d10 (µm) -- 3.6 7.2 14.4 33.4
Bulk density (g/cc) -- 0.26 0.27 0.28 0.29
Tapped density (g/cc) -- 0.41 0.39 0.39 0.38
Flow function coefficient (ffc)6
ffc < 3.5 poor flow
3.5 < ffc < 5.0 marginal flow
5.0 < ffc < 8.0 good flow
ffc > 8.0 excellent flow
2.88 2.95 3.17 3.21
Compressibility index (%)7
< 15 good flow 36.6 30.8 28.2 23.7
Hausner ratio7
< 1.25 fair flow 1.58 1.44 1.39 1.31
Specific energy (mJ/g)
determined by powder rheometer8
5 < SE < 10 moderate cohesion
SE > 10 high cohesion
13 12 10 8.5
2.2.1.3 Process Selection
When d90 is in the range of 10-45 µm, acetriptan is cohesive and displays poor flowability as
evidenced by the compressibility index, Hausner ratio, flow function coefficient and specific
energy. Poor material flow may produce tablets with high weight and content variability due to
an uneven distribution of the drug substance in the blend, uneven bulk density and, eventually,
uneven filling of die cavities on the tablet press. Poor acetriptan flow rules out the use of a high
drug load formulation and supports the use of a similar drug load to the RLD which is 10%.
Initially, direct compression of the blend was performed. The blend uniformity (BU) percent
relative standard deviation (% RSD) was higher than 6% and the tablet content uniformity %
RSD was even higher. Therefore, direct compression was considered an unacceptable process for
this formulation.
Wet granulation was excluded due to potential thermal degradation of the drug substance during
drying based on the forced degradation study results. The use of wet granulation with an organic
solvent was also excluded because of the desire to avoid the environmental considerations
involved. For dry granulation by roller compaction, the powder particles of drug substance and
fillers are aggregated under high pressure to form a ribbon and then broken down to produce
granules by milling before compression (tabletting). The risk of drug particle segregation can be
minimized. By controlling the size distribution and flow properties of the granules, the risk of
poor tablet content uniformity can be reduced. Thus, dry granulation by roller compaction was
selected as the process for further drug product development efforts.
April 2012 32
6
M. P. Mullarney and N. Leyva, Modeling Pharmaceutical Powder-Flow Performance Using Particle-Size
Distribution Data, Pharmaceutical Technology, 2009, 33(3): 126-134.
7
The full scale of flowability for compressibility index and Hauser ratio are provided in USP <1174> Powder Flow.
8
As per powder rheometer equipment vendor guideline
Example QbD IR Tablet Module 3 Quality 3.2.P.2 Pharmaceutical Development
2.2.1.4 Formulation Development Study #1
Note to Reader: A univariate method (i.e., one-factor-at-a time (OFAT)) is acceptable in cases
where there is no potential interaction between factors. Since this is often not known, a
multivariate statistical design (i.e., Design of Experiments (DOE)) is often used and results are
evaluated with commercially available statistical software. A sequential strategy is commonly
employed when planning a DOE. Initially, a screening DOE can be used to narrow down the
extensive list of factors identified during initial risk assessment to a few vital factors. Then, a
characterization DOE can be used to understand the main effects and potential interaction(s)
between these vital factors. When center points are included in a 2-level factorial DOE, it is
possible to test if the curvature effect is significant. Data analysis is done by separating the
curvature term from the regression model in an adjusted model. If the curvature is significant,
the design should be augmented to a response surface DOE to estimate the quadratic terms. On
the other hand, if the curvature is not significant, the adjusted model and unadjusted model will
be similar. Finally, a verification DOE can be employed to study the robustness of the system by
varying the identified critical factors over ranges that are expected to be encountered during
routine manufacturing.
Randomization, blocking and replication are the three basic principles of statistical experimental
design. By properly randomizing the experiment, the effects of uncontrollable factors that may be
present can be “averaged out”. Blocking is the arrangement of experimental units into groups
(blocks) that are similar to one another. Blocking reduces known but irrelevant sources of
variation between groups and thus allows greater precision in the estimation of the source of
variation under study. Replication allows the estimation of the pure experimental error for
determining whether observed differences in the data are really statistically different.
In this mock example, we have not included ANOVA results for each DOE. In practice, please be
advised that ANOVA results should accompany all DOE data analysis, especially if conclusions
concerning the significance of the model terms are discussed.
For all DOE data analysis, the commonly used alpha of 0.05 was chosen to differentiate between
significant and nonsignificant factors.
It is important that any experimental design has sufficient power to ensure that the conclusions
drawn are meaningful. Power can be estimated by calculating the signal to noise ratio. If the
power is lower than the desired level, some remedies can be employed to increase the power, for
example, by adding more runs, increasing the signal or decreasing the system noise. Please refer
to the ICH Points to Consider document for guidance on the level of DOE documentation
recommended for regulatory submissions.9
Formulation development focused on evaluation of the high risk formulation variables as
identified in the initial risk assessment shown in Table 17. The development was conducted in
two stages. The first formulation study evaluated the impact of the drug substance particle size
distribution, the MCC/Lactose ratio and the disintegrant level on the drug product CQAs. The
9
ICH Quality Implementation Working Group Points to Consider (R2). December 6, 2011.
April 2012 33
Example QbD IR Tablet Module 3 Quality 3.2.P.2 Pharmaceutical Development
second formulation study was conducted to understand the impact of extragranular magnesium
stearate and talc level in the formulation on product quality and manufacturability. Formulation
development studies were conducted at laboratory scale (1.0 kg, 5,000 units). Table 20 details
the equipment and the associated process parameters used in these studies.
Table 20. Equipment and fixed process parameters used in formulation development studies
Process Step Equipment
Pre-Roller Compaction Blending
and Lubrication
4 qt V-blender
o 250 revolutions for blending (10 min at 25 rpm)
Roller Compaction and Integrated
Milling
Alexanderwerk10
WP120 with 25 mm roller width and
120 mm roller diameter
o Roller surface: Knurled
o Roller pressure: 50 bar
o Roller gap: 2 mm
o Roller speed: 8 rpm
o Mill speed: 60 rpm
o Coarse screen orifice size: 2.0 mm
o Mill screen orifice size: 1.0 mm
Final Blending and Lubrication
4 qt V-blender
o 100 revolutions for granule and talc blending (4 min at
25 rpm)
o 75 revolutions for lubrication (3 min at 25 rpm)
Tablet Compression
16-station rotary press (2 stations used)
o 8 mm standard round concave tools
o Press speed: 20 rpm
o Compression force: 5-15 kN
o Pre-compression force: 1 kN
The goal of Formulation Development Study #1 was to select the MCC/Lactose ratio and
disintegrant level and to understand if there was any interaction of these variables with drug
substance particle size distribution. This study also sought to establish the robustness of the
proposed formulation. A 23
full factorial Design of Experiments (DOE) with three center points
was used to study the impact of these three formulation factors on the response variables listed in
Table 21.
The acetriptan d90 of 10 µm, 20 µm and 30 µm corresponds with the d50 of 6 µm, 12 µm and 24
µm, respectively. These drug substance lots are characterized in Table 19 and were selected
based on the in silico simulation results discussed in Section 2.2.1.2.
Disintegrant (croscarmellose sodium) was added intragranularly and the levels investigated
ranged from 1% to 5%. These levels are consistent with the estimated level in the RLD
formulation and are within the recommended range in the Handbook of Pharmaceutical
Excipients.11
April 2012 34
10
FDA does not endorse any particular equipment vendors.
11
Rowe, RC., PJ Sheskey and ME Quinn. Handbook of Pharmaceutical Excipients, 6th Edition. Grayslake, IL: RPS
Publishing, 2009.
Example QbD IR Tablet Module 3 Quality 3.2.P.2 Pharmaceutical Development
The MCC/Lactose ratios selected for formulation studies were based on experience with
previously approved products manufactured using roller compaction (ANDA 123456 and ANDA
456123). The MCC/Lactose ratios are transformed to a continuous numeric variable as a
percentage of MCC in the MCC/Lactose dual filler combination by assigning values of 33.3%,
50.0% and 66.7% corresponding to 1:2, 1:1 and 2:1, respectively.
The drug load in the generic formulation was fixed at 10% based on the RLD label, strength and
tablet weight. For this study, both intragranular and extragranular talc levels were fixed at 2.5%.
The extragranular magnesium stearate level was fixed at 1%. The levels of talc and magnesium
stearate are consistent with the levels observed in the RLD formulation and agree with the
recommendations published in the Handbook of Pharmaceutical Excipients.11
A constant tablet
weight of 200.0 mg was used with the filler amount adjusted to achieve the target weight.
Table 21 summarizes the factors and responses studied. For each batch, the blend was
compressed at several compression forces (data shown for only 5 kN, 10 kN and 15 kN) to obtain
the compression profile. Using the profile, the force was adjusted to compress tablets to the
target hardness for disintegration and dissolution testing.
Table 21. Design of the 23
full factorial DOE to study intragranular excipients and drug substance PSD
Factors: Formulation Variables
Levels
-1 0 +1
A Drug substance PSD (d90, µm) 10 20 30
B Disintegrant (%) 1 3 5
C % MCC in MCC/Lactose combination 33.3 50.0 66.7
Responses Goal Acceptable Ranges
Y1
Dissolution at 30 min (%)
(with hardness of 12.0 kP)
Maximize ≥ 80%
Y2
Disintegration time (min)
(with hardness of 12.0 kP)
Minimize < 5 min
Y3 Tablet content uniformity (% RSD) Minimize % RSD < 5%
Y4 Assay (% w/w) Target at 100% w/w 95.0-105.0% w/w
Y5 Powder blend flow function coefficient (ffc) Maximize > 6
Y6 Tablet hardness@ 5 kN (kP) Maximize > 5.0 kP
Y7 Tablet hardness @ 10 kN (kP) Maximize > 9.0 kP
Y8 Tablet hardness @ 15 kN (kP) Maximize > 12.0 kP
Y9 Friability @ 5 kN (%) Minimize < 1.0%
Y10 Friability @ 10 kN (%) Minimize < 1.0%
Y11 Friability @ 15 kN (%) Minimize < 1.0%
Y12
Degradation products (%)
(observed at 3 months, 40 °C/75% RH)
Minimize
ACE12345: NMT 0.5%
Any unknown impurity: NMT 0.2%
Total impurities: NMT 1.0%
To study tablet dissolution at a target tablet hardness of 12.0 kP (a range of 11.0-13.0 kP was
allowed), the compression force was adjusted. A target tablet hardness of 12.0 kP was chosen to
investigate the effect of formulation variables on dissolution because a high hardness would be
expected to be the worst case for dissolution. If dissolution was studied at a fixed compression
force, the results could be confounded by the impact of tablet hardness.
April 2012 35
Example QbD IR Tablet Module 3 Quality 3.2.P.2 Pharmaceutical Development
The flow function coefficient (ffc) of the powder blend prior to roller compaction (Y6) was
measured using a ring shear tester. According to the literature6
, the following rule is used to
gauge the powder's relative flowability:
ffc < 3.5 poor
3.5 < ffc < 5.0 marginal
5.0 < ffc < 8.0 good
ffc > 8.0 excellent
The experimental results for dissolution, content uniformity, powder blend flow function
coefficient and tablet hardness when compressed at 10 kN (Y1, Y3, Y5 and Y7, other responses not
shown) are presented in Table 22.
Table 22. Experimental results of the DOE to study intragranular excipients and drug substance PSD
Batch
No.
Factors: Formulation Variables Responses
A:
Drug
substance
PSD
B:
Disintegrant
level
C:
% MCC in
MCC/Lactose
combination
Y1:
Dissolution
at 30 min
Y3:
CU
Y5:
ffc
value
Y7:
Tablet
hardness @
10 kN
(d90, μm) (%) (%) (%) (% RSD) -- (kP)
1 30 1 66.7 76.0 3.8 7.56 12.5
2 30 5 66.7 84.0 4.0 7.25 13.2
3 20 3 50.0 91.0 4.0 6.62 10.6
4 20 3 50.0 89.4 3.9 6.66 10.9
5 30 1 33.3 77.0 2.9 8.46 8.3
6 10 5 66.7 99.0 5.1 4.77 12.9
7 10 1 66.7 99.0 5.0 4.97 13.5
8 20 3 50.0 92.0 4.1 6.46 11.3
9 30 5 33.3 86.0 3.2 8.46 8.6
10 10 1 33.3 99.5 4.1 6.16 9.1
11 10 5 33.3 98.7 4.0 6.09 9.1
Significant factors for tablet dissolution (at 30 min)
Initially, dissolution was tested using the FDA-recommended method. All batches exhibited
rapid and comparable dissolution (> 90% dissolved in 30 min) to the RLD. All batches were then
retested using the in-house dissolution method (see details in Section 1.4). Results are presented
in Table 22. Since center points were included in the DOE, the significance of the curvature
effect was tested using an adjusted model. The Analysis of Variance (ANOVA) results are
presented in Table 23.
April 2012 36
Example QbD IR Tablet Module 3 Quality 3.2.P.2 Pharmaceutical Development
Table 23. ANOVA results of the model adjusted for curvature effect
Source
Sum of
Squares
df*
Mean
Square
F Value p-value Comments
Model 742.19 3 247.40 242.94 < 0.0001 Significant
A-Drug substance PSD (d90, μm) 669.78 1 669.78 657.72 < 0.0001
SignificantB-Disintegrant (%) 32.81 1 32.81 32.21 0.0013
AB-interaction 39.61 1 39.61 38.89 0.0008
Curvature 1.77 1 1.77 1.74 0.2358 Not significant
Residual 6.11 6 1.02 -- -- --
Lack of Fit 2.67 4 0.67 0.39 0.8090 Not significant
Pure Error 3.44 2 1.72 -- -- --
Total 750.07 10 -- -- -- --
*df: degrees of freedom
As shown in Table 23, the curvature effect was not significant for dissolution; therefore, the
factorial model coefficients were fit using all of the data (including center points). As shown in
the following half-normal plot (Figure 10) and ANOVA results of the unadjusted model (Table
24), the significant factors affecting tablet dissolution were A (drug substance PSD), B
(disintegrant level) and AB (an interaction between drug substance PSD and the intragranular
disintegrant level).
Table 24. ANOVA results of the unadjusted model
Source
Sum of
Squares
df
Mean
Square
F Value p-value Comments
Model 742.19 3 247.40 219.84 < 0.0001 Significant
A-Drug substance PSD (d90, μm) 669.78 1 669.78 595.19 < 0.0001
SignificantB-Disintegrant (%) 32.81 1 32.81 29.15 0.0010
AB-Interaction 39.61 1 39.61 35.19 0.0006
Residual 7.88 7 1.13 -- -- --
Lack of Fit 4.44 5 0.89 0.52 0.7618 Not significant
Pure Error 3.44 2 1.72 -- -- --
Total 750.07 10 -- -- -- --
April 2012 37
Example QbD IR Tablet Module 3 Quality 3.2.P.2 Pharmaceutical Development
Dissolution at 30 min (%)
Shapiro-Wilk Test
W-value = 0.926
p-value = 0.572
A: DS PSD (d90, μm)
B: Disintegrant (%)
C: % MCC in MCC/Lactose
Combination
Half-Normal%Probability
|Standardized Effect|
0.00 4.58 9.15 13.73 18.30
0
10
20
30
50
70
80
90
95
B
AB
Error Estimates
A
Positive Effects
Negative Effects
Figure 10. Half-normal plot of the formulation variable effects on dissolution at 30 min
(tablet target hardness of 12.0 kP)
Figure 11 shows the effect of drug substance PSD and disintegrant level on dissolution at 30
minutes. Dissolution decreased with increasing drug substance PSD. On the other hand,
dissolution increased with increasing disintegrant level. With a larger drug substance PSD, the
disintegrant level had a greater impact on dissolution than with a smaller drug substance PSD.
99.5
76.0
A: DS PSD (d90, μm)
B: Disintegrant (%)
Actual Factor:
C: % MCC in MCC/Lactose
Combination = 50.0
10 15 20 25 30
1.0
2.0
3.0
4.0
5.0
A: DS PSD (d90, μm)
B:Disintegrant(%)
95.0 90.0
85.0
80.0
Dissolution at 30 min (%)
Figure 11. Effect of drug substance PSD and disintegrant level on dissolution at 30 min
(tablet target hardness of 12.0 kP)
April 2012 38
Example QbD IR Tablet Module 3 Quality 3.2.P.2 Pharmaceutical Development
Significant factors for tablet disintegration time
The disintegrant level was the only statistically significant factor to affect tablet disintegration.
However, all batches demonstrated rapid disintegration in less than 4 minutes.
Significant factors for tablet assay
All batches demonstrated acceptable assay (ranging from 98.3-101.2%) which was well within
the specification limits (95.0-105.0% w/w) and none of factors showed significant impact on
tablet assay.
Significant factors for tablet content uniformity (%RSD)
Data analysis indicated that the curvature effect was not significant for tablet content uniformity.
As shown in the half-normal plot (Figure 12), the significant factors affecting tablet content
uniformity were A (drug substance PSD) and C (% MCC in the MCC/Lactose combination).
Content Uniformity (% RSD)
Shapiro-Wilk Test
W-value = 0.821
p-value = 0.119
A: DS PSD (d90, μm)
B: Disintegrant (%)
C: % MCC in MCC/Lactose
Combination
Half-Normal%Probability
|Standardized Effect|
0.00 0.27 0.54 0.81 1.07
0
10
20
30
50
70
80
90
95
A
C
Error Estimates
Positive Effects
Negative Effects
Figure 12. Half-normal plot of the formulation variables effect on tablet content uniformity (% RSD)
Figure 13 shows the effect of drug substance PSD and percentage of MCC in the MCC/Lactose
combination on tablet content uniformity. The % RSD decreased with increasing drug substance
PSD. On the other hand, % RSD increased with increasing percentage of MCC in the
MCC/Lactose combination, likely because the fibrous particle shape of MCC does not flow as
well as the spherical particle shape of lactose.
April 2012 39
Example QbD IR Tablet Module 3 Quality 3.2.P.2 Pharmaceutical Development
Content Uniformity (% RSD)5.1
2.9
A: DS PSD (d90, μm)
C: % MCC in MCC/Lactose
Combination
Actual Factor:
B: Disintegrant (%) = 3.0
66.7
10 15 20 25 30
33.3
41.6
50.0
58.4
A: DS PSD (d90, μm)
C:%MCCinMCC/LactoseCombination
4.5
4.0
3.5
Figure 13. Effect of drug substance PSD and % of MCC in the MCC/Lactose combination on tablet content uniformity (%RSD)
Significant factors for powder blend flowability
The flowability (represented by ffc value) of the powder blend from the pre-roller compaction
blending and lubrication step was determined for each sample using a ring shear tester. The ffc
of each sample was then recorded. As shown in the half-normal plot (Figure 14), the significant
factors affecting powder blend flowability were A (drug substance PSD) and C (% MCC in the
MCC/Lactose combination). The effect of drug substance PSD and percentage of MCC in the
MCC/Lactose combination on powder blend flowability is shown in Figure 15. Powder blend
flowability increased with increasing drug substance PSD and decreasing percentage of MCC in
the MCC/Lactose combination.
April 2012 40
Example QbD IR Tablet Module 3 Quality 3.2.P.2 Pharmaceutical Development
flow function coefficient (ffc)
Shapiro-Wilk Test
W-value = 0.960
p-value = 0.805
A: DS PSD (d90, μm)
B: Disintegrant (%)
C: % MCC in MCC/Lactose
Combination
Half-Normal%Probability
|Standardized Effect|
0.00 0.30 0.61 0.91 1.22 1.52 1.83 2.13 2.44
0
10
20
30
50
70
80
90
95
A
C
Error Estimates
Positive Effects
Negative Effects
Figure 14. Half-normal plot of the formulation variable effects on powder blend flowability (ffc)
8.46
4.77
10 15 20 25 30
33.3
41.6
50.0
58.4
66.7
flow function coefficient (ffc)
A: DS PSD (d90, μm)
C:%MCCinMCC/LactoseCombination
A: DS PSD (d90, μm)
C: % MCC in MCC/Lactose
Combination
6.00
7.00Actual Factor:
B: Disintegrant (%) = 3.0
8.00
Figure 15. Effect of drug substance PSD and % MCC in the MCC/Lactose combination on flowability (ffc)
Significant factors for tablet hardness
Each DOE batch was compressed at 5 kN, 10 kN and 15 kN to evaluate its tabletability. The
half-normal plot (Figure 16) shows that the only significant factor affecting tablet hardness when
using 10 kN of compression force was C (% MCC in the MCC/lactose combination). A similar
relationship was observed for compression forces of 5 kN and 15 kN (data not shown). As
shown in Figure 17, tablet hardness increased with an increasing percentage of MCC in the
MCC/lactose combination at a given compression force.
April 2012 41
Example QbD IR Tablet Module 3 Quality 3.2.P.2 Pharmaceutical Development
Hardness @10 kN (kP)
Shapiro-Wilk Test
W-value = 00.914
p-value = 0.465
A: DS PSD (d90, μm)
B: Disintegrant (%)
C: % MCC in MCC/Lactose
Combination
Half-Normal%Probability
|Standardized Effect|
0.00 1.06 2.13 3.19 4.25
0
10
20
30
50
70
80
90
95
C
Error Estimates
Positive Effects
Negative Effects
Figure 16. Half -normal plot of the formulation variable effects on tablet hardness @ 10 kN
Hardness @10 kN (kP)
C: % MCC in MCC/Lactose
Combination
Actual Factors:
A: DS PSD (d90, μm) = 20
B: Disintegrant (%) = 3.0
Design Points
33.3 41.6 50.0 58.4 66.7
C: % MCC in MCC/Lactose Combination
Hardness@10kN(kP)
14.0
13.0
12.0
11.0
10.0
9.0
8.0
Figure 17. Effect of % MCC in the MCC/Lactose combination on tablet hardness @ 10 kN
Significant factors for tablet friability
All tablets compressed at 5 kN, 10 kN and 15 kN showed good friability (< 0.2% weight loss for
a tablet hardness range of 5.0-12.0 kP) and the three formulation variables in the ranges studied
did not show any statistically significant impact on tablet friability.
Significant factors for tablet stability (degradation products)
All experimental batches were placed in a stability chamber in an open container for three
months at 40 °C/75% RH, and samples were pulled and analyzed periodically. The degradation
April 2012 42
Example QbD IR Tablet Module 3 Quality 3.2.P.2 Pharmaceutical Development
product ACE 12345, individual unknown impurities and total impurities were well below the
specification limits of 0.5%, 0.2% and 1.0%, respectively. None of the formulation variables
showed a statistically significant impact on degradation products.
Summary of Formulation Development Study #1
Acetriptan PSD had a significant impact on tablet dissolution, content uniformity and powder
blend flowability. A smaller drug substance PSD enhanced dissolution; however, it negatively
impacted tablet content uniformity and blend flowability.
The intragranular disintegrant level showed a significant impact on tablet dissolution due to its
interaction with drug substance PSD. The disintegrant level had a greater impact on dissolution
when the drug substance PSD was larger.
The percentage of MCC in the MCC/Lactose combination had a significant impact on powder
blend flowability, tablet content uniformity and tablet hardness. Increasing the percentage of
MCC increased tablet hardness but decreased powder blend flowability and negatively impacted
tablet content uniformity as evidenced by the increasing % RSD. To balance blend flowability
and tablet hardness, 50% MCC in the MCC/Lactose combination (i.e., 1:1 ratio) was selected for
the tentatively finalized formulation.
Because no curvature effects were observed for any of the responses studied, and the main
effects and interaction effects were identified using a full factorial DOE with no aliased terms,
further studies to optimize the intragranular excipients were unnecessary. The DOE models were
used to establish acceptable ranges for formulation variables. Figure 18 shows the overlay plot of
all of the responses. The green zone indicates that all of the responses were achieved
simultaneously.
10 13 17 20 23 27 30
1.00
2.00
3.00
4.00
5.00
Overlay Plot
A: DS PSD (d90, μm)
B:Disintegrant(%)
a
b
A: DS PSD (d90, μm)
B: Disintegrant (%)
Actual Factor:
C: % MCC in MCC/Lactose
Combination = 50.0
a) Powder blend flowability (ffc): 6.00
b) Dissolution at 30 min (%): 80.0%
Green Zone: All responses met the predefined criteria.
Gray Zone: One or more responses failed to meet the predefined criteria.
Figure 18. Overlay plot – effect of acetriptan formulation variables on responses
April 2012 43
In order to accommodate the largest possible drug substance PSD and to avoid operating on the
edge of the green zone where dissolution failure is possible, 5% of croscarmellose sodium was
selected for the tentatively finalized formulation. With this selected disintegrant level, the
acceptable range for drug substance d90 is 14-30 μm. A d90 less than 14 μm showed unfavorable
flowability resulting in unacceptable tablet content uniformity when the fixed manufacturing
process was used during formulation development. Therefore, drug substance PSD was further
studied during pre-roller compaction blending and lubrication process development.
In order to understand the impact of drug substance PSD on in vivo performance and to identify
the upper particle size limit that was still likely to be bioequivalent, drug substance with a d90 of
20 μm, 30 μm and 45 μm (corresponding to d50 of 12 μm, 24 μm and 39 μm, respectively) was
studied in the pilot BE study (see Section 1.4).
At the conclusion of Formulation Development Study #1, the levels of intragranular excipients
were tentatively finalized as shown in Table 25. The extragranular glidant and lubricant were
further studied in Formulation Development Study #2.
Table 25. Tentative composition of Generic Acetriptan Tablets, 20 mg
Ingredient Function Composition
-- -- (mg/tablet) (% w/w)
Acetriptan Active 20.0 10.0
Intragranular Excipients
Lactose Monohydrate, NF Filler 79.0 39.5
Microcrystalline Cellulose (MCC), NF Filler 79.0 39.5
Croscarmellose Sodium (CCS), NF Disintegrant 10.0 5.0
Talc, NF Glidant/Lubricant 5.0 2.5
Extragranular Excipients
Magnesium Stearate, NF Lubricant 2.0 1.0*
Talc, NF Glidant/Lubricant 5.0 2.5*
Total Weight 200.0 100
Example QbD IR Tablet Module 3 Quality 3.2.P.2 Pharmaceutical Development
*Levels to be studied in Formulation Development Study #2
2.2.1.5 Formulation Development Study #2
Based on the results of Formulation Development Study #1, the intragranular excipients levels
were tentatively finalized. However, magnesium stearate was linked to adduct formation with
acetriptan during the binary excipient compatibility study (See Section 2.1.1.2). The goal of this
study was to find the minimum level of extragranular magnesium stearate needed for tabletting
and to evaluate if an increase in talc could compensate for a reduction in magnesium stearate.
The level of extragranular magnesium stearate used in Formulation Development Study #1 was
1.0%. The minimum level recommended in the Handbook of Pharmaceuticals is 0.25%.11
Thus,
the extragranular magnesium stearate level was studied between 0.3% and 0.9%. The talc level
was adjusted accordingly to maintain a total of 3.5% extragranular glidant and lubricant using a
two component mixture DOE.
Table 26 summarizes the mixture component levels and responses studied.
April 2012 44
Example QbD IR Tablet Module 3 Quality 3.2.P.2 Pharmaceutical Development
Table 26. Design of the two component mixture DOE to study extragranular magnesium stearate and talc
Extragranular Glidant and Lubricant
Levels
-1 0 +1
A Magnesium stearate (%) 0.3 0.6 0.9
B Talc (%) 3.2 2.9 2.6
Responses Goal Acceptable Ranges
Y1 Tablet appearance
Minimize visual
defects
Shiny appearance with smooth
surface, no side wall striation
Y2 Tablet tooling appearance
Minimize picking
and sticking
Shiny appearance with no evidence of
picking or sticking
Y3 Ejection force at 10 kN compression force (N) Minimize < 150 N
Y4 Tablet hardness @ 10 kN (kP) Maximize > 9.0 kP
Y5
Dissolution at 30 min (%)
(with target hardness of 12.0 kP)
Maximize ≥ 80%
Y6 Tablet content uniformity (% RSD) Minimize % RSD < 5%
A 5.0 kg batch of granules was manufactured using the roller compaction process parameters
listed in Table 20. The granules were made using the formulation shown in Table 25. The batch
of granules was then split into six sub-lots and different amounts of magnesium stearate and talc
were added according to the composition shown in Table 27. The final blend was compressed
into tablets using 10 kN of force. The experimental results for tablet appearance, tooling
appearance, tablet ejection force and hardness at a fixed compression force (10 kN) (Y1, Y2, Y3
and Y4, other responses not shown) are presented in Table 27.
Table 27. Experimental results of the two component mixture DOE
Batch
No.
Mixture Components Responses
Magnesium
stearate level
Extragranular
talc level
Tablet
appearance*
Tooling
appearance
Ejection
force
@10 kN
Tablet
hardness
@10 kN
(% w/w) (% w/w) -- -- (N) (kP)
12 0.3 3.2 Poor Visible indication of
sticking on punches and
binding in the die
431 12.4
13 0.3 3.2 Poor 448 12.2
14 0.9 2.6 Acceptable
Shiny appearance with
no evidence of picking
and sticking
91 11.2
15 0.6 2.9 Acceptable 114 12.0
16 0.6 2.9 Acceptable 130 11.6
17 0.9 2.6 Acceptable 100 11.3
*Poor: dull appearance, uneven tablet surface and side wall striation; Acceptable: shiny appearance with smooth
surface, no side wall striation
Tablet and tooling appearance
With 0.3% magnesium stearate, significant compression-related issues such as tablet picking,
sticking and side wall striation were observed. However, with 0.6% or higher magnesium
stearate, tablets were elegant in appearance and showed no evidence of sticking or binding to the
tablet tooling.
April 2012 45
Example QbD IR Tablet Module 3 Quality 3.2.P.2 Pharmaceutical Development
Ejection force
The ANOVA results provided in Table 28 indicate that the linear mixture components and
quadratic term (AB) were significant. Figure 19 shows the effect of the mixture components on
ejection force.
Table 28. ANOVA results of the quadratic mixture model
Source
Sum of
Squares
df
Mean
Square
F Value p-value Comments
Model 146563 2 73281.50 702.38 < 0.0001 Significant
Linear Mixture 118336 1 118336.00 1134.21 < 0.0001
Significant
AB 28227 1 28227.00 270.55 0.0005
Pure Error 313 3 104.33 -- -- --
Total 146876 5 -- -- -- --
Ejection force (N)
A: Magnesium stearate (%)
B: Talc (%)
0.3
3.2
0.5
3.1
0.6
2.9
0.8
2.8
0.9
2.6
Actual magnesium stearate (%)
Actual talc (%)
Ejectionforce(N)
0
100
200
300
400
500
Two Component Mixture
Design Points
Figure 19. Effect of extragranular magnesium stearate and talc levels on tablet ejection force
With 0.3% magnesium stearate, significantly higher ejection forces were observed. Ejection
force decreased with increasing magnesium stearate; however, the impact is negligible once the
level is between 0.6%-0.9%.
Tablet Hardness
Figure 20 illustrates the effect of the mixture components on tablet hardness. The tablet hardness
observed at a fixed compression force of 10 kN decreased with increasing magnesium stearate.
April 2012 46
Example QbD IR Tablet Module 3 Quality 3.2.P.2 Pharmaceutical Development
Hardness @ 10 kN (kP)
A: Magnesium stearate (%)
B: Talc (%)
0.3
3.2
0.5
3.1
0.6
2.9
0.8
2.8
0.9
2.6
Actual magnesium stearate (%)
Actual talc (%)
Hardness@10kN(kP)
11.0
11.5
12.0
12.5
13.0
Two Component Mixture
Design Points
Figure 20. Effect of extragranular magnesium stearate and talc on tablet hardness @ 10 kN
Dissolution and Content Uniformity
All tablets, even those with a hardness of 12.0 kP, exhibited acceptable dissolution (> 85% in 30
min). Content uniformity was not an issue as each batch had a % RSD less than 3%. Therefore,
magnesium stearate and talc did not show any significant impact on tablet dissolution and
content uniformity within the ranges studied.
Summary of Formulation Development Study #2
Based on the results of Formulation Development Study #2, the extragranular magnesium
stearate and talc levels were fixed to 0.6% and 2.9%, respectively.
2.2.1.6 Formulation Development Conclusions
The formulation composition was finalized based on Formulation Development Studies #1 and
#2. The MCC/Lactose ratio and the disintegrant level were finalized in the first study. In the
second study, it was concluded that a minimum level of magnesium stearate is required in the
formulation to prevent picking and sticking. The level of magnesium stearate in the formulation
was reduced by using it in combination with talc. The finalized formulation for Generic
Acetriptan Tablets, 20 mg, is presented in Table 29.
April 2012 47
Example QbD IR Tablet Module 3 Quality 3.2.P.2 Pharmaceutical Development
Table 29. Formulation selected for Generic Acetriptan Tablets, 20 mg12
Ingredient Function Composition
(mg/tablet) (% w/w)
Acetriptan Active 20.0 10.0
Intragranular Excipients
Lactose Monohydrate, NF Filler 79.0 39.5
Microcrystalline Cellulose (MCC), NF Filler 79.0 39.5
Croscarmellose Sodium (CCS), NF Disintegrant 10.0 5.0
Talc, NF Glidant/Lubricant 5.0 2.5
Extragranular Excipients
Magnesium Stearate, NF Lubricant 1.2 0.6
Talc, NF Glidant/Lubricant 5.8 2.9
Total Weight 200.0 100
2.2.1.7 Updated Risk Assessment of the Formulation Variables
Acceptable ranges for the high risk formulation variables have been established and are included
in the control strategy. Based on the results of the formulation development studies, the risk
assessment of the formulation variables was updated as given in Table 30 with justifications
provided in Table 31.
Table 30. Updated risk assessment of the formulation variables
Drug Product
CQAs
Formulation Attributes
Drug Substance
PSD
MCC/Lactose
Ratio
CCS
Level
Magnesium
Stearate Level
Assay Low Low* Low* Low*
Content Uniformity Low Low Low* Low*
Dissolution Low Low Low Low
Degradation Products Low* Low* Low* Low
*The level of risk was not reduced from the initial risk assessment.
Table 31. Justification for the reduced risks of the formulation variables
Formulation
Variables
Drug Product CQAs Justification
Drug Substance
PSD
Assay
All tablets showed acceptable assay. The risk is reduced
from medium to low.
Content Uniformity
The poor flow of the drug substance is mitigated by using a
roller compaction process, low drug load and fillers that
have good flowability. The risk is reduced from high to low.
Dissolution
The risk is reduced from high to low by controlling drug
substance PSD and optimizing intragranular
superdisintegrant.
12
All the excipients are present in the RLD.
April 2012 48
Example QbD IR Tablet Module 3 Quality 3.2.P.2 Pharmaceutical Development
Formulation
Variables
Drug Product CQAs Justification
MCC/Lactose
Ratio
Content Uniformity
The risk is reduced from high to low by optimizing the
MCC/Lactose ratio and using a roller compaction process.
Dissolution
The risk is reduced from medium to low because the
selected filler ratio yielded tablets with acceptable friability
within a wide range of tablet hardness (5.0-12.0 kP). Tablets
with hardness within this range demonstrated acceptable
dissolution (> 85% in 30 min).
CCS Level Dissolution
All tablets showed rapid disintegration. The risk is reduced
from high to low.
Magnesium
Stearate Level
Dissolution
The risk is reduced from high to low by optimizing
extragranular magnesium stearate.
Degradation Products
The risk is reduced from medium to low by only using
magnesium stearate extragranularly and by using talc to
minimize the level of magnesium stearate needed. The
stability data further demonstrated that the product was
stable.
2.2.2 Overages
There are no overages used in the formulation of Generic Acetriptan Tablets, 20 mg.
2.2.3 Physicochemical and Biological Properties
Refer to Section 1.4 for a discussion of the dissolution method development and the results of the
pilot bioequivalence study.
2.3 Manufacturing Process Development
Note to Reader: There are various approaches to process development used in the generic
pharmaceutical industry. This is one of many possible examples. All QbD approaches to process
development should identify the critical material attributes (CMAs) and critical process
parameters (CPPs) for each process step. A firm may choose to do this through reference to
documented prior knowledge or through empirical experiments on a range of process scales
building toward the exhibit scale and proposed commercial scale. The process development of
pre-roller compaction blending and lubrication is an example of experimentally determining
CPPs when there is variation in an input material attribute. QbD emphasizes building
understanding to avert failures during scale-up. The multivariate experiments described here are
a step toward defining acceptable ranges for CPPs and CMAs.
Steps to establish process understanding are as follows:
 Identify all possible known material attributes and process parameters that could impact
the performance of the process.
April 2012 49
Example QbD IR Tablet Module 3 Quality 3.2.P.2 Pharmaceutical Development
April 2012 50
 Use risk assessment and scientific knowledge to identify potentially high risk attributes
and/or parameters.
 Identify levels or ranges of these potentially high risk attributes and/or parameters.
 Design and conduct experiments, using DOE when appropriate.
 Analyze the experimental data to determine if a material attribute or process parameter
is critical.
- A material attribute or process parameter is critical when a realistic change in
that attribute or parameter can significantly impact the quality of the output
material.
 Develop a control strategy.
As discussed in Section 2.2.1.3 Process Selection, roller compaction was chosen as an
appropriate granulation method to avoid drug product degradation and the equipment train was
selected. Figure 21 presents the process map for the finalized formulation of Generic Acetriptan
Tablets, 20 mg. Each process step in the manufacturing process is listed in the sequence of
occurrence. It also presents the material attributes and process parameters that can potentially
impact intermediate and finished product quality attributes. The material attributes of the input
materials and the process parameters used at the very first process step determine the quality
attributes of the output material (intermediate) produced at this step. Material attributes of the
intermediate from this step and process parameters of the subsequent process step in the
manufacturing process will determine quality attributes of the next intermediate and, eventually,
those of the finished drug product. This cycle repeats until the final process step where finished
drug product is manufactured and the product quality attributes are evaluated. This map was used
to guide the risk assessments performed during process development.
Manufacturing process development studies were conducted at the 5.0 kg lab scale,
corresponding to 25,000 units.
Example QbD IR Tablet Module 3 Quality 3.2.P.2 Pharmaceutical Development
Blend assay
Blend uniformity
Blend bulk density
Blend flowability
Blend compressibility / compactability
Blend uniformity
Blend assay
Blend bulk density
Blend flowability
Blend compressibility / compactability
Appearance
Dimensions (length, width, thickness)
Weight (individual and composite)
Hardness
Friability
Content uniformity
Assay
Disintegration
Dissolution
Blender type
Order of addition
Blender fill level
Rotation speed (if variable)
Number of revolutions
Intensifier bar (on / off)
Holding time
Discharge method
Drum-to-hopper transfer
Environment (temperature and RH)
Blender type
Order of addition
Blender fill level
Rotation speed (if variable)
Number of revolutions
Intensifier bar (on / off)
Holding time
Discharge method
Drum-to-hopper transfer
Environment (temperature and RH)
Press type and number of stations
Tooling design
Feed frame paddle speed
Feeder fill depth
Pre-compression force
Main compression force
Press speed (dwell time)
Hopper design
Hopper fill level
Drop height of finished tablets
Run time
Environment (temperature and RH)
Manufacturing
Process Steps
Process Parameters
Quality Attributes
Of Output Materials
Material Attributes
Of Input Materials
Pre-Roller Compaction
Blending and Lubrication
Acetriptan PSD
Acetriptan cohesiveness
Acetriptan flowability
Excipient PSD
Excipient flowability
Excipient bulk density
Excipient moisture content
Excipient lot-to-lot variability
Final Blending and Lubrication
Granule uniformity
Granule size distribution
Granule flowability
Granule bulk density
Assay of granule sieve cut
Magnesium stearate specific surface area
Blend assay
Blend uniformity
Granule size distribution
Blend bulk density
Blend flowability
Blend compressibility / compactability
Ribbon thickness
Ribbon density
Granule uniformity
Granule size distribution
Granule flowability
Granule bulk density
Assay of granule sieve cut
Blend holding time prior to RC
Roller compactor type
Feed screw speed
Deaeration
Roller surface design
Roller pressure
Roller speed
Roller gap
Environment (temperature and RH)
Roller Compaction
Blend assay
Blend uniformity
Blend bulk density
Blend flowability
Blend compressibility / compactability
Compression (Tabletting)
Milling
Mill type
Blade configuration / type / orientation
Oscillation degree / speed
Screen type
Screen size
Number of recycles
Environment (temperature and RH)
Ribbon thickness
Ribbon density
Figure 21. Process map for Generic Acetriptan Tablets, 20 mg
April 2012 51
Example QbD IR Tablet Module 3 Quality 3.2.P.2 Pharmaceutical Development
2.3.1 Initial Risk Assessment of the Drug Product Manufacturing Process
A risk assessment of the overall drug product manufacturing process was performed to
identify the high risk steps that may affect the CQAs of the final drug product.
Subsequently, the intermediate CQAs of the output material from each process step that
impact the final drug product CQAs were identified. For each process step, a risk
assessment was conducted to identify potentially high risk process variables which could
impact the identified intermediate CQAs and, ultimately, the drug product CQAs. These
variables were then investigated in order to better understand the manufacturing process
and to develop a control strategy to reduce the risk of a failed batch. This method of
identifying process variables for further study is illustrated in Figure 22 and is applied in
each process step risk assessment.
Identify material
attributes and process
parameters that may
impact the intermediate
CQAs of the process step
For each process step,
identify intermediate
CQAs that impact drug
product CQAs
Identify drug
product CQAs
Step 1: Step 2: Step 3:
Identify material
attributes and process
parameters that may
impact the intermediate
CQAs of the process step
For each process step,
identify intermediate
CQAs that impact drug
product CQAs
Identify drug
product CQAs
Step 1: Step 2: Step 3:
Figure 22. Schematic of the method used to identify process variables for further study
The initial risk assessment of the overall manufacturing process is shown in Table 32 and
justifications are provided in Table 33. Previous experience with these process steps was
used to determine the degree of risk associated with each process step and its potential to
impact the CQAs of the finished drug product.
Table 32. Initial risk assessment of the manufacturing process for Generic Acetriptan Tablets, 20 mg
Drug Product
CQAs
Process Steps
Pre-RC* Blending
and Lubrication
Roller
Compaction
Milling
Final Blending
and Lubrication
Compression
Assay Medium Low Medium Low Medium
Content Uniformity High High High Low High
Dissolution Medium High Medium High High
Degradation Products Low Low Low Low Low
*RC: roller compaction
April 2012 52
Example QbD IR Tablet Module 3 Quality 3.2.P.2 Pharmaceutical Development
Table 33. Justification for the initial risk assessment of the manufacturing process for Generic Acetriptan Tablets, 20 mg
Process Steps Drug Product CQAs Justification
Pre-Roller Compaction
Blending and Lubrication
Assay
Suboptimal pre-roller compaction blending and lubrication
may cause variable flowability of the blend. The risk is
medium.
Content Uniformity
The PSD and cohesiveness of the drug substance
adversely impact its flowability which, in turn, affects CU.
The risk is high.
Dissolution
Blending process variables may impact the distribution of
CCS in the blend which could impact disintegration of the
granules and, ultimately, dissolution of the tablets. The
risk is medium.
Degradation Products
Blending process variables are unrelated to the
degradation products of Generic Acetriptan Tablets, 20
mg. The risk is low.
Roller Compaction
Assay
Roller compaction is performed to improve flow,
minimize segregation and enhance CU. The risk is low.
Content Uniformity
Variability in ribbon density during processing can
potentially impact the PSD of the milled granules, thus
impacting flowability and, ultimately, CU. The risk is
high.
Dissolution
Density of the ribbon can impact density and plasticity of
the granules, thus impacting compressibility of the
granules, hardness of the tablet and, ultimately,
dissolution. The risk is high.
Degradation Products
Based on experience gained from other approved ANDAs
using roller compaction, the roller temperature does not
exceed 45 °C and the dwell time during roller compaction
is very short. Thus, roller compaction should not impact
degradation products. The risk is low.
Milling
Assay
The milling step controls the final granule size
distribution. A suboptimal distribution may affect flow,
causing variable tablet weight and assay during
compression. The risk is medium.
Content Uniformity
If milling generates excessive fines, both bulk density and
flowability of the blend may be impacted. This, in turn,
may impact CU. The risk is high.
Dissolution
A large amount of fines may impact tablet hardness and
dissolution. The risk is medium.
Degradation Products
Although the screen may heat up during the milling
process, the dwell time is brief. Milling is unlikely to
impact degradation products. The risk is low.
April 2012 53
Example QbD IR Tablet Module 3 Quality 3.2.P.2 Pharmaceutical Development
Process Steps Drug Product CQAs Justification
Final Blending and Lubrication
Assay
The granule uniformity which affects assay and CU is
controlled by earlier steps (pre-RC blending and
lubrication as well as roller compaction and integrated
milling). This step is to blend the granules with small
quantities of extragranular glidant and lubricant and is
unlikely to impact assay and CU. The risk is low.
Content Uniformity
Dissolution
Over-lubrication due to an excessive number of
revolutions may impact disintegration and, ultimately,
dissolution of the tablets. The risk is high.
Degradation Products
Acetriptan is only susceptible to degradation at a high
temperature (≥ 105 °C). Blending is unlikely to impact
degradation products; therefore, the risk is low.
Compression
Assay
In extreme cases, tablet weight variability can lead to t-ou
of-specification assay results. The risk is medium.
Content Uniformity
Compression process variables such as feed frame paddle
speed and press speed can cause tablet weight variability
which could cause tablets to fall out-of-specification for
CU. The risk is high.
Dissolution
Tablet hardness may be impacted if compression force is
not adjusted to accommodate batch-to-batch variability in
ribbon density. Over-lubrication of the blend by the feed
frame paddle may also slow dissolution. The risk is high.
Degradation Products
Acetriptan is only susceptible to degradation at a high
temperature (≥ 105 °C). Compression is unlikely to impact
degradation products; therefore, the risk is low.
Further risk assessment was performed subsequently on each high risk process step to
identify which process variables may potentially impact the intermediate CQAs.
Evaluation of all possible process variables that could potentially impact the quality
attributes of the output material of any given process step is not feasible; therefore, some
of the variables were set constant based on current understanding.
2.3.2 Pre-Roller Compaction Blending and Lubrication Process Development
Initial Risk Assessment of the Pre-Roller Compaction Blending and Lubrication Process Variables
The initial risk assessment of the overall manufacturing process presented in Table 32
identified the risk of the pre-roller compaction blending and lubrication step to impact
tablet content uniformity as high. Subsequently, blend uniformity was identified as an
intermediate CQA of the powder blend from the pre-roller compaction blending and
lubrication step. Process variables that could potentially impact blend uniformity were
identified and their associated risk was evaluated. Table 34 presents the initial risk
assessment for the pre-roller compaction blending and lubrication step.
April 2012 54
Example QbD IR Tablet Module 3 Quality 3.2.P.2 Pharmaceutical Development
Table 34. Initial risk assessment of the pre-roller compaction blending and lubrication process variables
Process Step: Pre-Roller Compaction Blending and Lubrication
Output Material CQA: Blend Uniformity
Variables Risk Assessment Justification and Initial Strategy
Input Material Attributes
Acetriptan PSD High
The pilot BE study indicated that a d90 ≤ 30 μm is
needed for bioequivalence. Based on several lots
of acetriptan analyzed during preformulation, the
drug substance meeting this d90 criterion has poor
flowability (ffc < 3.50) which may impact BU.
The risk is high.
Acetriptan cohesiveness Medium
The specific energy of acetriptan Lot #1-4
indicated that acetriptan is moderately to highly
cohesive which will make achieving BU more
challenging. The risk is medium.
Acetriptan flowability Medium
The ffc value of acetriptan Lot #1-4 suggested
poor flow which could impact BU. The risk is
medium.
Excipient flowability Low
Filler comprises the majority (~ 80%) of the
formulation. MCC grade B02 and lactose
monohydrate grade A01 are used in a 1:1 ratio
because this ratio demonstrated good flowability
(ffc ≈ 7). Glidant and lubricant are used in small
quantities and are unlikely to impact BU. The risk
is low.
Excipient PSD Low
Experience with previously approved ANDA
123456 and ANDA 456123 demonstrated that
when the selected grades of MCC and lactose
monohydrate are used in a 1:1 ratio, the
flowability is good. This suggests that the PSD of
the fillers will not impact BU. Because the
quantities of glidant and lubricant used are small,
their PSD are unlikely to impact BU. The risk is
low.
Excipient bulk density Low
The 1:1 ratio of MCC to lactose monohydrate has
a comparable bulk density to acetriptan. Glidant
and lubricant are used in small quantities and their
bulk densities are unlikely to impact BU. The risk
is low.
Excipient moisture content Low
The moisture content of the excipients is
controlled per compendial/in-house
specifications. Based on previous experience with
approved ANDA 123456, excipient moisture
content did not exhibit any significant impact on
BU. The risk is low.
Excipient lot-to-lot variability Low
Large variations in the PSD of the excipients
could impact BU; however, previous experience
with the chosen excipient grades has shown that
the lot-to-lot variability within grade is minimal.
The risk is low.
April 2012 55
Example QbD IR Tablet Module 3 Quality 3.2.P.2 Pharmaceutical Development
Process Step: Pre-Roller Compaction Blending and Lubrication
Output Material CQA: Blend Uniformity
Variables Risk Assessment Justification and Initial Strategy
Blending Variables
Blender type Low
Different blender types have different mixing
dynamics. V-blender is selected based on
equipment availability. The risk is low.
However, if the blender type is changed during
scale-up or commercialization, the risk should be
re-evaluated.
Order of addition Low
Order of addition may impact the ease of evenly
dispersing ingredients charged in lower quantities.
Materials are added in the following order:
lactose monohydrate, CCS, acetriptan, talc, and
MCC. The risk is low.
Rotation speed (rpm) Medium
Rotation speed is often fixed by equipment
constraint. Different size blenders have different
rotation speeds. The rotation speed for the 16 qt
blender is fixed at 20 rpm. The risk is medium.
Number of revolutions High
Under- or over-blending will result in suboptimal
BU. The risk is high.
Intensifier bar (on/off) Low
The intensifier bar is often not needed to improve
BU. In addition, the intensifier bar may interfere
with BU measurements if an NIR probe is used.
The intensifier bar is fixed in the off position. The
risk is low.
Blender fill level High
The blender fill level depends on equipment
capacity, blend bulk density (0.43-0.48 g/cc) and
batch size. Since the blender fill level may affect
mixing dynamics, the risk is high.
Holding time Medium Even if adequate BU is achieved, the drug
substance may segregate prior to granulation
during holding, discharge or transfer. The risk is
medium.
Blender discharge Medium
Drum-to-hopper transfer Medium
Environment
(temperature and RH)
Low
If not controlled, fluctuations in the facility
temperature and RH could impact BU. Routine
environment temperature and RH set point in the
cGMP manufacturing facility is fixed at 25 ºC ±
5% and 40%-60% RH, respectively, and will be
monitored during manufacturing. The risk is low.
Effect of Acetriptan PSD and Number of Revolutions on Blend Uniformity
Due to its low solubility, acetriptan is milled to improve its bioavailability. The milled
drug substance has poor flow characteristics and is cohesive. Thus, roller compaction is
performed prior to compression to achieve tablet content uniformity. The success of
roller compaction to produce uniform granules is largely contingent on the uniformity of
the blend achieved during the preceding blending and lubrication step.
The pilot PK study suggested that Generic Acetriptan Tablets, 20 mg, with a drug
substance d90 of 30 μm (d50 of 24 μm) or less would be bioequivalent to the RLD. During
April 2012 56
Example QbD IR Tablet Module 3 Quality 3.2.P.2 Pharmaceutical Development
formulation development, a PSD with a d90 less than 14 μm led to flow and content
uniformity issues. However, the blending process was fixed at that stage of development.
Thus, it was important to determine if an optimized blending process could accommodate
different acetriptan PSD without adversely impacting blend uniformity. A two-factor,
three-level full factorial DOE, as shown in Table 35, was used to investigate the impact
of acetriptan PSD (d90) and number of revolutions (Nrev) on blend uniformity. Blender fill
level is also likely to impact blend uniformity based on the initial risk assessment, but this
process parameter was evaluated subsequent to the DOE. The optimized formulation
shown in Section 2.2.1.6 Table 29 was used for this study.
Table 35. Design of the 32
study to investigate pre-RC blending and lubrication process variables
Factors: Process Variables
Levels
0 1 2
A Number of revolutions (Nrev) 100 200 300
B Acetriptan d90 (μm) 10 20 30
Responses Goal Acceptable Ranges
Y1 Blend Assay (% w/w) Achieve 100% w/w Assay mean of all locations: 95.0-105.0% w/w
Y2 Blend Uniformity (% RSD) Minimize % RSD % RSD of all locations: ≤ 5%
Each 5.0 kg batch was blended in a 16 qt blender operated at 20 rpm. To measure blend
uniformity, sampling was performed at the 10 blender locations designated in Figure 23
at the end of the specified number of revolutions. The sample thief was calibrated such
that the collected sample volume represented one to three unit doses of blend (200.0-
600.0 mg).
FE
I
J
A B
H
G
D
C
FE
I
J
A B
H
G
H
G
D
C
D
C
A = Left-Left-Top (left arm)
B = Left-Right-Top (left arm)
C = Left-Front-Middle (left arm)
D = Left-Rear-Middle (left arm)
E = Right-Right-Top (right arm)
F = Right-Left-Top (right arm)
G = Right-Front-Middle (right arm)
H = Right-Rear-Middle (right arm)
I = Center-Middle
J = Discharge Port
Figure 23. Sampling locations in the V-Blender
The blend uniformity results are presented in Table 36.
April 2012 57
Example QbD IR Tablet Module 3 Quality 3.2.P.2 Pharmaceutical Development
Table 36. Results of the pre-RC blending and lubrication optimization study
Batch
No.
Factors: Process Variables Response
A:
Nrev
B:
Acetriptan d90
Y2:
BU
-- (μm) (% RSD)
21 100 10 8.9
22 100 30 5.4
23 300 20 2.5
24 100 20 6.8
25 200 20 3.0
26 300 10 3.2
27 300 30 2.3
28 200 30 2.8
29 200 10 4.3
Based on the sum of squares of sequential models (i.e., linear, two factor interaction,
quadratic and cubic), the highest order polynomial model was selected where the additional
terms were significant and the model was not aliased. The model terms were further reduced
based on the significance level (α = 0.05) using the backward model selection method.
Significant factors for blend uniformity
The effect of A (Nrev) and B (drug substance PSD) on blend uniformity was best
described by a quadratic model where the significant factors were A, B, AB interaction
and A2
. The interaction plot below (Figure 24) shows that the blend uniformity response
depended on the settings of the two factors. At a lower number of revolutions, the
acetriptan PSD had a greater impact on blend uniformity than at a higher number of
revolutions. At 100 revolutions, each of the three acetriptan PSD investigated failed to
meet the predefined criterion of less than 5% RSD.
April 2012 58
Example QbD IR Tablet Module 3 Quality 3.2.P.2 Pharmaceutical Development
Design Points
B- 10
Blend Uniformity (% RSD)
A: Number of revolutions (Nrev)
B: DS PSD (d90, μm)
B+ 30
B: DS PSD (d90, μm)
100 150 200 250 300
A: Number of revolutions (Nrev)
BlendUniformity(%RSD)
Interaction
10.0
8.0
6.0
4.0
2.0
0.0
Figure 24. Effect of number of revolutions and drug substance PSD on blend uniformity
Significant factors for blend assay
Neither the number of revolutions nor the drug substance PSD had a significant impact
on mean blend assay. Results were close to the target for each run and ranged from
98.7%-101.2% overall.
Development of In-line NIR for Blending Endpoint Determination
Note to Reader: NIR method development and validation is beyond the scope of the
pharmaceutical development report and the details are not discussed in this example. The
validation report should be included in Section 3.2.P.5.3 Validation of Analytical
Procedures.
In order to ensure a homogeneous blend for any input acetriptan drug substance d90
within the range of 10-30 μm, an in-line NIR spectrophotometric method was developed
and validated. This technology allows a real-time response and can be used at the
laboratory, pilot and commercial scale. During validation, blend uniformity data collected
at various time points by the NIR method was compared to that obtained by traditional
thief sampling followed by offline HPLC analysis and was found to be comparable.
Additionally, validation showed that blends deemed homogeneous by the NIR method
ultimately produced tablets with acceptable content uniformity (% RSD < 5%). Based on
these findings, the NIR method is capable of accurately assessing the real-time
homogeneity of the blend and can be used to control the endpoint of the blending process.
Further information regarding the NIR method development and validation can be found
in Section 3.2.P.5.3 Validation of Analytical Procedures.
Three 5.0 kg batches (Batch Nos. 30-32) were manufactured using acetriptan with a d90
of 10 μm, 20 μm, and 30 μm, respectively. During blending, one spectrum was acquired
April 2012 59
Example QbD IR Tablet Module 3 Quality 3.2.P.2 Pharmaceutical Development
non-invasively through the sight glass of the V-blender for each revolution as the V-
blender was in the inverted position. The NIR spectra were preprocessed to minimize the
effects of particle size and path length and to resolve the acetriptan peak. To assess the
homogeneity of the blend, % RSD was calculated for each moving block of ten
consecutive spectra and plotted as a function of number of revolutions. The blend was
considered homogeneous once the % RSD was below 5% for ten consecutive
measurements. This criterion ensured that brief excursions below the 5% threshold did
not result in blending termination.
For an acetriptan d90 of 10 μm, 20 μm and 30 μm, the blending endpoint determined by
NIR as shown in Figure 25 was 368 revolutions, 285 revolutions and 234 revolutions,
respectively. The blending uniformity showed rapid initial change through macro
(convection) mixing followed by slower micro (diffusion) mixing.
0
5
10
15
20
0 100 200 300 400 500
Number of revolutions (Nrev)
RSDofMovingBlock(%)
acetriptan d90 30 μm
acetriptan d90 20 μm
acetriptan d90 10 μm
Figure 25. Blending endpoint determined by in-line NIR for acetriptan d90 of 10 μm, 20 μm and 30 μm
A fourth 5.0 kg batch (Batch No. 33) was manufactured using acetriptan with a d90 of 20
μm. The validated NIR method was used to determine the blending endpoint, but
feedback control was not used to terminate the process. Blending was continued for a
total of 500 revolutions to look for evidence of demixing. Figure 26 indicates that
demixing did not occur as the % RSD did not increase when the batch was blended
beyond the NIR-determined endpoint for a total of 500 revolutions.
April 2012 60
Example QbD IR Tablet Module 3 Quality 3.2.P.2 Pharmaceutical Development
0
5
10
15
20
0 100 200 300 400 500
Number of revolutions (Nrev)
RSDofMovingBlock(%)
acetriptan d90 20 μm
Figure 26. % RSD of the moving block of the NIR spectra for acetriptan d90 of 20 μm blended for 500 revolutions
Effect of Blender Fill Level on Blend Uniformity
Another study was performed to evaluate the impact of blender fill level on blend
uniformity using acetriptan Lot #2 with a d90 of 20 μm. Each blend (Batch Nos. 34-36)
was mixed in a 16 qt V-blender at 20 rpm and monitored using an NIR probe. Blend
uniformity was achieved at approximately 280-290 revolutions for all three fill levels,
35%, 55% and 75%, indicating that blender fill level does not have a significant impact
on the blending endpoint within the range of fill levels studied.
Summary of Pre-Roller Compaction Blending and Lubrication Process Development
Based on the results of the pre-roller compaction blending and lubrication studies, an in-
line NIR method will be used to determine the blending endpoint. The number of
revolutions needed to achieve blend uniformity differed depending on the acetriptan d90
in the range of 10-30 μm. Within the range of 35-75%, the blender fill level did not
adversely impact blend uniformity.
UpdatedRiskAssessmentofthePre-RollerCompactionBlendingandLubricationProcessVariables
Table 37 presents the risk reduction for the pre-roller compaction blending and
lubrication process as a result of the development studies. Only the process variables that
were initially identified as high risk to the blend uniformity are shown.
April 2012 61
Example QbD IR Tablet Module 3 Quality 3.2.P.2 Pharmaceutical Development
Table 37. Updated risk assessment of the pre-roller compaction blending and lubrication process variables
Process Step: Pre-Roller Compaction Blending and Lubrication
Output Material CQA: Blend Uniformity
Variables Risk Assessment Justification for the Reduced Risk
Acetriptan PSD Low In order for the blending process to be robust
enough to accommodate different acetriptan PSD,
an in-line NIR method was developed for
blending endpoint determination. Blender fill
levels from 35-75% had no impact on blending
endpoint. The risk was reduced from high to low.
Number of revolutions Low
Blender fill level Low
2.3.3 Roller Compaction and Integrated Milling Process Development
Initial Risk Assessment of the Roller Compaction and Integrated Milling Process Variables
Based on the initial risk assessment of the overall manufacturing process shown in Table
32, the risk of the roller compaction step to impact tablet content uniformity and
dissolution was identified as high and the risk of the milling step to impact tablet content
uniformity was identified as high. Due to equipment availability, an Alexanderwerk10
WP120 roller compactor with integrated milling was used for this study. Therefore, these
two steps were studied together. Subsequently, ribbon density, granule size distribution,
granule uniformity and granule flowability were identified as the intermediate CQAs of
the output material from the roller compaction and integrated milling step. Ribbon
density is an intermediate CQA because it has a direct impact on granule particle size
distribution, granule bulk and tapped density, granule flowability, and, ultimately, tablet
hardness and dissolution. Granule size distribution, granule uniformity and granule
flowability are intermediate CQAs because they are intimately related to tablet weight
variability and content uniformity. The input material attributes and process parameters
for this step that could potentially impact the four intermediate CQAs of the output
material were identified and their associated risk was evaluated. The result of the initial
risk assessment is summarized in Table 38.
Table 38. Initial risk assessment of roller compaction and integrated milling process variables
Process Step: Roller Compaction and Integrated Milling
Output Material CQAs: Ribbon Density, Granule Size Distribution, Granule Uniformity and Granule
Flowability
Variables Output Material CQAs
Risk
Assessment
Justification and Initial Strategy
Input Material Attributes
Blend bulk
density
Ribbon Density Low The formulation has been optimized (Section
P.2.2). Consistent blend bulk density between
0.43-0.48 g/cc was observed. This low
variability of blend bulk density has a negligible
impact on the four CQAs. The risk is low.
Granule Size Distribution Low
Granule Uniformity Low
Granule Flowability Low
Blend assay
Ribbon Density Low
The assay of the final blend was consistently
within 95.0-105.0% w/w (ranging from 98.7-
101.2%). The risk is low.
Granule Size Distribution Low
Granule Uniformity Low
Granule Flowability Low
April 2012 62
Example QbD IR Tablet Module 3 Quality 3.2.P.2 Pharmaceutical Development
Process Step: Roller Compaction and Integrated Milling
Output Material CQAs: Ribbon Density, Granule Size Distribution, Granule Uniformity and Granule
Flowability
Variables Output Material CQAs
Risk
Assessment
Justification and Initial Strategy
Blend uniformity
Ribbon Density Low
In-line NIR monitoring is used to achieve
adequate blend uniformity (RSD < 5%). The
risk is low.
Granule Size Distribution Low
Granule Uniformity Low
Granule Flowability Low
Blend
compressibility/
compactability
Ribbon Density Low Compressibility and compactability were
optimized during formulation development. The
tablet demonstrated good friability (< 0.2%
weight loss) at low hardness (5.0 kP) and
achieved the desired dissolution at high
hardness (12.0 kP). The risk is low.
Granule Size Distribution Low
Granule Uniformity Low
Granule Flowability Low
Blend flowability
Ribbon Density Low
The blend demonstrated acceptable flowability
(ffc > 6). The risk is low.
Granule Size Distribution Low
Granule Uniformity Low
Granule Flowability Low
Roller Compaction and Milling Process Variables
Pre-RC blend
holding time
Ribbon Density Low Due to the cohesiveness of acetriptan, no
demixing was observed with extended blending
up to 500 revolutions. The risk of the pre-RC
blend to segregate during holding is low.
Granule Size Distribution Low
Granule Uniformity Low
Granule Flowability Low
Roller compactor
type
Ribbon Density Low
Due to operating principle differences between
roller compactors, the ribbon attributes and PSD
of milled granules can vary significantly. Based
on availability, Alexanderwerk WP 120 is
selected and fixed for development work. The
risk is low.
However, if the roller compactor type is
changed during scale-up or commercialization,
the risk should be re-evaluated.
Granule Size Distribution Low
Granule Uniformity Low
Granule Flowability Low
Deaeration
Ribbon Density Low Deaeration is used to enhance the flow of the
blend feeding into the roller compactor. It will
always be used and is considered a fixed factor.
The risk is low.
Granule Size Distribution Low
Granule Uniformity Low
Granule Flowability Low
Feed screw speed
Ribbon Density Medium
Feed screw speed is a floating parameter
dependent on roller pressure and roller gap. The
risk is medium.
Granule Size Distribution Medium
Granule Uniformity Medium
Granule Flowability Medium
Roller surface
design
Ribbon Density Low Roller surface design may impact the power
feeding from the slip region into the nip region.
For this product, a roller with a knurled surface
was selected to enhance material feeding by
providing more friction than a smooth surface
roller and is considered a fixed factor. The risk
is low.
Granule Size Distribution Low
Granule Uniformity Low
Granule Flowability Low
April 2012 63
Example QbD IR Tablet Module 3 Quality 3.2.P.2 Pharmaceutical Development
Process Step: Roller Compaction and Integrated Milling
Output Material CQAs: Ribbon Density, Granule Size Distribution, Granule Uniformity and Granule
Flowability
Variables Output Material CQAs
Risk
Assessment
Justification and Initial Strategy
Roller pressure
Ribbon Density High
Ribbon density is directly related to roller
pressure and, in turn, may impact the PSD,
flowability, uniformity, compressibility and
compactability of the milled granules. The risk
is high.
Granule Size Distribution High
Granule Uniformity High
Granule Flowability High
Roller speed
Ribbon Density Medium
The roller speed determines the throughput of
the process and is adjusted according to the
selected feed screw speed to avoid material
build-up. In addition, roller speed is inversely
related to the dwell time for particle compaction
which may impact the ribbon density. Based on
previous experience with approved ANDA
123456 using roller compaction, roller speed is
fixed to 8 rpm. Adjustment may be needed. The
risk is medium.
Granule Size Distribution Medium
Granule Uniformity Medium
Granule Flowability Medium
Roller gap
Ribbon Density High
According to the Johanson model13
, ribbon
density is inversely related to the roller gap and,
in turn, it may impact PSD, flowability,
uniformity, compressibility and compactability
of the milled granules. The risk is high.
Granule Size Distribution High
Granule Uniformity High
Granule Flowability High
Mill type
Ribbon Density N/A
The ribbon is formed during the roller
compaction step.
Granule Size Distribution Low
The type of mill governs the type of attrition and
impacts the PSD of the milled granules. An
integrated mill was selected and is considered a
fixed factor. The risk is low.
However, if the mill type is changed during
scale-up or commercialization, the risk should
be re-evaluated.
Granule Uniformity Low
Granule Flowability Low
Mill screen type
Ribbon Density N/A
The ribbon is formed during the roller
compaction step.
Granule Size Distribution Low
The mill screen type may impact the granule
size distribution, granule uniformity and granule
flowability obtained from the milling step. A
mesh screen is selected based on availability.
The risk is low.
If the mill screen type is changed, risk will need
to be reassessed.
Granule Uniformity Low
Granule Flowability Low
April 2012 64
13
Johanson, J. R. A rolling theory for granular solids. ASME, Journal of Applied Mechanics Series E,
1965, 32(4): 842–848.
Example QbD IR Tablet Module 3 Quality 3.2.P.2 Pharmaceutical Development
Process Step: Roller Compaction and Integrated Milling
Output Material CQAs: Ribbon Density, Granule Size Distribution, Granule Uniformity and Granule
Flowability
Variables Output Material CQAs
Risk
Assessment
Justification and Initial Strategy
Mill speed
Ribbon Density N/A
The ribbon is formed during the roller
compaction step.
Granule Size Distribution High The mill speed may impact the PSD of the
milled granules which can potentially impact
granule uniformity and flowability. The risk is
high.
Granule Uniformity High
Granule Flowability High
Blade
configuration
Ribbon Density N/A
The ribbon is formed during the roller
compaction step.
Granule Size Distribution Low
The milling blade can apply variable shear to
the material based on design. Low shear can
result in a coarser but more uniform PSD,
whereas high shear can result in a non-uniform,
multi-modal PSD. The resulting PSD affects
flowability and uniformity. The risk is low
because the blade is fixed by equipment design.
Granule Uniformity Low
Granule Flowability Low
Mill screen orifice
size
Ribbon Density N/A
The ribbon is formed during the roller
compaction step.
Granule Size Distribution High
The mill screen orifice size directly impacts
PSD which can potentially impact granule
uniformity and flowability. The risk is high.
Granule Uniformity High
Granule Flowability High
Number of
recycles
Ribbon Density Medium If excessive powder leakage occurs during roller
compaction or excessive fines are generated
during milling, recycles of the fine particles may
be considered. However, the number of recycles
may impact the homogeneity of the granule
quality attributes. The goal is to not recycle
material. The risk is medium.
Granule Size Distribution Medium
Granule Uniformity Medium
Granule Flowability Medium
Environment
(temperature and
RH)
Ribbon Density Low If not controlled, fluctuations in the facility
temperature and RH could impact the CQAs.
Routine environment temperature and RH set
point in the cGMP manufacturing facility is
fixed at 25 ºC ± 5% and 40%-60% RH,
respectively, and will be monitored during
manufacturing. The risk is low.
Granule Size Distribution Low
Granule Uniformity Low
Granule Flowability Low
Effect of Roller Pressure, Roller Gap, Milling Speed and Mill Screen Orifice Size
The main objective of the study was to evaluate the effect of the roller compaction and
integrated milling process parameters on the quality attributes of the ribbon, milled
granules and finished drug product using DOE. The process parameters investigated were
roller pressure, roller gap, milling speed and mill screen orifice size.
A preliminary feasibility experiment was conducted to study the effect of roller pressure
on the quantity of by-pass material (un-compacted material). The study showed that
April 2012 65
Example QbD IR Tablet Module 3 Quality 3.2.P.2 Pharmaceutical Development
within the roller pressure range of 20-80 bar, the quantity of by-pass material was less
than 5% and the potency matched that of the blend fed into the roller compactor.
Therefore, the roller pressure range of 20-80 bar was suitable for further studies. During
the feasibility study, product temperature was monitored by a non-invasive measuring
device. No significant increase (> 5°C) was observed. The ranges for roller gap, mill
speed and mill screen orifice size were selected based on previous experience with
approved ANDA 123456 and ANDA 456123.
For this study, a 24-1
fractional factorial DOE was used and three center points were
included to evaluate if any curvature effects exist. Table 39 presents the study design.
Table 39. Design of the 24-1
DOE to study roller compaction and integrated milling process variables
Defining Relation I=ABCD
Resolution IV
Factors: Process Variables
Levels
-1 0 +1
A Roller pressure (bar) 20 50 80
B Roller gap (mm) 1.2 1.8 2.4
C Mill speed (rpm) 20 60 100
D Mill screen orifice size (mm) 0.6 1.0 1.4
Responses Goal Acceptable Ranges
Y1 Ribbon density (g/cc) Target at 1.1 1.0-1.2
Y2 d10 of milled granules (μm) Target at 100 μm 50-150 μm
Y3 d50 of milled granules (μm) Target at 600 μm 400-800 μm
Y4 d90 of milled granules (μm) Target at 1000 μm 800-1200 μm
Y5 Granule uniformity (% RSD) Minimize % RSD < 5%
Y6 Granule flowability (ffc) Maximize > 6
Y7 Assay of granule sieve cut (% w/w) Target at 100% w/w 95.0-105.0% w/w
Y8 Tablet hardness@ 5 kN (kP) Maximize > 5.0 kP
Y9 Tablet hardness @ 10 kN (kP) Maximize > 9.0 kP
Y10 Tablet hardness @ 15 kN (kP) Maximize > 12.0 kP
Y11 Friability @ 5 kN (%) Minimize < 1.0%
Y12 Friability @ 10 kN (%) Minimize < 1.0%
Y13 Friability @ 15 kN (%) Minimize < 1.0%
Y14 Tablet assay (% w/w) Target at 100% w/w 95.0-105.0% w/w
Y15 Tablet content uniformity (% RSD) Minimize % RSD < 5%
Y16 Tablet disintegration time (min) Minimize < 5 min
Y17 Dissolution at 30 min (%) Maximize > 80%
Approximately 50.0 kg of the intragranular excipients and drug substance (Lot #2) were
blended in a 150 L diffusive V-blender operated at 12 rpm. The blender was equipped
with an NIR probe to monitor the blending endpoint (RSD < 5%, target revolutions
~234). The powder mixture was subdivided into 11 batches, each ~4.5 kg in size. The
remaining 0.5 kg of powder was used as a control and was not roller compacted.
Each batch of blended powder was roller compacted using an Alexanderwerk WP120
(roller diameter 120 mm and roller width 25 mm) using the parameters defined in Table
April 2012 66
Example QbD IR Tablet Module 3 Quality 3.2.P.2 Pharmaceutical Development
40. The integrated milling unit on the Alexanderwerk WP120 is equipped with a ribbon
crusher and a two-step milling apparatus. The ribbon is crushed into small flakes. The
crushed flakes will first go through a coarse screen milling (sizing) step in which the
rotor operates at 80% of the milling speed used for the second step. The second step is
designed for final milling. In this study, the coarse screen size was fixed at 2.0 mm. The
milling speed and milling screen orifice size of the second step are shown in Table 40.
The milled granules were blended with talc for 100 revolutions in a 16 qt V-blender
operated at 20 rpm. Magnesium stearate was then added and blended for an additional 80
revolutions. Each batch was compressed into tablets with a target weight of 200.0 mg.
The tablet hardness and friability were studied as a function of main compression force.
Three compression forces, 5 kN, 10 kN and 15 kN, were used. To study tablet assay,
content uniformity (% RSD), disintegration and dissolution, the main compression force
was adjusted to achieve a target hardness of 9.0 kP (8.0-10.0 kP was allowed).
Table 40 presents the experimental results for ribbon density, mean granule size (d50),
granule flowability (ffc), tablet hardness observed at 10 kN force and tablet content
uniformity (% RSD) (other responses not shown).
Table 40. Experimental results for the roller compaction and integrated milling DOE
Batch
No.
Factors Responses
A:
Roller
pressure
B:
Roller
gap
C:
Mill
speed
D:
Mill
screen
Y1
Ribbon
density
Y3
Granule
d50
Y6
Granule
Flowability (ffc)
Y9
Hardness
@ 10 kN
Y15
Tablet
CU
(bar) (mm) (rpm) (mm) (g/cc) (μm) -- (kP) (% RSD)
37 50 1.8 60 1.0 1.132 649 7.64 10.9 3.1
38 20 2.4 100 0.6 0.943 268 4.19 14.4 5.3
39 20 1.2 20 0.6 1.002 264 5.26 13.4 4.2
40 80 2.4 100 1.4 1.211 1227 9.83 10.1 2.1
41 80 1.2 20 1.4 1.285 1257 10.46 7.8 1.4
42 20 2.4 20 1.4 0.942 739 6.28 14.5 3.5
43 50 1.8 60 1.0 1.118 639 7.52 10.7 2.8
44 80 1.2 100 0.6 1.278 346 8.61 9.0 2.7
45 50 1.8 60 1.0 1.104 611 7.88 11.4 2.9
46 20 1.2 100 1.4 1.005 687 7.47 12.9 3.1
47 80 2.4 20 0.6 1.206 328 7.25 10.0 2.8
Significant factors for ribbon density
As shown in the half-normal plot (Figure 27), the significant factors affecting ribbon
density were A (roller pressure) and B (roller gap). The effect of roller pressure and roller
gap on ribbon density is presented in Figure 28. Ribbon density increased with increasing
roller pressure (positive effect) and decreasing roller gap (negative effect).
April 2012 67
Example QbD IR Tablet Module 3 Quality 3.2.P.2 Pharmaceutical Development
Half-Normal%Probability
|Standardized Effect|
0.00 0.07 0.14 0.20 0.27
0
10
20
30
50
70
80
90
95
A
B
Error Estimates
Ribbon density (g/cc)
Shapiro-Wilk Test
W-value = 0.933
p-value = 0.617
A: Roller pressure (bar)
B: Roller gap (mm)
C: Mill speed (rpm)
D: Mill screen orifice size (mm)
Positive Effects
Negative Effects
Figure 27. Half-normal plot of the process variable effects on ribbon density
Ribbon density (g/cc)
1.28
0.94
A: Roller pressure (bar)
B: Roller gap (mm)
Actual Factors:
C: Mill speed (rpm) = 60
D: Mill screen orifice size = 1.0
2.4
2.1
20 30 40 50 60 70 80
1.2
1.5
1.8
A: Roller pressure (bar)
B:Rollergap(mm)
1.00 1.05
1.151.10
1.20
1.25
Figure 28. Effect of roller pressure and roller gap on ribbon density
Significant factors for mean granule size (d50)
The half-normal plot (Figure 29) shows that the significant factors affecting mean granule
size (d50) were D (mill screen orifice size), A (roller pressure) and AD (their interaction).
The contour plot presented in Figure 30 shows the effect of mill screen orifice size and
roller pressure on granule d50. It is evident that d50 increased with increasing mill screen
orifice size and roller pressure (positive effect). These two parameters also exhibited a
April 2012 68
Example QbD IR Tablet Module 3 Quality 3.2.P.2 Pharmaceutical Development
strong interaction (i.e., roller pressure showed a larger impact on mean granule size when
using a larger mill screen orifice size).
Granule d50 (μm)
Shapiro-Wilk Test
W-value = 0.950
p-value = 0.714
A: Roller pressure (bar)
B: Roller gap (mm)
C: Mill speed (rpm)
D: Mill screen orifice size (mm)
Half-Normal%Probability
|Standardized Effect|
0 169 338 507 676
0
10
20
30
50
70
80
90
95
A
D
AD
Error Estimates
Positive Effects
Negative Effects
Figure 29. Half-normal plot of the process variable effects on mean granule size (d50)
1257
264
D: Mill screen orifice size (mm)
A: Roller pressure (bar)
Actual Factors:
B: Roller gap (mm) = 1.8
C: Mill speed (rpm) = 60
80
0.6 0.8 1.0 1.2 1.4
20
30
40
50
60
70
Granule d50 (μm)
D: Mill screen orifice size (mm)
A:Rollerpressure(bar)
1000
800
400 600
Figure 30. Effect of mill screen orifice size and roller pressure on mean granule size (d50)
April 2012 69
Example QbD IR Tablet Module 3 Quality 3.2.P.2 Pharmaceutical Development
Significant factors for granule flowability
The flowability (represented by ffc value) of the granules after milling was determined
using a ring shear tester. As shown in the half-normal plot (Figure 31), the significant
factors affecting granule flowability were A (roller pressure), D (mill screen orifice size)
and B (roller gap). The effect of roller pressure and mill screen orifice size on granule
flowability is shown in Figure 32. Granule flowability improved with increasing roller
pressure and mill screen orifice size. Roller gap also had an impact on granule flowability
but to a lesser extent.
Granule flowability (ffc)
Shapiro-Wilk Test
W-value = 0.952
p-value = 0.726
A: Roller pressure (bar)
B: Roller gap (mm)
C: Mill speed (rpm)
D: Mill screen orifice size (mm)
Half-Normal%Probability
|Standardized Effect|
0.00 0.40 0.81 1.21 1.62 2.02 2.43 2.83 3.24
0
10
20
30
50
70
80
90
95
A
B
D
Error Estimates
Positive Effects
Negative Effects
Figure 31. Half -normal plot of the process variable effects on granule flowability (ffc)
Granule flowability (ffc)
10.5
4.2
A: Roller pressure (bar)
D: Mill screen orifice size (mm)
Actual Factors:
B: Roller gap (mm) = 1.8
C: Mill speed (rpm) = 60
1.4
20 30 40 50 60 70 80
0.6
0.8
1.0
1.2
A: Roller pressure (bar)
D:Millscreenorificesize(mm)
9.0
7.0 8.0
6.0
Figure 32. Effect of roller pressure and mill screen orifice size on granule flowability (ffc)
April 2012 70
Example QbD IR Tablet Module 3 Quality 3.2.P.2 Pharmaceutical Development
Significant factors for granule uniformity (% RSD)
All batches demonstrated acceptable granule uniformity (ranging from 2.0-2.9% RSD)
and none of the process variables showed a significant impact on this response.
Significant factors for assay of granule sieve cuts
Approximately 10 g of granules were sampled from each batch and transferred to the top
of a set of seven sieves stacked by decreasing size: 840 μm, 420 μm, 250 μm, 180 μm,
149 μm, 75 μm and pan (no opening for fine collection). The sieves were shaken for five
minutes on a laboratory particle size analyzer. The assay of sieve cuts collected from
each batch was analyzed. All batches demonstrated acceptable assay for each granule
sieve cut (ranging from 98.2-102.0%). This data confirmed that segregation of the pre-
roller compacted blend did not occur. None of the factors were shown to have a
significant impact on the assay of granule sieve cuts.
Significant factors for tablet hardness
As shown in the half-normal plot (Figure 33), the significant factors affecting tablet
hardness when compressed using 10 kN of force were A (roller pressure) and B (roller
gap). The effect of roller pressure and roller gap on tablet hardness is presented in Figure
34. Tablet hardness decreased with increasing roller pressure and decreasing roller gap.
Error Estimates
Positive Effects
Negative Effects
Hardness @10 kN (kP)
Shapiro-Wilk Test
W-value = 0.952
p-value = 0.752
A: Roller pressure (bar)
B: Roller gap (mm)
C: Mill speed (rpm)
D: Mill screen orifice size (mm)
Half-Normal%Probability
|Standardized Effect|
0.00 1.14 2.29 3.43 4.58
0
10
20
30
50
70
80
90
95
A
B
Figure 33. Half-normal plot of the process variable effects on tablet hardness @ 10 kN
April 2012 71
Example QbD IR Tablet Module 3 Quality 3.2.P.2 Pharmaceutical Development
14.5
7.8
2.4
2.1
m)
Hardness @ 10 kN (kP)
A: Roller pressure (bar)
B: Roller gap (mm)
Actual Factors:
C: Mill speed (rpm) = 60
D: Mill screen orifice size (mm) = 1.0
20 30 40 50 60 70 80
1.2
1.5
1.8
A: Roller pressure (bar)
Figure 34. Effect of roller pressure and roller gap on tablet hardness @ 10 kN
B:Rollergap(m
14.0
13.0
12.0
11.0
10.0
9.0
Since both ribbon density and tablet hardness were impacted by roller pressure and roller
gap, it was logical to evaluate if any correlation existed between these two quality
attributes. As shown in Figure 35, an inverse relationship was observed between ribbon
density and tablet hardness. The establishment of this relationship was significant as it
enables an intermediate material attribute (ribbon density) to be used as an in-process
control during roller compaction to facilitate successful downstream operation (tablet
compression) and ensure the target for a final product quality attribute (dissolution) is
met.
y = -17.19x + 30.48
R
2
= 0.97
0
2
4
6
8
10
12
14
16
0.9 1.0 1.1 1.2 1.3
Tablethardness@10kN(kP)
Ribbon density (g/cc)
Figure 35. Relationship between ribbon density and tablet hardness
April 2012 72
Example QbD IR Tablet Module 3 Quality 3.2.P.2 Pharmaceutical Development
Significant factors for tablet friability
All tablets manufactured in Batch Nos. 37-47 exhibited acceptable friability (< 0.2%
weight loss) when compressed using 10 kN and 15 kN of force. When 5 kN of
compression force was used, Batch Nos. 41 and 44 exhibited low tablet hardness (< 5.0
kP) and failed the friability test. These two batches had high ribbon density (~ 1.28 g/cc).
The remainder of the batches compressed using 5 kN of force showed acceptable
friability (< 0.2% weight loss) and hardness was higher than 5.0 kP.
Significant factors for tablet assay
All batches demonstrated acceptable assay (ranging from 98.4-100.6%) which is well
within the specification limits (95.0-105.0% w/w) and none of the factors showed a
significant impact on tablet assay.
Significant factors for tablet content uniformity (% RSD)
Data analysis indicated that the curvature effect was not significant for tablet content
uniformity. As shown in the half-normal plot (Figure 36), the significant factors affecting
tablet content uniformity were A (roller pressure), D (mill screen orifice size) and B
(roller gap).
Figure 37 shows the effect of roller pressure and mill screen orifice size on tablet content
uniformity. Tablet content uniformity improved as evidenced by a decreased % RSD with
increasing roller pressure and mill screen orifice size. Roller gap had some impact on
tablet content uniformity but to a lesser extent.
Error Estimates
Positive Effects
Negative Effects
Content Uniformity (% RSD)
Shapiro-Wilk Test
W-value = 0.946
p-value = 0.691
A: Roller pressure (bar)
B: Roller gap (mm)
C: Mill speed (rpm)
D: Mill screen orifice size (mm)
Half-Normal%Probability
|Standardized Effect|
0.00 0.30 0.59 0.89 1.18 1.48 1.78
0
10
20
30
50
70
80
90
95
A
B
D
Figure 36. Half-normal plot of the process variable effects on tablet content uniformity (% RSD)
April 2012 73
Example QbD IR Tablet Module 3 Quality 3.2.P.2 Pharmaceutical Development
5.3
1.4
1.4
(mm)
A: Roller pressure (bar)
D: Mill screen orifice size (mm)
Actual Factors:
B: Roller gap (mm) = 1.8
C: Mill speed (rpm) = 60
20 30 40 50 60 70 80
0.6
0.8
1.0
1.2
Content Uniformity (% RSD)
A: Roller pressure (bar)
D:Millscreenorificesize
2.5
3.0
3.5
4.0
2.0
Figure 37. Effect of roller pressure and mill screen orifice size on tablet content uniformity (%RSD)
Significant factors for tablet disintegration
All batches demonstrated rapid disintegration (< 4 min). None of the process variables
studied had a significant impact on the disintegration time.
Significant factors for tablet dissolution
Tablet hardness had a significant impact on dissolution (see Section 2.3.5 Tablet
Compression Process Development). Based on the inverse linear relationship between
ribbon density and tablet hardness, it can be concluded that roller compaction will have
an indirect impact on dissolution. For a ribbon with a reasonable density, target hardness
can be achieved by adjusting the main compression force. However, it is well known that
powder material loses a certain extent of its compressibility and compactability when
roller compacted. Consequently, higher compression force is required to achieve the
same tablet hardness for a higher ribbon density than for a lower ribbon density. On the
other hand, when the ribbon density was low (≤ 1.0 g/cc), the flowability of the granules
(Batches 2 and 3) was low (ffc < 6). Therefore, a range for ribbon density needs to be
established such that the desired granule flowability is achieved and the required
compression force will not exceed the maximum allowable tool tip pressure
recommended by the tooling manufacturer. Based on the DOE results for tablet friability
and granule flowability, the ribbon density will be controlled between 1.0-1.2 g/cc (i.e.,
ribbon relative density between 0.68-0.81; ribbon true density is 1.4803 g/cc in this
study).14
Summary of roller compaction and integrated milling process development
Roller pressure had a significant impact on ribbon density, mean granule size (d50),
granule flowability, tablet hardness and tablet content uniformity. Increasing roller
pressure increased ribbon density, granule mean particle size (d50), granule flowability
April 2012 74
14
Ribbon relative density (solid fraction) = ribbon density/ribbon true density.
Example QbD IR Tablet Module 3 Quality 3.2.P.2 Pharmaceutical Development
and tablet content uniformity (lower % RSD). However, it had a negative impact on the
compressibility and compactability of the granules as indicated by decreasing tablet
hardness for any given compression force.
Roller gap exhibited a significant impact on ribbon density, granule flowability, tablet
hardness and tablet content uniformity. Increasing the roller gap decreased ribbon
density, granule flowability and tablet content uniformity (higher % RSD). However,
tablet hardness at a given compression force increased with increasing roller gap.
Mill screen orifice size had a significant impact on mean granule size (d50), granule
flowability and tablet content uniformity. Increasing mill screen orifice size increased
granule mean particle size (d50), granule flowability and tablet content uniformity (lower
% RSD).
Mill speed did not show a significant impact on any of the responses studied. In addition,
no curvature effects were observed for any of the responses. Based on the results of the
DOE study, roller pressure, roller gap and mill screen orifice size were identified as the CPPs
while mill speed was determined to be not critical.
The overlay plot shown in Figure 38 was used to identify an appropriate range for each CPP
that would ensure that the targets for all quality attributes are met concurrently. A mill screen
orifice size of 1.0 mm was selected because it allows a wider acceptable operating range for
both roller pressure and roller gap compared to the other studied sizes (0.6 mm and 1.4 mm).
Based on the results, the acceptable ranges for roller pressure and roller gap were
identified as 20-77 bar and 1.2-2.4 mm, respectively, for the roller compaction and
integrated milling process step using an Alexanderwerk WP120 equipped with a knurled
roller that is 120 mm in diameter and 25 mm in width.15
April 2012 75
15
This is for concept demonstration only. All identified CQAs should be studied and included for an actual
drug product.
Example QbD IR Tablet Module 3 Quality 3.2.P.2 Pharmaceutical Development
A: Roller pressure (bar)
B: Roller gap (mm)
Actual Factors:
C: Mill speed (rpm) = 60
D: Mill screen orifice size (mm) = 1.0
a) Granule flowability (ffc): 6.00
b) Ribbon density (g/cc): 1.000
c) Ribbon density (g/cc): 1.200
d) Hardness (kP): 9.0
20 30 40 50 60 70 80
1.2
1.5
1.8
2.1
2.4
Overlay Plot
A: Roller pressure (bar)B:Rollergap(mm)
a
b c
d
Green Zone: All responses met the predefined criteria.
Gray Zone: One or more responses failed to meet the predefined criteria.
Figure 38. Overlay plot – effect of roller compaction and integrated milling process variables on responses
Updated Risk Assessment of the Roller Compaction and Integrated Milling Process Variables
Table 41 presents the risk reduction for the roller compaction and integrated milling
process variables as a result of the development studies. Justification of the reduced risks
is also provided.
Table 41. Updated risk assessment of the roller compaction and milling process variables
Process Step: Roller Compaction and Integrated Milling
Output Material CQAs: Ribbon Density, Granule Size Distribution, Granule Uniformity and Granule
Flowability
Variables Output Material CQAs:
Risk
Assessment
Justification for the Reduced Risks
Roller Compaction and Integrated Milling Process Variables
Roller
pressure
Ribbon Density Low An acceptable range for roller pressure was identified
during the DOE. Within the range (20-77 bar), all
CQAs met the predefined acceptance criteria by using
an appropriate roller gap. Thus, the risk is reduced
from high to low.
Granule Size Distribution Low
Granule Uniformity Low
Granule Flowability Low
Roller gap
Ribbon Density Low An acceptable range for roller gap was identified
during the DOE. Within the range (1.2-2.4 mm), all
CQAs met the predefined acceptance criteria by using
an appropriate roller pressure. Thus, the risk is
reduced from high to low.
Granule Size Distribution Low
Granule Uniformity Low
Granule Flowability Low
Mill speed
Granule Size Distribution Low The mill speed range investigated (20-100 rpm) had
no impact on granule PSD, granule uniformity or
granule flowability. Thus, the risk is reduced from
high to low.
Granule Uniformity Low
Granule Flowability Low
April 2012 76
Example QbD IR Tablet Module 3 Quality 3.2.P.2 Pharmaceutical Development
Process Step: Roller Compaction and Integrated Milling
Output Material CQAs: Ribbon Density, Granule Size Distribution, Granule Uniformity and Granule
Flowability
Variables Output Material CQAs:
Risk
Assessment
Justification for the Reduced Risks
Mill screen
orifice size
Granule Size Distribution Low The mill screen orifice size (1.0 mm) was selected
because it allows a wider acceptable operating range
for both roller pressure and roller gap compared to the
other studied sizes (0.6 mm and 1.4 mm). When using
the selected mill screen orifice size (1.0 mm), all
CQAs met the predefined acceptance criteria. Thus,
the risk is reduced from high to low.
Granule Uniformity Low
Granule Flowability Low
2.3.4 Final Blending and Lubrication Process Development
Initial Risk Assessment of the Final Blending and Lubrication Process Variables
The initial risk assessment of the overall manufacturing process presented in Table 32
identified the risk of the final blending and lubrication step to impact tablet dissolution as
high. The lubrication process variables that could potentially impact tablet dissolution
were identified and their associated risk was evaluated. Table 42 presents the initial risk
assessment of the final blending and lubrication step.
Table 42. Initial risk assessment of the final blending and lubrication
Process Step: Final Blending and Lubrication
Output Material CQA: Tablet Dissolution
Variables Risk Assessment Justification and Initial Strategy
Input Material Attributes
Granule uniformity Low
The granules produced during roller compaction
development demonstrated uniformity with %
RSD < 3%. Therefore, granule uniformity should
have little impact on tablet dissolution. The risk is
low.
Assay of granule sieve cut Low
Sieve cuts studied during roller compaction
development ranged in assay from 98.2% to
101.2%. This low variability will have little
impact on tablet dissolution. The risk is low.
Granule flowability Low
For a ribbon relative density of 0.68 to 0.81, the
flowability was good (ffc > 6) and should not
impact tablet dissolution. The risk is low.
Granule size distribution Low
The rapid disintegration of the tablets is achieved
by using 5% CCS in the formulation. The
variability in granule size distribution observed
during roller compaction development showed no
impact on dissolution. Therefore, the risk is low.
Granule bulk density Low
The granule bulk density is consistently between
0.62-0.69 g/cc. The low variability has little
impact on tablet dissolution. The risk is low.
April 2012 77
Example QbD IR Tablet Module 3 Quality 3.2.P.2 Pharmaceutical Development
Process Step: Final Blending and Lubrication
Output Material CQA: Tablet Dissolution
Variables Risk Assessment Justification and Initial Strategy
Magnesium Stearate specific
surface area
High
The lubricating effect of magnesium stearate
improves as specific surface area increases. The
risk of over-lubrication leading to retarded
disintegration and dissolution is high.
Lubrication Variables
Blender type Low
Due to differences in the operating principle,
different types of blenders may impact blending
efficiency. Based on availability, V-blender is
selected. The risk is low.
However, if the blender type is changed during
scale-up or commercialization, the risk should be
re-evaluated.
Order of addition Low
Granules and talc are blended together first,
followed by magnesium stearate. Magnesium
stearate is traditionally charged last to lubricate
the other particles. Order of addition is fixed and
has a minimal impact on dissolution. The risk is
low.
Rotation speed (rpm) Medium
Rotation speed is often fixed by equipment
constraint. Different size blenders have different
rotation speeds. The rotation speed for the 16 qt
blender is fixed at 20 rpm. The risk to impact
tablet dissolution is medium.
Number of revolutions High
Over-lubricating may result in retarded
disintegration and dissolution. For a BCS class II
compound like acetriptan, the risk is high.
Intensifier bar (on/off) Low
If the intensifier bar is on, then it may cause
granule attrition. To avoid generating fines, the
intensifier bar is fixed in the off position during
the final blending and lubrication. The risk is low.
Blender fill level Medium
Blender fill level may affect mixing dynamics. It
is fixed for these development studies but could
change upon scale-up. The risk is medium.
Holding time Low
These three process variables are not related to
dissolution. The risk is low.Blender discharge Low
Drum-to-hopper transfer Low
Environment
(temperature and RH)
Low
If not controlled, fluctuations in the facility
temperature and RH could impact the CQAs.
Routine environment temperature and RH set
point in the cGMP manufacturing facility is fixed
at 25 ºC ± 5% and 40%-60% RH, respectively,
and will be monitored during manufacturing. The
risk is low.
Based on the results of Formulation Development Study #2, the extragranular magnesium
stearate and talc levels were fixed to 0.6% and 2.9%, respectively. The composition of
Generic Acetriptan Tablets, 20 mg, was shown previously in Table 29.
April 2012 78
Example QbD IR Tablet Module 3 Quality 3.2.P.2 Pharmaceutical Development
Due to the low solubility of acetriptan, it is important to ensure that the blend is not over-
lubricated, leading to retarded disintegration. NIR monitoring of the lubrication process is
not feasible due to the low amount of lubricant added; therefore, a traditional method
with the blending endpoint based on lubrication time is needed.
A study was performed to investigate the effect of magnesium stearate specific surface
area and number of revolutions during lubrication on tablet hardness, disintegration, and
dissolution. For this study, a 25.0 kg blend was manufactured in a pilot scale blender (150
L) using acetriptan Lot #2. The blend was roller compacted to give a ribbon relative
density of 0.75. The ribbon was then milled and subdivided into five 5.0 kg batches. For
each batch, the granules and talc were blended for 100 revolutions in a 16 qt V-blender at
20 rpm prior to lubrication with magnesium stearate. Then, magnesium stearate was
added and blended according to the experimental design as shown in Table 43. After
lubrication, samples were pulled from the 10 locations shown in Figure 23 to verify blend
uniformity. The lubricated blend was then compressed using 10 kN of force to
manufacture tablets. Ejection force was monitored. Compressed tablets were checked for
appearance and the tablet press tooling (punches and dies) was evaluated for evidence of
picking/sticking and binding. Additionally, tablets were subjected to friability, assay and
content uniformity testing. Table 43 shows the lubrication parameters and results for each
batch (not all data shown).
Table 43. Results of the extragranular lubrication study*
Batch
No.
Factors: Process Variables Responses
A:
Magnesium stearate
specific surface area
B:
Nrev (lubrication time)
Y1:
BU
Y2:
Hardness
Y3:
Disintegration
time
Y4:
Dissolution
at 30 min
(m2
/g) -- (% RSD) (kP) (min) (%)
48 5.8 60 (3 min) 2.3 9.0 2.7 96.2
49 5.8 100 (5 min) 2.5 9.2 3.1 97.4
50 10.4 60 (3 min) 2.4 8.9 3.4 96.3
51 10.4 100 (5 min) 2.3 8.8 3.7 96.7
52 8.2 80 (4 min) 2.4 9.1 2.9 97.1
*The fill level is ~ 49% and the headspace fraction is ~51%
The ejection force increased slightly with decreased lubrication time and lower specific
surface area but did not exceed 150 N during the study. Tablet elegance was not an issue
as all compressed tablets had a smooth surface and lacked any visible striations on the
sides of the tablet. There was no evidence of product sticking on the punches within the
letters and numbers. There was also no evidence of binding to the die cavities.
For each batch, the % RSD was less than 3% indicating that blend uniformity was
acceptable following lubrication of the granules. Overall, the blend assay was between
98.3% and 101.7% for all samples pulled during the study. The tablet hardness observed
was 9.0 ± 0.2 kP which is well within the target range of 8.0-10.0 kP. Tablets exhibited
rapid disintegration (< 4 min) and dissolution (> 95% in 30 min). The results indicated
that adequate lubrication of the granules was insensitive to both specific surface area
(5.8-10.4 m2
/g) and lubrication time (3-5 min) within the ranges studied.
April 2012 79
Example QbD IR Tablet Module 3 Quality 3.2.P.2 Pharmaceutical Development
Over the course of the study, friability did not exceed 0.2% w/w. Tablet assay was close
to target and well within the acceptable range of 95.0-105.0% w/w. Tablet content
uniformity was acceptable with a % RSD less than 4%.
Summary of Final Blending and Lubrication Process Development
Within the ranges studied, magnesium stearate specific surface area (5.8-10.4 m2
/g) and
number of revolutions (60-100) did not have a significant impact on the drug product
quality attributes studied.
Updated Risk Assessment of the Final Blending and Lubrication Process Variables
Table 44 presents the risk reduction for the final blending and lubrication step as a result
of the development studies. Only the process variables that were initially identified as
high risk to the dissolution of the final drug product are shown.
Table 44. Updated risk assessment of the final blending and lubrication process variables
Process Step: Final Blending and Lubrication
Output Material CQA: Tablet Dissolution
Variables Risk Assessment Justification for the Reduced Risks
Magnesium stearate specific
surface area
Low
Within the range 5.8-10.4 m2
/g, magnesium
stearate specific surface area does not adversely
impact tablet dissolution. The risk is reduced from
high to low and this material attribute will be
controlled in the control strategy.
Number of revolutions Low
A proven acceptable range for number of
revolutions (60-100) was established for this scale
based on elegant tablet appearance and rapid
dissolution. The risk is reduced from high to low
and number of revolutions is controlled in the
control strategy.
2.3.5 Tablet Compression Process Development
Initial Risk Assessment of the Tablet Compression Process Variables
Based on the initial risk assessment of the overall manufacturing process shown in Table
32, the risk of the compression step to impact content uniformity and dissolution of the
tablets was identified as high. Process variables that could potentially impact these two
drug product CQAs were identified and their associated risk was evaluated. The results of
the initial risk assessment of the compression process variables are summarized in Table
45.
April 2012 80
Example QbD IR Tablet Module 3 Quality 3.2.P.2 Pharmaceutical Development
Table 45. Initial risk assessment of the tablet compression process variables
Process Step: Tablet Compression
Drug Product CQAs: Content Uniformity, Dissolution
Variables Drug Product CQAs Risk Assessment Justification and Initial Strategy
Input Material Attributes
Blend assay
Content Uniformity Low
The blend assay varied between 98.3% and 101.7%
during the lubrication process development. This low
variability is unlikely to impact CU and dissolution.
The risk is low.Dissolution Low
Blend uniformity
Content Uniformity Low The lubricated blend demonstrated acceptable BU (%
RSD < 3%) during the lubrication process
development. Therefore, the risk is low.Dissolution Low
Granule size
distribution
Content Uniformity Low
The granule size distribution is controlled by milling
after the roller compaction process step. The granules
demonstrated good flowability (ffc > 6) and should not
impact CU. The risk is low.
Dissolution Low
The formulation contains 5% CCS and the variability
in granule size distribution observed during roller
compaction development showed no impact on
dissolution. The risk is low.
Blend flowability
Content Uniformity Low
Blend flowability could impact powder flow from the
hopper to the feed frame and, ultimately, to the die
cavity. However, adequate flow was demonstrated
during roller compaction development. Small amounts
of extragranular glidant and lubricant will not impact
blend flowability. The risk is low.
Dissolution Low
Blend compressibility
and compactability
Content Uniformity Low
CU is unaffected by the blend compressibility and
compactability. The risk is low.
Dissolution High
Suboptimal blend compressibility and compactability
can affect tablet hardness. The compressibility and
compactability of the blend are directly related to the
ribbon relative density achieved during roller
compaction. Ribbon relative density may vary from
batch-to-batch and may cause tablet hardness variation
if the compression force is not adjusted. This may, in
turn, impact dissolution. The risk is high.
Blend bulk density
Content Uniformity Low The blend bulk density is consistently between 0.62-
0.69 g/cc. The low variability has little impact on CU
and dissolution. The risk is low.Dissolution Low
Compression Variables
Press type and number
of stations used
Content Uniformity Low
The press type was selected based on equipment
availability and 3 stations will be used during
development. The same press model but all 51 stations
will be used for both exhibit and commercial scale.
Thus, the risk is low.
Dissolution Low
April 2012 81
Example QbD IR Tablet Module 3 Quality 3.2.P.2 Pharmaceutical Development
Process Step: Tablet Compression
Drug Product CQAs: Content Uniformity, Dissolution
Variables Drug Product CQAs Risk Assessment Justification and Initial Strategy
Tooling design
Content Uniformity Low Tooling design was selected to compress a tablet with
a similar size and shape as the RLD. No picking was
observed during the final blending and lubrication
studies. The risk is low.Dissolution Low
Feed frame paddle
speed
Content Uniformity High
A greater than optimal feed frame paddle speed may
cause over-lubrication. A lower than optimal feed
frame paddle speed may cause inconsistent die filling.
The risk is high.Dissolution High
Feeder fill depth
Content Uniformity Low The feeder fill depth is set to 80% full and is
monitored and controlled by an automatic feedback
control loop on the tablet press. The risk is low.Dissolution Low
Pre-compression force
Content Uniformity Low
CU is dominated by BU and flowability and is
unrelated to pre-compression force. The risk is low.
Dissolution Medium
A greater than optimal pre-compression force may
cause lamination. A lower than optimal pre-
compression force may trap air in the tablets, leading
to capping. Either scenario could impact dissolution.
The pre-compression force is set to 1.0 kN based on
experience with similar formulations compressed on
the same equipment. Adjustment may be needed. The
risk is medium.
Main compression force
Content Uniformity Low
CU is dominated by BU and flowability and is
unrelated to main compression force. The risk is low.
Dissolution High
Suboptimal compression force may affect tablet
hardness and friability and, ultimately, dissolution. The
risk is high.
Press speed (dwell time)
Content Uniformity High
A faster than optimal press speed may cause
inconsistent die filling and weight variability which
may then impact CU and dissolution. For efficiency,
the press speed will be set as fast as practically
possible without adversely impacting tablet quality.
The risk is high.
Dissolution High
Hopper design and
vibration
Content Uniformity Low
Since acetriptan is roller compacted with excipients,
the risk of drug substance segregation is minimized.
Tablet press vibrations and the hopper angle design are
unlikely to have an impact on CU and dissolution. The
risk is low.
Dissolution Low
Hopper fill level
Content Uniformity Low
The blend has acceptable flowability and the hopper
fill level is maintained at 50%. Maintaining the hopper
fill level makes it improbable that this parameter will
impact CU and dissolution. The risk is low.Dissolution Low
Drop height of finished
tablets
Content Uniformity Medium Finished tablets may chip, crack, cleave or break if the
drop height is great. The risk is medium.Dissolution Medium
Compression run time
Content Uniformity Medium
It is possible during long compression run times that
the CU may drift. The risk is medium.
Dissolution Low
It is unlikely for compression run time to cause a drift
that leads to a dissolution failure. The risk is low.
April 2012 82
Example QbD IR Tablet Module 3 Quality 3.2.P.2 Pharmaceutical Development
Process Step: Tablet Compression
Drug Product CQAs: Content Uniformity, Dissolution
Variables Drug Product CQAs Risk Assessment Justification and Initial Strategy
Environment
(temperature and RH)
Content Uniformity Low
If not controlled, fluctuations in the facility
temperature and RH could impact the CQAs. Routine
environment temperature and RH set point in the
cGMP manufacturing facility is fixed at 25 ºC ± 5%
and 40%-60% RH, respectively, and will be monitored
during manufacturing. The risk is low.
Dissolution Low
The following experiments were undertaken to investigate the relationship between the
input material attributes (i.e., ribbon relative density) and process parameters related to
compression and the final drug product quality attributes. Three batches of final blend
(Batch No. 53-55, 15.0 kg each, drug substance Lot #2) were manufactured in a 50 L
blender for the compression studies. The ribbon relative density for these three batches
was 0.68, 0.75 and 0.81, respectively. The roller compaction studies concluded that
within this range, the necessary compression force will not exceed the maximum
allowable tool tip pressure recommended by the manufacturer.
Effect of Feeder Frame Paddle Speed
A screening study to investigate the impact of the feeder frame paddle speed (8-20 rpm)
on tablet quality attributes was conducted. Since the final blend flows well, changes in
feeder frame paddle speed within the specified range had no impact on tablet weight
variability or content uniformity. Tablet dissolution was also unaffected by changes in
feeder speed, suggesting that over-lubrication due to the additional mixing is not a
concern. This process variable was eliminated from further study.
Effect of Main Compression Force, Press Speed and Ribbon Relative Density
Compression force and press speed (which is related to dwell time) can affect numerous
quality attributes including hardness, disintegration, dissolution, assay, content
uniformity, friability, weight variability and appearance. The density of the ribbon
following roller compaction may also impact the compressibility and compactability of
the granules which would then impact tablet hardness and dissolution. Therefore, a 23
full
factorial DOE with three center points was performed to understand the effects of these
parameters on tablet quality attributes. Pre-compression force is important to reduce
entrapped air that can impact the tablet integrity. However, based on previous experience
with similar formulations compressed with similar tooling (ANDA 123456), the pre-
compression force was fixed to 1 kN for this DOE. Table 46 presents the study design
and acceptance criteria for the responses.
April 2012 83
Example QbD IR Tablet Module 3 Quality 3.2.P.2 Pharmaceutical Development
Table 46. Design of the 23
full factorial DOE to investigate tablet compression
Factors: Process Parameters
Levels
-1 0 +1
A Main compression force (kN) 5 10 15
B Press speed (rpm) 20 40 60
C Ribbon relative density (no units) 0.68 0.75 0.81
Responses Goal Acceptable Ranges
Y1 Appearance Smooth, elegant appearance
Y2 Hardness (kP) Define acceptable range
To be defined based on other
responses
Y3 Friability (%) Minimize NMT 1.0 %
Y4 Weight variability (%) Minimize
Individual: Target ± 5%
Composite: Target ± 3%
Y5 Assay (% w/w) Achieve 100% w/w 95.0-105.0% w/w
Y6 Content uniformity (% RSD) Minimize % RSD % RSD < 5%
Y7 Disintegration time (min) Minimize NMT 5 min
Y8 Dissolution (%) Maximize NLT 80% at 30 min
The press was run at the speed of the specified DOE for at least five minutes prior to any
sampling. Tablet samples were then pulled at the beginning, middle and end of each run
(except for Batch No. 54c which was sampled every 20 min throughout the entire run).
Similar responses were observed at each sample time point; therefore, Table 47 presents
the results for the middle time point (responses Y1, Y3, Y4, Y5 and Y7 not shown).
Table 47. Experimental results of the 23
full factorial DOE to investigate tablet compression
Batch
No.
Factors: Process Variables Responses
A:
Main
compression force
B:
Press
speed
C:
Ribbon
relative density
Y2:
Hardness
Y6:
CU
Y8:
Dissolution
at 30 min
(kN) (rpm) -- (kP) (% RSD) (%)
55a 15 20 0.81 10.8 1.9 95.7
54a 10 40 0.75 9.7 3.1 96.1
53a 15 60 0.68 12.9 3.5 85.4
55b 15 60 0.81 11.3 3.9 92.6
53b 5 20 0.68 7.8 2.6 96.4
53c 15 20 0.68 13.6 2.2 83.8
55c 5 60 0.81 4.2 3.3 99.6
54b 10 40 0.75 10.4 2.9 94.5
55d 5 20 0.81 5.5 2.3 97.2
54c 10 40 0.75 9.1 2.5 93.1
53d 5 60 0.68 6.7 3.7 97.1
Significant factors for tablet hardness
Since center points were included in the study design, the significance of the curvature
effect was tested using an adjusted model and was found to be not significant. Thus,
center points were included for model fitting. As shown in the following half-normal plot
(Figure 39), A (main compression force) was the dominating factor affecting tablet
April 2012 84
Example QbD IR Tablet Module 3 Quality 3.2.P.2 Pharmaceutical Development
hardness followed by C (ribbon relative density). The remaining model terms had no
significant impact because they came from the normally distributed population as pure
error based on Shapiro-Wilk hypothesis test results.
Positive Effects
Negative Effects
Hardness (kP)
Shapiro-Wilk Test
W-value = 0.868
p-value = 0.258
A: Main compression force (kN)
B: Press speed (rpm)
C: Ribbon relative density
Error Estimates Half-Normal%Probability
|Standardized Effect|
0.00 1.53 3.05 4.58 6.10
0
10
20
30
50
70
80
90
95
A
C
Figure 39. Half-normal plot of the compression variable effects on tablet hardness
Tablet hardness was directly related to main compression force and inversely related to
ribbon relative density as shown in the contour plot below (Figure 40). Both the half-
normal plot and the contour plot show that there was no interaction between these two
factors.
April 2012 85
Example QbD IR Tablet Module 3 Quality 3.2.P.2 Pharmaceutical Development
13.6
4.2
A: Main compression force (kN)
C: Ribbon relative density
Actual Factor:
B: Press speed (rpm) = 40
5 7 9 11 13 15
0.68
0.71
0.75
0.78
0.81
Hardness (kP)
A: Main compression force (kN)
C:Ribbonrelativedensity
6.0
8.0
10.0
12.0
Figure 40. Effect of main compression force and ribbon relative density on tablet hardness
A roller compacted ribbon that exhibits a relative density toward the upper end of the
acceptable range (0.81) required a greater compression force to achieve the same
hardness than ribbon with a relative density toward the lower end of the acceptable range
(0.68). This is because the powder mixture loses some of its compressibility and
compactability after roller compaction.
The DOE results show that it is possible to adjust a process parameter to accommodate
variability in a material attribute. In other words, the model can be used to determine the
necessary compression force for a given ribbon relative density to ensure that the target
tablet hardness is achieved.
Significant factors for tablet friability
None of the factors had a significant effect on tablet friability. All of the batches showed
friability less than 0.2% except for Batch No. 55c which had an average hardness of 4.2
kP and showed a higher weight loss of 0.6%. Therefore, the lower limit for tablet
hardness was set to 5.0 kP.
Significant factors for tablet weight variability and content uniformity
The half-normal plot below (Figure 41) shows that press speed was the only factor that
had a significant impact on content uniformity. The effect was a positive effect, meaning
that the % RSD increased as press speed increased. This is also shown clearly in the main
effect plot (Figure 42). The main effect plot demonstrates that no curvature was observed
so further optimization of the press speed is unnecessary.
April 2012 86
Example QbD IR Tablet Module 3 Quality 3.2.P.2 Pharmaceutical Development
Content Uniformity (% RSD)
Shapiro-Wilk Test
W-value = 0.866
p-value = 0.210
A: Main compression force (kN)
B: Press speed (rpm)
C: Ribbon relative density
Half-Normal%Probability
|Standardized Effect|
0.00 0.34 0.68 1.01 1.35
0
10
20
30
50
70
80
90
95
B
Error Estimates
Positive Effects
Negative Effects
Figure 41. Half-normal plot of the compression variable effects on tablet content uniformity
Content Uniformity (% RSD)
B: Press speed (rpm)
Actual Factors:
A: Main compression force (kN) = 10
C: Ribbon relative density = 0.75
Design Points
20 30 40 50 60
B: Press speed (rpm)
ContentUniformity(%RSD)
4.0
3.5
3.0
2.5
2.0
Figure 42. Main effect of press speed on tablet content uniformity
Although better content uniformity (i.e., lower % RSD) is achieved when the tablet press
is operated at a slower speed, the press speed range investigated (20-60 rpm) did not
result in out-of-specification tablet content uniformity. At 60 rpm, the % RSD observed
was less than 4% and well below the limit of 5%.
Similarly, press speed had a statistically significant impact on tablet weight variability
which increased with faster press speed. However, the individual tablet weight variability
was well below 5% and the composite weight variability was well below 3%.
April 2012 87
Example QbD IR Tablet Module 3 Quality 3.2.P.2 Pharmaceutical Development
During production, it is desirable to maximize efficiency by setting the tablet press as fast
as practically possible without adversely impacting the quality of the drug product. Based
on the compression study, the proven acceptable range for press speed is 20-60 rpm.
Significant factors for tablet disintegration and dissolution
The main compression force, press speed, and ribbon relative density did not have a
significant impact on disintegration. The disintegration time was rapid and varied from
1.5 minutes to 3 minutes.
The following half-normal plot (Figure 43) shows that the significant factors affecting the
dissolution rate of the compressed tablets were A (main compression force) and C
(ribbon relative density). These two factors also showed a significant interaction, AC.
The remaining model terms had no significant impact based on Shapiro-Wilk hypothesis
test results.
Half-Normal%Probability
|Standardized Effect|
0.00 2.05 4.10 6.15 8.20
0
10
20
30
50
70
80
90
95
A
C
AC
Dissolution at 30 min (%)
Shapiro-Wilk Test
W-value = 0.943
p-value = 0.672
A: Main compression force (kN)
B: Press speed (rpm)
C: Ribbon relative density
Error Estimates
Positive Effects
Negative Effects
Figure 43. Half-normal plot of the compression variable effects on dissolution
Figure 44 illustrates the effect of main compression force and ribbon relative density on
tablet dissolution. The curved contour lines show that an interaction exists because the
dissolution results differed depending on the main compression force setting and the
ribbon relative density. The dissolution rate decreased with increasing main compression
force and increased with increasing ribbon relative density. These results are in line with
the observed effect that these factors had on tablet hardness. Increasing the main
compression force resulted in harder tablets and retarded dissolution even though rapid
disintegration was still achieved by using 5% superdisintegrant. To avoid a potential
dissolution failure, the upper limit for hardness is set to 13.0 kP since Batch No. 53c with
a hardness of 13.6 kP showed dissolution of 83.8%.
April 2012 88
Example QbD IR Tablet Module 3 Quality 3.2.P.2 Pharmaceutical Development
5 8 10 13 15
0.68
0.71
0.75
0.78
0.81
Dissolution at 30 min (%)
A: Main compression force (kN)
C:Ribbonrelativedensity
99.6
98.083.8
A: Main compression force (kN)
C: Ribbon relative density 96.0
Actual Factor:
B: Press speed (rpm) = 40 94.0
92.0
90.0
88.0
Figure 44. Effect of main compression force and ribbon relative density on tablet dissolution
Effect of compression run time on tablet weight variability
Batch No. 54c was sampled every 20 minutes to evaluate the potential drift in tablet
weight over the course of the compression run. The results demonstrated that the weight
variability was well controlled for the individual tablets within ± 5% of the target weight
and for the composite sample within ± 3% of the target weight. No trend for tablet weight
was observed throughout the entire compression run. Tablet samples pulled at the
beginning, middle, and end of the run were tested for all DOE responses and results are
shown in Table 47.
Summary of other responses
Main compression force, press speed, and relative ribbon density had no significant
impact on the remaining responses. Each run produced tablets that had a smooth surface
with no evidence of picking/sticking or capping. Assay ranged from 99.1% to 101.0%.
Summary of Tablet Compression Process Development
Within the range studied (8-20 rpm), feeder frame paddle speed did not impact the tablet
dissolution. A press speed in the range of 20-60 rpm did not show any significant impact
on the responses investigated. An acceptable range for compression force was identified.
Force adjustments can be made to accommodate the acceptable variation in ribbon
relative density (0.68-0.81) between batches.
Proposed Tablet Compression In-Process Controls
Based on the results of the studies undertaken to understand the process variables
affecting compression, Table 48 lists the proposed in-process controls for the
compression step.
April 2012 89
Example QbD IR Tablet Module 3 Quality 3.2.P.2 Pharmaceutical Development
Table 48. Proposed in-process controls for the compression step
Test Frequency Limits
Individual tablet weight (n = 10) 30 min 200.0 mg ± 10.0 mg
Composite tablet weight (n = 20) 30 min 4.00 g ± 0.12 g
Hardness (n = 10) 30 min
Target: 8.0-10.0 kP
Limits: 5.0-13.0 kP
Thickness (n = 10) 30 min 3.00 mm ± 0.09 mm
Disintegration* (n = 6) 3× per run NMT 5 min
Friability* (sample weight = 6.5 g) 3× per run NMT 1.0%
*Tested at the beginning, middle and end of the run.
Updated Risk Assessment of the Tablet Compression Process Variables
The risks identified during the initial assessment of the compression step were reduced
through development studies. The updated risk assessment is presented in Table 49.
Table 49. Updated risk assessment of the tablet compression process variables
Process Step: Tablet Compression
Drug Product CQAs: Content Uniformity, Dissolution
Variables Drug Product CQAs Risk Assessment Justification for the Reduced Risks
Blend compressibility
and compactability
Dissolution Low
Compression force can be adjusted to
accommodate the acceptable ribbon relative
density (0.68-0.81) in order to achieve the
target tablet hardness. The risk is reduced
from high to low.
Feeder frame paddle
speed
Content Uniformity Low
Feeder frame paddle speed in the range of 8-
20 rpm had no impact on CU or dissolution.
The same tablet press model will be used for
pilot scale and commercial scale manufacture.
If necessary, slight adjustments in the feeder
frame paddle speed may be made when all
stations are utilized. The risk is reduced from
high to low.
Dissolution Low
Main compression force Dissolution Low
Tablet hardness increases with compression
force. Within the compression force range
studied, the resulting tablet hardness did not
adversely affect dissolution and > 90%
dissolution at 30 min was achieved. The risk is
reduced from high to low.
Press speed (dwell time)
Content Uniformity Low A press speed of 20-60 rpm had no impact on
CU or dissolution. Thus, the risk is reduced
from high to low.Dissolution Low
2.3.6 Scale-Up from Lab to Pilot Scale and Commercial Scale
Note to Reader: Currently, scale-up information is limited at the time of submission. The
applicant should discuss product specific scale-up principles including their planned
approach to scale-up the process. OGD will evaluate the applicant’s plan to determine
April 2012 90
Example QbD IR Tablet Module 3 Quality 3.2.P.2 Pharmaceutical Development
its adequacy. However, if a substantial amendment needs to be submitted due to the
inadequacy of the scale-up plan, it may significantly extend the review process. It is the
firm’s discretion to submit scale-up data such as actual process verification information
at the time of submission for a complex drug product which has a high risk of scale-up
failure; however, in some cases it may be requested by OGD.
Process development was conducted on the lab scale (5.0 kg). This section describes the
principles used to scale-up the process to the pilot scale (50.0 kg) in order to manufacture
the exhibit batch. The same principles will be employed to scale-up the process to the
commercial scale upon approval. Table 50 summarizes the different process scales.
Table 50. Process scale summary
Scale Batch Size Units
-- (kg) --
Lab (Process Development) 5.0 25,000
Pilot (Exhibit) 50.0 250,000
Commercial (Proposed) 150.0 750,000
2.3.6.1 Scale-Up of the Pre-Roller Compaction Blending and Lubrication Process
The process development work for the pre-roller compaction blending and lubrication
step was carried out in a 16 qt capacity twin shell V-blender. To scale-up, it was desirable
to maintain geometric, dynamic and kinematic similarity by applying the following rules:
 Geometric similarity: keeping the ratio of all lengths constant (constant fill ratio)
 Dynamic similarity: maintaining constant forces (Froude number Fr)
g
Rrpm
Fr
2

rpm: revolutions per minute
R: characteristic radius
g: gravitational constant
 Kinematic similarity: maintaining a consistent number of revolutions (rpm ×
minutes)
At the pilot scale, the fill level was 74%. This was slightly higher than the fill level at lab
scale which was 63%. The rotation speed at both scales was fixed due to equipment
constraints. Although the target blending endpoint could be estimated by maintaining
similarity between the scales, the final endpoint was determined using the validated in-
line NIR method (details provided in Section 3.2.P.5.3 Validation of Analytical
Procedures). To assess homogeneity of the blend, a moving block % RSD was calculated
for each moving block of ten consecutive spectra and plotted as a function of time. The
blend was considered uniform once the % RSD was below 5% for ten consecutive
measurements.
April 2012 91
Example QbD IR Tablet Module 3 Quality 3.2.P.2 Pharmaceutical Development
The pre-roller compaction blending and lubrication process scale-up is summarized in
Table 51.
Table 51. Scale up of pre-roller compaction blending and lubrication
Scale Batch size
Blender
capacity
Volume
fill level
Rotation
speed
Nrev*
-- (kg) (units) (L) (%) (rpm) Acetriptan PSD Nrev
Lab 5.0 25,000
17.6
(16 qt)
63 20
d90 = 10 μm 368
d90 = 20 μm 285
d90 = 30 μm 234
Pilot 50.0 250,000 150 74 12 285
Commercial
(Proposed)
150.0 750,000 500 67 8 To be determined
*Endpoint determined by a validated in-line NIR method
2.3.6.2 Scale-Up of the Roller Compaction and Integrated Milling Process
For this drug product, the roller compaction process first needed to be scaled up from lab
scale (using Alexanderwerk WP120 with 120 mm roll diameter and 25 mm roll width) to
pilot scale (using Alexanderwerk WP120 with 120 mm roll diameter and 40 mm roll
width) and then, ultimately, to commercial scale (using Alexanderwerk WP200 with 200
mm roll diameter and 75 mm roll width).
In a roller compaction process, there are several process parameters to consider when
scaling up to a larger, wider roller. The strategy employed for each process parameter is
discussed below.
Roller Gap
The scale-up strategy for the roller gap was to maintain the ratio between the roller gap
(S) and the roller diameter (D) for different size roller compactors. The scale-up factor for
the roller gap was calculated according to the following equation:
2
2
1
1
D
S
D
S

Roll Force or Roll Pressure
Based on the process development work, ribbon density was an intermediate critical
quality attribute for this process step and strongly affected the downstream compression
force required to meet the target tablet hardness. A commonly used strategy to scale-up
roller compaction is to control the ribbon density by maintaining the roller peak pressure
(Pmax) as described by Johanson’s model.13
According to the model, if the S/D ratio is maintained, a scale-up strategy is to obtain the
same Pmax by maintaining the Rf /(W×D) ratio where Rf is the roller force and W is the
roller width. The scale-up factor for roller force is calculated by:
April 2012 92
Example QbD IR Tablet Module 3 Quality 3.2.P.2 Pharmaceutical Development
11
22
1
2
DW
DW
R
R
f
f

If roller hydraulic pressure is used, it is necessary to obtain the conversion factor between
roller hydraulic pressure (bar) to roller force (kN) from the equipment vendor.
Alexanderwerk provided the following information:
For WP120: 0.0922 kN per cm of roller width for 1 bar roller pressure
For WP200: 0.0869 kN per cm of roller width for 1 bar roller pressure
The scale-up factor for roller pressure was calculated by:
1
2
1
2
0922.0
0869.0
D
D
R
R
P
P



Screw Speed and Roll Speed
Assuming no slip at the roller surface in the nip region (i.e., the material is moving at the
same speed as the rollers), the mass flow rate (throughput, Q, g/min) of material can be
calculated based on mass balance:
RDWSNQ 
where ρ is the ribbon density (g/cc), D is the roller diameter (cm), W is the roller width
(cm), S is the roller gap (cm) and NR is the roller rotation speed (rpm).
The powder material is conveyed to the rollers by the screw auger and the mass flow rate
is typically proportional to the screw rotation rate:
SS NCQ 
where, NS is the feed screw rotation speed (rpm) and CS is the amount of material
conveyed by the screw per rotation (g/rotation) which can be determined experimentally.
To achieve the target ribbon density for the given roller gap, the ratio of screw speed to
roller speed was maintained constant by setting the two equations for mass flow rate
equal to each other as shown below:
SR
S
C
DWS
N
N 

Mill Screen Orifice Size and Mill Speed
Mill screen orifice size is a scale-independent variable; therefore, it is kept constant upon
scale-up. During development, mill speed was not found to be critical for any product
April 2012 93
Example QbD IR Tablet Module 3 Quality 3.2.P.2 Pharmaceutical Development
quality attributes. In practice, mill speed is set based on first-in first-out principles to
avoid ribbon accumulation in the mill.
Table 52 summarizes the roller compaction and integrated milling process scale-up.
Table 52. Scale-up of the roller compaction and integrated milling process
Scale Batch Size
Alexanderwerk
model
Roller
width
Roller
diameter
Roller
gap
Roller
pressure
Mill screen
orifice size
-- (kg) (units) -- (mm) (mm) (mm) (bar) (mm)
Lab 5.0 25,000 WP120 25 120 1.2-2.4 20-77 1.0
Pilot 50.0 250,000 WP120 40 120 1.8 50 1.0
Commercial
(Proposed)
150.0 750,000 WP200 75 200 2.0-4.0* 31-121* 1.0
*The range is based on the scale-up equation and needs to be verified.
2.3.6.3 Scale-Up of the Final Blending and Lubrication Process
To scale-up the final blending of the granules with talc, the number of revolutions was
maintained.
A different strategy was employed to scale-up the final lubrication. Recently, an equation
for scaling up the lubrication of a 1:1 MCC:Lactose blend with magnesium stearate was
published.16
If the batch size and blender volume of the new process are known, the
number of revolutions to be used at the new process condition can be evaluated using the
following equation:
 
 2
3/1
1
3/1
2
headspace
headspace
FV
rFV
r 
where V is the blender volume, Fheadspace is the headspace fraction (calculated by 100% -
fill level %), and r is the number of revolutions. The number of revolutions needed to
lubricate the granules with magnesium stearate was calculated based on this equation.
The final blending and lubrication process scale-up is summarized in Table 53.
April 2012 94
16
Kushner IV, J., Moore, F., 2010. Scale-up model describing the impact of lubrication on tablet tensile
strength. International Journal of Pharmaceutics. 399, 19-30.
Example QbD IR Tablet Module 3 Quality 3.2.P.2 Pharmaceutical Development
un time Nrev Run time NrevR
Table 53. Scale-up of the final blending and lubrication
Scale Batch size
Blender
capacity
Volume
fill level
Rotation
speed
Final Blending Lubrication
(kg) (units) (L) (%) (rpm) (min) -- (min) --
Lab 5.0 25,000
17.6
(16 qt)
49 20 5 100 3-5 60-100
Pilot 50.0 250,000 150 56 12 8.3 100 4 48
Commercial
(Proposed)
150.0 750,000 500 50 8 12.5* 100* ~2.6-4.3* 21-35*
*To be verified
2.3.6.4 Scale-Up of the Tablet Compression Process
The same tablet press utilized during the tablet compression process development studies
was used for the pilot batch and will be used for commercial scale production. Detailed
parameters that affect the tabletting process were already explored and discussed in
Section 2.3.5. To increase throughput, all 51 stations were used at the pilot scale
successfully and will be used at the commercial scale. The press will be run at the same
speed that was studied during development (20-60 rpm). Therefore, dwell time remains
unchanged during scale-up.
2.3.7 Exhibit Batch
Based on the scale-up principles detailed in Section 2.3.6, a 50.0 kg cGMP exhibit batch
was manufactured with drug substance Lot #2 at the pilot scale and the batch was used
for the pivotal BE study. Table 54 summarizes the equipment and process parameters
used for the exhibit batch at pilot scale.
April 2012 95
Example QbD IR Tablet Module 3 Quality 3.2.P.2 Pharmaceutical Development
Table 54. Equipment and process parameters used for the exhibit batch at pilot scale
Process Steps Equipment and Process Parameters
Pre-Roller Compaction Blending
and Lubrication
150 L V-blender
o 285 revolutions (target) for blending at 12 rpm
(endpoint determined by an in-line NIR method)
Roller Compaction and Integrated
Milling
Alexanderwerk WP120 with 40 mm roller width and 120
mm roller diameter
o Roller surface: Knurled
o Roller pressure: 50 bar
o Roller gap: 1.8 mm
o Roller speed: 8 rpm
o Mill speed: 60 rpm
o Coarse screen orifice size: 2.0 mm
o Mill screen orifice size: 1.0 mm
Final Blending and Lubrication
150 L V-blender
o 100 revolutions for granule and talc blending (8.3 min
at 12 rpm
o 48 revolutions for lubrication (4 min at 12 rpm)
Tablet Compression
51 station rotary press (51 stations used)
o 8 mm standard round concave tools
o Press speed: 40 rpm
o Compression force: 8-11 kN
 Target hardness 8.0-10.0 kP
o Pre-compression force: 1.0 kN
The in-process testing and final release results are summarized in Table 55 and Table 56,
respectively.
April 2012 96
Example QbD IR Tablet Module 3 Quality 3.2.P.2 Pharmaceutical Development
Table 55. In-process testing results for the exhibit batch (Batch No. DPJM032012)
Test In-Process Controls Results
Pre-Roller Compaction Blending and Lubrication
Blend Uniformity NIR % RSD < 5% 4.9%
Roller Compaction and Integrated Milling
Ribbon relative density 0.68-0.81 0.74
Granule PSD
d10 50-150 μm 96 μm
d50 400-800 μm 611 μm
d90 800-1200 μm 925 μm
Granule Uniformity % RSD < 5% 4.3%
Flow function coefficient (ffc) > 6 7.35
Final Blending and Lubrication
Blend Uniformity % RSD < 5% 2.7%
Blend Assay 95.0-105.0% w/w 100.2% w/w
Tablet Compression
Individual tablet weight (n = 10) 200.0 mg ± 10.0 mg 197.2-202.8 mg
Composite tablet weight (n = 20) 4.00 g ± 0.12 g 4.04 g
Hardness (n = 10)
Target: 8.0-10.0 kP
Limits: 5.0-13.0 kP
8.8-9.3 kP
Thickness (n = 10) 3.00 mm ± 0.09 mm 2.97-3.03 mm
Disintegration (n = 6) NMT 5 min 1.5 min
Friability (sample weight = 6.5 g) NMT 1.0 % w/w 0.1% w/w
Table 56. Release testing results for the exhibit batch (Batch No. DPJM032012)
Test Acceptance Criteria Results
Description
White to off-white, round convex tablet embossed
with GEN-ACE and 20
White to off-white, round convex tablet
embossed with GEN-ACE and 20
Identification
A. HPLC Retention time: corresponds to standard
B. UV absorption: spectrum corresponds to standard
A. Corresponds to standard
B. Corresponds to standard
Assay 95.0-105.0% w/w of label claim 100.3% w/w
Content
Uniformity
AV < 15 AV = 4.7
Dissolution
NLT 80% in 30 minutes (in 900 mL of 0.1 N HCl with
1.0% w/v SLS using USP Apparatus 2 at 75 rpm)
96%
Degradation
Products
ACE12345: NMT 0.5%,
Individual unknown impurity: NMT 0.2%,
Total impurities: NMT 1.0%
ACE12345: 0.1%
Individual unknown impurity: 0.06%
Total impurities: 0.22%
Residual Solvents Complies with USP <467> Option I Complies with USP <467> Option I
2.3.8 Updated Risk Assessment of the Drug Product Manufacturing Process
During process development, the identified high risks for each process step were
addressed. Experimental studies were defined and executed in order to establish
additional scientific knowledge and understanding, to allow appropriate controls to be
developed and implemented, and to reduce the risk to an acceptable level. After detailed
experimentation, the initial manufacturing process risk assessment was updated in line
April 2012 97
Example QbD IR Tablet Module 3 Quality 3.2.P.2 Pharmaceutical Development
with the current process understanding. Table 57 presents how the application of the
control strategy to the manufacturing process has reduced the identified risks. Table 58
provides the justification for the reduced risk following process development.
Table 57. Updated risk assessment of the manufacturing process for Generic Acetriptan Tablets, 20 mg
Drug Product
CQAs
Process Steps
Pre-RC Blending
and Lubrication
Roller
Compaction
Milling
Final Blending
and Lubrication
Compression
Assay Low Low* Low Low* Low
Content Uniformity Low Low Low Low* Low
Dissolution Low Low Low Low Low
Degradation Products Low* Low* Low* Low* Low*
*The level of risk was not reduced from the initial risk assessment.
Table 58. Justification for the updated risk assessment of the manufacturing process for Generic Acetriptan Tablets, 20 mg
Process Steps Drug Product CQAs Justification for the Reduced Risks
Pre-Roller Compaction
Blending and Lubrication
Assay
An in-line NIR method was developed and validated to
determine the blending endpoint. Using the finalized
formulation, all development batches and the exhibit batch
achieved acceptable assay, CU and dissolution. The risk is
reduced from high to low for CU and from medium to low
for assay and dissolution.
Content Uniformity
Dissolution
Roller Compaction
Content Uniformity
Within a ribbon relative density range of 0.68-0.81, the
resulting PSD of the milled granules had good flowability
as measured by ffc. The risk is reduced from high to low.
Dissolution
Within a ribbon relative density range of 0.68-0.81, the
desired tablet hardness (8.0-10.0 kP) can be achieved by
adjusting the compression force. The risk of roller
compaction to impact dissolution is reduced from high to
low.
Milling
Assay The mill speed did not show a significant impact on any
drug product quality attributes. The mill screen orifice size
was found critical and set to 1.0 mm. With this selection,
all CQAs can be achieved by using the appropriate range
for roller pressure and roller gap. The risk of milling to
impact assay, CU and dissolution is reduced to low.
Content Uniformity
Dissolution
Final Blending and Lubrication Dissolution
Within the range studied, number of revolutions and
magnesium stearate specific surface area did not exhibit a
significant impact on disintegration or dissolution of the
tablets. The risk is reduced from high to low.
April 2012 98
Example QbD IR Tablet Module 3 Quality 3.2.P.2 Pharmaceutical Development
Process Steps Drug Product CQAs Justification for the Reduced Risks
Compression
Assay
The development studies demonstrated that feed frame
paddle speed and press speed did not significantly impact
the tablet weight variability, assay or CU. The risk is
reduced from high to low for CU and from medium to low
for assay.Content Uniformity
Dissolution
Within a ribbon relative density range of 0.68-0.81, the
desired tablet hardness (8.0-10.0 kP) can be achieved by
adjusting the compression force. No over-lubrication of
the blend was observed when the feed frame paddle speed
was operated within the range studied (8-20 rpm). The risk
is reduced from high to low.
2.4 Container Closure System
To be consistent with the RLD, the proposed generic drug product is intended to be
labeled for storage at 25 °C (77 °F) with excursions permitted to 15-30 °C (59-86 °F).
The innovator has chosen round white opaque HDPE bottles with an induction seal liner
and child resistant (CR) closure. Generic Acetriptan Tablets, 20 mg, will be similarly
packaged and the bottle pack details are summarized in Table 59.
Table 59. Proposed commercial packaging for Generic Acetriptan Tablets, 20 mg
Count HDPE Bottle Closure
30 Tablets 40 cc 33 mm white CR cap with pulp liner
90 Tablets 60 cc 38 mm white CR cap with pulp liner
2.5 Microbiological Attributes
An accelerated stability study of the exhibit batch demonstrated that the drug product has
low water activity and is not capable of supporting microbial growth. Routine
microbiological testing of Generic Acetriptan Tablets, 20 mg, is unnecessary due to the
low water activity of the product and controls on incoming raw materials.
2.6 Compatibility
This section is not applicable because the drug product is a solid oral dosage form and
there are no reconstitution diluents.
April 2012 99
Example QbD IR Tablet Module 3 Quality 3.2.P.2 Pharmaceutical Development
April 2012 100
2.7 Control Strategy
Note to Reader: The control strategy is “a planned set of controls, derived from current
product and process understanding, that assures process performance and product
quality. The controls can include parameters and attributes related to drug substance
and drug product materials and components, facility and equipment operating
conditions, in-process controls, finished product specifications, and the associated
methods and frequency of monitoring and control.”17
The control strategy for Generic Acetriptan Tablets, 20 mg, is built upon the outcome of
extensive product and process understanding studies. These studies investigated the
material attributes and process parameters that were deemed high risk to the CQAs of
the drug product during the initial risk assessment. In some cases, variables considered
medium risk were also investigated. Through these systematic studies, the CMAs and
CPPs were identified and the acceptable operating ranges were established. All variables
ranked as high risk in the initial risk assessment are included in the control strategy
because the conclusion of the experiments was dependant on the range(s) studied and the
complex multivariate relationship between variables. Thus, the control strategy is an
integrated overview of how quality is assured based on current process and product
knowledge. The control strategy may be further refined based on additional experience
gained during the commercial lifecycle of the product. However, any post-approval
changes should be reported to the agency in accordance with CFR 314.70 and should
follow steps as outlined by guidances used for scale-up and post-approval changes.
The control strategy for the commercial manufacture of Generic Acetriptan Tablets, 20
mg, is proposed and presented in Table 60. The control strategy includes acetriptan and
excipient material attributes to be controlled, in-process controls, high risk process
parameter ranges studied during development and the proposed operating ranges for
commercial manufacture. The purpose of the controls is also briefly discussed. The
release specification for the final product is provided in Table 61.
17
ICH Harmonised Tripartite Guideline: Q10 Pharmaceutical Quality Systems. June 2008.
Example QbD IR Tablet Module 3 Quality 3.2.P.2 Pharmaceutical Development
Table 60. Control Strategy for Generic Acetriptan Tablets, 20 mg
Factor
Attributes or
Parameters
Range studied
(lab scale)
Actual data for the
exhibit batch
(pilot scale)
Proposed range for
commercial scale1 Purpose of control
Raw Material Attributes
Acetriptan
polymorphic form*
Melting point 185-187 °C 186 °C 185-187 °C
To ensure polymorphic Form
IIIXRPD 2θ
values
2θ: 7.9°, 12.4°, 19.1°, 25.2° 2θ: 7.9°, 12.4°, 19.1°, 25.2° 2θ: 7.9°, 12.4°, 19.1°, 25.2°
Acetriptan particle size
distribution*
d90 10-45 μm 20 μm 10-30 μm To ensure in vitro
dissolution, in vivo
performance and batch-to-
batch consistency
d50 6-39 μm 12 μm 6-24 μm
d10 3.6-33.4 μm 7.2 μm 3.6-14.4 μm
Lactose
Monohydrate,
Grade A01
Particle size
distribution
d50: 70-100 µm d50: 85 µm d50: 70-10 µm
To ensure sufficient
flowability and batch-to-
batch consistencyMicrocrystalline
Cellulose (MCC),
Grade B02
Particle size
distribution
d50: 80-140 µm d50: 108 µm d50: 80-140 µm
Croscarmellose
Sodium (CCS),
Grade C03
Particle size
distribution
> 75 μm: NMT 2% > 75 μm: 1% > 75 μm: NMT 2% To ensure batch-to-batch
consistency> 45 μm: NMT 10% > 45 μm: 4% > 45 μm: NMT 10%
Talc,
Grade D04
Particle size
distribution
> 75μm: NMT 0.2% > 75μm: 0.1% >75μm: NMT 0.2%
To ensure batch-to-batch
consistency
Magnesium Stearate,
Grade E05
Specific
surface area
5.8-10.4 m2
/g 8.2 m2
/g 5.8-10.4 m2
/g
To ensure sufficient
lubrication and to reduce the
risk of retarded
disintegration and
dissolution
Pre-Roller Compaction Blending and Lubrication Process Parameters
V-blender
Number of
revolutions*
250 (25 rpm, 10 min)
100-500 (20 rpm, 5-25 min )
285 revolutions
(12 rpm, 23.8 min)
Target to be determined
based on DS PSD
In-line NIR method is used
for endpoint determination to
ensure BU is met
consistently
Blender fill
level
~50% (1.0 kg, 4 qt)
35-75% (5.0 kg, 16 qt)
~74% (50.0 kg, 150 L) ~67% (150.0 kg, 500 L)
April 2012 101
Example QbD IR Tablet Module 3 Quality 3.2.P.2 Pharmaceutical Development
Factor
Attributes or
Parameters
Range studied
(lab scale)
Actual data for the
exhibit batch
(pilot scale)
Proposed range for
1
commercial scale
Purpose of control
Pre-Roller Compaction Blending and Lubrication In-Process Controls
Blend uniformity* Blend to endpoint: < 5.0% RSD (In-line NIR method)
Roller Compaction and Integrated Milling Process Parameters
Roller compactor and
integrated mill
Equipment
Alexanderwerk WP120
(roller diameter: 120 mm;
roller width: 25 mm)
Alexanderwerk WP120
(roller diameter: 120 mm;
roller width: 40 mm)
Alexanderwerk WP200
(roller diameter: 200 mm;
roller width: 75 mm)
Fixed due to equipment
availability
Roller
pressure*
20-80 bar 50 bar 31-121 bar
To ensure desired ribbon
density, granule PSD,
uniformity and flowability
are achieved consistently
Roller gap* 1.2-2.4 mm 1.8 mm 1.2-2.4 mm
Mill speed 20-100 rpm 60 rpm 20-100 rpm
Mill screen
orifice size*
0.6-1.4 mm 1.0 mm 1.0 mm
Roller Compaction and Integrated Milling Process In-Process Controls
Ribbon relative density* 0.68-0.81
Granule particle size distribution d10* 50-150 μm
Granule particle size distribution d50* 400-800 μm
Granule particle size distribution d90* 800-1200 μm
Granule uniformity* % RSD < 5%
Granule flowability (ffc)* > 6.00
Final Blending and Lubrication Process Parameters
V-blender
Final Blending
(granules w/ talc)
Number of
revolutions
100 (25 rpm, 4 min)
100 (20 rpm, 5min)
100 revolutions
(12 rpm, 8.3 min)
100 revolutions
(8 rpm, 12.5 min) To ensure consistent mixing
of granules and talcBlender fill
level
~38% (1.0 kg, 4 qt)
~49% (5.0 kg, 16 qt)
~56% (50.0 kg, 150 L) ~50% (150.0 kg, 500 L)
V-blender
Lubrication
(magnesium stearate)
Number of
revolutions
75 (25 rpm, 3 min)
60-100 (20 rpm, 3-5 min)
48 revolutions
(12 rpm, 4 min)
21-35 revolutions
(8 rpm, 2.6-4.3 min)
To ensure lubricant is well
distributed and to avoid
over-lubricationBlender fill
level
~38% (1.0 kg, 4 qt)
~49% (5.0 kg, 16 qt)
~56% (50.0 kg, 150 L) ~50% (150.0 kg, 500 L)
April 2012 102
Example QbD IR Tablet Module 3 Quality 3.2.P.2 Pharmaceutical Development
April 2012 103
(pilot scale)
Factor
Attributes or
Parameters
Range studied
(lab scale)
Actual data for the
exhibit batch
Proposed range for
commercial scale1 Purpose of control
Final Blending and Lubrication Process In-Process Controls
Blend uniformity* % RSD < 5%
Blend assay* 95.0-105.0% w/w
Tablet Compression Process Parameters
Rotary press
Feeder frame
paddle speed
8-20 rpm 15 rpm 8-20 rpm
To ensure all tablet CQAs
(assay, CU and drug release)
are met consistently
Press speed 20-60 rpm 40 rpm 20-60 rpm
Pre-
compression
force
1.0 kN 1.0 kN 1.0 kN
Compression
force*
5-15 kN 8-11 kN
To be determined based on
ribbon relative density
Tablet Compression In-Process Controls
Individual weight (n = 10; every 20 min) 200.0 mg ± 10.0 mg
Composite weight (n = 20; every 20 min) 4.00 g ± 0.12 g
Hardness (n = 10; every 20 min) Target: 8.0-10.0 kP, Limits: 5.0-13.0 kP
Thickness (n = 10; every 20 min) 3.00 mm ± 0.09 mm
Disintegration (n = 6; 3× during run) NMT 5 min
Friability (sample weight = 6.5 g; 3× during run) NMT 1.0 %
*critical input material attributes (CMA), critical process parameters (CPP) or critical quality attributes (CQA) of in-process material or final drug product
1
The proposed operating range for commercial scale will be qualified and continually verified.
Example QbD IR Tablet Module 3 Quality 3.2.P.2 Pharmaceutical Development
Table 61. Generic Acetriptan Tablets, 20 mg release specification
Test Acceptance Criteria
Description
White to off-white, round convex tablet embossed with
GEN-ACE and 20
Identification
A. HPLC Retention time: corresponds to standard
B. UV absorption: spectrum corresponds to standard
Assay 95.0-105.0% w/w of label claim
Content Uniformity AV < 15
Dissolution
NLT 80% in 30 minutes (in 900 mL of 0.1 N HCl with
1.0% w/v SLS using USP Apparatus 2 at 75 rpm)
Degradation
Products
ACE12345: NMT 0.5%,
Individual unknown impurity: NMT 0.2%,
Total impurities: NMT 1.0%
Residual Solvents Complies with USP <467> Option I
2.7.1 Control Strategy for Raw Material Attributes
The drug substance particle size distribution limits arise from a combination of its impact
on blending and in vivo performance. The pilot PK study suggested that Generic
Acetriptan Tablets, 20 mg, with a drug substance d90 of 30 μm (d50 of 24 μm) or less
would be bioequivalent to the RLD. During formulation development, a particle size
distribution with a d90 value greater than 14 μm was found to ensure good flow and
content uniformity using a fixed blending process. However, implementing a validated
in-line NIR method to determine the blending endpoint during process development
allowed acceptable blending uniformity and tablet CQAs to be achieved using a drug
substance d90 in the range of 10-30 μm.
Excipient particle size distribution specifications were based on the attributes of the
selected grades. For lactose and microcrystalline cellulose, an in-house limit is set on d50
to ensure batch-to-batch consistency.
Based on the analysis of dissolution data collected during formulation development and
the results of the pilot PK study, the dissolution medium with 1.0% w/v SLS was more
sensitive to product differences than the FDA-recommended method using medium with
2.0% w/v SLS. For this reason, 1.0% w/v SLS is used in the dissolution medium for the
release method in the control strategy.
2.7.2 Control Strategy for Pre-Roller Compaction Blending and Lubrication
The updated risk assessment (Table 37) for the pre-roller compaction blending and
lubrication process step demonstrates that the identified risks to blend uniformity have
been reduced by adjusting the number of revolutions to accommodate different acetriptan
particle size distributions. A validated in-line NIR method for monitoring the blend
uniformity was developed, validated and implemented to terminate the blending based on
April 2012 104
Example QbD IR Tablet Module 3 Quality 3.2.P.2 Pharmaceutical Development
feedback control when the moving block % RSD of ten consecutive spectra is below 5%
for ten consecutive measurements.
2.7.3 Control Strategy for Roller Compaction and Integrated Milling
The intent of the control strategy for roller compaction is to maintain the ribbon density
within the required range to ensure drug product CQAs are met. To maintain a ribbon
relative density of 0.68-0.81 during routine operation, the roller pressure and roller gap
will be controlled. The ribbon density will be monitored as an in-process control during
roller compaction.
For milling, the mill screen orifice size (1.0 mm) was selected to ensure that the granule
size distribution remains within the acceptable range. The acceptable range for mill speed
(20-100 rpm) was established and can be adjusted within the range to accommodate
different throughput from the roller compaction step. If a change to the mill screen orifice
size is made (e.g., increase or decrease) then the impact on granule size distribution and
assay of sieve cuts will be reassessed across the pre-defined ribbon density range.
2.7.4 Control Strategy for Final Blending and Lubrication
The control strategy for blending the granules with talc is to maintain the targeted number
of revolutions. For the granule lubrication with magnesium stearate, the control strategy
is to adjust the number of revolutions based on the blender capacity used (headspace) and
the volume of the V-blender according to the scientific literature.
2.7.5 Control Strategy for Tablet Compression
The control strategy for compression is to maintain the in-process tablet attributes of
weight, hardness, thickness, friability and disintegration within the required ranges. The
fill cam below the die table adjusts the lower punch to the appropriate height to control fill
depth and ultimately tablet weight. The target compression force required to produce
tablets with the desired hardness, and ultimately friability and disintegration, is established
at the beginning of each run. After tablets with the target weight and hardness are
obtained during the tablet press set-up, the upper punch penetration depth and the fill
depth are fixed. The compression force is continuously measured throughout the run for
each tablet and compared to the target compression force. The main compression height
is automatically adjusted to keep the average force as close as possible to the target set
point. Upper and lower limits of compression force are set and any tablet that registers a
compression force outside these limits is automatically rejected by the tablet press.
April 2012 105
Example QbD IR Tablet Module 3 Quality 3.2.P.2 Pharmaceutical Development
April 2012 106
2.7.6 Product Lifecycle Management and Continual Improvement
Upon approval, the manufacturing process for Generic Acetriptan Tablets, 20 mg, will be
validated using the lifecycle approach that employs risk-based decision making
throughout the drug product lifecycle as defined in the FDA process validation
guidance.18
The QbD approach taken during pharmaceutical development of Generic Acetriptan
Tablets, 20 mg, facilitated product and process understanding relevant to Stage 1 (Process
Design) of process validation. During Stage 1, the commercial manufacturing process
was defined based on knowledge gained through development and scale up activities and
a strategy for process control was developed. The goal of Stage 2 (Process Qualification)
is to evaluate if the process is capable of reproducible commercial manufacturing. The
manufacturing facility will be designed according to cGMP regulations on Building and
Facilities.19
Activities will be taken to demonstrate that utilities and equipment are
suitable for their intended use and perform properly. The protocol for process
performance qualification will be written, reviewed, approved, and then executed to
demonstrate that the commercial manufacturing process performs as expected. The goal
of Stage 3 (Continued Process Verification) is continual assurance that the process
remains in a state of control (the validated state) during commercial manufacture.
Throughout the product lifecycle, the manufacturing process performance will be
monitored to ensure that it is working as anticipated to deliver the product with desired
quality attributes. Process stability and process capability will be measured and
evaluated. If any unexpected process variability is detected, appropriate actions will be
taken to correct, anticipate, and prevent future problems so that the process remains in
control. The additional knowledge gained during routine manufacturing will be utilized for
adjustment of process parameters as part of the continual improvement of the drug product.
As a commitment, the regulatory agency will be notified in accordance with CFR 314.70
regarding each change in each condition beyond the variability already provided in this
application.
18
U.S. Food and Drug Administration. Guidance for Industry. Process Validation: General Principles and
Practices. January 2011.
19
21 CFR Part 211 Current Good Manufacturing Practice for Finished Pharmaceuticals, Subpart C.
Example QbD IR Tablet Module 3 Quality 3.2.P.2 Pharmaceutical Development
List of Abbreviations
April 2012 107
ANDA: Abbreviated New Drug Application
ANOVA: Analysis of Variance
AUC: Area under the Curve
AV: Acceptance Value
BE: Bioequivalence
BU: Blending Uniformity
CCS: Croscarmellose Sodium
CFR: Code of Federal Regulations
CMA: Critical Material Attribute
Cmax: Maximum Plasma Concentration
CPP: Critical Process Parameter
CQA: Critical Quality Attribute
CU: Content Uniformity
df: degrees of freedom
DOE: Design of Experiments
DS: Drug Substance
DSC: Differential Scanning Calorimetry
ffc: flow function coefficient
ICH: International Conference on Harmonization
IR: Immediate Release
LOD: Loss on Drying
MCC: Microcrystalline Cellulose
N/A: Not applicable
ND: Not detected
NIR: Near-infrared
NLT: Not Less Than
NMT: Not More Than
No.: Number
Nrev: Number of revolutions
PK: Pharmacokinetic
PSD: Particle Size Distribution
QbD: Quality by Design
QTPP: Quality Target Product Profile
R2
: Coefficient of Determination
RC: Roller Compaction
RLD: Reference Listed Drug (Product)
RSD: Relative Standard Deviation
RT: Room Temperature
SLS: Sodium Lauryl Sulfate
TI: Tolerance interval
Tmax: Time for achieving Maximum Plasma Concentration
XRPD: X-Ray Powder Diffraction

More Related Content

PDF
QbD MR Tablets - FDA Example
PPTX
Quality by Design : Quality Target Product Profile & Critical Quality Attrib...
PDF
Validation of liquids
PPTX
In Process Quality Control (IPQC) of pharmaceutical dosage form in Pharmaceut...
PDF
LIBRO TECNOLOGIA FARMACEUTICA JL VILA JATO.pdf
PDF
Informe 37 OMS Buenas Practicas de Manufactura-1.pdf
PPTX
Biowaivers
QbD MR Tablets - FDA Example
Quality by Design : Quality Target Product Profile & Critical Quality Attrib...
Validation of liquids
In Process Quality Control (IPQC) of pharmaceutical dosage form in Pharmaceut...
LIBRO TECNOLOGIA FARMACEUTICA JL VILA JATO.pdf
Informe 37 OMS Buenas Practicas de Manufactura-1.pdf
Biowaivers

What's hot (20)

PPTX
Process validation of tablets
PPT
Presentation ICH Q8 annex QbD- november 2008
PDF
QBD Quality by design for Immediate release dosage form
PPTX
Quality target product profile (QTPP)
PDF
CCP and CQA concept .pdf
PPTX
paharmaceutical packaging Medical device Packaging types of medical device p...
PPTX
Objectives and policies of c gmp, layout of building and services
PPT
PPTX
CMA-CPP-CQA for oral solid dosageform
PPTX
STABILITY TESTING DURING PRODUCT DEVELOPMENT
PPTX
Formulation and development of parenterals
PPTX
Snda
PPTX
505 (b) (2)
PPTX
Pharmaceutical Quality by Design (QbD)
PPTX
ICH Q8 GUIDELINES OF QUALITY BY DESIGN(PRODUCT DEVELOPEMENT)
PPTX
IPQC and FPQC for tablets
PDF
ICH Stability Studies
PPTX
Ipqc tests for tablet
PPTX
ICH Guidelines for stability testing
PPTX
NEW ERA OF DRUG PRODUCT: OPPORTUNITIES AND CHALLENGES
Process validation of tablets
Presentation ICH Q8 annex QbD- november 2008
QBD Quality by design for Immediate release dosage form
Quality target product profile (QTPP)
CCP and CQA concept .pdf
paharmaceutical packaging Medical device Packaging types of medical device p...
Objectives and policies of c gmp, layout of building and services
CMA-CPP-CQA for oral solid dosageform
STABILITY TESTING DURING PRODUCT DEVELOPMENT
Formulation and development of parenterals
Snda
505 (b) (2)
Pharmaceutical Quality by Design (QbD)
ICH Q8 GUIDELINES OF QUALITY BY DESIGN(PRODUCT DEVELOPEMENT)
IPQC and FPQC for tablets
ICH Stability Studies
Ipqc tests for tablet
ICH Guidelines for stability testing
NEW ERA OF DRUG PRODUCT: OPPORTUNITIES AND CHALLENGES
Ad

Viewers also liked (20)

PPTX
Risk Assessment for Control of Elemental Impurities.
PPTX
Pharmaceutical Quality System
PPTX
New WHO Guidance on Analytical Method Validation
PPTX
Quality by Design : Critical Material attributes ,Process parameters and its ...
PPTX
WHO Guidance on Preparation of Laboratory Information File
PPTX
US FDA Quality Metrics Technical Conformance Guide
PPTX
Blend and Content Uniformity : Industry Recommendations for Way Forward
PPTX
Key Components of Pharmaceutical QbD, an Introduction
PPTX
Content Uniformity and Blend Uniformity : Why FDA Withdrew the 2002 Guidance
PPTX
New Drug Application [NDA]
PPTX
Quality by Design : Design Space
PPTX
Quality by Design : Design of experiments
PPTX
Quality Risk management Application of FMEA
DOCX
PharmaceuticalQuality by Design (QbD) An Introduction Process Development a...
PDF
University Change Management Plan
PPTX
PPTX
Calculation of Risk Priority Numbar
Risk Assessment for Control of Elemental Impurities.
Pharmaceutical Quality System
New WHO Guidance on Analytical Method Validation
Quality by Design : Critical Material attributes ,Process parameters and its ...
WHO Guidance on Preparation of Laboratory Information File
US FDA Quality Metrics Technical Conformance Guide
Blend and Content Uniformity : Industry Recommendations for Way Forward
Key Components of Pharmaceutical QbD, an Introduction
Content Uniformity and Blend Uniformity : Why FDA Withdrew the 2002 Guidance
New Drug Application [NDA]
Quality by Design : Design Space
Quality by Design : Design of experiments
Quality Risk management Application of FMEA
PharmaceuticalQuality by Design (QbD) An Introduction Process Development a...
University Change Management Plan
Calculation of Risk Priority Numbar
Ad

Similar to QbD IR Tablets - FDA Example (20)

PPTX
QUALITY BY DESIGN qbd quality by design cad cadd
PPT
Dr_N_Dharmadhikari_-QbD_in_Product_Development.ppt
PDF
Jennifer maguire and karen bernard
PPTX
Quality by Design ( QbD )
PPTX
FOR MASTERS IN PHARMACEUTICS STUDENTS ICH Q8 GUIDELINES OF QUALITY BY DESIGN
PDF
Jannin...camilo marambio
PPTX
Quality by-design in pharmaceutical development
PPTX
ICH Q-8 Quality by Design
PPTX
Quality by Design
PPTX
Ich q8 guidelines cadd
PPTX
PDF
Pharmaceutical Development_Mohana (1).pdf
PPTX
Quality by design (QbD) and process analytical technology (PAT)
PPTX
An insight on quality by design in pharmaceutical
PDF
Quality by design pharma
PPTX
Quality-By-Design In Pharmaceutical Development
PDF
Risk Assessment Of Phytochemicals In Food Novel Approaches Forschungsberichte...
PDF
Scoping insight final publication (1)
PDF
QbD Model Case Study of VACCINE : A-Vax.
QUALITY BY DESIGN qbd quality by design cad cadd
Dr_N_Dharmadhikari_-QbD_in_Product_Development.ppt
Jennifer maguire and karen bernard
Quality by Design ( QbD )
FOR MASTERS IN PHARMACEUTICS STUDENTS ICH Q8 GUIDELINES OF QUALITY BY DESIGN
Jannin...camilo marambio
Quality by-design in pharmaceutical development
ICH Q-8 Quality by Design
Quality by Design
Ich q8 guidelines cadd
Pharmaceutical Development_Mohana (1).pdf
Quality by design (QbD) and process analytical technology (PAT)
An insight on quality by design in pharmaceutical
Quality by design pharma
Quality-By-Design In Pharmaceutical Development
Risk Assessment Of Phytochemicals In Food Novel Approaches Forschungsberichte...
Scoping insight final publication (1)
QbD Model Case Study of VACCINE : A-Vax.

More from GMP EDUCATION : Not for Profit Organization (20)

PPTX
New PICS Guidance on Data Integrity and Management.
PPTX
New WHO Guidance on CS Validation
PPTX
New WHO Guidance on Process Validation
PPTX
ASTM Standard E 2500 for Commissioning and Qualifications
PPTX
US FDA - EU Process Validation : Determination of Number of PPQ Batches
PPTX
Presentation on US FDA Data Integrity Guidance.
PPTX
Quality Risk Assessmsnt for Environmental Monitoring
PPTX
Understanding and Preventing Clean Room Contamination
PPTX
Process Validation of Legacy Products
PPTX
WHO Guidance on Technology Transfers
PPTX
Who Guidelines for Preparing SMF
PPTX
Validation of Microbiological Methods
PPTX
Presentation on EU GMP Annex 16 - Certification by QP
PPTX
WHO Good Practices for Microbiology Labs.
PPTX
Who Guidance on Quality Risk Management
PPTX
Water for Pharmaceutical Purposes - New USP Requriements
PPTX
Who Guidance on Process Validation for Non Serile Pharmaceuticals
PPTX
Who Guidance on Handling Potent/ Hazardous Substances
PPTX
WHO Guidance on HVAC Systems for Non Sterile Pharmaceuticals
PPTX
Handling of Out of Specification Results
New PICS Guidance on Data Integrity and Management.
New WHO Guidance on CS Validation
New WHO Guidance on Process Validation
ASTM Standard E 2500 for Commissioning and Qualifications
US FDA - EU Process Validation : Determination of Number of PPQ Batches
Presentation on US FDA Data Integrity Guidance.
Quality Risk Assessmsnt for Environmental Monitoring
Understanding and Preventing Clean Room Contamination
Process Validation of Legacy Products
WHO Guidance on Technology Transfers
Who Guidelines for Preparing SMF
Validation of Microbiological Methods
Presentation on EU GMP Annex 16 - Certification by QP
WHO Good Practices for Microbiology Labs.
Who Guidance on Quality Risk Management
Water for Pharmaceutical Purposes - New USP Requriements
Who Guidance on Process Validation for Non Serile Pharmaceuticals
Who Guidance on Handling Potent/ Hazardous Substances
WHO Guidance on HVAC Systems for Non Sterile Pharmaceuticals
Handling of Out of Specification Results

Recently uploaded (20)

PPTX
job Avenue by vinith.pptxvnbvnvnvbnvbnbmnbmbh
PPTX
sales presentation، Training Overview.pptx
PDF
A Brief Introduction About Julia Allison
PPTX
CkgxkgxydkydyldylydlydyldlyddolydyoyyU2.pptx
PPTX
Starting the business from scratch using well proven technique
PPTX
DMT - Profile Brief About Business .pptx
PDF
WRN_Investor_Presentation_August 2025.pdf
PDF
Nidhal Samdaie CV - International Business Consultant
PPTX
Lecture (1)-Introduction.pptx business communication
PPTX
New Microsoft PowerPoint Presentation - Copy.pptx
PPT
340036916-American-Literature-Literary-Period-Overview.ppt
DOCX
unit 2 cost accounting- Tender and Quotation & Reconciliation Statement
PPT
Chapter four Project-Preparation material
PDF
Ôn tập tiếng anh trong kinh doanh nâng cao
PDF
Elevate Cleaning Efficiency Using Tallfly Hair Remover Roller Factory Expertise
PPT
Data mining for business intelligence ch04 sharda
PDF
Stem Cell Market Report | Trends, Growth & Forecast 2025-2034
PDF
MSPs in 10 Words - Created by US MSP Network
PDF
The FMS General Management Prep-Book 2025.pdf
DOCX
unit 1 COST ACCOUNTING AND COST SHEET
job Avenue by vinith.pptxvnbvnvnvbnvbnbmnbmbh
sales presentation، Training Overview.pptx
A Brief Introduction About Julia Allison
CkgxkgxydkydyldylydlydyldlyddolydyoyyU2.pptx
Starting the business from scratch using well proven technique
DMT - Profile Brief About Business .pptx
WRN_Investor_Presentation_August 2025.pdf
Nidhal Samdaie CV - International Business Consultant
Lecture (1)-Introduction.pptx business communication
New Microsoft PowerPoint Presentation - Copy.pptx
340036916-American-Literature-Literary-Period-Overview.ppt
unit 2 cost accounting- Tender and Quotation & Reconciliation Statement
Chapter four Project-Preparation material
Ôn tập tiếng anh trong kinh doanh nâng cao
Elevate Cleaning Efficiency Using Tallfly Hair Remover Roller Factory Expertise
Data mining for business intelligence ch04 sharda
Stem Cell Market Report | Trends, Growth & Forecast 2025-2034
MSPs in 10 Words - Created by US MSP Network
The FMS General Management Prep-Book 2025.pdf
unit 1 COST ACCOUNTING AND COST SHEET

QbD IR Tablets - FDA Example

  • 1. Quality by Design for ANDAs: An Example for Immediate-Release Dosage Forms Introduction to the Example This is an example pharmaceutical development report illustrating how ANDA applicants can move toward implementation of Quality by Design (QbD). The purpose of the example is to illustrate the types of pharmaceutical development studies ANDA applicants may use as they implement QbD in their generic product development and to promote discussion on how OGD would use this information in review. Although we have tried to make this example as realistic as possible, the development of a real product may differ from this example. The example is for illustrative purposes and, depending on applicants’ experience and knowledge, the degree of experimentation for a particular product may vary. The impact of experience and knowledge should be thoroughly explained in the submission. The risk assessment process is one avenue for this explanation. At many places in this example, alternative pharmaceutical development approaches would also be appropriate. Notes to the reader are included in italics throughout the text. Questions and comments may be sent to GenericDrugs@fda.hhs.gov April 2012 1
  • 2. Example QbD IR Tablet Module 3 Quality 3.2.P.2 Pharmaceutical Development Pharmaceutical Development Report Example QbD for IR Generic Drugs Table of Contents 1.1 Executive Summary.................................................................................................................. 4 1.2 Analysis of the Reference Listed Drug Product ....................................................................... 6 1.2.1 Clinical .................................................................................................................................6 1.2.2 Pharmacokinetics..................................................................................................................7 1.2.3 Drug Release ........................................................................................................................7 1.2.4 Physicochemical Characterization........................................................................................8 1.2.5 Composition .........................................................................................................................8 1.3 Quality Target Product Profile for the ANDA Product ............................................................ 9 1.4 Dissolution Method Development and Pilot Bioequivalence Studies.................................... 13 1.4.1 Dissolution Method Development......................................................................................13 1.4.2 Pilot Bioequivalence Study ................................................................................................14 2.1 Components of Drug Product ................................................................................................. 18 2.1.1 Drug Substance...................................................................................................................18 2.1.1.1 Physical Properties.......................................................................................................18 2.1.1.2 Chemical Properties .....................................................................................................21 2.1.1.3 Biological Properties ....................................................................................................22 2.1.2 Excipients ...........................................................................................................................25 2.1.2.1 Excipient Compatibility Studies....................................................................................25 2.1.2.2 Excipient Grade Selection.............................................................................................27 2.2 Drug Product........................................................................................................................... 28 2.2.1 Formulation Development..................................................................................................28 2.2.1.1 Initial Risk Assessment of the Formulation Variables..................................................28 2.2.1.2 Drug Substance Particle Size Selection for Product Development ..............................30 2.2.1.3 Process Selection ..........................................................................................................32 2.2.1.4 Formulation Development Study #1..............................................................................33 2.2.1.5 Formulation Development Study #2..............................................................................44 2.2.1.6 Formulation Development Conclusions........................................................................47 2.2.1.7 Updated Risk Assessment of the Formulation Variables..............................................48 2.2.2 Overages.............................................................................................................................49 2.2.3 Physicochemical and Biological Properties .......................................................................49 2.3 Manufacturing Process Development..................................................................................... 49 2.3.1 Initial Risk Assessment of the Drug Product Manufacturing Process ...............................52 2.3.2 Pre-Roller Compaction Blending and Lubrication Process Development.........................54 2.3.3 Roller Compaction and Integrated Milling Process Development.....................................62 2.3.4 Final Blending and Lubrication Process Development......................................................77 2.3.5 Tablet Compression Process Development........................................................................80 2.3.6 Scale-Up from Lab to Pilot Scale and Commercial Scale..................................................90 2.3.6.1 Scale-Up of the Pre-Roller Compaction Blending and Lubrication Process ...............91 2.3.6.2 Scale-Up of the Roller Compaction and Integrated Milling Process ...........................92 2.3.6.3 Scale-Up of the Final Blending and Lubrication Process ............................................94 April 2012 2
  • 3. Example QbD IR Tablet Module 3 Quality 3.2.P.2 Pharmaceutical Development 2.3.6.4 Scale-Up of the Tablet Compression Process...............................................................95 2.3.7 Exhibit Batch......................................................................................................................95 2.3.8 Updated Risk Assessment of the Drug Product Manufacturing Process ...........................97 2.4 Container Closure System....................................................................................................... 99 2.5 Microbiological Attributes...................................................................................................... 99 2.6 Compatibility .......................................................................................................................... 99 2.7 Control Strategy.................................................................................................................... 100 2.7.1 Control Strategy for Raw Material Attributes..................................................................104 2.7.2 Control Strategy for Pre-Roller Compaction Blending and Lubrication..........................104 2.7.3 Control Strategy for Roller Compaction and Integrated Milling .....................................105 2.7.4 Control Strategy for Final Blending and Lubrication.......................................................105 2.7.5 Control Strategy for Tablet Compression.........................................................................105 2.7.6 Product Lifecycle Management and Continual Improvement..........................................106 List of Abbreviations .................................................................................................................. 107 April 2012 3
  • 4. Example QbD IR Tablet Module 3 Quality 3.2.P.2 Pharmaceutical Development 1.1 Executive Summary The following pharmaceutical development report summarizes the development of Generic Acetriptan Tablets, 20 mg, a generic version of the reference listed drug (RLD), Brand Acetriptan Tablets, 20 mg. The RLD is an immediate release (IR) tablet indicated for the relief of moderate to severe physiological symptoms. We used Quality by Design (QbD) to develop generic acetriptan IR tablets that are therapeutically equivalent to the RLD. Initially, the quality target product profile (QTPP) was defined based on the properties of the drug substance, characterization of the RLD product, and consideration of the RLD label and intended patient population. Identification of critical quality attributes (CQAs) was based on the severity of harm to a patient (safety and efficacy) resulting from failure to meet that quality attribute of the drug product. Our investigation during pharmaceutical development focused on those CQAs that could be impacted by a realistic change to the drug product formulation or manufacturing process. For generic acetriptan tablets, these CQAs included assay, content uniformity, dissolution and degradation products. Acetriptan is a poorly soluble, highly permeable Biopharmaceutics Classification System (BCS) Class II compound. As such, initial efforts focused on developing a dissolution method that would be able to predict in vivo performance. The developed in-house dissolution method uses 900 mL of 0.1 N HCl with 1.0% w/v sodium lauryl sulfate (SLS) in USP apparatus 2 stirred at 75 rpm. This method is capable of differentiating between formulations manufactured using different acetriptan particle size distributions (PSD) and predicting their in vivo performance in the pilot bioequivalence (BE) study. Risk assessment was used throughout development to identify potentially high risk formulation and process variables and to determine which studies were necessary to achieve product and process understanding in order to develop a control strategy. Each risk assessment was then updated after development to capture the reduced level of risk based on our improved product and process understanding. For formulation development, an in silico simulation was conducted to evaluate the potential effect of acetriptan PSD on in vivo performance and a d90 of 30 µm or less was selected. Roller compaction (RC) was selected as the granulation method due to the potential for thermal degradation of acetriptan during the drying step of a wet granulation process. The same types of excipients as the RLD product were chosen. Excipient grade selection was based on experience with previously approved ANDA 123456 and ANDA 456123 which both used roller compaction. Initial excipient binary mixture compatibility studies identified a potential interaction between acetriptan and magnesium stearate. However, at levels representative of the final formulation, the interaction was found to be negligible. Furthermore, the potential interaction between acetriptan and magnesium stearate is limited by only including extragranular magnesium stearate. Two formulation development design of experiments (DOE) were conducted. The first DOE investigated the impact of acetriptan PSD and levels of intragranular lactose, microcrystalline cellulose and croscarmellose sodium on drug product CQAs. The second DOE studied the levels April 2012 4
  • 5. Example QbD IR Tablet Module 3 Quality 3.2.P.2 Pharmaceutical Development April 2012 5 of extragranular talc and magnesium stearate on drug product CQAs. The formulation composition was finalized based on the knowledge gained from these two DOE studies. An in-line near infrared (NIR) spectrophotometric method was validated and implemented to monitor blend uniformity and to reduce the risk associated with the pre-roller compaction blending and lubrication step. Roller pressure, roller gap and mill screen orifice size were identified as critical process parameters (CPPs) for the roller compaction and integrated milling process step and acceptable ranges were identified through the DOE. Within the ranges studied during development of the final blending and lubrication step, magnesium stearate specific surface area (5.8-10.4 m2 /g) and number of revolutions (60-100) did not impact the final product CQAs. During tablet compression, an acceptable range for compression force was identified and force adjustments should be made to accommodate the ribbon relative density (0.68-0.81) variations between batches in order to achieve optimal hardness and dissolution. Scale-up principles and plans were discussed for scaling up from lab (5.0 kg) to pilot scale (50.0 kg) and then proposed for commercial scale (150.0 kg). A 50.0 kg cGMP exhibit batch was manufactured at pilot scale and demonstrated bioequivalence in the pivotal BE study. The operating ranges for identified CPPs at commercial scale were proposed and will be qualified and continually verified during routine commercial manufacture. Finally, we proposed a control strategy that includes the material attributes and process parameters identified as potentially high risk variables during the initial risk assessments. Our control strategy also includes in-process controls and finished product specifications. The process will be monitored during the lifecycle of the product and additional knowledge gained will be utilized to make adjustments to the control strategy as appropriate. The development time line for Generic Acetriptan Tablets, 20 mg, is presented in Table 1.
  • 6. Example QbD IR Tablet Module 3 Quality 3.2.P.2 Pharmaceutical Development Table 1. Development of Generic Acetriptan Tablets, 20 mg, presented in chronological order Study Scale Page Analysis of the Reference Listed Drug product N/A 6 Evaluation of the drug substance properties N/A 18 Excipient compatibility N/A 25 In silico simulation to select acetriptan PSD for product development N/A 30 Attempted direct compression of RLD formulation Lab (1.0 kg) 32 Lab scale roller compaction process feasibility study Lab (1.0 kg) 65 Formulation Development Study #1: Effect of acetriptan PSD, MCC/Lactose ratio and CCS level Lab (1.0 kg) 33 Dissolution testing using FDA-recommended method N/A 36 In-house dissolution method development N/A 13 Formulation Development Study #2: Effect of extragranular magnesium stearate and talc level Lab (1.0 kg) 44 Formulations with different acetriptan PSD for pilot BE study Lab (1.0 kg) 14 Dissolution testing of formulations for pilot BE study N/A 16 Pilot BE Study #1001 N/A 14 Pre-roller compaction blending and lubrication process development: effect of acetriptan PSD and number of revolutions Lab (5.0 kg) 56 Development of in-line NIR method for blending endpoint determination Lab (5.0 kg) 59 Roller compaction and integrated milling process development: effect of roller pressure, roller gap, mill speed and mill screen orifice size Lab (5.0 kg) 65 Final blending and lubrication process development: effect of magnesium stearate specific surface area and number of revolutions Lab (5.0 kg) 79 Tablet compression process development: effect of main compression force, press speed, and ribbon relative density Lab (5.0 kg) 83 Scale-up strategy from lab to pilot and commercial scale N/A 90 Exhibit batch for pivotal BE study Pilot (50.0 kg) 95 1.2 Analysis of the Reference Listed Drug Product 1.2.1 Clinical The Reference Listed Drug (RLD) is Brand Acetriptan Tablets, 20 mg, and was approved in the United States in 2000 (NDA 211168) for therapeutic relief of moderate to severe symptoms. The RLD is an unscored immediate release (IR) tablet with no cosmetic coating. The tablet needs to be swallowed “as is” without any intervention. Thus, the proposed generic product will also be an unscored IR tablet with no cosmetic coating. The maximum daily dose in the label is 40 mg (i.e., one tablet twice per day). A single tablet is taken per dose with or without food. Brand Acetriptan Tablets, 20 mg, should be swallowed whole with a glass of water. April 2012 6
  • 7. Example QbD IR Tablet Module 3 Quality 3.2.P.2 Pharmaceutical Development 1.2.2 Pharmacokinetics Acetriptan is well absorbed after oral administration. The median Tmax is 2.5 hours (h) in patients. The mean absolute bioavailability of acetriptan is approximately 40%. The AUC and Cmax of acetriptan are increased by approximately 8% to 12% following oral dosing with a high fat meal. The terminal elimination half-life of acetriptan is approximately 4 hours. 1.2.3 Drug Release Drug release is usually the rate limiting process for absorption of a Biopharmaceutics Classification System (BCS) Class II compound like acetriptan due to its low solubility. Therefore, the dissolution of the RLD tablets was thoroughly evaluated. Initially, the dissolution method recommended in the FDA dissolution methods database for this product was utilized (900 mL of 0.1 N HCl with 2.0% w/v sodium lauryl sulfate (SLS) using USP apparatus 2 (paddle) at 75 rpm). The temperature of the dissolution medium was maintained at 37 ± 0.5 °C and the drug concentration was determined using UV spectroscopy at a wavelength of 282 nm. The drug release of RLD tablets was also obtained at different medium pH (pH 4.5 acetate buffer and pH 6.8 phosphate buffer) with 2.0% w/v SLS. As shown in Figure 1, RLD tablets exhibited a very rapid dissolution using the FDA-recommended method without any sensitivity to medium pH. 0 10 20 30 40 50 60 70 80 90 100 0 10 20 30 40 50 6 Time (min) DrugDissolved(%) 0 0.1 N HCl with 2.0% w/v SLS, 75 rpm pH 4.5 Acetate Buffer with 2.0% w/v SLS, 75 rpm pH 6.8 Phopshate Buffer with 2.0% w/v SLS, 75 rpm Figure 1. RLD dissolution profile in 900 mL of medium (pH as shown) with 2.0% w/v SLS using USP apparatus 2 at 75 rpm April 2012 7
  • 8. Example QbD IR Tablet Module 3 Quality 3.2.P.2 Pharmaceutical Development 1.2.4 Physicochemical Characterization The physicochemical characterization of the RLD tablet is summarized in Table 2. Characterization included determination of the level of ACE12345, a known degradant, in near expiry product. Table 2. Physicochemical characterization of Brand Acetriptan Tablets, 20 mg Description White round tablet debossed with ACE Batch No. A6970R Expiry date November 2011 Strength (mg) 20 Average weight (mg) 201.2 Score No Coating Uncoated Diameter (mm) 8.02-8.05 Thickness (mm) 2.95-3.08 Volume (mm3 ) 150.02 average measured using image analysis Hardness (kP) 7.4-10.1 Disintegration time (min) 1.4-1.6 Disintegration observation Rapidly disintegrates into fine powder Assay (% w/w of label claim) 99.7-100.2 Related Compound 1 (RC1) (%) ND Related Compound 2 (RC2) identified as ACE12345 (%) 0.41-0.44 Related Compound 3 (RC3) (%) ND Related Compound 4 (RC4) (%) ND Highest individual unknown (%) 0.07-0.09 1.2.5 Composition Based on the RLD labeling, patent literature and reverse engineering, Table 3 lists the composition of Brand Acetriptan Tablets, 20 mg. The level provided for each excipient is consistent with previous experience and is below the level listed in the inactive ingredient database (IID) for FDA-approved oral solid dosage forms. Table 3. Composition of Brand Acetriptan Tablets, 20 mg Component Function Unit (mg per tablet) Unit (% w/w) Acetriptan, USP Active 20.0 10 Lactose Monohydrate, NF Filler 64-86 32-43 Microcrystalline Cellulose (MCC), NF Filler 72-92 36-46 Croscarmellose Sodium (CCS), NF Disintegrant 2-10 1-5 Magnesium Stearate, NF* Lubricant 2-6 1-3 Talc, NF Glidant/Lubricant 1-10 0.5-5 Total tablet weight 200 100 *Magnesium stearate level estimated by EDTA titration of magnesium. April 2012 8
  • 9. Example QbD IR Tablet Module 3 Quality 3.2.P.2 Pharmaceutical Development 1.3 Quality Target Product Profile for the ANDA Product Note to Reader: The quality target product profile (QTPP) is “a prospective summary of the quality characteristics of a drug product that ideally will be achieved to ensure the desired quality, taking into account safety and efficacy of the drug product.” 1 The QTPP is an essential element of a QbD approach and forms the basis of design of the generic product. For ANDAs, the target should be defined early in development based on the properties of the drug substance (DS), characterization of the RLD product and consideration of the RLD label and intended patient population. The QTPP includes all product attributes that are needed to ensure equivalent safety and efficacy to the RLD. This example is for a simple IR tablet; other products would include additional attributes in the QTPP. By beginning with the end in mind, the result of development is a robust formulation and manufacturing process with a control strategy that ensures the performance of the drug product. A critical quality attribute (CQA) is “a physical, chemical, biological, or microbiological property or characteristic that should be within an appropriate limit, range, or distribution to ensure the desired product quality.”1 The identification of a CQA from the QTPP is based on the severity of harm to a patient should the product fall outside the acceptable range for that attribute. All quality attributes are target elements of the drug product and should be achieved through a good quality management system as well as appropriate formulation and process design and development. From the perspective of pharmaceutical development, we only investigate the subset of CQAs of the drug product that also have a high potential to be impacted by the formulation and/or process variables. Our investigation culminates in an appropriate control strategy. Based on the clinical and pharmacokinetic (PK) characteristics as well as the in vitro dissolution and physicochemical characteristics of the RLD, a quality target product profile (QTPP) was defined for Generic Acetriptan Tablets, 20 mg (see Table 4). 1 ICH Harmonised Tripartite Guideline: Q8(R2) Pharmaceutical Development. August 2009. April 2012 9
  • 10. Example QbD IR Tablet Module 3 Quality 3.2.P.2 Pharmaceutical Development April 2012 10 Table 4. Quality Target Product Profile (QTPP) for Generic Acetriptan Tablets, 20 mg QTPP Elements Target Justification Dosage form Tablet Pharmaceutical equivalence requirement: same dosage form Dosage design Immediate release tablet without a score or coating Immediate release design needed to meet label claims Route of administration Oral Pharmaceutical equivalence requirement: same route of administration Dosage strength 20 mg Pharmaceutical equivalence requirement: same strength Pharmacokinetics Immediate release enabling Tmax in 2.5 hours or less; Bioequivalent to RLD Bioequivalence requirement Needed to ensure rapid onset and efficacy Stability At least 24-month shelf-life at room temperature Equivalent to or better than RLD shelf-life Drug product quality attributes Physical Attributes Pharmaceutical equivalence requirement: Must meet the same compendial or other applicable (quality) standards (i.e., identity, assay, purity, and quality). Identification Assay Content Uniformity Dissolution Degradation Products Residual Solvents Water Content Microbial Limits Container closure system Container closure system qualified as suitable for this drug product Needed to achieve the target shelf-life and to ensure tablet integrity during shipping Administration/Concurrence with labeling Similar food effect as RLD RLD labeling indicates that a high fat meal increases the AUC and Cmax by 8-12%. The product can be taken without regard to food. Alternative methods of administration None None are listed in the RLD label. Table 5 summarizes the quality attributes of generic acetriptan tablets and indicates which attributes were classified as drug product critical quality attributes (CQAs). For this product, assay, content uniformity (CU), dissolution and degradation products are identified as the subset of CQAs that have the potential to be impacted by the formulation and/or process variables and, therefore, will be investigated and discussed in detail in subsequent formulation and process development studies. On the other hand, CQAs including identity, residual solvents and microbial limits which are unlikely to be impacted by formulation and/or process variables will not be discussed in detail in the pharmaceutical development report. However, these CQAs are still target elements of the QTPP and are ensured through a good pharmaceutical quality system and the control strategy.
  • 11. Example QbD IR Tablet Module 3 Quality 3.2.P.2 Pharmaceutical Development Table 5. Critical Quality Attributes (CQAs) of Generic Acetriptan Tablets, 20 mg Quality Attributes of the Drug Product Target Is this a CQA? Justification Physical Attributes Appearance Color and shape acceptable to the patient. No visual tablet defects observed. No Color, shape and appearance are not directly linked to safety and efficacy. Therefore, they are not critical. The target is set to ensure patient acceptability. Odor No unpleasant odor No In general, a noticeable odor is not directly linked to safety and efficacy, but odor can affect patient acceptability. For this product, neither the drug substance nor the excipients have an unpleasant odor. No organic solvents will be used in the drug product manufacturing process. Size Similar to RLD No For comparable ease of swallowing as well as patient acceptance and compliance with treatment regimens, the target for tablet dimensions is set similar to the RLD. Score configuration Unscored No The RLD is an unscored tablet; therefore, the generic tablet will be unscored. Score configuration is not critical for the acetriptan tablet. Friability NMT 1.0% w/w No Friability is a routine test per compendial requirements for tablets. A target of NMT 1.0% w/w of mean weight loss assures a low impact on patient safety and efficacy and minimizes customer complaints. Identification Positive for acetriptan Yes* Though identification is critical for safety and efficacy, this CQA can be effectively controlled by the quality management system and will be monitored at drug product release. Formulation and process variables do not impact identity. Therefore, this CQA will not be discussed during formulation and process development. Assay 100% w/w of label claim Yes Assay variability will affect safety and efficacy. Process variables may affect the assay of the drug product. Thus, assay will be evaluated throughout product and process development. Content Uniformity (CU) Conforms to USP <905> Uniformity of Dosage Units Yes Variability in content uniformity will affect safety and efficacy. Both formulation and process variables impact content uniformity, so this CQA will be evaluated throughout product and process development. Dissolution NLT 80% at 30 minutes in 900 mL of 0.1 N HCl with 1.0% w/v SLS using USP apparatus 2 at 75 rpm Yes Failure to meet the dissolution specification can impact bioavailability. Both formulation and process variables affect the dissolution profile. This CQA will be investigated throughout formulation and process development. April 2012 11
  • 12. Example QbD IR Tablet Module 3 Quality 3.2.P.2 Pharmaceutical Development April 2012 12 Quality Attributes of the Drug Product Target Is this a CQA? Justification Degradation Products ACE12345: NMT 0.5%, Any unknown impurity: NMT 0.2%, Total impurities: NMT 1.0% Yes Degradation products can impact safety and must be controlled based on compendial/ICH requirements or RLD characterization to limit patient exposure. ACE12345 is a common degradant of acetriptan and its target is based on the level found in near expiry RLD product. The limit for total impurities is also based on RLD analysis. The target for any unknown impurity is set according to the ICH identification threshold for this drug product. Formulation and process variables can impact degradation products. Therefore, degradation products will be assessed during product and process development. Residual Solvents USP <467> option 1 Yes* Residual solvents can impact safety. However, no solvent is used in the drug product manufacturing process and the drug product complies with USP <467> Option 1. Therefore, formulation and process variables are unlikely to impact this CQA. Water Content NMT 4.0% w/w No Generally, water content may affect degradation and microbial growth of the drug product and can be a potential CQA. However, in this case, acetriptan is not sensitive to hydrolysis and moisture will not impact stability. Microbial Limits Meets relevant pharmacopoeia criteria Yes* Non-compliance with microbial limits will impact patient safety. However, in this case, the risk of microbial growth is very low because roller compaction (dry granulation) is utilized for this product. Therefore, this CQA will not be discussed in detail during formulation and process development. *Formulation and process variables are unlikely to impact the CQA. Therefore, the CQA will not be investigated and discussed in detail in subsequent risk assessment and pharmaceutical development. However, the CQA remains a target element of the drug product profile and should be addressed accordingly.
  • 13. Example QbD IR Tablet Module 3 Quality 3.2.P.2 Pharmaceutical Development 1.4 Dissolution Method Development and Pilot Bioequivalence Studies Note to Reader: A pharmaceutical development report should document the selection of the dissolution method used in pharmaceutical development. This method (or methods) may differ from the FDA-recommended dissolution method and the quality control method used for release testing. 1.4.1 Dissolution Method Development Acetriptan is a BCS Class II compound displaying poor aqueous solubility (less than 0.015 mg/mL) across the physiological pH range. As such, development of a dissolution method that can act as the best available predictor of equivalent pharmacokinetics to the RLD was pursued to allow assessment of acetriptan tablets manufactured during development. The target is an immediate release product, so dissolution in the stomach and absorption in the upper small intestine is expected suggesting the use of dissolution medium with low pH. Development began with the quality control dissolution method recommended for this product by the FDA: 900 mL of 0.1 N HCl with 2.0% w/v SLS using USP apparatus 2 at 75 rpm. Initial development formulations (Batches 1-11) exhibited rapid dissolution (NLT 90% dissolved in 30 minutes (min)) and were comparable to the RLD. It became a challenge for the team to select the formulations which might perform similarly to the RLD in vivo. The solubility of acetriptan in various media was determined (Table 6) and suggests that the solubility of acetriptan in 0.1 N HCl with 1.0% w/v SLS is similar to its solubility in biorelevant media. Table 6. Acetriptan solubility in different media Media Solubility -- (mg/mL) Biorelevant FaSSGF2 0.12 Biorelevant FaSSIF-V22 0.18 0.1 N HCl with 0.5% SLS 0.075 0.1 N HCl with 1.0% SLS 0.15 0.1 N HCl with 2.0% SLS 0.3 Figure 2 presents the dissolution of the RLD in 0.1 N HCl with different SLS concentrations. April 2012 13 2 Jantratid E, Janssen N, Reppas C, and Dressman JB. Dissolution Media Simulating Conditions in the Proximal Human Gastrointestinal Tract: An Update. Pharm Res 25:1663-1676, 2008.
  • 14. Example QbD IR Tablet Module 3 Quality 3.2.P.2 Pharmaceutical Development 0 10 20 30 40 50 60 70 80 90 100 110 0 10 20 30 40 50 Time (min) DrugDissolved(%) 60 0.5% w/v SLS 1.0% w/v SLS 2.0% w/v SLS Figure 2. RLD dissolution profile in 900 mL of 0.1 N HCl with various SLS concentrations using USP apparatus 2 at 75 rpm The dissolution method selected for product development uses 900 mL of 0.1 N HCl with 1.0% w/v SLS in a dissolution apparatus equipped with paddles (speed 75 rpm) and maintained at a temperature of 37°C, followed by UV spectroscopy at a wavelength of 282 nm. Dissolution in 1.0% w/v SLS is not sensitive to medium pH (similar in 0.1 N HCl, pH 4.5 buffer and pH 6.8 buffer) (data not shown). Additionally, this method is capable of detecting dissolution changes in the drug product caused by deliberately varying the drug substance (DS) particle size distribution (PSD) (see Section 1.4.2). 1.4.2 Pilot Bioequivalence Study Note to Reader: For low solubility drugs, pilot bioequivalence (BE) studies are invaluable to demonstrate that the in vitro dissolution used is appropriate. When pilot bioequivalence studies are conducted, the following is an example of how they should be described in the development report to support controls on critical attributes such as particle size and to understand the relationship between in vitro dissolution and in vivo performance. Inclusion of formulations that perform differently will help to determine if there is a useful in vivo in vitro relationship. The formulation development studies identified drug substance particle size distribution as the most significant factor that impacts drug product dissolution (see Section 2.2.1.4). In order to understand the potential clinical relevance of drug substance particle size distribution on in vivo performance, a pilot bioequivalence (BE) study (Study # 1001) was performed in 6 healthy subjects (four-way crossover: three prototypes and the RLD at a dose of 20 mg). The formulation used to produce the three prototypes and the composition is shown in Table 7. The only difference between each prototype was the drug substance particle size distribution. Drug substance Lot #2, #3 and #4 with a d90 of 20 μm, 30 μm and 45 μm was used for prototype April 2012 14
  • 15. Example QbD IR Tablet Module 3 Quality 3.2.P.2 Pharmaceutical Development Batch 18, 19, and 20, respectively. Characterization of the drug substance lots is provided in Section 2.2.1.2, Table 19. Table 7. Formulation of Generic Acetriptan Tablets, 20 mg, used in Pilot BE Study #1001 Ingredient Function Composition (mg per tablet) (% w/w) Acetriptan Active 20.0 10.0 Intragranular Excipients Lactose Monohydrate, NF Filler 79.0 39.5 Microcrystalline Cellulose (MCC), NF Filler 79.0 39.5 Croscarmellose Sodium (CCS), NF Disintegrant 10.0 5.0 Talc, NF Glidant/lubricant 5.0 2.5 Extragranular Excipients Magnesium Stearate, NF Lubricant 1.2 0.6 Talc, NF Glidant/lubricant 5.8 2.9 Total Weight 200.0 100 The pharmacokinetic results are presented in Figure 3 and Table 8. 0 40 80 120 160 200 240 0 2 4 6 8 10 12 14 16 18 20 22 24 Time (h) PlasmaConcentration(ng/mL) RLD d90 20 μm d90 30 μm d90 45 μm Figure 3. Mean PK profiles obtained from Pilot BE Study #1001 April 2012 15
  • 16. Example QbD IR Tablet Module 3 Quality 3.2.P.2 Pharmaceutical Development Table 8. Pharmacokinetic parameters (geometric mean) from Pilot BE Study #1001 Pharmacokinetic Parameters Lot #2 (d90 20 μm) Lot #3 (d90 30 μm) Lot #4 (d90 45 μm) N/A (RLD) Drug Product Batch No. 18 19 20 A6971R AUC∞ (ng/ml h) 2154.0 2070.7 1814.6 2095.3 AUC0-t (ng/ml h) 1992.8 1910.6 1668.0 1934.5 Cmax (ng/ml) 208.55 191.07 158.69 195.89 Tmax (h) 2.0 2.5 3.0 2.5 t1/2(h) 6.0 6.0 6.0 6.0 Test/Reference AUC∞ Ratio 1.028 0.988 0.866 -- Test/Reference AUC0-t Ratio 1.030 0.988 0.862 -- Test/Reference Cmax Ratio 1.065 0.975 0.810 -- According to the literature3 , when the mean Cmax and AUC responses of 2 drug products differ by more than 12-13%, they are unlikely to meet the bioequivalence limits of 80-125%. Therefore, the predefined selection criterion was a mean particle size that yielded both a Cmax ratio and an AUC ratio for test to reference between 0.9 and 1.11. The results of the PK study indicated that a drug substance particle size distribution with a d90 of 30 µm or less showed similar in vivo performance based on test to reference ratio calculations for AUC and Cmax. A drug substance particle size distribution with a d90 of 45 µm did not meet the predefined criterion of a test to reference ratio for Cmax and AUC between 0.9 and 1.11. The results confirmed the in silico simulation data obtained during preformulation work (see Section 2.2.1.2). In order to understand the relationship between in vitro dissolution and in vivo performance, the dissolution test was performed on the three prototypes and the RLD using the in-house versus the FDA-recommended dissolution method. The results are presented in Figure 4 and Figure 5, respectively. The data indicated that the in-house dissolution method (with 1.0% w/v SLS) is capable of differentiating formulations manufactured using different drug substance particle size distributions. However, the FDA-recommended dissolution method (with 2.0% w/v SLS) is not sensitive to deliberate formulation changes in the drug substance particle size distribution for this BCS class II compound. April 2012 16 3 B.M. Davit, et al. Comparing generic and innovator drugs: a review of 12 years of bioequivalence data from the United States Food and Drug Administration. The Annals of Pharmacotherapy, 2009, 43: 1583-1597.
  • 17. Example QbD IR Tablet Module 3 Quality 3.2.P.2 Pharmaceutical Development 0 10 20 30 40 50 60 70 80 90 100 0 10 20 30 40 50 60 Time (min) DrugDissolved(%) RLD d90 20 μm d90 30 μm d90 45 μm Figure 4. Dissolution of acetriptan tablets (RLD and three prototypes) using in-house method (900 mL of 0.1 N HCl with 1.0% w/v SLS using USP apparatus 2 at 75 rpm) 0 10 20 30 40 50 60 70 80 90 100 110 0 10 20 30 40 50 60 Time (min) DrugDissolved(%) RLD d90 20 μm d90 30 μm d90 45 μm Figure 5. Dissolution of acetriptan tablets (RLD and three prototypes) using FDA-recommended method (900 mL of 0.1 N HCl with 2.0% w/v SLS using USP apparatus 2 at 75 rpm) The AUC0-t ratio and Cmax ratio between the prototypes and the RLD were plotted versus the percentage of drug dissolved using both the in-house and FDA-recommended dissolution methods. The results are presented in Figure 6 and suggest that dissolution testing in medium with 1.0% w/v SLS and a 30 minute endpoint is predictive of the in vivo performance. However, the dissolution testing in medium with 2.0% w/v SLS was not able to predict the in vivo performance differences due to the drug substance particle size changes. April 2012 17
  • 18. Example QbD IR Tablet Module 3 Quality 3.2.P.2 Pharmaceutical Development 0.75 0.85 0.95 1.05 1.15 0 10 20 30 40 50 60 70 80 90 100 Drug Dissolved in 30 min (%) PKParameterRatio AUC0-t Ratio, medium with 1.0% w/v SLS Cmax Ratio, medium with 1.0% w/v SLS AUC0-t Ratio, medium with 2.0% w/v SLS Cmax Ratio, medium with 2.0% w/v SLS Figure 6. AUC0-t ratio and Cmax ratio as a function of the percentage of drug dissolved in 30 minutes A dissolution rate of not less than (NLT) 80% in 30 minutes in 0.1 N HCl with 1.0% w/v SLS was set as the target for pharmaceutical development studies based on the fact that Batch 19 (d90 30 μm) showed 80.8% dissolution in 30 minutes and demonstrated comparable pharmacokinetic profiles to the RLD in the pilot BE study. 2.1 Components of Drug Product 2.1.1 Drug Substance 2.1.1.1 Physical Properties Physical description: The following physical description is for acetriptan Form III. Appearance: White to off-white, crystalline powder Particle morphology: Plate-like crystals Particle size distribution: PSD of drug substance Lot #2 was measured using Malvern Mastersizer. The results were as follows: d10 – 7.2 μm; d50 – 12 μm; d90 – 20 µm. This is representative of the drug substance PSD selected for the final drug product formulation. Solid state form: To date, three different crystalline forms (Form I, II and III) have been identified and reported in the literature. The three different forms were prepared using different solvents and crystallization conditions. The solubility and the melting point are different for each of the three polymorphs. Polymorphic Form III is the most stable form and has the highest melting point. The DMF holder provides acetriptan polymorphic Form III consistently based on in-house batch analysis data April 2012 18
  • 19. Example QbD IR Tablet Module 3 Quality 3.2.P.2 Pharmaceutical Development obtained by XRPD and DSC. Stress testing confirmed that no polymorphic conversion was observed (Table 10) and Form III is stable under the stress conditions of high temperatures, high humidity, UV light and mechanical stress. Since it is the most stable form, no phase transformation during the manufacturing process is expected. The Form III melting point and characteristic 2θ values are included in the drug substance specification as a part of the control strategy. To confirm its physical stability, the final drug product was sampled during lab scale studies to evaluate whether processing conditions affected the polymorphic form of the drug substance. The XRPD data showed that the characteristics 2θ peaks of Form III of the drug substance are retained in the final drug product. Representative profiles are shown in Figure 7. An advanced XRPD technique was utilized to detect the possible phase transition in the drug product since the level of drug substance was 10% in the drug product. Drug Substance Figure 7. The XRPD profiles of drug product, MCC, lactose and drug substance The most stable polymorph (Form III) exhibits plate-like morphology as shown in Figure 8. April 2012 19
  • 20. Example QbD IR Tablet Module 3 Quality 3.2.P.2 Pharmaceutical Development Figure 8. SEM picture of acetriptan Melting point: Approximately 186 °C (Form III) Aqueous solubility as a function of pH: The solubility of acetriptan Form III in aqueous media as a function of pH was measured and is presented in Table 9. The aqueous solubility of acetriptan is low (~0.015 mg/mL) and constant across the physiological pH range due to the lipophilic nature of the molecule. Table 9. Solubility of acetriptan Form III in various media with different pH Media Solubility -- (mg/mL) 0.1 N HCl 0.015 pH 4.5 buffer 0.015 pH 6.8 buffer 0.015 Hygroscopicity: Acetriptan Form III is non-hygroscopic and requires no special protection from humidity during handling, shipping or storage. Hygroscopicity studies were carried out using a vapor sorption analyzer. The temperature was maintained at 25 °C. The material was exposed to stepwise increases in relative humidity from 10% to 90% for up to 150 minutes at each condition. The drug substance was non-hygroscopic, adsorbing less than 0.2% w/w at 90% RH. Density (Bulk, Tapped, and True) and Flowability: The bulk, tapped and true density as well as the flowability of acetriptan Form III (Lot #2 : d10 – 7.2 μm; d50 – 12 μm; d90 – 20 µm) were measured. Bulk density: 0.27 g/cc Tapped density: 0.39 g/cc True density: 0.55 g/cc The flow function coefficient (ffc) was 2.95 and the Hausner ratio was 1.44 which both indicate poor flow properties. The cohesiveness of the drug substance was also studied using a powder rheometer. The specific energy (12 mJ/g) of the drug substance indicates that the drug substance is cohesive. April 2012 20
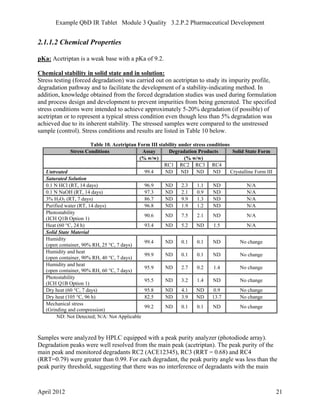
  • 21. Example QbD IR Tablet Module 3 Quality 3.2.P.2 Pharmaceutical Development 2.1.1.2 Chemical Properties pKa: Acetriptan is a weak base with a pKa of 9.2. Chemical stability in solid state and in solution: Stress testing (forced degradation) was carried out on acetriptan to study its impurity profile, degradation pathway and to facilitate the development of a stability-indicating method. In addition, knowledge obtained from the forced degradation studies was used during formulation and process design and development to prevent impurities from being generated. The specified stress conditions were intended to achieve approximately 5-20% degradation (if possible) of acetriptan or to represent a typical stress condition even though less than 5% degradation was achieved due to its inherent stability. The stressed samples were compared to the unstressed sample (control). Stress conditions and results are listed in Table 10 below. Table 10. Acetriptan Form III stability under stress conditions Stress Conditions Assay Degradation Products Solid State Form (% w/w) (% w/w) RC1 RC2 RC3 RC4 Untreated 99.4 ND ND ND ND Crystalline Form III Saturated Solution 0.1 N HCl (RT, 14 days) 96.9 ND 2.3 1.1 ND N/A 0.1 N NaOH (RT, 14 days) 97.3 ND 2.1 0.9 ND N/A 3% H2O2 (RT, 7 days) 86.7 ND 9.9 1.3 ND N/A Purified water (RT, 14 days) 96.8 ND 1.9 1.2 ND N/A Photostability (ICH Q1B Option 1) 90.6 ND 7.5 2.1 ND N/A Heat (60 °C, 24 h) 93.4 ND 5.2 ND 1.5 N/A Solid State Material Humidity (open container, 90% RH, 25 °C, 7 days) 99.4 ND 0.1 0.1 ND No change Humidity and heat (open container, 90% RH, 40 °C, 7 days) 99.9 ND 0.1 0.1 ND No change Humidity and heat (open container, 90% RH, 60 °C, 7 days) 95.9 ND 2.7 0.2 1.4 No change Photostability (ICH Q1B Option 1) 95.5 ND 3.2 1.4 ND No change Dry heat (60 °C, 7 days) 95.8 ND 4.1 ND 0.9 No change Dry heat (105 °C, 96 h) 82.5 ND 3.9 ND 13.7 No change Mechanical stress (Grinding and compression) 99.2 ND 0.1 0.1 ND No change ND: Not Detected; N/A: Not Applicable Samples were analyzed by HPLC equipped with a peak purity analyzer (photodiode array). Degradation peaks were well resolved from the main peak (acetriptan). The peak purity of the main peak and monitored degradants RC2 (ACE12345), RC3 (RRT = 0.68) and RC4 (RRT=0.79) were greater than 0.99. For each degradant, the peak purity angle was less than the peak purity threshold, suggesting that there was no interference of degradants with the main April 2012 21
  • 22. Example QbD IR Tablet Module 3 Quality 3.2.P.2 Pharmaceutical Development peak. Degradant RC1 was not observed. Degradant RC2 was formed due to oxidation and degradant RC3 was the result of further oxidation. Based on the results of the forced degradation studies, RC2 and RC3 were identified as the principal degradation products under the stress conditions. RC3 was not found under long-term stability conditions. With prolonged exposure to excessive high temperature (105 ºC, 96 hours), 14% of RC4 was observed. Overall, acetriptan is susceptible to dry heat, UV light and oxidative degradation. 2.1.1.3 Biological Properties Partition coefficient: Log P 3.55 (25 °C, pH 6.8) Caco-2 permeability: 34 × 10-6 cm/s The Caco-2 permeability is higher than the reference standard, metoprolol, which has a Caco-2 permeability of 20 × 10-6 cm/s. Therefore, acetriptan is highly permeable. Biopharmaceutics Classification: Literature and in-house experimental data support the categorization of acetriptan as a highly permeable drug substance. Based on its solubility across physiological pH (Table 9) acetriptan is designated as a low solubility drug substance. The calculated dose solubility volume is as follows: 20 mg (highest strength)/(0.015 mg/mL) = 1333 mL > 250 mL Therefore, acetriptan is considered a BCS Class II compound (low solubility and high permeability) according to the BCS guidance. 2.1.1.4 Risk Assessment of Drug Substance Attributes A risk assessment of the drug substance attributes was performed to evaluate the impact that each attribute could have on the drug product CQAs. The outcome of the assessment and the accompanying justification is provided as a summary in the pharmaceutical development report. The relative risk that each attribute presents was ranked as high, medium or low. The high risk attributes warranted further investigation whereas the low risk attributes required no further investigation. The medium risk is considered acceptable based on current knowledge. Further investigation for medium risk may be needed in order to reduce the risk. The same relative risk ranking system was used throughout pharmaceutical development and is summarized in Table 11. For each risk assessment performed, the rationale for the risk assessment tool selection and the details of the risk identification, analysis and evaluation are available to the FDA Reviewer upon request. April 2012 22
  • 23. Example QbD IR Tablet Module 3 Quality 3.2.P.2 Pharmaceutical Development Table 11. Overview of Relative Risk Ranking System Low Broadly acceptable risk. No further investigation is needed. Medium Risk is acceptable. Further investigation may be needed in order to reduce the risk. High Risk is unacceptable. Further investigation is needed to reduce the risk. Note to Reader: According to ICH Q9 Quality Risk Management, it is important to note that “it is neither always appropriate nor always necessary to use a formal risk management process (using recognized tools and/or internal procedures e.g., standard operating procedures). The use of informal risk management processes (using empirical tools and/or internal procedures) can also be considered acceptable. Appropriate use of quality risk management can facilitate but does not obviate industry’s obligation to comply with regulatory requirements and does not replace appropriate communications between industry and regulators.”4 The two primary principles should be considered when implementing quality risk management: • The evaluation of the risk to quality should be based on scientific knowledge and ultimately link to the protection of the patient; and • The level of effort, formality and documentation of the quality risk management process should be commensurate with the level of risk. Based upon the physicochemical and biological properties of the drug substance, the initial risk assessment of drug substance attributes on drug product CQAs is shown in Table 12. Table 12. Initial risk assessment of the drug substance attributes Drug Product CQAs Drug Substance Attributes Solid State Form Particle Size Distribution (PSD) Hygroscopicity Solubility Moisture Content Residual Solvents Process Impurities Chemical Stability Flow Properties Assay Low Medium Low Low Low Low Low High Medium Content Uniformity Low High Low Low Low Low Low Low High Dissolution High High Low High Low Low Low Low Low Degradation Products Medium Low Low Low Low Low Low High Low The justification for the assigned level of risk is provided in Table 13. April 2012 23 4 ICH Harmonised Tripartite Guideline: Q9 Quality Risk Management. November 2005.
  • 24. Example QbD IR Tablet Module 3 Quality 3.2.P.2 Pharmaceutical Development Table 13. Justification for the initial risk assessment of the drug substance attributes Drug Substance Attributes Drug Products CQAs Justification Solid State Form Assay Drug substance solid state form does not affect tablet assay and CU. The risk is low.Content Uniformity Dissolution Different polymorphic forms of the drug substance have different solubility and can impact tablet dissolution. The risk is high. Acetriptan polymorphic Form III is the most stable form and the DMF holder consistently provides this form. In addition, pre-formulation studies demonstrated that Form III does not undergo any polymorphic conversion under the various stress conditions tested. Thus, further evaluation of polymorphic form on drug product attributes was not conducted. Degradation Products Drug substance with different polymorphic forms may have different chemical stability and may impact the degradation products of the tablet. The risk is medium. Particle Size Distribution (PSD) Assay A small particle size and a wide PSD may adversely impact blend flowability. In extreme cases, poor flowability may cause an assay failure. The risk is medium. Content Uniformity Particle size distribution has a direct impact on drug substance flowability and ultimately on CU. Due to the fact that the drug substance is milled, the risk is high. Dissolution The drug substance is a BCS class II compound; therefore, PSD can affect dissolution. The risk is high. Degradation Products The effect of particle size reduction on drug substance stability has been evaluated by the DMF holder. The milled drug substance exhibited similar stability as unmilled drug substance. The risk is low. Hygroscopicity Assay Acetriptan is not hygroscopic. The risk is low. Content Uniformity Dissolution Degradation Products Solubility Assay Solubility does not affect tablet assay, CU and degradation products. Thus, the risk is low.Content Uniformity Degradation Products Dissolution Acetriptan exhibited low (~0.015 mg/mL) and constant solubility across the physiological pH range. Drug substance solubility strongly impacts dissolution. The risk is high. Due to pharmaceutical equivalence requirements, the free base of the drug substance must be used in the generic product. The formulation and manufacturing process will be designed to mitigate this risk. Moisture Content Assay Moisture is controlled in the drug substance specification (NMT 0.3%). Thus, it is unlikely to impact assay, CU and dissolution. The risk is low. Content Uniformity Dissolution Degradation Products The drug substance is not sensitive to moisture based on forced degradation studies. The risk is low. April 2012 24
  • 25. Example QbD IR Tablet Module 3 Quality 3.2.P.2 Pharmaceutical Development Drug Substance Attributes Drug Products CQAs Justification Residual Solvents Assay Residual solvents are controlled in the drug substance specification and comply with USP <467>. At ppm level, residual solvents are unlikely to impact assay, CU and dissolution. The risk is low. Content Uniformity Dissolution Degradation Products There are no known incompatibilities between the residual solvents and acetriptan or commonly used tablet excipients. As a result, the risk is low. Process Impurities Assay Total impurities are controlled in the drug substance specification (NMT 1.0%). Impurity limits comply with ICH Q3A recommendations. Within this range, process impurities are unlikely to impact assay, CU and dissolution. The risk is low. Content Uniformity Dissolution Degradation Products During the excipient compatibility study, no incompatibility between process impurities and commonly used tablet excipients was observed. The risk is low. Chemical Stability Assay The drug substance is susceptible to dry heat, UV light and oxidative degradation; therefore, acetriptan chemical stability may affect drug product assay and degradation products. The risk is high. Content Uniformity Tablet CU is mainly impacted by powder flowability and blend uniformity. Tablet CU is unrelated to drug substance chemical stability. The risk is low. Dissolution Tablet dissolution is mainly impacted by drug substance solubility and particle size distribution. Tablet dissolution is unrelated to drug substance chemical stability. The risk is low. Degradation Products The risk is high. See justification for assay. Flow Properties Assay Acetriptan has poor flow properties. In extreme cases, poor flow may impact assay. The risk is medium. Content Uniformity Acetriptan has poor flow properties which may lead to poor tablet CU. The risk is high. Dissolution The flowability of the drug substance is not related to its degradation pathway or solubility. Therefore, the risk is low.Degradation Products 2.1.2 Excipients The excipients used in acetriptan tablets were selected based on the excipients used in the RLD, excipient compatibility studies and prior use in approved ANDA products that utilize roller compaction (RC). A summary of the excipient-drug substance compatibility studies and the selection of each excipient grade is provided in the following section. 2.1.2.1 Excipient Compatibility Studies Note to Reader: Excipient compatibility is an important part of understanding the role of inactive ingredients in product quality. The selection of excipients for the compatibility study should be based on the mechanistic understanding of the drug substance and its impurities, excipients and their impurities, degradation pathway and potential processing conditions for the drug product manufacture. A scientifically sound approach should be used in constructing the compatibility studies. The commercial grades of the excipients are not provided in this example April 2012 25
  • 26. Example QbD IR Tablet Module 3 Quality 3.2.P.2 Pharmaceutical Development to avoid endorsement of specific products. However, in an actual pharmaceutical development report, the names of the commercial grades are expected. Excipient-drug substance compatibility was assessed through HPLC analysis of binary mixtures of excipient and drug substance at a 1:1 ratio in the solid state. Samples were stored at 25 °C/60 % RH and 40 °C/75 % RH in both open and closed containers for 1 month. Common excipients functioning as filler, disintegrant, and lubricant were evaluated in the excipient compatibility study. Table 14 summarizes the results. Table 14. Excipient compatibility (binary mixtures)* Mixture Assay Degradants (% w/w) (% w/w) Lactose Monohydrate/DS (1:1) 99.8% ND Lactose Anhydrous/DS (1:1) 99.6% ND Microcrystalline Cellulose (MCC)/DS (1:1) 98.4% ND Dibasic Calcium Phosphate/DS (1:1) 99.3% ND Mannitol/DS (1:1) 101.1% ND Pregelatinized Starch/DS (1:1) 100.5% ND Croscarmellose Sodium (CCS)/DS (1:1) 99.7% ND Crospovidone (1:1) 99.3% ND Sodium Starch Glycolate (1:1) 98.8% ND Talc/DS (1:1) 99.5% ND Magnesium Stearate/DS (1:1) 95.1% AD1: 4.4% *Conditions: 40 °C/75 % RH, open container, 1 month Loss in assay or detection of degradants indicative of an incompatibility was not observed for the selected excipients except magnesium stearate. An interaction was seen with magnesium stearate at 40 °C/75 % RH. This interaction caused lower assay results for acetriptan. The mechanism for this interaction was indentified as formation of a magnesium stearate-acetriptan adduct (AD1) involving stearic acid. To further evaluate if this potential interaction could cause drug instability, an additional experiment was performed in which several different mixtures of drug and excipients were prepared. Only the excipient types used in the RLD formulation were selected for this study. The first mixture consisted of drug and all excipients in the ratio representative of the finished product. In subsequent mixtures, one excipient was removed at a time. These mixtures were stored at 25 °C/60% RH and 40 °C/75% RH in both open and closed containers for 1 month. Table 15 presents the results of the study. Table 15. Excipient compatibility (interaction study)* Mixture Assay Degradants (% w/w) (% w/w) All excipients 99.4% ND All excipients except Lactose Monohydrate 99.2% ND All excipients except Microcrystalline Cellulose (MCC) 99.8% ND All excipients except Croscarmellose Sodium (CCS) 99.9% ND All excipients except Talc 99.3% ND All excipients except Magnesium Stearate 99.6% ND *Conditions: 40 °C/75 % RH, open container, 1 month April 2012 26
  • 27. Example QbD IR Tablet Module 3 Quality 3.2.P.2 Pharmaceutical Development No loss in assay was observed in any of these mixtures at 40 °C/75% RH or at 25 °C/60% RH. There is no incompatibility with the selected excipients except for the noted interaction with magnesium stearate in the binary mixture study. Therefore, magnesium stearate was still selected, but contact of the drug substance with magnesium stearate was limited by only using extragranular magnesium stearate. Intragranular lubrication required for the roller compaction process was achieved by using talc. Subsequent assurance of compatibility was provided by long-term stability data for formulations used in the pilot BE study and the ongoing prototype stability studies using the formulation proposed for commercialization. The impurity method is able to identify and quantify AD1. Adduct formation was below the limit of quantitation in the long-term stability study and is controlled by the limit for any unspecified impurity. 2.1.2.2 Excipient Grade Selection Based on the results of excipient compatibility studies, identical excipient types to the RLD formulation were selected for the generic product development. The selection of excipient grade and supplier was based on previous formulation experience and knowledge about excipients that have been used successfully in approved products manufactured by roller compaction as given in Table 16. The level of excipients used in the formulation were studied in subsequent formulation development studies. Table 16. Initial selection of excipient type, grade and supplier Excipient Supplier Grade Prior Use in Roller Compaction Lactose Monohydrate A A01 ANDA 123456, ANDA 456123 Microcrystalline Cellulose (MCC) B B02 ANDA 123456, ANDA 456123 Croscarmellose Sodium (CCS) C C03 ANDA 123456 Talc D D04 ANDA 123456 Magnesium Stearate E E05 ANDA 123456, ANDA 456123 Microcrystalline cellulose and lactose monohydrate comprise about 80% of the total drug product composition. Microcrystalline cellulose and lactose monohydrate are among the commonly used fillers for dry granulation formulations, both individually and in combination with each other, because they exhibit appropriate flow and compression properties. The particle size distribution, particle morphology, aspect ratio, bulk density and flowability of different grades have the potential to affect drug product content uniformity. Therefore, additional particle size controls above those in the pharmacopoeia are included in the specifications for the two major excipients: lactose monohydrate (d50: 70-100 µm) and microcrystalline cellulose (d50: 80- 140 µm). Material within these ranges was used in all further formulation studies. Lactose Monohydrate: Lactose monohydrate is commonly used as a filler. The potential impurities of lactose are melamine and aldehydes. The supplier has certified that the lactose is free of melamine and has provided a certificate of suitability for TSE/BSE. Lactose monohydrate Grade A01 from supplier A was selected based on successful product development in approved ANDA 123456 and ANDA 456123, both of which used roller compaction. The selected grade provides acceptable flow and compression properties when used in combination with microcrystalline cellulose. April 2012 27
  • 28. Example QbD IR Tablet Module 3 Quality 3.2.P.2 Pharmaceutical Development Microcrystalline Cellulose (MCC): Microcrystalline cellulose is widely used as a filler for direct compression and roller compaction. Though it is reported in the literature that MCC may physically bind or adsorb drug substance, no such physical interaction was evident in the formulation dissolution studies. It is known from the literature that MCC undergoes plastic deformation during compaction since it is a fibrous material and ductile in nature. Not all grades of MCC may be suitable for use in roller compaction. Microcrystalline cellulose Grade B02 from supplier B was selected based on the acceptable flow and compression properties when used in combination with lactose monohydrate as demonstrated in approved ANDA 123456 and ANDA 456123. Croscarmellose Sodium (CCS): Acetriptan is a BCS class II drug so rapid disintegration is necessary to ensure maximum bioavailability. Being a superdisintegrant, croscarmellose sodium is hygroscopic in nature. It swells rapidly to about 4-8 times its original volume when it comes in contact with water. Grade C03 from supplier C was selected. Talc: Talc is a common metamorphic mineral and is used as a glidant and/or lubricant both intragranularly and extragranularly in the formulation. Intragranular talc was used to prevent sticking during the roller compaction process. Because of the interaction between magnesium stearate and acetriptan, talc was also added extragranularly to reduce the level of magnesium stearate needed for the lubrication. Grade D04 from supplier D was selected. Magnesium Stearate: It is the most commonly used lubricant for tablets. Because magnesium stearate interacts with acetriptan to form an adduct, it is used only extragranularly. Magnesium stearate grade E05 from supplier E was selected and is of vegetable origin. 2.2 Drug Product 2.2.1 Formulation Development 2.2.1.1 Initial Risk Assessment of the Formulation Variables Note to Reader: In this initial risk assessment for formulation development, the detailed manufacturing process has not been established. Thus, risks were rated assuming that for each formulation attribute that changed, an optimized manufacturing process would be established. The results of the initial risk assessment of the formulation variables are presented in Table 17 and the justification for the risk assignment is presented in Table 18. April 2012 28
  • 29. Example QbD IR Tablet Module 3 Quality 3.2.P.2 Pharmaceutical Development Table 17. Initial risk assessment of the formulation variables Drug Product CQA Formulation Variables Drug Substance PSD MCC/Lactose Ratio CCS Level Talc Level Magnesium Stearate Level Assay Medium Medium Low Low Low Content Uniformity High High Low Low Low Dissolution High Medium High Low High Degradation Products Low Low Low Low Medium Table 18. Justification for the initial risk assessment of the formulation variables Formulation Variables Drug Products CQAs Justification Drug Substance PSD Assay See Justifications provided in Table 13. Content Uniformity Dissolution Degradation Products MCC/Lactose Ratio Assay MCC/Lactose ratio can impact the flow properties of the blend. This, in turn, can impact tablet CU. The risk is high. Occasionally, poor CU can also adversely impact assay. The risk is medium.Content Uniformity Dissolution MCC/lactose ratio can impact dissolution via tablet hardness. However, hardness can be controlled during compression. The risk is medium. Degradation Products Since both MCC and lactose are compatible with the drug substance and will not impact drug product degradation, the risk is low. CCS Level Assay Since the level of CCS used is low and its impact on flow is minimal, it is unlikely to impact assay and CU. The risk is low.Content Uniformity Dissolution CCS level can impact the disintegration time and, ultimately, dissolution. Since achieving rapid disintegration is important for a drug product containing a BCS class II compound, the risk is high. Degradation Products CCS is compatible with the drug substance and will not impact drug product degradation. Thus, the risk is low. Talc Level Assay Generally, talc enhances blend flowability. A low level of talc is not likely to impact assay and CU. The risk is low.Content Uniformity Dissolution Compared to magnesium stearate, talc has less impact on disintegration and dissolution. The low level of talc used in the formulation is not expected to impact dissolution. The risk is low. Degradation Products Talc is compatible with the drug substance and will not impact degradation products. The risk is low. April 2012 29
  • 30. Example QbD IR Tablet Module 3 Quality 3.2.P.2 Pharmaceutical Development Formulation Variables Drug Products CQAs Justification Magnesium Stearate Level Assay Since the level of magnesium stearate used is low and its impact on flow is minimal, it is unlikely to impact assay and CU. The risk is low.Content Uniformity Dissolution Over-lubrication due to excessive lubricant may retard dissolution. The risk is high. Degradation Products Though it formed an adduct with the drug substance in the binary mixture compatibility study (magnesium stearate/DS ratio 1:1), the interaction compatibility study showed that the adduct formation is negligible when magnesium stearate is used at a level representative of the finished drug product composition (magnesium stearate/DS ratio 1:10). Thus, the risk is medium. 2.2.1.2 Drug Substance Particle Size Selection for Product Development In general, for drug substance with plate-like morphology and particle size in the micrometer range, a larger drug substance particle size improves manufacturability because it has better flow. However, for a BCS II compound like acetriptan, larger drug substance particle size may significantly decrease dissolution and negatively impact the in vivo performance. With an aim to identify the appropriate drug substance particle size distribution range for further study, an in silico simulation was conducted to estimate the impact of the drug substance mean particle size, d50, on the Cmax ratio and AUC ratio between the test product and the RLD.5 The predefined selection criterion was a mean particle size that yielded both a Cmax ratio and an AUC ratio between 0.9 and 1.11. The result of the simulation for d50 ranging from 1 µm to 200 µm is presented graphically in Figure 9. The data indicate that a d50 of 30 µm or less met the predefined criterion and exhibited a limited effect on the pharmacokinetic profile when compared to the RLD. April 2012 30 5 W. Huang, S. Lee and L.X. Yu. Mechanistic Approaches to Predicting Oral Drug Absorption. The AAPS Journal, 2009, 11(2): 217-224.
  • 31. Example QbD IR Tablet Module 3 Quality 3.2.P.2 Pharmaceutical Development 0.0 0.1 0.2 0.3 0.4 0.5 0.6 0.7 0.8 0.9 1.0 1.1 1 10 100 1000 Test/RLDRatio Cmax Ratio AUC0-t Ratio Drug Substance Mean Particle Size (d50, μm) Figure 9. In silico simulation of pharmacokinetic profiles versus drug substance mean particle size Based on the results of the simulation, drug substance lots with four different particle size distributions were selected for formulation development. Ultimately, the goal was to test the formulations in a pilot PK study to finalize the drug substance particle size distribution for commercialization. Both physical and flow properties of the four drug substance lots were evaluated and are summarized in Table 19. In this development report, d90 is used to describe the drug substance particle size distribution. The acetriptan d90 of 10 µm, 20 µm, 30 µm and 45 µm correspond to a d50 of 6 µm, 12 µm, 24 µm and 39 µm, respectively. April 2012 31
  • 32. Example QbD IR Tablet Module 3 Quality 3.2.P.2 Pharmaceutical Development Table 19. Drug substance lots used for formulation development Physical Properties Interpretation of Data Lot #1 Lot #2 Lot #3 Lot #4 d90 (µm) -- 10 20 30 45 d50 (µm) -- 6 12 24 39 d10 (µm) -- 3.6 7.2 14.4 33.4 Bulk density (g/cc) -- 0.26 0.27 0.28 0.29 Tapped density (g/cc) -- 0.41 0.39 0.39 0.38 Flow function coefficient (ffc)6 ffc < 3.5 poor flow 3.5 < ffc < 5.0 marginal flow 5.0 < ffc < 8.0 good flow ffc > 8.0 excellent flow 2.88 2.95 3.17 3.21 Compressibility index (%)7 < 15 good flow 36.6 30.8 28.2 23.7 Hausner ratio7 < 1.25 fair flow 1.58 1.44 1.39 1.31 Specific energy (mJ/g) determined by powder rheometer8 5 < SE < 10 moderate cohesion SE > 10 high cohesion 13 12 10 8.5 2.2.1.3 Process Selection When d90 is in the range of 10-45 µm, acetriptan is cohesive and displays poor flowability as evidenced by the compressibility index, Hausner ratio, flow function coefficient and specific energy. Poor material flow may produce tablets with high weight and content variability due to an uneven distribution of the drug substance in the blend, uneven bulk density and, eventually, uneven filling of die cavities on the tablet press. Poor acetriptan flow rules out the use of a high drug load formulation and supports the use of a similar drug load to the RLD which is 10%. Initially, direct compression of the blend was performed. The blend uniformity (BU) percent relative standard deviation (% RSD) was higher than 6% and the tablet content uniformity % RSD was even higher. Therefore, direct compression was considered an unacceptable process for this formulation. Wet granulation was excluded due to potential thermal degradation of the drug substance during drying based on the forced degradation study results. The use of wet granulation with an organic solvent was also excluded because of the desire to avoid the environmental considerations involved. For dry granulation by roller compaction, the powder particles of drug substance and fillers are aggregated under high pressure to form a ribbon and then broken down to produce granules by milling before compression (tabletting). The risk of drug particle segregation can be minimized. By controlling the size distribution and flow properties of the granules, the risk of poor tablet content uniformity can be reduced. Thus, dry granulation by roller compaction was selected as the process for further drug product development efforts. April 2012 32 6 M. P. Mullarney and N. Leyva, Modeling Pharmaceutical Powder-Flow Performance Using Particle-Size Distribution Data, Pharmaceutical Technology, 2009, 33(3): 126-134. 7 The full scale of flowability for compressibility index and Hauser ratio are provided in USP <1174> Powder Flow. 8 As per powder rheometer equipment vendor guideline
  • 33. Example QbD IR Tablet Module 3 Quality 3.2.P.2 Pharmaceutical Development 2.2.1.4 Formulation Development Study #1 Note to Reader: A univariate method (i.e., one-factor-at-a time (OFAT)) is acceptable in cases where there is no potential interaction between factors. Since this is often not known, a multivariate statistical design (i.e., Design of Experiments (DOE)) is often used and results are evaluated with commercially available statistical software. A sequential strategy is commonly employed when planning a DOE. Initially, a screening DOE can be used to narrow down the extensive list of factors identified during initial risk assessment to a few vital factors. Then, a characterization DOE can be used to understand the main effects and potential interaction(s) between these vital factors. When center points are included in a 2-level factorial DOE, it is possible to test if the curvature effect is significant. Data analysis is done by separating the curvature term from the regression model in an adjusted model. If the curvature is significant, the design should be augmented to a response surface DOE to estimate the quadratic terms. On the other hand, if the curvature is not significant, the adjusted model and unadjusted model will be similar. Finally, a verification DOE can be employed to study the robustness of the system by varying the identified critical factors over ranges that are expected to be encountered during routine manufacturing. Randomization, blocking and replication are the three basic principles of statistical experimental design. By properly randomizing the experiment, the effects of uncontrollable factors that may be present can be “averaged out”. Blocking is the arrangement of experimental units into groups (blocks) that are similar to one another. Blocking reduces known but irrelevant sources of variation between groups and thus allows greater precision in the estimation of the source of variation under study. Replication allows the estimation of the pure experimental error for determining whether observed differences in the data are really statistically different. In this mock example, we have not included ANOVA results for each DOE. In practice, please be advised that ANOVA results should accompany all DOE data analysis, especially if conclusions concerning the significance of the model terms are discussed. For all DOE data analysis, the commonly used alpha of 0.05 was chosen to differentiate between significant and nonsignificant factors. It is important that any experimental design has sufficient power to ensure that the conclusions drawn are meaningful. Power can be estimated by calculating the signal to noise ratio. If the power is lower than the desired level, some remedies can be employed to increase the power, for example, by adding more runs, increasing the signal or decreasing the system noise. Please refer to the ICH Points to Consider document for guidance on the level of DOE documentation recommended for regulatory submissions.9 Formulation development focused on evaluation of the high risk formulation variables as identified in the initial risk assessment shown in Table 17. The development was conducted in two stages. The first formulation study evaluated the impact of the drug substance particle size distribution, the MCC/Lactose ratio and the disintegrant level on the drug product CQAs. The 9 ICH Quality Implementation Working Group Points to Consider (R2). December 6, 2011. April 2012 33
  • 34. Example QbD IR Tablet Module 3 Quality 3.2.P.2 Pharmaceutical Development second formulation study was conducted to understand the impact of extragranular magnesium stearate and talc level in the formulation on product quality and manufacturability. Formulation development studies were conducted at laboratory scale (1.0 kg, 5,000 units). Table 20 details the equipment and the associated process parameters used in these studies. Table 20. Equipment and fixed process parameters used in formulation development studies Process Step Equipment Pre-Roller Compaction Blending and Lubrication 4 qt V-blender o 250 revolutions for blending (10 min at 25 rpm) Roller Compaction and Integrated Milling Alexanderwerk10 WP120 with 25 mm roller width and 120 mm roller diameter o Roller surface: Knurled o Roller pressure: 50 bar o Roller gap: 2 mm o Roller speed: 8 rpm o Mill speed: 60 rpm o Coarse screen orifice size: 2.0 mm o Mill screen orifice size: 1.0 mm Final Blending and Lubrication 4 qt V-blender o 100 revolutions for granule and talc blending (4 min at 25 rpm) o 75 revolutions for lubrication (3 min at 25 rpm) Tablet Compression 16-station rotary press (2 stations used) o 8 mm standard round concave tools o Press speed: 20 rpm o Compression force: 5-15 kN o Pre-compression force: 1 kN The goal of Formulation Development Study #1 was to select the MCC/Lactose ratio and disintegrant level and to understand if there was any interaction of these variables with drug substance particle size distribution. This study also sought to establish the robustness of the proposed formulation. A 23 full factorial Design of Experiments (DOE) with three center points was used to study the impact of these three formulation factors on the response variables listed in Table 21. The acetriptan d90 of 10 µm, 20 µm and 30 µm corresponds with the d50 of 6 µm, 12 µm and 24 µm, respectively. These drug substance lots are characterized in Table 19 and were selected based on the in silico simulation results discussed in Section 2.2.1.2. Disintegrant (croscarmellose sodium) was added intragranularly and the levels investigated ranged from 1% to 5%. These levels are consistent with the estimated level in the RLD formulation and are within the recommended range in the Handbook of Pharmaceutical Excipients.11 April 2012 34 10 FDA does not endorse any particular equipment vendors. 11 Rowe, RC., PJ Sheskey and ME Quinn. Handbook of Pharmaceutical Excipients, 6th Edition. Grayslake, IL: RPS Publishing, 2009.
  • 35. Example QbD IR Tablet Module 3 Quality 3.2.P.2 Pharmaceutical Development The MCC/Lactose ratios selected for formulation studies were based on experience with previously approved products manufactured using roller compaction (ANDA 123456 and ANDA 456123). The MCC/Lactose ratios are transformed to a continuous numeric variable as a percentage of MCC in the MCC/Lactose dual filler combination by assigning values of 33.3%, 50.0% and 66.7% corresponding to 1:2, 1:1 and 2:1, respectively. The drug load in the generic formulation was fixed at 10% based on the RLD label, strength and tablet weight. For this study, both intragranular and extragranular talc levels were fixed at 2.5%. The extragranular magnesium stearate level was fixed at 1%. The levels of talc and magnesium stearate are consistent with the levels observed in the RLD formulation and agree with the recommendations published in the Handbook of Pharmaceutical Excipients.11 A constant tablet weight of 200.0 mg was used with the filler amount adjusted to achieve the target weight. Table 21 summarizes the factors and responses studied. For each batch, the blend was compressed at several compression forces (data shown for only 5 kN, 10 kN and 15 kN) to obtain the compression profile. Using the profile, the force was adjusted to compress tablets to the target hardness for disintegration and dissolution testing. Table 21. Design of the 23 full factorial DOE to study intragranular excipients and drug substance PSD Factors: Formulation Variables Levels -1 0 +1 A Drug substance PSD (d90, µm) 10 20 30 B Disintegrant (%) 1 3 5 C % MCC in MCC/Lactose combination 33.3 50.0 66.7 Responses Goal Acceptable Ranges Y1 Dissolution at 30 min (%) (with hardness of 12.0 kP) Maximize ≥ 80% Y2 Disintegration time (min) (with hardness of 12.0 kP) Minimize < 5 min Y3 Tablet content uniformity (% RSD) Minimize % RSD < 5% Y4 Assay (% w/w) Target at 100% w/w 95.0-105.0% w/w Y5 Powder blend flow function coefficient (ffc) Maximize > 6 Y6 Tablet hardness@ 5 kN (kP) Maximize > 5.0 kP Y7 Tablet hardness @ 10 kN (kP) Maximize > 9.0 kP Y8 Tablet hardness @ 15 kN (kP) Maximize > 12.0 kP Y9 Friability @ 5 kN (%) Minimize < 1.0% Y10 Friability @ 10 kN (%) Minimize < 1.0% Y11 Friability @ 15 kN (%) Minimize < 1.0% Y12 Degradation products (%) (observed at 3 months, 40 °C/75% RH) Minimize ACE12345: NMT 0.5% Any unknown impurity: NMT 0.2% Total impurities: NMT 1.0% To study tablet dissolution at a target tablet hardness of 12.0 kP (a range of 11.0-13.0 kP was allowed), the compression force was adjusted. A target tablet hardness of 12.0 kP was chosen to investigate the effect of formulation variables on dissolution because a high hardness would be expected to be the worst case for dissolution. If dissolution was studied at a fixed compression force, the results could be confounded by the impact of tablet hardness. April 2012 35
  • 36. Example QbD IR Tablet Module 3 Quality 3.2.P.2 Pharmaceutical Development The flow function coefficient (ffc) of the powder blend prior to roller compaction (Y6) was measured using a ring shear tester. According to the literature6 , the following rule is used to gauge the powder's relative flowability: ffc < 3.5 poor 3.5 < ffc < 5.0 marginal 5.0 < ffc < 8.0 good ffc > 8.0 excellent The experimental results for dissolution, content uniformity, powder blend flow function coefficient and tablet hardness when compressed at 10 kN (Y1, Y3, Y5 and Y7, other responses not shown) are presented in Table 22. Table 22. Experimental results of the DOE to study intragranular excipients and drug substance PSD Batch No. Factors: Formulation Variables Responses A: Drug substance PSD B: Disintegrant level C: % MCC in MCC/Lactose combination Y1: Dissolution at 30 min Y3: CU Y5: ffc value Y7: Tablet hardness @ 10 kN (d90, μm) (%) (%) (%) (% RSD) -- (kP) 1 30 1 66.7 76.0 3.8 7.56 12.5 2 30 5 66.7 84.0 4.0 7.25 13.2 3 20 3 50.0 91.0 4.0 6.62 10.6 4 20 3 50.0 89.4 3.9 6.66 10.9 5 30 1 33.3 77.0 2.9 8.46 8.3 6 10 5 66.7 99.0 5.1 4.77 12.9 7 10 1 66.7 99.0 5.0 4.97 13.5 8 20 3 50.0 92.0 4.1 6.46 11.3 9 30 5 33.3 86.0 3.2 8.46 8.6 10 10 1 33.3 99.5 4.1 6.16 9.1 11 10 5 33.3 98.7 4.0 6.09 9.1 Significant factors for tablet dissolution (at 30 min) Initially, dissolution was tested using the FDA-recommended method. All batches exhibited rapid and comparable dissolution (> 90% dissolved in 30 min) to the RLD. All batches were then retested using the in-house dissolution method (see details in Section 1.4). Results are presented in Table 22. Since center points were included in the DOE, the significance of the curvature effect was tested using an adjusted model. The Analysis of Variance (ANOVA) results are presented in Table 23. April 2012 36
  • 37. Example QbD IR Tablet Module 3 Quality 3.2.P.2 Pharmaceutical Development Table 23. ANOVA results of the model adjusted for curvature effect Source Sum of Squares df* Mean Square F Value p-value Comments Model 742.19 3 247.40 242.94 < 0.0001 Significant A-Drug substance PSD (d90, μm) 669.78 1 669.78 657.72 < 0.0001 SignificantB-Disintegrant (%) 32.81 1 32.81 32.21 0.0013 AB-interaction 39.61 1 39.61 38.89 0.0008 Curvature 1.77 1 1.77 1.74 0.2358 Not significant Residual 6.11 6 1.02 -- -- -- Lack of Fit 2.67 4 0.67 0.39 0.8090 Not significant Pure Error 3.44 2 1.72 -- -- -- Total 750.07 10 -- -- -- -- *df: degrees of freedom As shown in Table 23, the curvature effect was not significant for dissolution; therefore, the factorial model coefficients were fit using all of the data (including center points). As shown in the following half-normal plot (Figure 10) and ANOVA results of the unadjusted model (Table 24), the significant factors affecting tablet dissolution were A (drug substance PSD), B (disintegrant level) and AB (an interaction between drug substance PSD and the intragranular disintegrant level). Table 24. ANOVA results of the unadjusted model Source Sum of Squares df Mean Square F Value p-value Comments Model 742.19 3 247.40 219.84 < 0.0001 Significant A-Drug substance PSD (d90, μm) 669.78 1 669.78 595.19 < 0.0001 SignificantB-Disintegrant (%) 32.81 1 32.81 29.15 0.0010 AB-Interaction 39.61 1 39.61 35.19 0.0006 Residual 7.88 7 1.13 -- -- -- Lack of Fit 4.44 5 0.89 0.52 0.7618 Not significant Pure Error 3.44 2 1.72 -- -- -- Total 750.07 10 -- -- -- -- April 2012 37
  • 38. Example QbD IR Tablet Module 3 Quality 3.2.P.2 Pharmaceutical Development Dissolution at 30 min (%) Shapiro-Wilk Test W-value = 0.926 p-value = 0.572 A: DS PSD (d90, μm) B: Disintegrant (%) C: % MCC in MCC/Lactose Combination Half-Normal%Probability |Standardized Effect| 0.00 4.58 9.15 13.73 18.30 0 10 20 30 50 70 80 90 95 B AB Error Estimates A Positive Effects Negative Effects Figure 10. Half-normal plot of the formulation variable effects on dissolution at 30 min (tablet target hardness of 12.0 kP) Figure 11 shows the effect of drug substance PSD and disintegrant level on dissolution at 30 minutes. Dissolution decreased with increasing drug substance PSD. On the other hand, dissolution increased with increasing disintegrant level. With a larger drug substance PSD, the disintegrant level had a greater impact on dissolution than with a smaller drug substance PSD. 99.5 76.0 A: DS PSD (d90, μm) B: Disintegrant (%) Actual Factor: C: % MCC in MCC/Lactose Combination = 50.0 10 15 20 25 30 1.0 2.0 3.0 4.0 5.0 A: DS PSD (d90, μm) B:Disintegrant(%) 95.0 90.0 85.0 80.0 Dissolution at 30 min (%) Figure 11. Effect of drug substance PSD and disintegrant level on dissolution at 30 min (tablet target hardness of 12.0 kP) April 2012 38
  • 39. Example QbD IR Tablet Module 3 Quality 3.2.P.2 Pharmaceutical Development Significant factors for tablet disintegration time The disintegrant level was the only statistically significant factor to affect tablet disintegration. However, all batches demonstrated rapid disintegration in less than 4 minutes. Significant factors for tablet assay All batches demonstrated acceptable assay (ranging from 98.3-101.2%) which was well within the specification limits (95.0-105.0% w/w) and none of factors showed significant impact on tablet assay. Significant factors for tablet content uniformity (%RSD) Data analysis indicated that the curvature effect was not significant for tablet content uniformity. As shown in the half-normal plot (Figure 12), the significant factors affecting tablet content uniformity were A (drug substance PSD) and C (% MCC in the MCC/Lactose combination). Content Uniformity (% RSD) Shapiro-Wilk Test W-value = 0.821 p-value = 0.119 A: DS PSD (d90, μm) B: Disintegrant (%) C: % MCC in MCC/Lactose Combination Half-Normal%Probability |Standardized Effect| 0.00 0.27 0.54 0.81 1.07 0 10 20 30 50 70 80 90 95 A C Error Estimates Positive Effects Negative Effects Figure 12. Half-normal plot of the formulation variables effect on tablet content uniformity (% RSD) Figure 13 shows the effect of drug substance PSD and percentage of MCC in the MCC/Lactose combination on tablet content uniformity. The % RSD decreased with increasing drug substance PSD. On the other hand, % RSD increased with increasing percentage of MCC in the MCC/Lactose combination, likely because the fibrous particle shape of MCC does not flow as well as the spherical particle shape of lactose. April 2012 39
  • 40. Example QbD IR Tablet Module 3 Quality 3.2.P.2 Pharmaceutical Development Content Uniformity (% RSD)5.1 2.9 A: DS PSD (d90, μm) C: % MCC in MCC/Lactose Combination Actual Factor: B: Disintegrant (%) = 3.0 66.7 10 15 20 25 30 33.3 41.6 50.0 58.4 A: DS PSD (d90, μm) C:%MCCinMCC/LactoseCombination 4.5 4.0 3.5 Figure 13. Effect of drug substance PSD and % of MCC in the MCC/Lactose combination on tablet content uniformity (%RSD) Significant factors for powder blend flowability The flowability (represented by ffc value) of the powder blend from the pre-roller compaction blending and lubrication step was determined for each sample using a ring shear tester. The ffc of each sample was then recorded. As shown in the half-normal plot (Figure 14), the significant factors affecting powder blend flowability were A (drug substance PSD) and C (% MCC in the MCC/Lactose combination). The effect of drug substance PSD and percentage of MCC in the MCC/Lactose combination on powder blend flowability is shown in Figure 15. Powder blend flowability increased with increasing drug substance PSD and decreasing percentage of MCC in the MCC/Lactose combination. April 2012 40
  • 41. Example QbD IR Tablet Module 3 Quality 3.2.P.2 Pharmaceutical Development flow function coefficient (ffc) Shapiro-Wilk Test W-value = 0.960 p-value = 0.805 A: DS PSD (d90, μm) B: Disintegrant (%) C: % MCC in MCC/Lactose Combination Half-Normal%Probability |Standardized Effect| 0.00 0.30 0.61 0.91 1.22 1.52 1.83 2.13 2.44 0 10 20 30 50 70 80 90 95 A C Error Estimates Positive Effects Negative Effects Figure 14. Half-normal plot of the formulation variable effects on powder blend flowability (ffc) 8.46 4.77 10 15 20 25 30 33.3 41.6 50.0 58.4 66.7 flow function coefficient (ffc) A: DS PSD (d90, μm) C:%MCCinMCC/LactoseCombination A: DS PSD (d90, μm) C: % MCC in MCC/Lactose Combination 6.00 7.00Actual Factor: B: Disintegrant (%) = 3.0 8.00 Figure 15. Effect of drug substance PSD and % MCC in the MCC/Lactose combination on flowability (ffc) Significant factors for tablet hardness Each DOE batch was compressed at 5 kN, 10 kN and 15 kN to evaluate its tabletability. The half-normal plot (Figure 16) shows that the only significant factor affecting tablet hardness when using 10 kN of compression force was C (% MCC in the MCC/lactose combination). A similar relationship was observed for compression forces of 5 kN and 15 kN (data not shown). As shown in Figure 17, tablet hardness increased with an increasing percentage of MCC in the MCC/lactose combination at a given compression force. April 2012 41
  • 42. Example QbD IR Tablet Module 3 Quality 3.2.P.2 Pharmaceutical Development Hardness @10 kN (kP) Shapiro-Wilk Test W-value = 00.914 p-value = 0.465 A: DS PSD (d90, μm) B: Disintegrant (%) C: % MCC in MCC/Lactose Combination Half-Normal%Probability |Standardized Effect| 0.00 1.06 2.13 3.19 4.25 0 10 20 30 50 70 80 90 95 C Error Estimates Positive Effects Negative Effects Figure 16. Half -normal plot of the formulation variable effects on tablet hardness @ 10 kN Hardness @10 kN (kP) C: % MCC in MCC/Lactose Combination Actual Factors: A: DS PSD (d90, μm) = 20 B: Disintegrant (%) = 3.0 Design Points 33.3 41.6 50.0 58.4 66.7 C: % MCC in MCC/Lactose Combination Hardness@10kN(kP) 14.0 13.0 12.0 11.0 10.0 9.0 8.0 Figure 17. Effect of % MCC in the MCC/Lactose combination on tablet hardness @ 10 kN Significant factors for tablet friability All tablets compressed at 5 kN, 10 kN and 15 kN showed good friability (< 0.2% weight loss for a tablet hardness range of 5.0-12.0 kP) and the three formulation variables in the ranges studied did not show any statistically significant impact on tablet friability. Significant factors for tablet stability (degradation products) All experimental batches were placed in a stability chamber in an open container for three months at 40 °C/75% RH, and samples were pulled and analyzed periodically. The degradation April 2012 42
  • 43. Example QbD IR Tablet Module 3 Quality 3.2.P.2 Pharmaceutical Development product ACE 12345, individual unknown impurities and total impurities were well below the specification limits of 0.5%, 0.2% and 1.0%, respectively. None of the formulation variables showed a statistically significant impact on degradation products. Summary of Formulation Development Study #1 Acetriptan PSD had a significant impact on tablet dissolution, content uniformity and powder blend flowability. A smaller drug substance PSD enhanced dissolution; however, it negatively impacted tablet content uniformity and blend flowability. The intragranular disintegrant level showed a significant impact on tablet dissolution due to its interaction with drug substance PSD. The disintegrant level had a greater impact on dissolution when the drug substance PSD was larger. The percentage of MCC in the MCC/Lactose combination had a significant impact on powder blend flowability, tablet content uniformity and tablet hardness. Increasing the percentage of MCC increased tablet hardness but decreased powder blend flowability and negatively impacted tablet content uniformity as evidenced by the increasing % RSD. To balance blend flowability and tablet hardness, 50% MCC in the MCC/Lactose combination (i.e., 1:1 ratio) was selected for the tentatively finalized formulation. Because no curvature effects were observed for any of the responses studied, and the main effects and interaction effects were identified using a full factorial DOE with no aliased terms, further studies to optimize the intragranular excipients were unnecessary. The DOE models were used to establish acceptable ranges for formulation variables. Figure 18 shows the overlay plot of all of the responses. The green zone indicates that all of the responses were achieved simultaneously. 10 13 17 20 23 27 30 1.00 2.00 3.00 4.00 5.00 Overlay Plot A: DS PSD (d90, μm) B:Disintegrant(%) a b A: DS PSD (d90, μm) B: Disintegrant (%) Actual Factor: C: % MCC in MCC/Lactose Combination = 50.0 a) Powder blend flowability (ffc): 6.00 b) Dissolution at 30 min (%): 80.0% Green Zone: All responses met the predefined criteria. Gray Zone: One or more responses failed to meet the predefined criteria. Figure 18. Overlay plot – effect of acetriptan formulation variables on responses April 2012 43
  • 44. In order to accommodate the largest possible drug substance PSD and to avoid operating on the edge of the green zone where dissolution failure is possible, 5% of croscarmellose sodium was selected for the tentatively finalized formulation. With this selected disintegrant level, the acceptable range for drug substance d90 is 14-30 μm. A d90 less than 14 μm showed unfavorable flowability resulting in unacceptable tablet content uniformity when the fixed manufacturing process was used during formulation development. Therefore, drug substance PSD was further studied during pre-roller compaction blending and lubrication process development. In order to understand the impact of drug substance PSD on in vivo performance and to identify the upper particle size limit that was still likely to be bioequivalent, drug substance with a d90 of 20 μm, 30 μm and 45 μm (corresponding to d50 of 12 μm, 24 μm and 39 μm, respectively) was studied in the pilot BE study (see Section 1.4). At the conclusion of Formulation Development Study #1, the levels of intragranular excipients were tentatively finalized as shown in Table 25. The extragranular glidant and lubricant were further studied in Formulation Development Study #2. Table 25. Tentative composition of Generic Acetriptan Tablets, 20 mg Ingredient Function Composition -- -- (mg/tablet) (% w/w) Acetriptan Active 20.0 10.0 Intragranular Excipients Lactose Monohydrate, NF Filler 79.0 39.5 Microcrystalline Cellulose (MCC), NF Filler 79.0 39.5 Croscarmellose Sodium (CCS), NF Disintegrant 10.0 5.0 Talc, NF Glidant/Lubricant 5.0 2.5 Extragranular Excipients Magnesium Stearate, NF Lubricant 2.0 1.0* Talc, NF Glidant/Lubricant 5.0 2.5* Total Weight 200.0 100 Example QbD IR Tablet Module 3 Quality 3.2.P.2 Pharmaceutical Development *Levels to be studied in Formulation Development Study #2 2.2.1.5 Formulation Development Study #2 Based on the results of Formulation Development Study #1, the intragranular excipients levels were tentatively finalized. However, magnesium stearate was linked to adduct formation with acetriptan during the binary excipient compatibility study (See Section 2.1.1.2). The goal of this study was to find the minimum level of extragranular magnesium stearate needed for tabletting and to evaluate if an increase in talc could compensate for a reduction in magnesium stearate. The level of extragranular magnesium stearate used in Formulation Development Study #1 was 1.0%. The minimum level recommended in the Handbook of Pharmaceuticals is 0.25%.11 Thus, the extragranular magnesium stearate level was studied between 0.3% and 0.9%. The talc level was adjusted accordingly to maintain a total of 3.5% extragranular glidant and lubricant using a two component mixture DOE. Table 26 summarizes the mixture component levels and responses studied. April 2012 44
  • 45. Example QbD IR Tablet Module 3 Quality 3.2.P.2 Pharmaceutical Development Table 26. Design of the two component mixture DOE to study extragranular magnesium stearate and talc Extragranular Glidant and Lubricant Levels -1 0 +1 A Magnesium stearate (%) 0.3 0.6 0.9 B Talc (%) 3.2 2.9 2.6 Responses Goal Acceptable Ranges Y1 Tablet appearance Minimize visual defects Shiny appearance with smooth surface, no side wall striation Y2 Tablet tooling appearance Minimize picking and sticking Shiny appearance with no evidence of picking or sticking Y3 Ejection force at 10 kN compression force (N) Minimize < 150 N Y4 Tablet hardness @ 10 kN (kP) Maximize > 9.0 kP Y5 Dissolution at 30 min (%) (with target hardness of 12.0 kP) Maximize ≥ 80% Y6 Tablet content uniformity (% RSD) Minimize % RSD < 5% A 5.0 kg batch of granules was manufactured using the roller compaction process parameters listed in Table 20. The granules were made using the formulation shown in Table 25. The batch of granules was then split into six sub-lots and different amounts of magnesium stearate and talc were added according to the composition shown in Table 27. The final blend was compressed into tablets using 10 kN of force. The experimental results for tablet appearance, tooling appearance, tablet ejection force and hardness at a fixed compression force (10 kN) (Y1, Y2, Y3 and Y4, other responses not shown) are presented in Table 27. Table 27. Experimental results of the two component mixture DOE Batch No. Mixture Components Responses Magnesium stearate level Extragranular talc level Tablet appearance* Tooling appearance Ejection force @10 kN Tablet hardness @10 kN (% w/w) (% w/w) -- -- (N) (kP) 12 0.3 3.2 Poor Visible indication of sticking on punches and binding in the die 431 12.4 13 0.3 3.2 Poor 448 12.2 14 0.9 2.6 Acceptable Shiny appearance with no evidence of picking and sticking 91 11.2 15 0.6 2.9 Acceptable 114 12.0 16 0.6 2.9 Acceptable 130 11.6 17 0.9 2.6 Acceptable 100 11.3 *Poor: dull appearance, uneven tablet surface and side wall striation; Acceptable: shiny appearance with smooth surface, no side wall striation Tablet and tooling appearance With 0.3% magnesium stearate, significant compression-related issues such as tablet picking, sticking and side wall striation were observed. However, with 0.6% or higher magnesium stearate, tablets were elegant in appearance and showed no evidence of sticking or binding to the tablet tooling. April 2012 45
  • 46. Example QbD IR Tablet Module 3 Quality 3.2.P.2 Pharmaceutical Development Ejection force The ANOVA results provided in Table 28 indicate that the linear mixture components and quadratic term (AB) were significant. Figure 19 shows the effect of the mixture components on ejection force. Table 28. ANOVA results of the quadratic mixture model Source Sum of Squares df Mean Square F Value p-value Comments Model 146563 2 73281.50 702.38 < 0.0001 Significant Linear Mixture 118336 1 118336.00 1134.21 < 0.0001 Significant AB 28227 1 28227.00 270.55 0.0005 Pure Error 313 3 104.33 -- -- -- Total 146876 5 -- -- -- -- Ejection force (N) A: Magnesium stearate (%) B: Talc (%) 0.3 3.2 0.5 3.1 0.6 2.9 0.8 2.8 0.9 2.6 Actual magnesium stearate (%) Actual talc (%) Ejectionforce(N) 0 100 200 300 400 500 Two Component Mixture Design Points Figure 19. Effect of extragranular magnesium stearate and talc levels on tablet ejection force With 0.3% magnesium stearate, significantly higher ejection forces were observed. Ejection force decreased with increasing magnesium stearate; however, the impact is negligible once the level is between 0.6%-0.9%. Tablet Hardness Figure 20 illustrates the effect of the mixture components on tablet hardness. The tablet hardness observed at a fixed compression force of 10 kN decreased with increasing magnesium stearate. April 2012 46
  • 47. Example QbD IR Tablet Module 3 Quality 3.2.P.2 Pharmaceutical Development Hardness @ 10 kN (kP) A: Magnesium stearate (%) B: Talc (%) 0.3 3.2 0.5 3.1 0.6 2.9 0.8 2.8 0.9 2.6 Actual magnesium stearate (%) Actual talc (%) Hardness@10kN(kP) 11.0 11.5 12.0 12.5 13.0 Two Component Mixture Design Points Figure 20. Effect of extragranular magnesium stearate and talc on tablet hardness @ 10 kN Dissolution and Content Uniformity All tablets, even those with a hardness of 12.0 kP, exhibited acceptable dissolution (> 85% in 30 min). Content uniformity was not an issue as each batch had a % RSD less than 3%. Therefore, magnesium stearate and talc did not show any significant impact on tablet dissolution and content uniformity within the ranges studied. Summary of Formulation Development Study #2 Based on the results of Formulation Development Study #2, the extragranular magnesium stearate and talc levels were fixed to 0.6% and 2.9%, respectively. 2.2.1.6 Formulation Development Conclusions The formulation composition was finalized based on Formulation Development Studies #1 and #2. The MCC/Lactose ratio and the disintegrant level were finalized in the first study. In the second study, it was concluded that a minimum level of magnesium stearate is required in the formulation to prevent picking and sticking. The level of magnesium stearate in the formulation was reduced by using it in combination with talc. The finalized formulation for Generic Acetriptan Tablets, 20 mg, is presented in Table 29. April 2012 47
  • 48. Example QbD IR Tablet Module 3 Quality 3.2.P.2 Pharmaceutical Development Table 29. Formulation selected for Generic Acetriptan Tablets, 20 mg12 Ingredient Function Composition (mg/tablet) (% w/w) Acetriptan Active 20.0 10.0 Intragranular Excipients Lactose Monohydrate, NF Filler 79.0 39.5 Microcrystalline Cellulose (MCC), NF Filler 79.0 39.5 Croscarmellose Sodium (CCS), NF Disintegrant 10.0 5.0 Talc, NF Glidant/Lubricant 5.0 2.5 Extragranular Excipients Magnesium Stearate, NF Lubricant 1.2 0.6 Talc, NF Glidant/Lubricant 5.8 2.9 Total Weight 200.0 100 2.2.1.7 Updated Risk Assessment of the Formulation Variables Acceptable ranges for the high risk formulation variables have been established and are included in the control strategy. Based on the results of the formulation development studies, the risk assessment of the formulation variables was updated as given in Table 30 with justifications provided in Table 31. Table 30. Updated risk assessment of the formulation variables Drug Product CQAs Formulation Attributes Drug Substance PSD MCC/Lactose Ratio CCS Level Magnesium Stearate Level Assay Low Low* Low* Low* Content Uniformity Low Low Low* Low* Dissolution Low Low Low Low Degradation Products Low* Low* Low* Low *The level of risk was not reduced from the initial risk assessment. Table 31. Justification for the reduced risks of the formulation variables Formulation Variables Drug Product CQAs Justification Drug Substance PSD Assay All tablets showed acceptable assay. The risk is reduced from medium to low. Content Uniformity The poor flow of the drug substance is mitigated by using a roller compaction process, low drug load and fillers that have good flowability. The risk is reduced from high to low. Dissolution The risk is reduced from high to low by controlling drug substance PSD and optimizing intragranular superdisintegrant. 12 All the excipients are present in the RLD. April 2012 48
  • 49. Example QbD IR Tablet Module 3 Quality 3.2.P.2 Pharmaceutical Development Formulation Variables Drug Product CQAs Justification MCC/Lactose Ratio Content Uniformity The risk is reduced from high to low by optimizing the MCC/Lactose ratio and using a roller compaction process. Dissolution The risk is reduced from medium to low because the selected filler ratio yielded tablets with acceptable friability within a wide range of tablet hardness (5.0-12.0 kP). Tablets with hardness within this range demonstrated acceptable dissolution (> 85% in 30 min). CCS Level Dissolution All tablets showed rapid disintegration. The risk is reduced from high to low. Magnesium Stearate Level Dissolution The risk is reduced from high to low by optimizing extragranular magnesium stearate. Degradation Products The risk is reduced from medium to low by only using magnesium stearate extragranularly and by using talc to minimize the level of magnesium stearate needed. The stability data further demonstrated that the product was stable. 2.2.2 Overages There are no overages used in the formulation of Generic Acetriptan Tablets, 20 mg. 2.2.3 Physicochemical and Biological Properties Refer to Section 1.4 for a discussion of the dissolution method development and the results of the pilot bioequivalence study. 2.3 Manufacturing Process Development Note to Reader: There are various approaches to process development used in the generic pharmaceutical industry. This is one of many possible examples. All QbD approaches to process development should identify the critical material attributes (CMAs) and critical process parameters (CPPs) for each process step. A firm may choose to do this through reference to documented prior knowledge or through empirical experiments on a range of process scales building toward the exhibit scale and proposed commercial scale. The process development of pre-roller compaction blending and lubrication is an example of experimentally determining CPPs when there is variation in an input material attribute. QbD emphasizes building understanding to avert failures during scale-up. The multivariate experiments described here are a step toward defining acceptable ranges for CPPs and CMAs. Steps to establish process understanding are as follows:  Identify all possible known material attributes and process parameters that could impact the performance of the process. April 2012 49
  • 50. Example QbD IR Tablet Module 3 Quality 3.2.P.2 Pharmaceutical Development April 2012 50  Use risk assessment and scientific knowledge to identify potentially high risk attributes and/or parameters.  Identify levels or ranges of these potentially high risk attributes and/or parameters.  Design and conduct experiments, using DOE when appropriate.  Analyze the experimental data to determine if a material attribute or process parameter is critical. - A material attribute or process parameter is critical when a realistic change in that attribute or parameter can significantly impact the quality of the output material.  Develop a control strategy. As discussed in Section 2.2.1.3 Process Selection, roller compaction was chosen as an appropriate granulation method to avoid drug product degradation and the equipment train was selected. Figure 21 presents the process map for the finalized formulation of Generic Acetriptan Tablets, 20 mg. Each process step in the manufacturing process is listed in the sequence of occurrence. It also presents the material attributes and process parameters that can potentially impact intermediate and finished product quality attributes. The material attributes of the input materials and the process parameters used at the very first process step determine the quality attributes of the output material (intermediate) produced at this step. Material attributes of the intermediate from this step and process parameters of the subsequent process step in the manufacturing process will determine quality attributes of the next intermediate and, eventually, those of the finished drug product. This cycle repeats until the final process step where finished drug product is manufactured and the product quality attributes are evaluated. This map was used to guide the risk assessments performed during process development. Manufacturing process development studies were conducted at the 5.0 kg lab scale, corresponding to 25,000 units.
  • 51. Example QbD IR Tablet Module 3 Quality 3.2.P.2 Pharmaceutical Development Blend assay Blend uniformity Blend bulk density Blend flowability Blend compressibility / compactability Blend uniformity Blend assay Blend bulk density Blend flowability Blend compressibility / compactability Appearance Dimensions (length, width, thickness) Weight (individual and composite) Hardness Friability Content uniformity Assay Disintegration Dissolution Blender type Order of addition Blender fill level Rotation speed (if variable) Number of revolutions Intensifier bar (on / off) Holding time Discharge method Drum-to-hopper transfer Environment (temperature and RH) Blender type Order of addition Blender fill level Rotation speed (if variable) Number of revolutions Intensifier bar (on / off) Holding time Discharge method Drum-to-hopper transfer Environment (temperature and RH) Press type and number of stations Tooling design Feed frame paddle speed Feeder fill depth Pre-compression force Main compression force Press speed (dwell time) Hopper design Hopper fill level Drop height of finished tablets Run time Environment (temperature and RH) Manufacturing Process Steps Process Parameters Quality Attributes Of Output Materials Material Attributes Of Input Materials Pre-Roller Compaction Blending and Lubrication Acetriptan PSD Acetriptan cohesiveness Acetriptan flowability Excipient PSD Excipient flowability Excipient bulk density Excipient moisture content Excipient lot-to-lot variability Final Blending and Lubrication Granule uniformity Granule size distribution Granule flowability Granule bulk density Assay of granule sieve cut Magnesium stearate specific surface area Blend assay Blend uniformity Granule size distribution Blend bulk density Blend flowability Blend compressibility / compactability Ribbon thickness Ribbon density Granule uniformity Granule size distribution Granule flowability Granule bulk density Assay of granule sieve cut Blend holding time prior to RC Roller compactor type Feed screw speed Deaeration Roller surface design Roller pressure Roller speed Roller gap Environment (temperature and RH) Roller Compaction Blend assay Blend uniformity Blend bulk density Blend flowability Blend compressibility / compactability Compression (Tabletting) Milling Mill type Blade configuration / type / orientation Oscillation degree / speed Screen type Screen size Number of recycles Environment (temperature and RH) Ribbon thickness Ribbon density Figure 21. Process map for Generic Acetriptan Tablets, 20 mg April 2012 51
  • 52. Example QbD IR Tablet Module 3 Quality 3.2.P.2 Pharmaceutical Development 2.3.1 Initial Risk Assessment of the Drug Product Manufacturing Process A risk assessment of the overall drug product manufacturing process was performed to identify the high risk steps that may affect the CQAs of the final drug product. Subsequently, the intermediate CQAs of the output material from each process step that impact the final drug product CQAs were identified. For each process step, a risk assessment was conducted to identify potentially high risk process variables which could impact the identified intermediate CQAs and, ultimately, the drug product CQAs. These variables were then investigated in order to better understand the manufacturing process and to develop a control strategy to reduce the risk of a failed batch. This method of identifying process variables for further study is illustrated in Figure 22 and is applied in each process step risk assessment. Identify material attributes and process parameters that may impact the intermediate CQAs of the process step For each process step, identify intermediate CQAs that impact drug product CQAs Identify drug product CQAs Step 1: Step 2: Step 3: Identify material attributes and process parameters that may impact the intermediate CQAs of the process step For each process step, identify intermediate CQAs that impact drug product CQAs Identify drug product CQAs Step 1: Step 2: Step 3: Figure 22. Schematic of the method used to identify process variables for further study The initial risk assessment of the overall manufacturing process is shown in Table 32 and justifications are provided in Table 33. Previous experience with these process steps was used to determine the degree of risk associated with each process step and its potential to impact the CQAs of the finished drug product. Table 32. Initial risk assessment of the manufacturing process for Generic Acetriptan Tablets, 20 mg Drug Product CQAs Process Steps Pre-RC* Blending and Lubrication Roller Compaction Milling Final Blending and Lubrication Compression Assay Medium Low Medium Low Medium Content Uniformity High High High Low High Dissolution Medium High Medium High High Degradation Products Low Low Low Low Low *RC: roller compaction April 2012 52
  • 53. Example QbD IR Tablet Module 3 Quality 3.2.P.2 Pharmaceutical Development Table 33. Justification for the initial risk assessment of the manufacturing process for Generic Acetriptan Tablets, 20 mg Process Steps Drug Product CQAs Justification Pre-Roller Compaction Blending and Lubrication Assay Suboptimal pre-roller compaction blending and lubrication may cause variable flowability of the blend. The risk is medium. Content Uniformity The PSD and cohesiveness of the drug substance adversely impact its flowability which, in turn, affects CU. The risk is high. Dissolution Blending process variables may impact the distribution of CCS in the blend which could impact disintegration of the granules and, ultimately, dissolution of the tablets. The risk is medium. Degradation Products Blending process variables are unrelated to the degradation products of Generic Acetriptan Tablets, 20 mg. The risk is low. Roller Compaction Assay Roller compaction is performed to improve flow, minimize segregation and enhance CU. The risk is low. Content Uniformity Variability in ribbon density during processing can potentially impact the PSD of the milled granules, thus impacting flowability and, ultimately, CU. The risk is high. Dissolution Density of the ribbon can impact density and plasticity of the granules, thus impacting compressibility of the granules, hardness of the tablet and, ultimately, dissolution. The risk is high. Degradation Products Based on experience gained from other approved ANDAs using roller compaction, the roller temperature does not exceed 45 °C and the dwell time during roller compaction is very short. Thus, roller compaction should not impact degradation products. The risk is low. Milling Assay The milling step controls the final granule size distribution. A suboptimal distribution may affect flow, causing variable tablet weight and assay during compression. The risk is medium. Content Uniformity If milling generates excessive fines, both bulk density and flowability of the blend may be impacted. This, in turn, may impact CU. The risk is high. Dissolution A large amount of fines may impact tablet hardness and dissolution. The risk is medium. Degradation Products Although the screen may heat up during the milling process, the dwell time is brief. Milling is unlikely to impact degradation products. The risk is low. April 2012 53
  • 54. Example QbD IR Tablet Module 3 Quality 3.2.P.2 Pharmaceutical Development Process Steps Drug Product CQAs Justification Final Blending and Lubrication Assay The granule uniformity which affects assay and CU is controlled by earlier steps (pre-RC blending and lubrication as well as roller compaction and integrated milling). This step is to blend the granules with small quantities of extragranular glidant and lubricant and is unlikely to impact assay and CU. The risk is low. Content Uniformity Dissolution Over-lubrication due to an excessive number of revolutions may impact disintegration and, ultimately, dissolution of the tablets. The risk is high. Degradation Products Acetriptan is only susceptible to degradation at a high temperature (≥ 105 °C). Blending is unlikely to impact degradation products; therefore, the risk is low. Compression Assay In extreme cases, tablet weight variability can lead to t-ou of-specification assay results. The risk is medium. Content Uniformity Compression process variables such as feed frame paddle speed and press speed can cause tablet weight variability which could cause tablets to fall out-of-specification for CU. The risk is high. Dissolution Tablet hardness may be impacted if compression force is not adjusted to accommodate batch-to-batch variability in ribbon density. Over-lubrication of the blend by the feed frame paddle may also slow dissolution. The risk is high. Degradation Products Acetriptan is only susceptible to degradation at a high temperature (≥ 105 °C). Compression is unlikely to impact degradation products; therefore, the risk is low. Further risk assessment was performed subsequently on each high risk process step to identify which process variables may potentially impact the intermediate CQAs. Evaluation of all possible process variables that could potentially impact the quality attributes of the output material of any given process step is not feasible; therefore, some of the variables were set constant based on current understanding. 2.3.2 Pre-Roller Compaction Blending and Lubrication Process Development Initial Risk Assessment of the Pre-Roller Compaction Blending and Lubrication Process Variables The initial risk assessment of the overall manufacturing process presented in Table 32 identified the risk of the pre-roller compaction blending and lubrication step to impact tablet content uniformity as high. Subsequently, blend uniformity was identified as an intermediate CQA of the powder blend from the pre-roller compaction blending and lubrication step. Process variables that could potentially impact blend uniformity were identified and their associated risk was evaluated. Table 34 presents the initial risk assessment for the pre-roller compaction blending and lubrication step. April 2012 54
  • 55. Example QbD IR Tablet Module 3 Quality 3.2.P.2 Pharmaceutical Development Table 34. Initial risk assessment of the pre-roller compaction blending and lubrication process variables Process Step: Pre-Roller Compaction Blending and Lubrication Output Material CQA: Blend Uniformity Variables Risk Assessment Justification and Initial Strategy Input Material Attributes Acetriptan PSD High The pilot BE study indicated that a d90 ≤ 30 μm is needed for bioequivalence. Based on several lots of acetriptan analyzed during preformulation, the drug substance meeting this d90 criterion has poor flowability (ffc < 3.50) which may impact BU. The risk is high. Acetriptan cohesiveness Medium The specific energy of acetriptan Lot #1-4 indicated that acetriptan is moderately to highly cohesive which will make achieving BU more challenging. The risk is medium. Acetriptan flowability Medium The ffc value of acetriptan Lot #1-4 suggested poor flow which could impact BU. The risk is medium. Excipient flowability Low Filler comprises the majority (~ 80%) of the formulation. MCC grade B02 and lactose monohydrate grade A01 are used in a 1:1 ratio because this ratio demonstrated good flowability (ffc ≈ 7). Glidant and lubricant are used in small quantities and are unlikely to impact BU. The risk is low. Excipient PSD Low Experience with previously approved ANDA 123456 and ANDA 456123 demonstrated that when the selected grades of MCC and lactose monohydrate are used in a 1:1 ratio, the flowability is good. This suggests that the PSD of the fillers will not impact BU. Because the quantities of glidant and lubricant used are small, their PSD are unlikely to impact BU. The risk is low. Excipient bulk density Low The 1:1 ratio of MCC to lactose monohydrate has a comparable bulk density to acetriptan. Glidant and lubricant are used in small quantities and their bulk densities are unlikely to impact BU. The risk is low. Excipient moisture content Low The moisture content of the excipients is controlled per compendial/in-house specifications. Based on previous experience with approved ANDA 123456, excipient moisture content did not exhibit any significant impact on BU. The risk is low. Excipient lot-to-lot variability Low Large variations in the PSD of the excipients could impact BU; however, previous experience with the chosen excipient grades has shown that the lot-to-lot variability within grade is minimal. The risk is low. April 2012 55
  • 56. Example QbD IR Tablet Module 3 Quality 3.2.P.2 Pharmaceutical Development Process Step: Pre-Roller Compaction Blending and Lubrication Output Material CQA: Blend Uniformity Variables Risk Assessment Justification and Initial Strategy Blending Variables Blender type Low Different blender types have different mixing dynamics. V-blender is selected based on equipment availability. The risk is low. However, if the blender type is changed during scale-up or commercialization, the risk should be re-evaluated. Order of addition Low Order of addition may impact the ease of evenly dispersing ingredients charged in lower quantities. Materials are added in the following order: lactose monohydrate, CCS, acetriptan, talc, and MCC. The risk is low. Rotation speed (rpm) Medium Rotation speed is often fixed by equipment constraint. Different size blenders have different rotation speeds. The rotation speed for the 16 qt blender is fixed at 20 rpm. The risk is medium. Number of revolutions High Under- or over-blending will result in suboptimal BU. The risk is high. Intensifier bar (on/off) Low The intensifier bar is often not needed to improve BU. In addition, the intensifier bar may interfere with BU measurements if an NIR probe is used. The intensifier bar is fixed in the off position. The risk is low. Blender fill level High The blender fill level depends on equipment capacity, blend bulk density (0.43-0.48 g/cc) and batch size. Since the blender fill level may affect mixing dynamics, the risk is high. Holding time Medium Even if adequate BU is achieved, the drug substance may segregate prior to granulation during holding, discharge or transfer. The risk is medium. Blender discharge Medium Drum-to-hopper transfer Medium Environment (temperature and RH) Low If not controlled, fluctuations in the facility temperature and RH could impact BU. Routine environment temperature and RH set point in the cGMP manufacturing facility is fixed at 25 ºC ± 5% and 40%-60% RH, respectively, and will be monitored during manufacturing. The risk is low. Effect of Acetriptan PSD and Number of Revolutions on Blend Uniformity Due to its low solubility, acetriptan is milled to improve its bioavailability. The milled drug substance has poor flow characteristics and is cohesive. Thus, roller compaction is performed prior to compression to achieve tablet content uniformity. The success of roller compaction to produce uniform granules is largely contingent on the uniformity of the blend achieved during the preceding blending and lubrication step. The pilot PK study suggested that Generic Acetriptan Tablets, 20 mg, with a drug substance d90 of 30 μm (d50 of 24 μm) or less would be bioequivalent to the RLD. During April 2012 56
  • 57. Example QbD IR Tablet Module 3 Quality 3.2.P.2 Pharmaceutical Development formulation development, a PSD with a d90 less than 14 μm led to flow and content uniformity issues. However, the blending process was fixed at that stage of development. Thus, it was important to determine if an optimized blending process could accommodate different acetriptan PSD without adversely impacting blend uniformity. A two-factor, three-level full factorial DOE, as shown in Table 35, was used to investigate the impact of acetriptan PSD (d90) and number of revolutions (Nrev) on blend uniformity. Blender fill level is also likely to impact blend uniformity based on the initial risk assessment, but this process parameter was evaluated subsequent to the DOE. The optimized formulation shown in Section 2.2.1.6 Table 29 was used for this study. Table 35. Design of the 32 study to investigate pre-RC blending and lubrication process variables Factors: Process Variables Levels 0 1 2 A Number of revolutions (Nrev) 100 200 300 B Acetriptan d90 (μm) 10 20 30 Responses Goal Acceptable Ranges Y1 Blend Assay (% w/w) Achieve 100% w/w Assay mean of all locations: 95.0-105.0% w/w Y2 Blend Uniformity (% RSD) Minimize % RSD % RSD of all locations: ≤ 5% Each 5.0 kg batch was blended in a 16 qt blender operated at 20 rpm. To measure blend uniformity, sampling was performed at the 10 blender locations designated in Figure 23 at the end of the specified number of revolutions. The sample thief was calibrated such that the collected sample volume represented one to three unit doses of blend (200.0- 600.0 mg). FE I J A B H G D C FE I J A B H G H G D C D C A = Left-Left-Top (left arm) B = Left-Right-Top (left arm) C = Left-Front-Middle (left arm) D = Left-Rear-Middle (left arm) E = Right-Right-Top (right arm) F = Right-Left-Top (right arm) G = Right-Front-Middle (right arm) H = Right-Rear-Middle (right arm) I = Center-Middle J = Discharge Port Figure 23. Sampling locations in the V-Blender The blend uniformity results are presented in Table 36. April 2012 57
  • 58. Example QbD IR Tablet Module 3 Quality 3.2.P.2 Pharmaceutical Development Table 36. Results of the pre-RC blending and lubrication optimization study Batch No. Factors: Process Variables Response A: Nrev B: Acetriptan d90 Y2: BU -- (μm) (% RSD) 21 100 10 8.9 22 100 30 5.4 23 300 20 2.5 24 100 20 6.8 25 200 20 3.0 26 300 10 3.2 27 300 30 2.3 28 200 30 2.8 29 200 10 4.3 Based on the sum of squares of sequential models (i.e., linear, two factor interaction, quadratic and cubic), the highest order polynomial model was selected where the additional terms were significant and the model was not aliased. The model terms were further reduced based on the significance level (α = 0.05) using the backward model selection method. Significant factors for blend uniformity The effect of A (Nrev) and B (drug substance PSD) on blend uniformity was best described by a quadratic model where the significant factors were A, B, AB interaction and A2 . The interaction plot below (Figure 24) shows that the blend uniformity response depended on the settings of the two factors. At a lower number of revolutions, the acetriptan PSD had a greater impact on blend uniformity than at a higher number of revolutions. At 100 revolutions, each of the three acetriptan PSD investigated failed to meet the predefined criterion of less than 5% RSD. April 2012 58
  • 59. Example QbD IR Tablet Module 3 Quality 3.2.P.2 Pharmaceutical Development Design Points B- 10 Blend Uniformity (% RSD) A: Number of revolutions (Nrev) B: DS PSD (d90, μm) B+ 30 B: DS PSD (d90, μm) 100 150 200 250 300 A: Number of revolutions (Nrev) BlendUniformity(%RSD) Interaction 10.0 8.0 6.0 4.0 2.0 0.0 Figure 24. Effect of number of revolutions and drug substance PSD on blend uniformity Significant factors for blend assay Neither the number of revolutions nor the drug substance PSD had a significant impact on mean blend assay. Results were close to the target for each run and ranged from 98.7%-101.2% overall. Development of In-line NIR for Blending Endpoint Determination Note to Reader: NIR method development and validation is beyond the scope of the pharmaceutical development report and the details are not discussed in this example. The validation report should be included in Section 3.2.P.5.3 Validation of Analytical Procedures. In order to ensure a homogeneous blend for any input acetriptan drug substance d90 within the range of 10-30 μm, an in-line NIR spectrophotometric method was developed and validated. This technology allows a real-time response and can be used at the laboratory, pilot and commercial scale. During validation, blend uniformity data collected at various time points by the NIR method was compared to that obtained by traditional thief sampling followed by offline HPLC analysis and was found to be comparable. Additionally, validation showed that blends deemed homogeneous by the NIR method ultimately produced tablets with acceptable content uniformity (% RSD < 5%). Based on these findings, the NIR method is capable of accurately assessing the real-time homogeneity of the blend and can be used to control the endpoint of the blending process. Further information regarding the NIR method development and validation can be found in Section 3.2.P.5.3 Validation of Analytical Procedures. Three 5.0 kg batches (Batch Nos. 30-32) were manufactured using acetriptan with a d90 of 10 μm, 20 μm, and 30 μm, respectively. During blending, one spectrum was acquired April 2012 59
  • 60. Example QbD IR Tablet Module 3 Quality 3.2.P.2 Pharmaceutical Development non-invasively through the sight glass of the V-blender for each revolution as the V- blender was in the inverted position. The NIR spectra were preprocessed to minimize the effects of particle size and path length and to resolve the acetriptan peak. To assess the homogeneity of the blend, % RSD was calculated for each moving block of ten consecutive spectra and plotted as a function of number of revolutions. The blend was considered homogeneous once the % RSD was below 5% for ten consecutive measurements. This criterion ensured that brief excursions below the 5% threshold did not result in blending termination. For an acetriptan d90 of 10 μm, 20 μm and 30 μm, the blending endpoint determined by NIR as shown in Figure 25 was 368 revolutions, 285 revolutions and 234 revolutions, respectively. The blending uniformity showed rapid initial change through macro (convection) mixing followed by slower micro (diffusion) mixing. 0 5 10 15 20 0 100 200 300 400 500 Number of revolutions (Nrev) RSDofMovingBlock(%) acetriptan d90 30 μm acetriptan d90 20 μm acetriptan d90 10 μm Figure 25. Blending endpoint determined by in-line NIR for acetriptan d90 of 10 μm, 20 μm and 30 μm A fourth 5.0 kg batch (Batch No. 33) was manufactured using acetriptan with a d90 of 20 μm. The validated NIR method was used to determine the blending endpoint, but feedback control was not used to terminate the process. Blending was continued for a total of 500 revolutions to look for evidence of demixing. Figure 26 indicates that demixing did not occur as the % RSD did not increase when the batch was blended beyond the NIR-determined endpoint for a total of 500 revolutions. April 2012 60
  • 61. Example QbD IR Tablet Module 3 Quality 3.2.P.2 Pharmaceutical Development 0 5 10 15 20 0 100 200 300 400 500 Number of revolutions (Nrev) RSDofMovingBlock(%) acetriptan d90 20 μm Figure 26. % RSD of the moving block of the NIR spectra for acetriptan d90 of 20 μm blended for 500 revolutions Effect of Blender Fill Level on Blend Uniformity Another study was performed to evaluate the impact of blender fill level on blend uniformity using acetriptan Lot #2 with a d90 of 20 μm. Each blend (Batch Nos. 34-36) was mixed in a 16 qt V-blender at 20 rpm and monitored using an NIR probe. Blend uniformity was achieved at approximately 280-290 revolutions for all three fill levels, 35%, 55% and 75%, indicating that blender fill level does not have a significant impact on the blending endpoint within the range of fill levels studied. Summary of Pre-Roller Compaction Blending and Lubrication Process Development Based on the results of the pre-roller compaction blending and lubrication studies, an in- line NIR method will be used to determine the blending endpoint. The number of revolutions needed to achieve blend uniformity differed depending on the acetriptan d90 in the range of 10-30 μm. Within the range of 35-75%, the blender fill level did not adversely impact blend uniformity. UpdatedRiskAssessmentofthePre-RollerCompactionBlendingandLubricationProcessVariables Table 37 presents the risk reduction for the pre-roller compaction blending and lubrication process as a result of the development studies. Only the process variables that were initially identified as high risk to the blend uniformity are shown. April 2012 61
  • 62. Example QbD IR Tablet Module 3 Quality 3.2.P.2 Pharmaceutical Development Table 37. Updated risk assessment of the pre-roller compaction blending and lubrication process variables Process Step: Pre-Roller Compaction Blending and Lubrication Output Material CQA: Blend Uniformity Variables Risk Assessment Justification for the Reduced Risk Acetriptan PSD Low In order for the blending process to be robust enough to accommodate different acetriptan PSD, an in-line NIR method was developed for blending endpoint determination. Blender fill levels from 35-75% had no impact on blending endpoint. The risk was reduced from high to low. Number of revolutions Low Blender fill level Low 2.3.3 Roller Compaction and Integrated Milling Process Development Initial Risk Assessment of the Roller Compaction and Integrated Milling Process Variables Based on the initial risk assessment of the overall manufacturing process shown in Table 32, the risk of the roller compaction step to impact tablet content uniformity and dissolution was identified as high and the risk of the milling step to impact tablet content uniformity was identified as high. Due to equipment availability, an Alexanderwerk10 WP120 roller compactor with integrated milling was used for this study. Therefore, these two steps were studied together. Subsequently, ribbon density, granule size distribution, granule uniformity and granule flowability were identified as the intermediate CQAs of the output material from the roller compaction and integrated milling step. Ribbon density is an intermediate CQA because it has a direct impact on granule particle size distribution, granule bulk and tapped density, granule flowability, and, ultimately, tablet hardness and dissolution. Granule size distribution, granule uniformity and granule flowability are intermediate CQAs because they are intimately related to tablet weight variability and content uniformity. The input material attributes and process parameters for this step that could potentially impact the four intermediate CQAs of the output material were identified and their associated risk was evaluated. The result of the initial risk assessment is summarized in Table 38. Table 38. Initial risk assessment of roller compaction and integrated milling process variables Process Step: Roller Compaction and Integrated Milling Output Material CQAs: Ribbon Density, Granule Size Distribution, Granule Uniformity and Granule Flowability Variables Output Material CQAs Risk Assessment Justification and Initial Strategy Input Material Attributes Blend bulk density Ribbon Density Low The formulation has been optimized (Section P.2.2). Consistent blend bulk density between 0.43-0.48 g/cc was observed. This low variability of blend bulk density has a negligible impact on the four CQAs. The risk is low. Granule Size Distribution Low Granule Uniformity Low Granule Flowability Low Blend assay Ribbon Density Low The assay of the final blend was consistently within 95.0-105.0% w/w (ranging from 98.7- 101.2%). The risk is low. Granule Size Distribution Low Granule Uniformity Low Granule Flowability Low April 2012 62
  • 63. Example QbD IR Tablet Module 3 Quality 3.2.P.2 Pharmaceutical Development Process Step: Roller Compaction and Integrated Milling Output Material CQAs: Ribbon Density, Granule Size Distribution, Granule Uniformity and Granule Flowability Variables Output Material CQAs Risk Assessment Justification and Initial Strategy Blend uniformity Ribbon Density Low In-line NIR monitoring is used to achieve adequate blend uniformity (RSD < 5%). The risk is low. Granule Size Distribution Low Granule Uniformity Low Granule Flowability Low Blend compressibility/ compactability Ribbon Density Low Compressibility and compactability were optimized during formulation development. The tablet demonstrated good friability (< 0.2% weight loss) at low hardness (5.0 kP) and achieved the desired dissolution at high hardness (12.0 kP). The risk is low. Granule Size Distribution Low Granule Uniformity Low Granule Flowability Low Blend flowability Ribbon Density Low The blend demonstrated acceptable flowability (ffc > 6). The risk is low. Granule Size Distribution Low Granule Uniformity Low Granule Flowability Low Roller Compaction and Milling Process Variables Pre-RC blend holding time Ribbon Density Low Due to the cohesiveness of acetriptan, no demixing was observed with extended blending up to 500 revolutions. The risk of the pre-RC blend to segregate during holding is low. Granule Size Distribution Low Granule Uniformity Low Granule Flowability Low Roller compactor type Ribbon Density Low Due to operating principle differences between roller compactors, the ribbon attributes and PSD of milled granules can vary significantly. Based on availability, Alexanderwerk WP 120 is selected and fixed for development work. The risk is low. However, if the roller compactor type is changed during scale-up or commercialization, the risk should be re-evaluated. Granule Size Distribution Low Granule Uniformity Low Granule Flowability Low Deaeration Ribbon Density Low Deaeration is used to enhance the flow of the blend feeding into the roller compactor. It will always be used and is considered a fixed factor. The risk is low. Granule Size Distribution Low Granule Uniformity Low Granule Flowability Low Feed screw speed Ribbon Density Medium Feed screw speed is a floating parameter dependent on roller pressure and roller gap. The risk is medium. Granule Size Distribution Medium Granule Uniformity Medium Granule Flowability Medium Roller surface design Ribbon Density Low Roller surface design may impact the power feeding from the slip region into the nip region. For this product, a roller with a knurled surface was selected to enhance material feeding by providing more friction than a smooth surface roller and is considered a fixed factor. The risk is low. Granule Size Distribution Low Granule Uniformity Low Granule Flowability Low April 2012 63
  • 64. Example QbD IR Tablet Module 3 Quality 3.2.P.2 Pharmaceutical Development Process Step: Roller Compaction and Integrated Milling Output Material CQAs: Ribbon Density, Granule Size Distribution, Granule Uniformity and Granule Flowability Variables Output Material CQAs Risk Assessment Justification and Initial Strategy Roller pressure Ribbon Density High Ribbon density is directly related to roller pressure and, in turn, may impact the PSD, flowability, uniformity, compressibility and compactability of the milled granules. The risk is high. Granule Size Distribution High Granule Uniformity High Granule Flowability High Roller speed Ribbon Density Medium The roller speed determines the throughput of the process and is adjusted according to the selected feed screw speed to avoid material build-up. In addition, roller speed is inversely related to the dwell time for particle compaction which may impact the ribbon density. Based on previous experience with approved ANDA 123456 using roller compaction, roller speed is fixed to 8 rpm. Adjustment may be needed. The risk is medium. Granule Size Distribution Medium Granule Uniformity Medium Granule Flowability Medium Roller gap Ribbon Density High According to the Johanson model13 , ribbon density is inversely related to the roller gap and, in turn, it may impact PSD, flowability, uniformity, compressibility and compactability of the milled granules. The risk is high. Granule Size Distribution High Granule Uniformity High Granule Flowability High Mill type Ribbon Density N/A The ribbon is formed during the roller compaction step. Granule Size Distribution Low The type of mill governs the type of attrition and impacts the PSD of the milled granules. An integrated mill was selected and is considered a fixed factor. The risk is low. However, if the mill type is changed during scale-up or commercialization, the risk should be re-evaluated. Granule Uniformity Low Granule Flowability Low Mill screen type Ribbon Density N/A The ribbon is formed during the roller compaction step. Granule Size Distribution Low The mill screen type may impact the granule size distribution, granule uniformity and granule flowability obtained from the milling step. A mesh screen is selected based on availability. The risk is low. If the mill screen type is changed, risk will need to be reassessed. Granule Uniformity Low Granule Flowability Low April 2012 64 13 Johanson, J. R. A rolling theory for granular solids. ASME, Journal of Applied Mechanics Series E, 1965, 32(4): 842–848.
  • 65. Example QbD IR Tablet Module 3 Quality 3.2.P.2 Pharmaceutical Development Process Step: Roller Compaction and Integrated Milling Output Material CQAs: Ribbon Density, Granule Size Distribution, Granule Uniformity and Granule Flowability Variables Output Material CQAs Risk Assessment Justification and Initial Strategy Mill speed Ribbon Density N/A The ribbon is formed during the roller compaction step. Granule Size Distribution High The mill speed may impact the PSD of the milled granules which can potentially impact granule uniformity and flowability. The risk is high. Granule Uniformity High Granule Flowability High Blade configuration Ribbon Density N/A The ribbon is formed during the roller compaction step. Granule Size Distribution Low The milling blade can apply variable shear to the material based on design. Low shear can result in a coarser but more uniform PSD, whereas high shear can result in a non-uniform, multi-modal PSD. The resulting PSD affects flowability and uniformity. The risk is low because the blade is fixed by equipment design. Granule Uniformity Low Granule Flowability Low Mill screen orifice size Ribbon Density N/A The ribbon is formed during the roller compaction step. Granule Size Distribution High The mill screen orifice size directly impacts PSD which can potentially impact granule uniformity and flowability. The risk is high. Granule Uniformity High Granule Flowability High Number of recycles Ribbon Density Medium If excessive powder leakage occurs during roller compaction or excessive fines are generated during milling, recycles of the fine particles may be considered. However, the number of recycles may impact the homogeneity of the granule quality attributes. The goal is to not recycle material. The risk is medium. Granule Size Distribution Medium Granule Uniformity Medium Granule Flowability Medium Environment (temperature and RH) Ribbon Density Low If not controlled, fluctuations in the facility temperature and RH could impact the CQAs. Routine environment temperature and RH set point in the cGMP manufacturing facility is fixed at 25 ºC ± 5% and 40%-60% RH, respectively, and will be monitored during manufacturing. The risk is low. Granule Size Distribution Low Granule Uniformity Low Granule Flowability Low Effect of Roller Pressure, Roller Gap, Milling Speed and Mill Screen Orifice Size The main objective of the study was to evaluate the effect of the roller compaction and integrated milling process parameters on the quality attributes of the ribbon, milled granules and finished drug product using DOE. The process parameters investigated were roller pressure, roller gap, milling speed and mill screen orifice size. A preliminary feasibility experiment was conducted to study the effect of roller pressure on the quantity of by-pass material (un-compacted material). The study showed that April 2012 65
  • 66. Example QbD IR Tablet Module 3 Quality 3.2.P.2 Pharmaceutical Development within the roller pressure range of 20-80 bar, the quantity of by-pass material was less than 5% and the potency matched that of the blend fed into the roller compactor. Therefore, the roller pressure range of 20-80 bar was suitable for further studies. During the feasibility study, product temperature was monitored by a non-invasive measuring device. No significant increase (> 5°C) was observed. The ranges for roller gap, mill speed and mill screen orifice size were selected based on previous experience with approved ANDA 123456 and ANDA 456123. For this study, a 24-1 fractional factorial DOE was used and three center points were included to evaluate if any curvature effects exist. Table 39 presents the study design. Table 39. Design of the 24-1 DOE to study roller compaction and integrated milling process variables Defining Relation I=ABCD Resolution IV Factors: Process Variables Levels -1 0 +1 A Roller pressure (bar) 20 50 80 B Roller gap (mm) 1.2 1.8 2.4 C Mill speed (rpm) 20 60 100 D Mill screen orifice size (mm) 0.6 1.0 1.4 Responses Goal Acceptable Ranges Y1 Ribbon density (g/cc) Target at 1.1 1.0-1.2 Y2 d10 of milled granules (μm) Target at 100 μm 50-150 μm Y3 d50 of milled granules (μm) Target at 600 μm 400-800 μm Y4 d90 of milled granules (μm) Target at 1000 μm 800-1200 μm Y5 Granule uniformity (% RSD) Minimize % RSD < 5% Y6 Granule flowability (ffc) Maximize > 6 Y7 Assay of granule sieve cut (% w/w) Target at 100% w/w 95.0-105.0% w/w Y8 Tablet hardness@ 5 kN (kP) Maximize > 5.0 kP Y9 Tablet hardness @ 10 kN (kP) Maximize > 9.0 kP Y10 Tablet hardness @ 15 kN (kP) Maximize > 12.0 kP Y11 Friability @ 5 kN (%) Minimize < 1.0% Y12 Friability @ 10 kN (%) Minimize < 1.0% Y13 Friability @ 15 kN (%) Minimize < 1.0% Y14 Tablet assay (% w/w) Target at 100% w/w 95.0-105.0% w/w Y15 Tablet content uniformity (% RSD) Minimize % RSD < 5% Y16 Tablet disintegration time (min) Minimize < 5 min Y17 Dissolution at 30 min (%) Maximize > 80% Approximately 50.0 kg of the intragranular excipients and drug substance (Lot #2) were blended in a 150 L diffusive V-blender operated at 12 rpm. The blender was equipped with an NIR probe to monitor the blending endpoint (RSD < 5%, target revolutions ~234). The powder mixture was subdivided into 11 batches, each ~4.5 kg in size. The remaining 0.5 kg of powder was used as a control and was not roller compacted. Each batch of blended powder was roller compacted using an Alexanderwerk WP120 (roller diameter 120 mm and roller width 25 mm) using the parameters defined in Table April 2012 66
  • 67. Example QbD IR Tablet Module 3 Quality 3.2.P.2 Pharmaceutical Development 40. The integrated milling unit on the Alexanderwerk WP120 is equipped with a ribbon crusher and a two-step milling apparatus. The ribbon is crushed into small flakes. The crushed flakes will first go through a coarse screen milling (sizing) step in which the rotor operates at 80% of the milling speed used for the second step. The second step is designed for final milling. In this study, the coarse screen size was fixed at 2.0 mm. The milling speed and milling screen orifice size of the second step are shown in Table 40. The milled granules were blended with talc for 100 revolutions in a 16 qt V-blender operated at 20 rpm. Magnesium stearate was then added and blended for an additional 80 revolutions. Each batch was compressed into tablets with a target weight of 200.0 mg. The tablet hardness and friability were studied as a function of main compression force. Three compression forces, 5 kN, 10 kN and 15 kN, were used. To study tablet assay, content uniformity (% RSD), disintegration and dissolution, the main compression force was adjusted to achieve a target hardness of 9.0 kP (8.0-10.0 kP was allowed). Table 40 presents the experimental results for ribbon density, mean granule size (d50), granule flowability (ffc), tablet hardness observed at 10 kN force and tablet content uniformity (% RSD) (other responses not shown). Table 40. Experimental results for the roller compaction and integrated milling DOE Batch No. Factors Responses A: Roller pressure B: Roller gap C: Mill speed D: Mill screen Y1 Ribbon density Y3 Granule d50 Y6 Granule Flowability (ffc) Y9 Hardness @ 10 kN Y15 Tablet CU (bar) (mm) (rpm) (mm) (g/cc) (μm) -- (kP) (% RSD) 37 50 1.8 60 1.0 1.132 649 7.64 10.9 3.1 38 20 2.4 100 0.6 0.943 268 4.19 14.4 5.3 39 20 1.2 20 0.6 1.002 264 5.26 13.4 4.2 40 80 2.4 100 1.4 1.211 1227 9.83 10.1 2.1 41 80 1.2 20 1.4 1.285 1257 10.46 7.8 1.4 42 20 2.4 20 1.4 0.942 739 6.28 14.5 3.5 43 50 1.8 60 1.0 1.118 639 7.52 10.7 2.8 44 80 1.2 100 0.6 1.278 346 8.61 9.0 2.7 45 50 1.8 60 1.0 1.104 611 7.88 11.4 2.9 46 20 1.2 100 1.4 1.005 687 7.47 12.9 3.1 47 80 2.4 20 0.6 1.206 328 7.25 10.0 2.8 Significant factors for ribbon density As shown in the half-normal plot (Figure 27), the significant factors affecting ribbon density were A (roller pressure) and B (roller gap). The effect of roller pressure and roller gap on ribbon density is presented in Figure 28. Ribbon density increased with increasing roller pressure (positive effect) and decreasing roller gap (negative effect). April 2012 67
  • 68. Example QbD IR Tablet Module 3 Quality 3.2.P.2 Pharmaceutical Development Half-Normal%Probability |Standardized Effect| 0.00 0.07 0.14 0.20 0.27 0 10 20 30 50 70 80 90 95 A B Error Estimates Ribbon density (g/cc) Shapiro-Wilk Test W-value = 0.933 p-value = 0.617 A: Roller pressure (bar) B: Roller gap (mm) C: Mill speed (rpm) D: Mill screen orifice size (mm) Positive Effects Negative Effects Figure 27. Half-normal plot of the process variable effects on ribbon density Ribbon density (g/cc) 1.28 0.94 A: Roller pressure (bar) B: Roller gap (mm) Actual Factors: C: Mill speed (rpm) = 60 D: Mill screen orifice size = 1.0 2.4 2.1 20 30 40 50 60 70 80 1.2 1.5 1.8 A: Roller pressure (bar) B:Rollergap(mm) 1.00 1.05 1.151.10 1.20 1.25 Figure 28. Effect of roller pressure and roller gap on ribbon density Significant factors for mean granule size (d50) The half-normal plot (Figure 29) shows that the significant factors affecting mean granule size (d50) were D (mill screen orifice size), A (roller pressure) and AD (their interaction). The contour plot presented in Figure 30 shows the effect of mill screen orifice size and roller pressure on granule d50. It is evident that d50 increased with increasing mill screen orifice size and roller pressure (positive effect). These two parameters also exhibited a April 2012 68
  • 69. Example QbD IR Tablet Module 3 Quality 3.2.P.2 Pharmaceutical Development strong interaction (i.e., roller pressure showed a larger impact on mean granule size when using a larger mill screen orifice size). Granule d50 (μm) Shapiro-Wilk Test W-value = 0.950 p-value = 0.714 A: Roller pressure (bar) B: Roller gap (mm) C: Mill speed (rpm) D: Mill screen orifice size (mm) Half-Normal%Probability |Standardized Effect| 0 169 338 507 676 0 10 20 30 50 70 80 90 95 A D AD Error Estimates Positive Effects Negative Effects Figure 29. Half-normal plot of the process variable effects on mean granule size (d50) 1257 264 D: Mill screen orifice size (mm) A: Roller pressure (bar) Actual Factors: B: Roller gap (mm) = 1.8 C: Mill speed (rpm) = 60 80 0.6 0.8 1.0 1.2 1.4 20 30 40 50 60 70 Granule d50 (μm) D: Mill screen orifice size (mm) A:Rollerpressure(bar) 1000 800 400 600 Figure 30. Effect of mill screen orifice size and roller pressure on mean granule size (d50) April 2012 69
  • 70. Example QbD IR Tablet Module 3 Quality 3.2.P.2 Pharmaceutical Development Significant factors for granule flowability The flowability (represented by ffc value) of the granules after milling was determined using a ring shear tester. As shown in the half-normal plot (Figure 31), the significant factors affecting granule flowability were A (roller pressure), D (mill screen orifice size) and B (roller gap). The effect of roller pressure and mill screen orifice size on granule flowability is shown in Figure 32. Granule flowability improved with increasing roller pressure and mill screen orifice size. Roller gap also had an impact on granule flowability but to a lesser extent. Granule flowability (ffc) Shapiro-Wilk Test W-value = 0.952 p-value = 0.726 A: Roller pressure (bar) B: Roller gap (mm) C: Mill speed (rpm) D: Mill screen orifice size (mm) Half-Normal%Probability |Standardized Effect| 0.00 0.40 0.81 1.21 1.62 2.02 2.43 2.83 3.24 0 10 20 30 50 70 80 90 95 A B D Error Estimates Positive Effects Negative Effects Figure 31. Half -normal plot of the process variable effects on granule flowability (ffc) Granule flowability (ffc) 10.5 4.2 A: Roller pressure (bar) D: Mill screen orifice size (mm) Actual Factors: B: Roller gap (mm) = 1.8 C: Mill speed (rpm) = 60 1.4 20 30 40 50 60 70 80 0.6 0.8 1.0 1.2 A: Roller pressure (bar) D:Millscreenorificesize(mm) 9.0 7.0 8.0 6.0 Figure 32. Effect of roller pressure and mill screen orifice size on granule flowability (ffc) April 2012 70
  • 71. Example QbD IR Tablet Module 3 Quality 3.2.P.2 Pharmaceutical Development Significant factors for granule uniformity (% RSD) All batches demonstrated acceptable granule uniformity (ranging from 2.0-2.9% RSD) and none of the process variables showed a significant impact on this response. Significant factors for assay of granule sieve cuts Approximately 10 g of granules were sampled from each batch and transferred to the top of a set of seven sieves stacked by decreasing size: 840 μm, 420 μm, 250 μm, 180 μm, 149 μm, 75 μm and pan (no opening for fine collection). The sieves were shaken for five minutes on a laboratory particle size analyzer. The assay of sieve cuts collected from each batch was analyzed. All batches demonstrated acceptable assay for each granule sieve cut (ranging from 98.2-102.0%). This data confirmed that segregation of the pre- roller compacted blend did not occur. None of the factors were shown to have a significant impact on the assay of granule sieve cuts. Significant factors for tablet hardness As shown in the half-normal plot (Figure 33), the significant factors affecting tablet hardness when compressed using 10 kN of force were A (roller pressure) and B (roller gap). The effect of roller pressure and roller gap on tablet hardness is presented in Figure 34. Tablet hardness decreased with increasing roller pressure and decreasing roller gap. Error Estimates Positive Effects Negative Effects Hardness @10 kN (kP) Shapiro-Wilk Test W-value = 0.952 p-value = 0.752 A: Roller pressure (bar) B: Roller gap (mm) C: Mill speed (rpm) D: Mill screen orifice size (mm) Half-Normal%Probability |Standardized Effect| 0.00 1.14 2.29 3.43 4.58 0 10 20 30 50 70 80 90 95 A B Figure 33. Half-normal plot of the process variable effects on tablet hardness @ 10 kN April 2012 71
  • 72. Example QbD IR Tablet Module 3 Quality 3.2.P.2 Pharmaceutical Development 14.5 7.8 2.4 2.1 m) Hardness @ 10 kN (kP) A: Roller pressure (bar) B: Roller gap (mm) Actual Factors: C: Mill speed (rpm) = 60 D: Mill screen orifice size (mm) = 1.0 20 30 40 50 60 70 80 1.2 1.5 1.8 A: Roller pressure (bar) Figure 34. Effect of roller pressure and roller gap on tablet hardness @ 10 kN B:Rollergap(m 14.0 13.0 12.0 11.0 10.0 9.0 Since both ribbon density and tablet hardness were impacted by roller pressure and roller gap, it was logical to evaluate if any correlation existed between these two quality attributes. As shown in Figure 35, an inverse relationship was observed between ribbon density and tablet hardness. The establishment of this relationship was significant as it enables an intermediate material attribute (ribbon density) to be used as an in-process control during roller compaction to facilitate successful downstream operation (tablet compression) and ensure the target for a final product quality attribute (dissolution) is met. y = -17.19x + 30.48 R 2 = 0.97 0 2 4 6 8 10 12 14 16 0.9 1.0 1.1 1.2 1.3 Tablethardness@10kN(kP) Ribbon density (g/cc) Figure 35. Relationship between ribbon density and tablet hardness April 2012 72
  • 73. Example QbD IR Tablet Module 3 Quality 3.2.P.2 Pharmaceutical Development Significant factors for tablet friability All tablets manufactured in Batch Nos. 37-47 exhibited acceptable friability (< 0.2% weight loss) when compressed using 10 kN and 15 kN of force. When 5 kN of compression force was used, Batch Nos. 41 and 44 exhibited low tablet hardness (< 5.0 kP) and failed the friability test. These two batches had high ribbon density (~ 1.28 g/cc). The remainder of the batches compressed using 5 kN of force showed acceptable friability (< 0.2% weight loss) and hardness was higher than 5.0 kP. Significant factors for tablet assay All batches demonstrated acceptable assay (ranging from 98.4-100.6%) which is well within the specification limits (95.0-105.0% w/w) and none of the factors showed a significant impact on tablet assay. Significant factors for tablet content uniformity (% RSD) Data analysis indicated that the curvature effect was not significant for tablet content uniformity. As shown in the half-normal plot (Figure 36), the significant factors affecting tablet content uniformity were A (roller pressure), D (mill screen orifice size) and B (roller gap). Figure 37 shows the effect of roller pressure and mill screen orifice size on tablet content uniformity. Tablet content uniformity improved as evidenced by a decreased % RSD with increasing roller pressure and mill screen orifice size. Roller gap had some impact on tablet content uniformity but to a lesser extent. Error Estimates Positive Effects Negative Effects Content Uniformity (% RSD) Shapiro-Wilk Test W-value = 0.946 p-value = 0.691 A: Roller pressure (bar) B: Roller gap (mm) C: Mill speed (rpm) D: Mill screen orifice size (mm) Half-Normal%Probability |Standardized Effect| 0.00 0.30 0.59 0.89 1.18 1.48 1.78 0 10 20 30 50 70 80 90 95 A B D Figure 36. Half-normal plot of the process variable effects on tablet content uniformity (% RSD) April 2012 73
  • 74. Example QbD IR Tablet Module 3 Quality 3.2.P.2 Pharmaceutical Development 5.3 1.4 1.4 (mm) A: Roller pressure (bar) D: Mill screen orifice size (mm) Actual Factors: B: Roller gap (mm) = 1.8 C: Mill speed (rpm) = 60 20 30 40 50 60 70 80 0.6 0.8 1.0 1.2 Content Uniformity (% RSD) A: Roller pressure (bar) D:Millscreenorificesize 2.5 3.0 3.5 4.0 2.0 Figure 37. Effect of roller pressure and mill screen orifice size on tablet content uniformity (%RSD) Significant factors for tablet disintegration All batches demonstrated rapid disintegration (< 4 min). None of the process variables studied had a significant impact on the disintegration time. Significant factors for tablet dissolution Tablet hardness had a significant impact on dissolution (see Section 2.3.5 Tablet Compression Process Development). Based on the inverse linear relationship between ribbon density and tablet hardness, it can be concluded that roller compaction will have an indirect impact on dissolution. For a ribbon with a reasonable density, target hardness can be achieved by adjusting the main compression force. However, it is well known that powder material loses a certain extent of its compressibility and compactability when roller compacted. Consequently, higher compression force is required to achieve the same tablet hardness for a higher ribbon density than for a lower ribbon density. On the other hand, when the ribbon density was low (≤ 1.0 g/cc), the flowability of the granules (Batches 2 and 3) was low (ffc < 6). Therefore, a range for ribbon density needs to be established such that the desired granule flowability is achieved and the required compression force will not exceed the maximum allowable tool tip pressure recommended by the tooling manufacturer. Based on the DOE results for tablet friability and granule flowability, the ribbon density will be controlled between 1.0-1.2 g/cc (i.e., ribbon relative density between 0.68-0.81; ribbon true density is 1.4803 g/cc in this study).14 Summary of roller compaction and integrated milling process development Roller pressure had a significant impact on ribbon density, mean granule size (d50), granule flowability, tablet hardness and tablet content uniformity. Increasing roller pressure increased ribbon density, granule mean particle size (d50), granule flowability April 2012 74 14 Ribbon relative density (solid fraction) = ribbon density/ribbon true density.
  • 75. Example QbD IR Tablet Module 3 Quality 3.2.P.2 Pharmaceutical Development and tablet content uniformity (lower % RSD). However, it had a negative impact on the compressibility and compactability of the granules as indicated by decreasing tablet hardness for any given compression force. Roller gap exhibited a significant impact on ribbon density, granule flowability, tablet hardness and tablet content uniformity. Increasing the roller gap decreased ribbon density, granule flowability and tablet content uniformity (higher % RSD). However, tablet hardness at a given compression force increased with increasing roller gap. Mill screen orifice size had a significant impact on mean granule size (d50), granule flowability and tablet content uniformity. Increasing mill screen orifice size increased granule mean particle size (d50), granule flowability and tablet content uniformity (lower % RSD). Mill speed did not show a significant impact on any of the responses studied. In addition, no curvature effects were observed for any of the responses. Based on the results of the DOE study, roller pressure, roller gap and mill screen orifice size were identified as the CPPs while mill speed was determined to be not critical. The overlay plot shown in Figure 38 was used to identify an appropriate range for each CPP that would ensure that the targets for all quality attributes are met concurrently. A mill screen orifice size of 1.0 mm was selected because it allows a wider acceptable operating range for both roller pressure and roller gap compared to the other studied sizes (0.6 mm and 1.4 mm). Based on the results, the acceptable ranges for roller pressure and roller gap were identified as 20-77 bar and 1.2-2.4 mm, respectively, for the roller compaction and integrated milling process step using an Alexanderwerk WP120 equipped with a knurled roller that is 120 mm in diameter and 25 mm in width.15 April 2012 75 15 This is for concept demonstration only. All identified CQAs should be studied and included for an actual drug product.
  • 76. Example QbD IR Tablet Module 3 Quality 3.2.P.2 Pharmaceutical Development A: Roller pressure (bar) B: Roller gap (mm) Actual Factors: C: Mill speed (rpm) = 60 D: Mill screen orifice size (mm) = 1.0 a) Granule flowability (ffc): 6.00 b) Ribbon density (g/cc): 1.000 c) Ribbon density (g/cc): 1.200 d) Hardness (kP): 9.0 20 30 40 50 60 70 80 1.2 1.5 1.8 2.1 2.4 Overlay Plot A: Roller pressure (bar)B:Rollergap(mm) a b c d Green Zone: All responses met the predefined criteria. Gray Zone: One or more responses failed to meet the predefined criteria. Figure 38. Overlay plot – effect of roller compaction and integrated milling process variables on responses Updated Risk Assessment of the Roller Compaction and Integrated Milling Process Variables Table 41 presents the risk reduction for the roller compaction and integrated milling process variables as a result of the development studies. Justification of the reduced risks is also provided. Table 41. Updated risk assessment of the roller compaction and milling process variables Process Step: Roller Compaction and Integrated Milling Output Material CQAs: Ribbon Density, Granule Size Distribution, Granule Uniformity and Granule Flowability Variables Output Material CQAs: Risk Assessment Justification for the Reduced Risks Roller Compaction and Integrated Milling Process Variables Roller pressure Ribbon Density Low An acceptable range for roller pressure was identified during the DOE. Within the range (20-77 bar), all CQAs met the predefined acceptance criteria by using an appropriate roller gap. Thus, the risk is reduced from high to low. Granule Size Distribution Low Granule Uniformity Low Granule Flowability Low Roller gap Ribbon Density Low An acceptable range for roller gap was identified during the DOE. Within the range (1.2-2.4 mm), all CQAs met the predefined acceptance criteria by using an appropriate roller pressure. Thus, the risk is reduced from high to low. Granule Size Distribution Low Granule Uniformity Low Granule Flowability Low Mill speed Granule Size Distribution Low The mill speed range investigated (20-100 rpm) had no impact on granule PSD, granule uniformity or granule flowability. Thus, the risk is reduced from high to low. Granule Uniformity Low Granule Flowability Low April 2012 76
  • 77. Example QbD IR Tablet Module 3 Quality 3.2.P.2 Pharmaceutical Development Process Step: Roller Compaction and Integrated Milling Output Material CQAs: Ribbon Density, Granule Size Distribution, Granule Uniformity and Granule Flowability Variables Output Material CQAs: Risk Assessment Justification for the Reduced Risks Mill screen orifice size Granule Size Distribution Low The mill screen orifice size (1.0 mm) was selected because it allows a wider acceptable operating range for both roller pressure and roller gap compared to the other studied sizes (0.6 mm and 1.4 mm). When using the selected mill screen orifice size (1.0 mm), all CQAs met the predefined acceptance criteria. Thus, the risk is reduced from high to low. Granule Uniformity Low Granule Flowability Low 2.3.4 Final Blending and Lubrication Process Development Initial Risk Assessment of the Final Blending and Lubrication Process Variables The initial risk assessment of the overall manufacturing process presented in Table 32 identified the risk of the final blending and lubrication step to impact tablet dissolution as high. The lubrication process variables that could potentially impact tablet dissolution were identified and their associated risk was evaluated. Table 42 presents the initial risk assessment of the final blending and lubrication step. Table 42. Initial risk assessment of the final blending and lubrication Process Step: Final Blending and Lubrication Output Material CQA: Tablet Dissolution Variables Risk Assessment Justification and Initial Strategy Input Material Attributes Granule uniformity Low The granules produced during roller compaction development demonstrated uniformity with % RSD < 3%. Therefore, granule uniformity should have little impact on tablet dissolution. The risk is low. Assay of granule sieve cut Low Sieve cuts studied during roller compaction development ranged in assay from 98.2% to 101.2%. This low variability will have little impact on tablet dissolution. The risk is low. Granule flowability Low For a ribbon relative density of 0.68 to 0.81, the flowability was good (ffc > 6) and should not impact tablet dissolution. The risk is low. Granule size distribution Low The rapid disintegration of the tablets is achieved by using 5% CCS in the formulation. The variability in granule size distribution observed during roller compaction development showed no impact on dissolution. Therefore, the risk is low. Granule bulk density Low The granule bulk density is consistently between 0.62-0.69 g/cc. The low variability has little impact on tablet dissolution. The risk is low. April 2012 77
  • 78. Example QbD IR Tablet Module 3 Quality 3.2.P.2 Pharmaceutical Development Process Step: Final Blending and Lubrication Output Material CQA: Tablet Dissolution Variables Risk Assessment Justification and Initial Strategy Magnesium Stearate specific surface area High The lubricating effect of magnesium stearate improves as specific surface area increases. The risk of over-lubrication leading to retarded disintegration and dissolution is high. Lubrication Variables Blender type Low Due to differences in the operating principle, different types of blenders may impact blending efficiency. Based on availability, V-blender is selected. The risk is low. However, if the blender type is changed during scale-up or commercialization, the risk should be re-evaluated. Order of addition Low Granules and talc are blended together first, followed by magnesium stearate. Magnesium stearate is traditionally charged last to lubricate the other particles. Order of addition is fixed and has a minimal impact on dissolution. The risk is low. Rotation speed (rpm) Medium Rotation speed is often fixed by equipment constraint. Different size blenders have different rotation speeds. The rotation speed for the 16 qt blender is fixed at 20 rpm. The risk to impact tablet dissolution is medium. Number of revolutions High Over-lubricating may result in retarded disintegration and dissolution. For a BCS class II compound like acetriptan, the risk is high. Intensifier bar (on/off) Low If the intensifier bar is on, then it may cause granule attrition. To avoid generating fines, the intensifier bar is fixed in the off position during the final blending and lubrication. The risk is low. Blender fill level Medium Blender fill level may affect mixing dynamics. It is fixed for these development studies but could change upon scale-up. The risk is medium. Holding time Low These three process variables are not related to dissolution. The risk is low.Blender discharge Low Drum-to-hopper transfer Low Environment (temperature and RH) Low If not controlled, fluctuations in the facility temperature and RH could impact the CQAs. Routine environment temperature and RH set point in the cGMP manufacturing facility is fixed at 25 ºC ± 5% and 40%-60% RH, respectively, and will be monitored during manufacturing. The risk is low. Based on the results of Formulation Development Study #2, the extragranular magnesium stearate and talc levels were fixed to 0.6% and 2.9%, respectively. The composition of Generic Acetriptan Tablets, 20 mg, was shown previously in Table 29. April 2012 78
  • 79. Example QbD IR Tablet Module 3 Quality 3.2.P.2 Pharmaceutical Development Due to the low solubility of acetriptan, it is important to ensure that the blend is not over- lubricated, leading to retarded disintegration. NIR monitoring of the lubrication process is not feasible due to the low amount of lubricant added; therefore, a traditional method with the blending endpoint based on lubrication time is needed. A study was performed to investigate the effect of magnesium stearate specific surface area and number of revolutions during lubrication on tablet hardness, disintegration, and dissolution. For this study, a 25.0 kg blend was manufactured in a pilot scale blender (150 L) using acetriptan Lot #2. The blend was roller compacted to give a ribbon relative density of 0.75. The ribbon was then milled and subdivided into five 5.0 kg batches. For each batch, the granules and talc were blended for 100 revolutions in a 16 qt V-blender at 20 rpm prior to lubrication with magnesium stearate. Then, magnesium stearate was added and blended according to the experimental design as shown in Table 43. After lubrication, samples were pulled from the 10 locations shown in Figure 23 to verify blend uniformity. The lubricated blend was then compressed using 10 kN of force to manufacture tablets. Ejection force was monitored. Compressed tablets were checked for appearance and the tablet press tooling (punches and dies) was evaluated for evidence of picking/sticking and binding. Additionally, tablets were subjected to friability, assay and content uniformity testing. Table 43 shows the lubrication parameters and results for each batch (not all data shown). Table 43. Results of the extragranular lubrication study* Batch No. Factors: Process Variables Responses A: Magnesium stearate specific surface area B: Nrev (lubrication time) Y1: BU Y2: Hardness Y3: Disintegration time Y4: Dissolution at 30 min (m2 /g) -- (% RSD) (kP) (min) (%) 48 5.8 60 (3 min) 2.3 9.0 2.7 96.2 49 5.8 100 (5 min) 2.5 9.2 3.1 97.4 50 10.4 60 (3 min) 2.4 8.9 3.4 96.3 51 10.4 100 (5 min) 2.3 8.8 3.7 96.7 52 8.2 80 (4 min) 2.4 9.1 2.9 97.1 *The fill level is ~ 49% and the headspace fraction is ~51% The ejection force increased slightly with decreased lubrication time and lower specific surface area but did not exceed 150 N during the study. Tablet elegance was not an issue as all compressed tablets had a smooth surface and lacked any visible striations on the sides of the tablet. There was no evidence of product sticking on the punches within the letters and numbers. There was also no evidence of binding to the die cavities. For each batch, the % RSD was less than 3% indicating that blend uniformity was acceptable following lubrication of the granules. Overall, the blend assay was between 98.3% and 101.7% for all samples pulled during the study. The tablet hardness observed was 9.0 ± 0.2 kP which is well within the target range of 8.0-10.0 kP. Tablets exhibited rapid disintegration (< 4 min) and dissolution (> 95% in 30 min). The results indicated that adequate lubrication of the granules was insensitive to both specific surface area (5.8-10.4 m2 /g) and lubrication time (3-5 min) within the ranges studied. April 2012 79
  • 80. Example QbD IR Tablet Module 3 Quality 3.2.P.2 Pharmaceutical Development Over the course of the study, friability did not exceed 0.2% w/w. Tablet assay was close to target and well within the acceptable range of 95.0-105.0% w/w. Tablet content uniformity was acceptable with a % RSD less than 4%. Summary of Final Blending and Lubrication Process Development Within the ranges studied, magnesium stearate specific surface area (5.8-10.4 m2 /g) and number of revolutions (60-100) did not have a significant impact on the drug product quality attributes studied. Updated Risk Assessment of the Final Blending and Lubrication Process Variables Table 44 presents the risk reduction for the final blending and lubrication step as a result of the development studies. Only the process variables that were initially identified as high risk to the dissolution of the final drug product are shown. Table 44. Updated risk assessment of the final blending and lubrication process variables Process Step: Final Blending and Lubrication Output Material CQA: Tablet Dissolution Variables Risk Assessment Justification for the Reduced Risks Magnesium stearate specific surface area Low Within the range 5.8-10.4 m2 /g, magnesium stearate specific surface area does not adversely impact tablet dissolution. The risk is reduced from high to low and this material attribute will be controlled in the control strategy. Number of revolutions Low A proven acceptable range for number of revolutions (60-100) was established for this scale based on elegant tablet appearance and rapid dissolution. The risk is reduced from high to low and number of revolutions is controlled in the control strategy. 2.3.5 Tablet Compression Process Development Initial Risk Assessment of the Tablet Compression Process Variables Based on the initial risk assessment of the overall manufacturing process shown in Table 32, the risk of the compression step to impact content uniformity and dissolution of the tablets was identified as high. Process variables that could potentially impact these two drug product CQAs were identified and their associated risk was evaluated. The results of the initial risk assessment of the compression process variables are summarized in Table 45. April 2012 80
  • 81. Example QbD IR Tablet Module 3 Quality 3.2.P.2 Pharmaceutical Development Table 45. Initial risk assessment of the tablet compression process variables Process Step: Tablet Compression Drug Product CQAs: Content Uniformity, Dissolution Variables Drug Product CQAs Risk Assessment Justification and Initial Strategy Input Material Attributes Blend assay Content Uniformity Low The blend assay varied between 98.3% and 101.7% during the lubrication process development. This low variability is unlikely to impact CU and dissolution. The risk is low.Dissolution Low Blend uniformity Content Uniformity Low The lubricated blend demonstrated acceptable BU (% RSD < 3%) during the lubrication process development. Therefore, the risk is low.Dissolution Low Granule size distribution Content Uniformity Low The granule size distribution is controlled by milling after the roller compaction process step. The granules demonstrated good flowability (ffc > 6) and should not impact CU. The risk is low. Dissolution Low The formulation contains 5% CCS and the variability in granule size distribution observed during roller compaction development showed no impact on dissolution. The risk is low. Blend flowability Content Uniformity Low Blend flowability could impact powder flow from the hopper to the feed frame and, ultimately, to the die cavity. However, adequate flow was demonstrated during roller compaction development. Small amounts of extragranular glidant and lubricant will not impact blend flowability. The risk is low. Dissolution Low Blend compressibility and compactability Content Uniformity Low CU is unaffected by the blend compressibility and compactability. The risk is low. Dissolution High Suboptimal blend compressibility and compactability can affect tablet hardness. The compressibility and compactability of the blend are directly related to the ribbon relative density achieved during roller compaction. Ribbon relative density may vary from batch-to-batch and may cause tablet hardness variation if the compression force is not adjusted. This may, in turn, impact dissolution. The risk is high. Blend bulk density Content Uniformity Low The blend bulk density is consistently between 0.62- 0.69 g/cc. The low variability has little impact on CU and dissolution. The risk is low.Dissolution Low Compression Variables Press type and number of stations used Content Uniformity Low The press type was selected based on equipment availability and 3 stations will be used during development. The same press model but all 51 stations will be used for both exhibit and commercial scale. Thus, the risk is low. Dissolution Low April 2012 81
  • 82. Example QbD IR Tablet Module 3 Quality 3.2.P.2 Pharmaceutical Development Process Step: Tablet Compression Drug Product CQAs: Content Uniformity, Dissolution Variables Drug Product CQAs Risk Assessment Justification and Initial Strategy Tooling design Content Uniformity Low Tooling design was selected to compress a tablet with a similar size and shape as the RLD. No picking was observed during the final blending and lubrication studies. The risk is low.Dissolution Low Feed frame paddle speed Content Uniformity High A greater than optimal feed frame paddle speed may cause over-lubrication. A lower than optimal feed frame paddle speed may cause inconsistent die filling. The risk is high.Dissolution High Feeder fill depth Content Uniformity Low The feeder fill depth is set to 80% full and is monitored and controlled by an automatic feedback control loop on the tablet press. The risk is low.Dissolution Low Pre-compression force Content Uniformity Low CU is dominated by BU and flowability and is unrelated to pre-compression force. The risk is low. Dissolution Medium A greater than optimal pre-compression force may cause lamination. A lower than optimal pre- compression force may trap air in the tablets, leading to capping. Either scenario could impact dissolution. The pre-compression force is set to 1.0 kN based on experience with similar formulations compressed on the same equipment. Adjustment may be needed. The risk is medium. Main compression force Content Uniformity Low CU is dominated by BU and flowability and is unrelated to main compression force. The risk is low. Dissolution High Suboptimal compression force may affect tablet hardness and friability and, ultimately, dissolution. The risk is high. Press speed (dwell time) Content Uniformity High A faster than optimal press speed may cause inconsistent die filling and weight variability which may then impact CU and dissolution. For efficiency, the press speed will be set as fast as practically possible without adversely impacting tablet quality. The risk is high. Dissolution High Hopper design and vibration Content Uniformity Low Since acetriptan is roller compacted with excipients, the risk of drug substance segregation is minimized. Tablet press vibrations and the hopper angle design are unlikely to have an impact on CU and dissolution. The risk is low. Dissolution Low Hopper fill level Content Uniformity Low The blend has acceptable flowability and the hopper fill level is maintained at 50%. Maintaining the hopper fill level makes it improbable that this parameter will impact CU and dissolution. The risk is low.Dissolution Low Drop height of finished tablets Content Uniformity Medium Finished tablets may chip, crack, cleave or break if the drop height is great. The risk is medium.Dissolution Medium Compression run time Content Uniformity Medium It is possible during long compression run times that the CU may drift. The risk is medium. Dissolution Low It is unlikely for compression run time to cause a drift that leads to a dissolution failure. The risk is low. April 2012 82
  • 83. Example QbD IR Tablet Module 3 Quality 3.2.P.2 Pharmaceutical Development Process Step: Tablet Compression Drug Product CQAs: Content Uniformity, Dissolution Variables Drug Product CQAs Risk Assessment Justification and Initial Strategy Environment (temperature and RH) Content Uniformity Low If not controlled, fluctuations in the facility temperature and RH could impact the CQAs. Routine environment temperature and RH set point in the cGMP manufacturing facility is fixed at 25 ºC ± 5% and 40%-60% RH, respectively, and will be monitored during manufacturing. The risk is low. Dissolution Low The following experiments were undertaken to investigate the relationship between the input material attributes (i.e., ribbon relative density) and process parameters related to compression and the final drug product quality attributes. Three batches of final blend (Batch No. 53-55, 15.0 kg each, drug substance Lot #2) were manufactured in a 50 L blender for the compression studies. The ribbon relative density for these three batches was 0.68, 0.75 and 0.81, respectively. The roller compaction studies concluded that within this range, the necessary compression force will not exceed the maximum allowable tool tip pressure recommended by the manufacturer. Effect of Feeder Frame Paddle Speed A screening study to investigate the impact of the feeder frame paddle speed (8-20 rpm) on tablet quality attributes was conducted. Since the final blend flows well, changes in feeder frame paddle speed within the specified range had no impact on tablet weight variability or content uniformity. Tablet dissolution was also unaffected by changes in feeder speed, suggesting that over-lubrication due to the additional mixing is not a concern. This process variable was eliminated from further study. Effect of Main Compression Force, Press Speed and Ribbon Relative Density Compression force and press speed (which is related to dwell time) can affect numerous quality attributes including hardness, disintegration, dissolution, assay, content uniformity, friability, weight variability and appearance. The density of the ribbon following roller compaction may also impact the compressibility and compactability of the granules which would then impact tablet hardness and dissolution. Therefore, a 23 full factorial DOE with three center points was performed to understand the effects of these parameters on tablet quality attributes. Pre-compression force is important to reduce entrapped air that can impact the tablet integrity. However, based on previous experience with similar formulations compressed with similar tooling (ANDA 123456), the pre- compression force was fixed to 1 kN for this DOE. Table 46 presents the study design and acceptance criteria for the responses. April 2012 83
  • 84. Example QbD IR Tablet Module 3 Quality 3.2.P.2 Pharmaceutical Development Table 46. Design of the 23 full factorial DOE to investigate tablet compression Factors: Process Parameters Levels -1 0 +1 A Main compression force (kN) 5 10 15 B Press speed (rpm) 20 40 60 C Ribbon relative density (no units) 0.68 0.75 0.81 Responses Goal Acceptable Ranges Y1 Appearance Smooth, elegant appearance Y2 Hardness (kP) Define acceptable range To be defined based on other responses Y3 Friability (%) Minimize NMT 1.0 % Y4 Weight variability (%) Minimize Individual: Target ± 5% Composite: Target ± 3% Y5 Assay (% w/w) Achieve 100% w/w 95.0-105.0% w/w Y6 Content uniformity (% RSD) Minimize % RSD % RSD < 5% Y7 Disintegration time (min) Minimize NMT 5 min Y8 Dissolution (%) Maximize NLT 80% at 30 min The press was run at the speed of the specified DOE for at least five minutes prior to any sampling. Tablet samples were then pulled at the beginning, middle and end of each run (except for Batch No. 54c which was sampled every 20 min throughout the entire run). Similar responses were observed at each sample time point; therefore, Table 47 presents the results for the middle time point (responses Y1, Y3, Y4, Y5 and Y7 not shown). Table 47. Experimental results of the 23 full factorial DOE to investigate tablet compression Batch No. Factors: Process Variables Responses A: Main compression force B: Press speed C: Ribbon relative density Y2: Hardness Y6: CU Y8: Dissolution at 30 min (kN) (rpm) -- (kP) (% RSD) (%) 55a 15 20 0.81 10.8 1.9 95.7 54a 10 40 0.75 9.7 3.1 96.1 53a 15 60 0.68 12.9 3.5 85.4 55b 15 60 0.81 11.3 3.9 92.6 53b 5 20 0.68 7.8 2.6 96.4 53c 15 20 0.68 13.6 2.2 83.8 55c 5 60 0.81 4.2 3.3 99.6 54b 10 40 0.75 10.4 2.9 94.5 55d 5 20 0.81 5.5 2.3 97.2 54c 10 40 0.75 9.1 2.5 93.1 53d 5 60 0.68 6.7 3.7 97.1 Significant factors for tablet hardness Since center points were included in the study design, the significance of the curvature effect was tested using an adjusted model and was found to be not significant. Thus, center points were included for model fitting. As shown in the following half-normal plot (Figure 39), A (main compression force) was the dominating factor affecting tablet April 2012 84
  • 85. Example QbD IR Tablet Module 3 Quality 3.2.P.2 Pharmaceutical Development hardness followed by C (ribbon relative density). The remaining model terms had no significant impact because they came from the normally distributed population as pure error based on Shapiro-Wilk hypothesis test results. Positive Effects Negative Effects Hardness (kP) Shapiro-Wilk Test W-value = 0.868 p-value = 0.258 A: Main compression force (kN) B: Press speed (rpm) C: Ribbon relative density Error Estimates Half-Normal%Probability |Standardized Effect| 0.00 1.53 3.05 4.58 6.10 0 10 20 30 50 70 80 90 95 A C Figure 39. Half-normal plot of the compression variable effects on tablet hardness Tablet hardness was directly related to main compression force and inversely related to ribbon relative density as shown in the contour plot below (Figure 40). Both the half- normal plot and the contour plot show that there was no interaction between these two factors. April 2012 85
  • 86. Example QbD IR Tablet Module 3 Quality 3.2.P.2 Pharmaceutical Development 13.6 4.2 A: Main compression force (kN) C: Ribbon relative density Actual Factor: B: Press speed (rpm) = 40 5 7 9 11 13 15 0.68 0.71 0.75 0.78 0.81 Hardness (kP) A: Main compression force (kN) C:Ribbonrelativedensity 6.0 8.0 10.0 12.0 Figure 40. Effect of main compression force and ribbon relative density on tablet hardness A roller compacted ribbon that exhibits a relative density toward the upper end of the acceptable range (0.81) required a greater compression force to achieve the same hardness than ribbon with a relative density toward the lower end of the acceptable range (0.68). This is because the powder mixture loses some of its compressibility and compactability after roller compaction. The DOE results show that it is possible to adjust a process parameter to accommodate variability in a material attribute. In other words, the model can be used to determine the necessary compression force for a given ribbon relative density to ensure that the target tablet hardness is achieved. Significant factors for tablet friability None of the factors had a significant effect on tablet friability. All of the batches showed friability less than 0.2% except for Batch No. 55c which had an average hardness of 4.2 kP and showed a higher weight loss of 0.6%. Therefore, the lower limit for tablet hardness was set to 5.0 kP. Significant factors for tablet weight variability and content uniformity The half-normal plot below (Figure 41) shows that press speed was the only factor that had a significant impact on content uniformity. The effect was a positive effect, meaning that the % RSD increased as press speed increased. This is also shown clearly in the main effect plot (Figure 42). The main effect plot demonstrates that no curvature was observed so further optimization of the press speed is unnecessary. April 2012 86
  • 87. Example QbD IR Tablet Module 3 Quality 3.2.P.2 Pharmaceutical Development Content Uniformity (% RSD) Shapiro-Wilk Test W-value = 0.866 p-value = 0.210 A: Main compression force (kN) B: Press speed (rpm) C: Ribbon relative density Half-Normal%Probability |Standardized Effect| 0.00 0.34 0.68 1.01 1.35 0 10 20 30 50 70 80 90 95 B Error Estimates Positive Effects Negative Effects Figure 41. Half-normal plot of the compression variable effects on tablet content uniformity Content Uniformity (% RSD) B: Press speed (rpm) Actual Factors: A: Main compression force (kN) = 10 C: Ribbon relative density = 0.75 Design Points 20 30 40 50 60 B: Press speed (rpm) ContentUniformity(%RSD) 4.0 3.5 3.0 2.5 2.0 Figure 42. Main effect of press speed on tablet content uniformity Although better content uniformity (i.e., lower % RSD) is achieved when the tablet press is operated at a slower speed, the press speed range investigated (20-60 rpm) did not result in out-of-specification tablet content uniformity. At 60 rpm, the % RSD observed was less than 4% and well below the limit of 5%. Similarly, press speed had a statistically significant impact on tablet weight variability which increased with faster press speed. However, the individual tablet weight variability was well below 5% and the composite weight variability was well below 3%. April 2012 87
  • 88. Example QbD IR Tablet Module 3 Quality 3.2.P.2 Pharmaceutical Development During production, it is desirable to maximize efficiency by setting the tablet press as fast as practically possible without adversely impacting the quality of the drug product. Based on the compression study, the proven acceptable range for press speed is 20-60 rpm. Significant factors for tablet disintegration and dissolution The main compression force, press speed, and ribbon relative density did not have a significant impact on disintegration. The disintegration time was rapid and varied from 1.5 minutes to 3 minutes. The following half-normal plot (Figure 43) shows that the significant factors affecting the dissolution rate of the compressed tablets were A (main compression force) and C (ribbon relative density). These two factors also showed a significant interaction, AC. The remaining model terms had no significant impact based on Shapiro-Wilk hypothesis test results. Half-Normal%Probability |Standardized Effect| 0.00 2.05 4.10 6.15 8.20 0 10 20 30 50 70 80 90 95 A C AC Dissolution at 30 min (%) Shapiro-Wilk Test W-value = 0.943 p-value = 0.672 A: Main compression force (kN) B: Press speed (rpm) C: Ribbon relative density Error Estimates Positive Effects Negative Effects Figure 43. Half-normal plot of the compression variable effects on dissolution Figure 44 illustrates the effect of main compression force and ribbon relative density on tablet dissolution. The curved contour lines show that an interaction exists because the dissolution results differed depending on the main compression force setting and the ribbon relative density. The dissolution rate decreased with increasing main compression force and increased with increasing ribbon relative density. These results are in line with the observed effect that these factors had on tablet hardness. Increasing the main compression force resulted in harder tablets and retarded dissolution even though rapid disintegration was still achieved by using 5% superdisintegrant. To avoid a potential dissolution failure, the upper limit for hardness is set to 13.0 kP since Batch No. 53c with a hardness of 13.6 kP showed dissolution of 83.8%. April 2012 88
  • 89. Example QbD IR Tablet Module 3 Quality 3.2.P.2 Pharmaceutical Development 5 8 10 13 15 0.68 0.71 0.75 0.78 0.81 Dissolution at 30 min (%) A: Main compression force (kN) C:Ribbonrelativedensity 99.6 98.083.8 A: Main compression force (kN) C: Ribbon relative density 96.0 Actual Factor: B: Press speed (rpm) = 40 94.0 92.0 90.0 88.0 Figure 44. Effect of main compression force and ribbon relative density on tablet dissolution Effect of compression run time on tablet weight variability Batch No. 54c was sampled every 20 minutes to evaluate the potential drift in tablet weight over the course of the compression run. The results demonstrated that the weight variability was well controlled for the individual tablets within ± 5% of the target weight and for the composite sample within ± 3% of the target weight. No trend for tablet weight was observed throughout the entire compression run. Tablet samples pulled at the beginning, middle, and end of the run were tested for all DOE responses and results are shown in Table 47. Summary of other responses Main compression force, press speed, and relative ribbon density had no significant impact on the remaining responses. Each run produced tablets that had a smooth surface with no evidence of picking/sticking or capping. Assay ranged from 99.1% to 101.0%. Summary of Tablet Compression Process Development Within the range studied (8-20 rpm), feeder frame paddle speed did not impact the tablet dissolution. A press speed in the range of 20-60 rpm did not show any significant impact on the responses investigated. An acceptable range for compression force was identified. Force adjustments can be made to accommodate the acceptable variation in ribbon relative density (0.68-0.81) between batches. Proposed Tablet Compression In-Process Controls Based on the results of the studies undertaken to understand the process variables affecting compression, Table 48 lists the proposed in-process controls for the compression step. April 2012 89
  • 90. Example QbD IR Tablet Module 3 Quality 3.2.P.2 Pharmaceutical Development Table 48. Proposed in-process controls for the compression step Test Frequency Limits Individual tablet weight (n = 10) 30 min 200.0 mg ± 10.0 mg Composite tablet weight (n = 20) 30 min 4.00 g ± 0.12 g Hardness (n = 10) 30 min Target: 8.0-10.0 kP Limits: 5.0-13.0 kP Thickness (n = 10) 30 min 3.00 mm ± 0.09 mm Disintegration* (n = 6) 3× per run NMT 5 min Friability* (sample weight = 6.5 g) 3× per run NMT 1.0% *Tested at the beginning, middle and end of the run. Updated Risk Assessment of the Tablet Compression Process Variables The risks identified during the initial assessment of the compression step were reduced through development studies. The updated risk assessment is presented in Table 49. Table 49. Updated risk assessment of the tablet compression process variables Process Step: Tablet Compression Drug Product CQAs: Content Uniformity, Dissolution Variables Drug Product CQAs Risk Assessment Justification for the Reduced Risks Blend compressibility and compactability Dissolution Low Compression force can be adjusted to accommodate the acceptable ribbon relative density (0.68-0.81) in order to achieve the target tablet hardness. The risk is reduced from high to low. Feeder frame paddle speed Content Uniformity Low Feeder frame paddle speed in the range of 8- 20 rpm had no impact on CU or dissolution. The same tablet press model will be used for pilot scale and commercial scale manufacture. If necessary, slight adjustments in the feeder frame paddle speed may be made when all stations are utilized. The risk is reduced from high to low. Dissolution Low Main compression force Dissolution Low Tablet hardness increases with compression force. Within the compression force range studied, the resulting tablet hardness did not adversely affect dissolution and > 90% dissolution at 30 min was achieved. The risk is reduced from high to low. Press speed (dwell time) Content Uniformity Low A press speed of 20-60 rpm had no impact on CU or dissolution. Thus, the risk is reduced from high to low.Dissolution Low 2.3.6 Scale-Up from Lab to Pilot Scale and Commercial Scale Note to Reader: Currently, scale-up information is limited at the time of submission. The applicant should discuss product specific scale-up principles including their planned approach to scale-up the process. OGD will evaluate the applicant’s plan to determine April 2012 90
  • 91. Example QbD IR Tablet Module 3 Quality 3.2.P.2 Pharmaceutical Development its adequacy. However, if a substantial amendment needs to be submitted due to the inadequacy of the scale-up plan, it may significantly extend the review process. It is the firm’s discretion to submit scale-up data such as actual process verification information at the time of submission for a complex drug product which has a high risk of scale-up failure; however, in some cases it may be requested by OGD. Process development was conducted on the lab scale (5.0 kg). This section describes the principles used to scale-up the process to the pilot scale (50.0 kg) in order to manufacture the exhibit batch. The same principles will be employed to scale-up the process to the commercial scale upon approval. Table 50 summarizes the different process scales. Table 50. Process scale summary Scale Batch Size Units -- (kg) -- Lab (Process Development) 5.0 25,000 Pilot (Exhibit) 50.0 250,000 Commercial (Proposed) 150.0 750,000 2.3.6.1 Scale-Up of the Pre-Roller Compaction Blending and Lubrication Process The process development work for the pre-roller compaction blending and lubrication step was carried out in a 16 qt capacity twin shell V-blender. To scale-up, it was desirable to maintain geometric, dynamic and kinematic similarity by applying the following rules:  Geometric similarity: keeping the ratio of all lengths constant (constant fill ratio)  Dynamic similarity: maintaining constant forces (Froude number Fr) g Rrpm Fr 2  rpm: revolutions per minute R: characteristic radius g: gravitational constant  Kinematic similarity: maintaining a consistent number of revolutions (rpm × minutes) At the pilot scale, the fill level was 74%. This was slightly higher than the fill level at lab scale which was 63%. The rotation speed at both scales was fixed due to equipment constraints. Although the target blending endpoint could be estimated by maintaining similarity between the scales, the final endpoint was determined using the validated in- line NIR method (details provided in Section 3.2.P.5.3 Validation of Analytical Procedures). To assess homogeneity of the blend, a moving block % RSD was calculated for each moving block of ten consecutive spectra and plotted as a function of time. The blend was considered uniform once the % RSD was below 5% for ten consecutive measurements. April 2012 91
  • 92. Example QbD IR Tablet Module 3 Quality 3.2.P.2 Pharmaceutical Development The pre-roller compaction blending and lubrication process scale-up is summarized in Table 51. Table 51. Scale up of pre-roller compaction blending and lubrication Scale Batch size Blender capacity Volume fill level Rotation speed Nrev* -- (kg) (units) (L) (%) (rpm) Acetriptan PSD Nrev Lab 5.0 25,000 17.6 (16 qt) 63 20 d90 = 10 μm 368 d90 = 20 μm 285 d90 = 30 μm 234 Pilot 50.0 250,000 150 74 12 285 Commercial (Proposed) 150.0 750,000 500 67 8 To be determined *Endpoint determined by a validated in-line NIR method 2.3.6.2 Scale-Up of the Roller Compaction and Integrated Milling Process For this drug product, the roller compaction process first needed to be scaled up from lab scale (using Alexanderwerk WP120 with 120 mm roll diameter and 25 mm roll width) to pilot scale (using Alexanderwerk WP120 with 120 mm roll diameter and 40 mm roll width) and then, ultimately, to commercial scale (using Alexanderwerk WP200 with 200 mm roll diameter and 75 mm roll width). In a roller compaction process, there are several process parameters to consider when scaling up to a larger, wider roller. The strategy employed for each process parameter is discussed below. Roller Gap The scale-up strategy for the roller gap was to maintain the ratio between the roller gap (S) and the roller diameter (D) for different size roller compactors. The scale-up factor for the roller gap was calculated according to the following equation: 2 2 1 1 D S D S  Roll Force or Roll Pressure Based on the process development work, ribbon density was an intermediate critical quality attribute for this process step and strongly affected the downstream compression force required to meet the target tablet hardness. A commonly used strategy to scale-up roller compaction is to control the ribbon density by maintaining the roller peak pressure (Pmax) as described by Johanson’s model.13 According to the model, if the S/D ratio is maintained, a scale-up strategy is to obtain the same Pmax by maintaining the Rf /(W×D) ratio where Rf is the roller force and W is the roller width. The scale-up factor for roller force is calculated by: April 2012 92
  • 93. Example QbD IR Tablet Module 3 Quality 3.2.P.2 Pharmaceutical Development 11 22 1 2 DW DW R R f f  If roller hydraulic pressure is used, it is necessary to obtain the conversion factor between roller hydraulic pressure (bar) to roller force (kN) from the equipment vendor. Alexanderwerk provided the following information: For WP120: 0.0922 kN per cm of roller width for 1 bar roller pressure For WP200: 0.0869 kN per cm of roller width for 1 bar roller pressure The scale-up factor for roller pressure was calculated by: 1 2 1 2 0922.0 0869.0 D D R R P P    Screw Speed and Roll Speed Assuming no slip at the roller surface in the nip region (i.e., the material is moving at the same speed as the rollers), the mass flow rate (throughput, Q, g/min) of material can be calculated based on mass balance: RDWSNQ  where ρ is the ribbon density (g/cc), D is the roller diameter (cm), W is the roller width (cm), S is the roller gap (cm) and NR is the roller rotation speed (rpm). The powder material is conveyed to the rollers by the screw auger and the mass flow rate is typically proportional to the screw rotation rate: SS NCQ  where, NS is the feed screw rotation speed (rpm) and CS is the amount of material conveyed by the screw per rotation (g/rotation) which can be determined experimentally. To achieve the target ribbon density for the given roller gap, the ratio of screw speed to roller speed was maintained constant by setting the two equations for mass flow rate equal to each other as shown below: SR S C DWS N N   Mill Screen Orifice Size and Mill Speed Mill screen orifice size is a scale-independent variable; therefore, it is kept constant upon scale-up. During development, mill speed was not found to be critical for any product April 2012 93
  • 94. Example QbD IR Tablet Module 3 Quality 3.2.P.2 Pharmaceutical Development quality attributes. In practice, mill speed is set based on first-in first-out principles to avoid ribbon accumulation in the mill. Table 52 summarizes the roller compaction and integrated milling process scale-up. Table 52. Scale-up of the roller compaction and integrated milling process Scale Batch Size Alexanderwerk model Roller width Roller diameter Roller gap Roller pressure Mill screen orifice size -- (kg) (units) -- (mm) (mm) (mm) (bar) (mm) Lab 5.0 25,000 WP120 25 120 1.2-2.4 20-77 1.0 Pilot 50.0 250,000 WP120 40 120 1.8 50 1.0 Commercial (Proposed) 150.0 750,000 WP200 75 200 2.0-4.0* 31-121* 1.0 *The range is based on the scale-up equation and needs to be verified. 2.3.6.3 Scale-Up of the Final Blending and Lubrication Process To scale-up the final blending of the granules with talc, the number of revolutions was maintained. A different strategy was employed to scale-up the final lubrication. Recently, an equation for scaling up the lubrication of a 1:1 MCC:Lactose blend with magnesium stearate was published.16 If the batch size and blender volume of the new process are known, the number of revolutions to be used at the new process condition can be evaluated using the following equation:    2 3/1 1 3/1 2 headspace headspace FV rFV r  where V is the blender volume, Fheadspace is the headspace fraction (calculated by 100% - fill level %), and r is the number of revolutions. The number of revolutions needed to lubricate the granules with magnesium stearate was calculated based on this equation. The final blending and lubrication process scale-up is summarized in Table 53. April 2012 94 16 Kushner IV, J., Moore, F., 2010. Scale-up model describing the impact of lubrication on tablet tensile strength. International Journal of Pharmaceutics. 399, 19-30.
  • 95. Example QbD IR Tablet Module 3 Quality 3.2.P.2 Pharmaceutical Development un time Nrev Run time NrevR Table 53. Scale-up of the final blending and lubrication Scale Batch size Blender capacity Volume fill level Rotation speed Final Blending Lubrication (kg) (units) (L) (%) (rpm) (min) -- (min) -- Lab 5.0 25,000 17.6 (16 qt) 49 20 5 100 3-5 60-100 Pilot 50.0 250,000 150 56 12 8.3 100 4 48 Commercial (Proposed) 150.0 750,000 500 50 8 12.5* 100* ~2.6-4.3* 21-35* *To be verified 2.3.6.4 Scale-Up of the Tablet Compression Process The same tablet press utilized during the tablet compression process development studies was used for the pilot batch and will be used for commercial scale production. Detailed parameters that affect the tabletting process were already explored and discussed in Section 2.3.5. To increase throughput, all 51 stations were used at the pilot scale successfully and will be used at the commercial scale. The press will be run at the same speed that was studied during development (20-60 rpm). Therefore, dwell time remains unchanged during scale-up. 2.3.7 Exhibit Batch Based on the scale-up principles detailed in Section 2.3.6, a 50.0 kg cGMP exhibit batch was manufactured with drug substance Lot #2 at the pilot scale and the batch was used for the pivotal BE study. Table 54 summarizes the equipment and process parameters used for the exhibit batch at pilot scale. April 2012 95
  • 96. Example QbD IR Tablet Module 3 Quality 3.2.P.2 Pharmaceutical Development Table 54. Equipment and process parameters used for the exhibit batch at pilot scale Process Steps Equipment and Process Parameters Pre-Roller Compaction Blending and Lubrication 150 L V-blender o 285 revolutions (target) for blending at 12 rpm (endpoint determined by an in-line NIR method) Roller Compaction and Integrated Milling Alexanderwerk WP120 with 40 mm roller width and 120 mm roller diameter o Roller surface: Knurled o Roller pressure: 50 bar o Roller gap: 1.8 mm o Roller speed: 8 rpm o Mill speed: 60 rpm o Coarse screen orifice size: 2.0 mm o Mill screen orifice size: 1.0 mm Final Blending and Lubrication 150 L V-blender o 100 revolutions for granule and talc blending (8.3 min at 12 rpm o 48 revolutions for lubrication (4 min at 12 rpm) Tablet Compression 51 station rotary press (51 stations used) o 8 mm standard round concave tools o Press speed: 40 rpm o Compression force: 8-11 kN  Target hardness 8.0-10.0 kP o Pre-compression force: 1.0 kN The in-process testing and final release results are summarized in Table 55 and Table 56, respectively. April 2012 96
  • 97. Example QbD IR Tablet Module 3 Quality 3.2.P.2 Pharmaceutical Development Table 55. In-process testing results for the exhibit batch (Batch No. DPJM032012) Test In-Process Controls Results Pre-Roller Compaction Blending and Lubrication Blend Uniformity NIR % RSD < 5% 4.9% Roller Compaction and Integrated Milling Ribbon relative density 0.68-0.81 0.74 Granule PSD d10 50-150 μm 96 μm d50 400-800 μm 611 μm d90 800-1200 μm 925 μm Granule Uniformity % RSD < 5% 4.3% Flow function coefficient (ffc) > 6 7.35 Final Blending and Lubrication Blend Uniformity % RSD < 5% 2.7% Blend Assay 95.0-105.0% w/w 100.2% w/w Tablet Compression Individual tablet weight (n = 10) 200.0 mg ± 10.0 mg 197.2-202.8 mg Composite tablet weight (n = 20) 4.00 g ± 0.12 g 4.04 g Hardness (n = 10) Target: 8.0-10.0 kP Limits: 5.0-13.0 kP 8.8-9.3 kP Thickness (n = 10) 3.00 mm ± 0.09 mm 2.97-3.03 mm Disintegration (n = 6) NMT 5 min 1.5 min Friability (sample weight = 6.5 g) NMT 1.0 % w/w 0.1% w/w Table 56. Release testing results for the exhibit batch (Batch No. DPJM032012) Test Acceptance Criteria Results Description White to off-white, round convex tablet embossed with GEN-ACE and 20 White to off-white, round convex tablet embossed with GEN-ACE and 20 Identification A. HPLC Retention time: corresponds to standard B. UV absorption: spectrum corresponds to standard A. Corresponds to standard B. Corresponds to standard Assay 95.0-105.0% w/w of label claim 100.3% w/w Content Uniformity AV < 15 AV = 4.7 Dissolution NLT 80% in 30 minutes (in 900 mL of 0.1 N HCl with 1.0% w/v SLS using USP Apparatus 2 at 75 rpm) 96% Degradation Products ACE12345: NMT 0.5%, Individual unknown impurity: NMT 0.2%, Total impurities: NMT 1.0% ACE12345: 0.1% Individual unknown impurity: 0.06% Total impurities: 0.22% Residual Solvents Complies with USP <467> Option I Complies with USP <467> Option I 2.3.8 Updated Risk Assessment of the Drug Product Manufacturing Process During process development, the identified high risks for each process step were addressed. Experimental studies were defined and executed in order to establish additional scientific knowledge and understanding, to allow appropriate controls to be developed and implemented, and to reduce the risk to an acceptable level. After detailed experimentation, the initial manufacturing process risk assessment was updated in line April 2012 97
  • 98. Example QbD IR Tablet Module 3 Quality 3.2.P.2 Pharmaceutical Development with the current process understanding. Table 57 presents how the application of the control strategy to the manufacturing process has reduced the identified risks. Table 58 provides the justification for the reduced risk following process development. Table 57. Updated risk assessment of the manufacturing process for Generic Acetriptan Tablets, 20 mg Drug Product CQAs Process Steps Pre-RC Blending and Lubrication Roller Compaction Milling Final Blending and Lubrication Compression Assay Low Low* Low Low* Low Content Uniformity Low Low Low Low* Low Dissolution Low Low Low Low Low Degradation Products Low* Low* Low* Low* Low* *The level of risk was not reduced from the initial risk assessment. Table 58. Justification for the updated risk assessment of the manufacturing process for Generic Acetriptan Tablets, 20 mg Process Steps Drug Product CQAs Justification for the Reduced Risks Pre-Roller Compaction Blending and Lubrication Assay An in-line NIR method was developed and validated to determine the blending endpoint. Using the finalized formulation, all development batches and the exhibit batch achieved acceptable assay, CU and dissolution. The risk is reduced from high to low for CU and from medium to low for assay and dissolution. Content Uniformity Dissolution Roller Compaction Content Uniformity Within a ribbon relative density range of 0.68-0.81, the resulting PSD of the milled granules had good flowability as measured by ffc. The risk is reduced from high to low. Dissolution Within a ribbon relative density range of 0.68-0.81, the desired tablet hardness (8.0-10.0 kP) can be achieved by adjusting the compression force. The risk of roller compaction to impact dissolution is reduced from high to low. Milling Assay The mill speed did not show a significant impact on any drug product quality attributes. The mill screen orifice size was found critical and set to 1.0 mm. With this selection, all CQAs can be achieved by using the appropriate range for roller pressure and roller gap. The risk of milling to impact assay, CU and dissolution is reduced to low. Content Uniformity Dissolution Final Blending and Lubrication Dissolution Within the range studied, number of revolutions and magnesium stearate specific surface area did not exhibit a significant impact on disintegration or dissolution of the tablets. The risk is reduced from high to low. April 2012 98
  • 99. Example QbD IR Tablet Module 3 Quality 3.2.P.2 Pharmaceutical Development Process Steps Drug Product CQAs Justification for the Reduced Risks Compression Assay The development studies demonstrated that feed frame paddle speed and press speed did not significantly impact the tablet weight variability, assay or CU. The risk is reduced from high to low for CU and from medium to low for assay.Content Uniformity Dissolution Within a ribbon relative density range of 0.68-0.81, the desired tablet hardness (8.0-10.0 kP) can be achieved by adjusting the compression force. No over-lubrication of the blend was observed when the feed frame paddle speed was operated within the range studied (8-20 rpm). The risk is reduced from high to low. 2.4 Container Closure System To be consistent with the RLD, the proposed generic drug product is intended to be labeled for storage at 25 °C (77 °F) with excursions permitted to 15-30 °C (59-86 °F). The innovator has chosen round white opaque HDPE bottles with an induction seal liner and child resistant (CR) closure. Generic Acetriptan Tablets, 20 mg, will be similarly packaged and the bottle pack details are summarized in Table 59. Table 59. Proposed commercial packaging for Generic Acetriptan Tablets, 20 mg Count HDPE Bottle Closure 30 Tablets 40 cc 33 mm white CR cap with pulp liner 90 Tablets 60 cc 38 mm white CR cap with pulp liner 2.5 Microbiological Attributes An accelerated stability study of the exhibit batch demonstrated that the drug product has low water activity and is not capable of supporting microbial growth. Routine microbiological testing of Generic Acetriptan Tablets, 20 mg, is unnecessary due to the low water activity of the product and controls on incoming raw materials. 2.6 Compatibility This section is not applicable because the drug product is a solid oral dosage form and there are no reconstitution diluents. April 2012 99
  • 100. Example QbD IR Tablet Module 3 Quality 3.2.P.2 Pharmaceutical Development April 2012 100 2.7 Control Strategy Note to Reader: The control strategy is “a planned set of controls, derived from current product and process understanding, that assures process performance and product quality. The controls can include parameters and attributes related to drug substance and drug product materials and components, facility and equipment operating conditions, in-process controls, finished product specifications, and the associated methods and frequency of monitoring and control.”17 The control strategy for Generic Acetriptan Tablets, 20 mg, is built upon the outcome of extensive product and process understanding studies. These studies investigated the material attributes and process parameters that were deemed high risk to the CQAs of the drug product during the initial risk assessment. In some cases, variables considered medium risk were also investigated. Through these systematic studies, the CMAs and CPPs were identified and the acceptable operating ranges were established. All variables ranked as high risk in the initial risk assessment are included in the control strategy because the conclusion of the experiments was dependant on the range(s) studied and the complex multivariate relationship between variables. Thus, the control strategy is an integrated overview of how quality is assured based on current process and product knowledge. The control strategy may be further refined based on additional experience gained during the commercial lifecycle of the product. However, any post-approval changes should be reported to the agency in accordance with CFR 314.70 and should follow steps as outlined by guidances used for scale-up and post-approval changes. The control strategy for the commercial manufacture of Generic Acetriptan Tablets, 20 mg, is proposed and presented in Table 60. The control strategy includes acetriptan and excipient material attributes to be controlled, in-process controls, high risk process parameter ranges studied during development and the proposed operating ranges for commercial manufacture. The purpose of the controls is also briefly discussed. The release specification for the final product is provided in Table 61. 17 ICH Harmonised Tripartite Guideline: Q10 Pharmaceutical Quality Systems. June 2008.
  • 101. Example QbD IR Tablet Module 3 Quality 3.2.P.2 Pharmaceutical Development Table 60. Control Strategy for Generic Acetriptan Tablets, 20 mg Factor Attributes or Parameters Range studied (lab scale) Actual data for the exhibit batch (pilot scale) Proposed range for commercial scale1 Purpose of control Raw Material Attributes Acetriptan polymorphic form* Melting point 185-187 °C 186 °C 185-187 °C To ensure polymorphic Form IIIXRPD 2θ values 2θ: 7.9°, 12.4°, 19.1°, 25.2° 2θ: 7.9°, 12.4°, 19.1°, 25.2° 2θ: 7.9°, 12.4°, 19.1°, 25.2° Acetriptan particle size distribution* d90 10-45 μm 20 μm 10-30 μm To ensure in vitro dissolution, in vivo performance and batch-to- batch consistency d50 6-39 μm 12 μm 6-24 μm d10 3.6-33.4 μm 7.2 μm 3.6-14.4 μm Lactose Monohydrate, Grade A01 Particle size distribution d50: 70-100 µm d50: 85 µm d50: 70-10 µm To ensure sufficient flowability and batch-to- batch consistencyMicrocrystalline Cellulose (MCC), Grade B02 Particle size distribution d50: 80-140 µm d50: 108 µm d50: 80-140 µm Croscarmellose Sodium (CCS), Grade C03 Particle size distribution > 75 μm: NMT 2% > 75 μm: 1% > 75 μm: NMT 2% To ensure batch-to-batch consistency> 45 μm: NMT 10% > 45 μm: 4% > 45 μm: NMT 10% Talc, Grade D04 Particle size distribution > 75μm: NMT 0.2% > 75μm: 0.1% >75μm: NMT 0.2% To ensure batch-to-batch consistency Magnesium Stearate, Grade E05 Specific surface area 5.8-10.4 m2 /g 8.2 m2 /g 5.8-10.4 m2 /g To ensure sufficient lubrication and to reduce the risk of retarded disintegration and dissolution Pre-Roller Compaction Blending and Lubrication Process Parameters V-blender Number of revolutions* 250 (25 rpm, 10 min) 100-500 (20 rpm, 5-25 min ) 285 revolutions (12 rpm, 23.8 min) Target to be determined based on DS PSD In-line NIR method is used for endpoint determination to ensure BU is met consistently Blender fill level ~50% (1.0 kg, 4 qt) 35-75% (5.0 kg, 16 qt) ~74% (50.0 kg, 150 L) ~67% (150.0 kg, 500 L) April 2012 101
  • 102. Example QbD IR Tablet Module 3 Quality 3.2.P.2 Pharmaceutical Development Factor Attributes or Parameters Range studied (lab scale) Actual data for the exhibit batch (pilot scale) Proposed range for 1 commercial scale Purpose of control Pre-Roller Compaction Blending and Lubrication In-Process Controls Blend uniformity* Blend to endpoint: < 5.0% RSD (In-line NIR method) Roller Compaction and Integrated Milling Process Parameters Roller compactor and integrated mill Equipment Alexanderwerk WP120 (roller diameter: 120 mm; roller width: 25 mm) Alexanderwerk WP120 (roller diameter: 120 mm; roller width: 40 mm) Alexanderwerk WP200 (roller diameter: 200 mm; roller width: 75 mm) Fixed due to equipment availability Roller pressure* 20-80 bar 50 bar 31-121 bar To ensure desired ribbon density, granule PSD, uniformity and flowability are achieved consistently Roller gap* 1.2-2.4 mm 1.8 mm 1.2-2.4 mm Mill speed 20-100 rpm 60 rpm 20-100 rpm Mill screen orifice size* 0.6-1.4 mm 1.0 mm 1.0 mm Roller Compaction and Integrated Milling Process In-Process Controls Ribbon relative density* 0.68-0.81 Granule particle size distribution d10* 50-150 μm Granule particle size distribution d50* 400-800 μm Granule particle size distribution d90* 800-1200 μm Granule uniformity* % RSD < 5% Granule flowability (ffc)* > 6.00 Final Blending and Lubrication Process Parameters V-blender Final Blending (granules w/ talc) Number of revolutions 100 (25 rpm, 4 min) 100 (20 rpm, 5min) 100 revolutions (12 rpm, 8.3 min) 100 revolutions (8 rpm, 12.5 min) To ensure consistent mixing of granules and talcBlender fill level ~38% (1.0 kg, 4 qt) ~49% (5.0 kg, 16 qt) ~56% (50.0 kg, 150 L) ~50% (150.0 kg, 500 L) V-blender Lubrication (magnesium stearate) Number of revolutions 75 (25 rpm, 3 min) 60-100 (20 rpm, 3-5 min) 48 revolutions (12 rpm, 4 min) 21-35 revolutions (8 rpm, 2.6-4.3 min) To ensure lubricant is well distributed and to avoid over-lubricationBlender fill level ~38% (1.0 kg, 4 qt) ~49% (5.0 kg, 16 qt) ~56% (50.0 kg, 150 L) ~50% (150.0 kg, 500 L) April 2012 102
  • 103. Example QbD IR Tablet Module 3 Quality 3.2.P.2 Pharmaceutical Development April 2012 103 (pilot scale) Factor Attributes or Parameters Range studied (lab scale) Actual data for the exhibit batch Proposed range for commercial scale1 Purpose of control Final Blending and Lubrication Process In-Process Controls Blend uniformity* % RSD < 5% Blend assay* 95.0-105.0% w/w Tablet Compression Process Parameters Rotary press Feeder frame paddle speed 8-20 rpm 15 rpm 8-20 rpm To ensure all tablet CQAs (assay, CU and drug release) are met consistently Press speed 20-60 rpm 40 rpm 20-60 rpm Pre- compression force 1.0 kN 1.0 kN 1.0 kN Compression force* 5-15 kN 8-11 kN To be determined based on ribbon relative density Tablet Compression In-Process Controls Individual weight (n = 10; every 20 min) 200.0 mg ± 10.0 mg Composite weight (n = 20; every 20 min) 4.00 g ± 0.12 g Hardness (n = 10; every 20 min) Target: 8.0-10.0 kP, Limits: 5.0-13.0 kP Thickness (n = 10; every 20 min) 3.00 mm ± 0.09 mm Disintegration (n = 6; 3× during run) NMT 5 min Friability (sample weight = 6.5 g; 3× during run) NMT 1.0 % *critical input material attributes (CMA), critical process parameters (CPP) or critical quality attributes (CQA) of in-process material or final drug product 1 The proposed operating range for commercial scale will be qualified and continually verified.
  • 104. Example QbD IR Tablet Module 3 Quality 3.2.P.2 Pharmaceutical Development Table 61. Generic Acetriptan Tablets, 20 mg release specification Test Acceptance Criteria Description White to off-white, round convex tablet embossed with GEN-ACE and 20 Identification A. HPLC Retention time: corresponds to standard B. UV absorption: spectrum corresponds to standard Assay 95.0-105.0% w/w of label claim Content Uniformity AV < 15 Dissolution NLT 80% in 30 minutes (in 900 mL of 0.1 N HCl with 1.0% w/v SLS using USP Apparatus 2 at 75 rpm) Degradation Products ACE12345: NMT 0.5%, Individual unknown impurity: NMT 0.2%, Total impurities: NMT 1.0% Residual Solvents Complies with USP <467> Option I 2.7.1 Control Strategy for Raw Material Attributes The drug substance particle size distribution limits arise from a combination of its impact on blending and in vivo performance. The pilot PK study suggested that Generic Acetriptan Tablets, 20 mg, with a drug substance d90 of 30 μm (d50 of 24 μm) or less would be bioequivalent to the RLD. During formulation development, a particle size distribution with a d90 value greater than 14 μm was found to ensure good flow and content uniformity using a fixed blending process. However, implementing a validated in-line NIR method to determine the blending endpoint during process development allowed acceptable blending uniformity and tablet CQAs to be achieved using a drug substance d90 in the range of 10-30 μm. Excipient particle size distribution specifications were based on the attributes of the selected grades. For lactose and microcrystalline cellulose, an in-house limit is set on d50 to ensure batch-to-batch consistency. Based on the analysis of dissolution data collected during formulation development and the results of the pilot PK study, the dissolution medium with 1.0% w/v SLS was more sensitive to product differences than the FDA-recommended method using medium with 2.0% w/v SLS. For this reason, 1.0% w/v SLS is used in the dissolution medium for the release method in the control strategy. 2.7.2 Control Strategy for Pre-Roller Compaction Blending and Lubrication The updated risk assessment (Table 37) for the pre-roller compaction blending and lubrication process step demonstrates that the identified risks to blend uniformity have been reduced by adjusting the number of revolutions to accommodate different acetriptan particle size distributions. A validated in-line NIR method for monitoring the blend uniformity was developed, validated and implemented to terminate the blending based on April 2012 104
  • 105. Example QbD IR Tablet Module 3 Quality 3.2.P.2 Pharmaceutical Development feedback control when the moving block % RSD of ten consecutive spectra is below 5% for ten consecutive measurements. 2.7.3 Control Strategy for Roller Compaction and Integrated Milling The intent of the control strategy for roller compaction is to maintain the ribbon density within the required range to ensure drug product CQAs are met. To maintain a ribbon relative density of 0.68-0.81 during routine operation, the roller pressure and roller gap will be controlled. The ribbon density will be monitored as an in-process control during roller compaction. For milling, the mill screen orifice size (1.0 mm) was selected to ensure that the granule size distribution remains within the acceptable range. The acceptable range for mill speed (20-100 rpm) was established and can be adjusted within the range to accommodate different throughput from the roller compaction step. If a change to the mill screen orifice size is made (e.g., increase or decrease) then the impact on granule size distribution and assay of sieve cuts will be reassessed across the pre-defined ribbon density range. 2.7.4 Control Strategy for Final Blending and Lubrication The control strategy for blending the granules with talc is to maintain the targeted number of revolutions. For the granule lubrication with magnesium stearate, the control strategy is to adjust the number of revolutions based on the blender capacity used (headspace) and the volume of the V-blender according to the scientific literature. 2.7.5 Control Strategy for Tablet Compression The control strategy for compression is to maintain the in-process tablet attributes of weight, hardness, thickness, friability and disintegration within the required ranges. The fill cam below the die table adjusts the lower punch to the appropriate height to control fill depth and ultimately tablet weight. The target compression force required to produce tablets with the desired hardness, and ultimately friability and disintegration, is established at the beginning of each run. After tablets with the target weight and hardness are obtained during the tablet press set-up, the upper punch penetration depth and the fill depth are fixed. The compression force is continuously measured throughout the run for each tablet and compared to the target compression force. The main compression height is automatically adjusted to keep the average force as close as possible to the target set point. Upper and lower limits of compression force are set and any tablet that registers a compression force outside these limits is automatically rejected by the tablet press. April 2012 105
  • 106. Example QbD IR Tablet Module 3 Quality 3.2.P.2 Pharmaceutical Development April 2012 106 2.7.6 Product Lifecycle Management and Continual Improvement Upon approval, the manufacturing process for Generic Acetriptan Tablets, 20 mg, will be validated using the lifecycle approach that employs risk-based decision making throughout the drug product lifecycle as defined in the FDA process validation guidance.18 The QbD approach taken during pharmaceutical development of Generic Acetriptan Tablets, 20 mg, facilitated product and process understanding relevant to Stage 1 (Process Design) of process validation. During Stage 1, the commercial manufacturing process was defined based on knowledge gained through development and scale up activities and a strategy for process control was developed. The goal of Stage 2 (Process Qualification) is to evaluate if the process is capable of reproducible commercial manufacturing. The manufacturing facility will be designed according to cGMP regulations on Building and Facilities.19 Activities will be taken to demonstrate that utilities and equipment are suitable for their intended use and perform properly. The protocol for process performance qualification will be written, reviewed, approved, and then executed to demonstrate that the commercial manufacturing process performs as expected. The goal of Stage 3 (Continued Process Verification) is continual assurance that the process remains in a state of control (the validated state) during commercial manufacture. Throughout the product lifecycle, the manufacturing process performance will be monitored to ensure that it is working as anticipated to deliver the product with desired quality attributes. Process stability and process capability will be measured and evaluated. If any unexpected process variability is detected, appropriate actions will be taken to correct, anticipate, and prevent future problems so that the process remains in control. The additional knowledge gained during routine manufacturing will be utilized for adjustment of process parameters as part of the continual improvement of the drug product. As a commitment, the regulatory agency will be notified in accordance with CFR 314.70 regarding each change in each condition beyond the variability already provided in this application. 18 U.S. Food and Drug Administration. Guidance for Industry. Process Validation: General Principles and Practices. January 2011. 19 21 CFR Part 211 Current Good Manufacturing Practice for Finished Pharmaceuticals, Subpart C.
  • 107. Example QbD IR Tablet Module 3 Quality 3.2.P.2 Pharmaceutical Development List of Abbreviations April 2012 107 ANDA: Abbreviated New Drug Application ANOVA: Analysis of Variance AUC: Area under the Curve AV: Acceptance Value BE: Bioequivalence BU: Blending Uniformity CCS: Croscarmellose Sodium CFR: Code of Federal Regulations CMA: Critical Material Attribute Cmax: Maximum Plasma Concentration CPP: Critical Process Parameter CQA: Critical Quality Attribute CU: Content Uniformity df: degrees of freedom DOE: Design of Experiments DS: Drug Substance DSC: Differential Scanning Calorimetry ffc: flow function coefficient ICH: International Conference on Harmonization IR: Immediate Release LOD: Loss on Drying MCC: Microcrystalline Cellulose N/A: Not applicable ND: Not detected NIR: Near-infrared NLT: Not Less Than NMT: Not More Than No.: Number Nrev: Number of revolutions PK: Pharmacokinetic PSD: Particle Size Distribution QbD: Quality by Design QTPP: Quality Target Product Profile R2 : Coefficient of Determination RC: Roller Compaction RLD: Reference Listed Drug (Product) RSD: Relative Standard Deviation RT: Room Temperature SLS: Sodium Lauryl Sulfate TI: Tolerance interval Tmax: Time for achieving Maximum Plasma Concentration XRPD: X-Ray Powder Diffraction