SlideShare a Scribd company logo
2
Most read
4
Most read
6
Most read
Regression vs ANOVA
By: Aniruddha Deshmukh – M. Sc. Statistics, MCM
Background
By Aniruddha Deshmukh - M. Sc. Statistics, MCM 2
It is very difficult to distinguish the differences between ANOVA and regression.
This is because both terms have more similarities than differences. It can be said
that ANOVA and regression are the two sides of the same coin.
Ref: my earlier post on “Data Types”
Continuous Data
• represent measurements
• e.g., you can measure the
height at progressively more
precise scales: meters,
centimeters, millimeters, and
beyond; so height is
continuous data.
Categorical Data
• describing/categorizing/
grouping something
• deals with characteristics and
descriptors that can't be easily
measured, but can be
observed subjectively - such as
smells, tastes, textures,
attractiveness, and color.
Let us first understand what is Continuous data and what is Categorical data.
Which tool to use when?
By Aniruddha Deshmukh - M. Sc. Statistics, MCM 3
Regression
• When Continuous Y and
Continuous X’s
• Continuous Y, Continuous AND
Categorical X(s)
• Logistic Regression:
Categorical Y, Continuous AND
Categorical X(s)
ANOVA
• When Continuous Y and
Categorical X’s
• Continuous Y, Continuous AND
Categorical X(s)
• Can be applied to any
regression model (no matter if
the model contains only
continuous, only categorical,
or both kinds of predictors)
Regression ANOVA
By Aniruddha Deshmukh - M. Sc. Statistics, MCM 4
• Fits least-squares straight line to data
• Predict a continuous outcome on the
basis of one or more continuous
predictor variables
• Quantify effect sizes in terms of "how
much is the response expected to
change when the predictor(s) change by
a given amount?“
• Asses the quantitative relation between
a predictor and the response
• Sorts data into boxes and finds averages
• Predict a continuous outcome on the
basis of one or more categorical
predictor variables
• Check how much the residual variance is
reduced by predictors in (nested
regression) models
• Assess the impact of a predictor or a
whole set of predictors on the residuals:
how much of the variance in the data
can be explained by these predictors?
ANOVA is a special case of regression, but from the perspective of their uses, there
is a different flavor; if the independent/predictor variable is categorical, you must
use ANOVA, otherwise use regression analysis.
Types of analysis-independent samples
By Aniruddha Deshmukh - M. Sc. Statistics, MCM 5
Outcome Explanatory Analysis
Continuous Dichotomous t-test, Wilcoxon test
Continuous Categorical
ANOVA, linear
regression
Continuous Continuous
Correlation, linear
regression
Dichotomous Dichotomous
Chi-square test,
logistic regression
Dichotomous Continuous Logistic regression
Time to event Dichotomous Log-rank test
Summary
• A regression model is based on one or more continuous predictor variables.
• On the contrary, the ANOVA model is based on one or more categorical
predictor variables.
• In ANOVA there can be several error terms whereas there is only a single error
term in regression.
• ANOVA is mainly used to determine if data from various groups have a
common means or not.
• Regression is widely used for forecasting and predictions.
• It is also used for seeing which independent variable is related to the
dependent variable.
• The first form of regression can be found in Legendre’s book ‘Method of Least
Squares.’
• It was Francis Galton who coined the term ‘regression’ in the 19th century.
• ANOVA was first used informally by researchers in the 1800s. It got wide
popularity after Fischer included this term in his book ‘Statistical Methods for
Research Workers.’
By Aniruddha Deshmukh - M. Sc. Statistics, MCM 6
Aniruddha Deshmukh – M. Sc. Statistics, MCM
email: annied23@gmail.com
For more information please contact:

More Related Content

PPTX
Parametric Statistical tests
PPT
multiple regression
PPSX
Multivariate Analysis An Overview
PPTX
Application of ANOVA
PPT
T test statistics
PPTX
Regression analysis: Simple Linear Regression Multiple Linear Regression
PPTX
Student T - test
PPTX
Anova (f test) and mean differentiation
Parametric Statistical tests
multiple regression
Multivariate Analysis An Overview
Application of ANOVA
T test statistics
Regression analysis: Simple Linear Regression Multiple Linear Regression
Student T - test
Anova (f test) and mean differentiation

What's hot (20)

PDF
Testing of hypothesis
PPT
Regression analysis
PDF
Analysis of Variance (ANOVA)
PPTX
Kruskal Wall Test
PPTX
Regression analysis
PPTX
One Way ANOVA and Two Way ANOVA using R
PPTX
Simple Linear Regression: Step-By-Step
PPTX
Anova ppt
PDF
Simple linear regression
PPTX
Regression
PPTX
Simulation and its application
PPTX
Sign test
PPTX
Steps in hypothesis.pptx
PPTX
TYPES OF ANOVA.pptx
PPTX
Chi-Square test.pptx
PDF
Correlation and Simple Regression
PPTX
Regression analysis
PPTX
Discriminant analysis
PPTX
Anova; analysis of variance
Testing of hypothesis
Regression analysis
Analysis of Variance (ANOVA)
Kruskal Wall Test
Regression analysis
One Way ANOVA and Two Way ANOVA using R
Simple Linear Regression: Step-By-Step
Anova ppt
Simple linear regression
Regression
Simulation and its application
Sign test
Steps in hypothesis.pptx
TYPES OF ANOVA.pptx
Chi-Square test.pptx
Correlation and Simple Regression
Regression analysis
Discriminant analysis
Anova; analysis of variance
Ad

Viewers also liked (20)

PDF
T test and ANOVA
PPT
Unit 7 lesson 1
PPTX
Presentation non parametric
PPT
F Distribution
PPTX
Ppt of statistics for teachers
PPT
F test Analysis of Variance (ANOVA)
PPTX
t-test vs ANOVA
PPT
Advance statistics 2
PPTX
F-Distribution
PPTX
non parametric statistics
PPTX
One way anova final ppt.
PDF
Applied statistics lecture_8
PPTX
Parametric vs Non-Parametric
PPTX
Nonparametric tests
PPT
Nonparametric statistics
PPTX
Non-Parametric Tests
PPTX
discriminant analysis
PPTX
Hypothesis testing ppt final
PPTX
Analysis of variance (ANOVA)
PPTX
Non parametric tests
T test and ANOVA
Unit 7 lesson 1
Presentation non parametric
F Distribution
Ppt of statistics for teachers
F test Analysis of Variance (ANOVA)
t-test vs ANOVA
Advance statistics 2
F-Distribution
non parametric statistics
One way anova final ppt.
Applied statistics lecture_8
Parametric vs Non-Parametric
Nonparametric tests
Nonparametric statistics
Non-Parametric Tests
discriminant analysis
Hypothesis testing ppt final
Analysis of variance (ANOVA)
Non parametric tests
Ad

Similar to Regression vs ANOVA (20)

PPTX
use of SPSS in Data Analysis in Research.pptx
PPTX
STATISTICAL REGRESSION MODELS
PPTX
SAS Notes
PPT
Corr And Regress
PPTX
Regression Analysis
PPTX
Regression
PPTX
Statistical tests
PDF
Regression Analysis-Machine Learning -Different Types
PPTX
DA//////////////////////////////////////// Unit 2.pptx
PPTX
relational Statistics - workshops 1, II, III.pptx
PPTX
Statistical testing.pptxstatisctics bachelors
PPTX
Statistical testing.pptxhsnskemenemkwkwmwjnw
PDF
Role of regression in statistics (2)
PPT
Ttestrrrrrrrrrrrrrr2dfsssssssssssss008.ppt
PPTX
Breakdown of Regression Models for Dissertations
PPTX
Regression (Linear Regression and Logistic Regression) by Akanksha Bali
PPTX
Accounting serx
PPTX
Accounting serx
PPT
Correlation & Regression for Statistics Social Science
PPT
Corr-and-Regress.ppt
use of SPSS in Data Analysis in Research.pptx
STATISTICAL REGRESSION MODELS
SAS Notes
Corr And Regress
Regression Analysis
Regression
Statistical tests
Regression Analysis-Machine Learning -Different Types
DA//////////////////////////////////////// Unit 2.pptx
relational Statistics - workshops 1, II, III.pptx
Statistical testing.pptxstatisctics bachelors
Statistical testing.pptxhsnskemenemkwkwmwjnw
Role of regression in statistics (2)
Ttestrrrrrrrrrrrrrr2dfsssssssssssss008.ppt
Breakdown of Regression Models for Dissertations
Regression (Linear Regression and Logistic Regression) by Akanksha Bali
Accounting serx
Accounting serx
Correlation & Regression for Statistics Social Science
Corr-and-Regress.ppt

Recently uploaded (20)

PPTX
Introduction to Effective Communication.pptx
PPTX
Relationship Management Presentation In Banking.pptx
PDF
Nykaa-Strategy-Case-Fixing-Retention-UX-and-D2C-Engagement (1).pdf
PPTX
Primary and secondary sources, and history
PPTX
The spiral of silence is a theory in communication and political science that...
PDF
oil_refinery_presentation_v1 sllfmfls.pdf
PDF
Swiggy’s Playbook: UX, Logistics & Monetization
PPTX
INTERNATIONAL LABOUR ORAGNISATION PPT ON SOCIAL SCIENCE
PPTX
_ISO_Presentation_ISO 9001 and 45001.pptx
PDF
Why Top Brands Trust Enuncia Global for Language Solutions.pdf
PPTX
Human Mind & its character Characteristics
PPTX
Hydrogel Based delivery Cancer Treatment
PPTX
Non-Verbal-Communication .mh.pdf_110245_compressed.pptx
PPTX
worship songs, in any order, compilation
DOCX
ENGLISH PROJECT FOR BINOD BIHARI MAHTO KOYLANCHAL UNIVERSITY
PDF
Instagram's Product Secrets Unveiled with this PPT
PPTX
Impressionism_PostImpressionism_Presentation.pptx
PPTX
The Effect of Human Resource Management Practice on Organizational Performanc...
PPTX
Self management and self evaluation presentation
PPTX
fundraisepro pitch deck elegant and modern
Introduction to Effective Communication.pptx
Relationship Management Presentation In Banking.pptx
Nykaa-Strategy-Case-Fixing-Retention-UX-and-D2C-Engagement (1).pdf
Primary and secondary sources, and history
The spiral of silence is a theory in communication and political science that...
oil_refinery_presentation_v1 sllfmfls.pdf
Swiggy’s Playbook: UX, Logistics & Monetization
INTERNATIONAL LABOUR ORAGNISATION PPT ON SOCIAL SCIENCE
_ISO_Presentation_ISO 9001 and 45001.pptx
Why Top Brands Trust Enuncia Global for Language Solutions.pdf
Human Mind & its character Characteristics
Hydrogel Based delivery Cancer Treatment
Non-Verbal-Communication .mh.pdf_110245_compressed.pptx
worship songs, in any order, compilation
ENGLISH PROJECT FOR BINOD BIHARI MAHTO KOYLANCHAL UNIVERSITY
Instagram's Product Secrets Unveiled with this PPT
Impressionism_PostImpressionism_Presentation.pptx
The Effect of Human Resource Management Practice on Organizational Performanc...
Self management and self evaluation presentation
fundraisepro pitch deck elegant and modern

Regression vs ANOVA

  • 1. Regression vs ANOVA By: Aniruddha Deshmukh – M. Sc. Statistics, MCM
  • 2. Background By Aniruddha Deshmukh - M. Sc. Statistics, MCM 2 It is very difficult to distinguish the differences between ANOVA and regression. This is because both terms have more similarities than differences. It can be said that ANOVA and regression are the two sides of the same coin. Ref: my earlier post on “Data Types” Continuous Data • represent measurements • e.g., you can measure the height at progressively more precise scales: meters, centimeters, millimeters, and beyond; so height is continuous data. Categorical Data • describing/categorizing/ grouping something • deals with characteristics and descriptors that can't be easily measured, but can be observed subjectively - such as smells, tastes, textures, attractiveness, and color. Let us first understand what is Continuous data and what is Categorical data.
  • 3. Which tool to use when? By Aniruddha Deshmukh - M. Sc. Statistics, MCM 3 Regression • When Continuous Y and Continuous X’s • Continuous Y, Continuous AND Categorical X(s) • Logistic Regression: Categorical Y, Continuous AND Categorical X(s) ANOVA • When Continuous Y and Categorical X’s • Continuous Y, Continuous AND Categorical X(s) • Can be applied to any regression model (no matter if the model contains only continuous, only categorical, or both kinds of predictors)
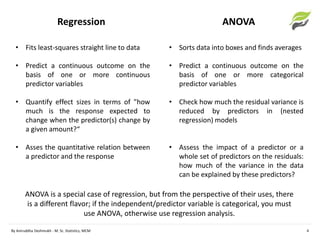
  • 4. Regression ANOVA By Aniruddha Deshmukh - M. Sc. Statistics, MCM 4 • Fits least-squares straight line to data • Predict a continuous outcome on the basis of one or more continuous predictor variables • Quantify effect sizes in terms of "how much is the response expected to change when the predictor(s) change by a given amount?“ • Asses the quantitative relation between a predictor and the response • Sorts data into boxes and finds averages • Predict a continuous outcome on the basis of one or more categorical predictor variables • Check how much the residual variance is reduced by predictors in (nested regression) models • Assess the impact of a predictor or a whole set of predictors on the residuals: how much of the variance in the data can be explained by these predictors? ANOVA is a special case of regression, but from the perspective of their uses, there is a different flavor; if the independent/predictor variable is categorical, you must use ANOVA, otherwise use regression analysis.
  • 5. Types of analysis-independent samples By Aniruddha Deshmukh - M. Sc. Statistics, MCM 5 Outcome Explanatory Analysis Continuous Dichotomous t-test, Wilcoxon test Continuous Categorical ANOVA, linear regression Continuous Continuous Correlation, linear regression Dichotomous Dichotomous Chi-square test, logistic regression Dichotomous Continuous Logistic regression Time to event Dichotomous Log-rank test
  • 6. Summary • A regression model is based on one or more continuous predictor variables. • On the contrary, the ANOVA model is based on one or more categorical predictor variables. • In ANOVA there can be several error terms whereas there is only a single error term in regression. • ANOVA is mainly used to determine if data from various groups have a common means or not. • Regression is widely used for forecasting and predictions. • It is also used for seeing which independent variable is related to the dependent variable. • The first form of regression can be found in Legendre’s book ‘Method of Least Squares.’ • It was Francis Galton who coined the term ‘regression’ in the 19th century. • ANOVA was first used informally by researchers in the 1800s. It got wide popularity after Fischer included this term in his book ‘Statistical Methods for Research Workers.’ By Aniruddha Deshmukh - M. Sc. Statistics, MCM 6
  • 7. Aniruddha Deshmukh – M. Sc. Statistics, MCM email: annied23@gmail.com For more information please contact: