3
Most read
5
Most read
19
Most read
Van Horne & Wachowicz,
© Pearson Education Limited 2004
V - 1
Fundamentals of Financial Management, 12/e
Chapter 5: Risk and Return
by Gregory A. Kuhlemeyer, Ph.D.,
Carroll College, Waukesha, WI
5-1
Chapter 5
Risk and
Return
Risk and
Return
© Pearson Education Limited 2004
Fundamentals of Financial Management, 12/e
Created by: Gregory A. Kuhlemeyer, Ph.D.
Carroll College, Waukesha, WI
5-2
Defining ReturnDefining Return
Income received on an investment
plus any change in market price,
usually expressed as a percent of
the beginning market price of the
investment.
Income received on an investment
plus any change in market price,
usually expressed as a percent of
the beginning market price of the
investment.
Dt + (Pt - Pt-1 )
Pt-1
R =
Van Horne & Wachowicz,
© Pearson Education Limited 2004
V - 2
Fundamentals of Financial Management, 12/e
Chapter 5: Risk and Return
by Gregory A. Kuhlemeyer, Ph.D.,
Carroll College, Waukesha, WI
5-3
Return ExampleReturn Example
The stock price for Stock A was $10 per
share 1 year ago. The stock is currently
trading at $9.50 per share and shareholders
just received a $1 dividend. What return
was earned over the past year?
The stock price for Stock A was $10 per
share 1 year ago. The stock is currently
trading at $9.50 per share and shareholders
just received a $1 dividend. What return
was earned over the past year?
5-4
Return ExampleReturn Example
The stock price for Stock A was $10 per
share 1 year ago. The stock is currently
trading at $9.50 per share and shareholders
just received a $1 dividend. What return
was earned over the past year?
The stock price for Stock A was $10 per
share 1 year ago. The stock is currently
trading at $9.50 per share and shareholders
just received a $1 dividend. What return
was earned over the past year?
$1.00 + ($9.50 - $10.00 )
$10.00R = = 5%
Van Horne & Wachowicz,
© Pearson Education Limited 2004
V - 3
Fundamentals of Financial Management, 12/e
Chapter 5: Risk and Return
by Gregory A. Kuhlemeyer, Ph.D.,
Carroll College, Waukesha, WI
5-5
Defining RiskDefining Risk
The variability of returns from
those that are expected.
The variability of returns from
those that are expected.
5-6
Determining Expected
Return (Discrete Dist.)
Determining Expected
Return (Discrete Dist.)
R = ΣΣΣΣ ( Ri )( Pi )
R is the expected return for the asset,
Ri is the return for the ith possibility,
Pi is the probability of that return
occurring,
n is the total number of possibilities.
R = ΣΣΣΣ ( Ri )( Pi )
R is the expected return for the asset,
Ri is the return for the ith possibility,
Pi is the probability of that return
occurring,
n is the total number of possibilities.
n
i=1
Van Horne & Wachowicz,
© Pearson Education Limited 2004
V - 4
Fundamentals of Financial Management, 12/e
Chapter 5: Risk and Return
by Gregory A. Kuhlemeyer, Ph.D.,
Carroll College, Waukesha, WI
5-7
How to Determine the Expected
Return and Standard Deviation
How to Determine the Expected
Return and Standard Deviation
Stock BW
Ri Pi (Ri)(Pi)
-.15 .10 -.015
-.03 .20 -.006
.09 .40 .036
.21 .20 .042
.33 .10 .033
Sum 1.00 .090
Stock BW
Ri Pi (Ri)(Pi)
-.15 .10 -.015
-.03 .20 -.006
.09 .40 .036
.21 .20 .042
.33 .10 .033
Sum 1.00 .090
The
expected
return, R,
for Stock
BW is .09
or 9%
5-8
Determining Standard
Deviation (Risk Measure)
Determining Standard
Deviation (Risk Measure)
σσσσ = ΣΣΣΣ ( Ri - R )2( Pi )
Standard Deviation, σσσσ, is a statistical
measure of the variability of a distribution
around its mean.
It is the square root of variance.
Note, this is for a discrete distribution.
σσσσ = ΣΣΣΣ ( Ri - R )2( Pi )
Standard Deviation, σσσσ, is a statistical
measure of the variability of a distribution
around its mean.
It is the square root of variance.
Note, this is for a discrete distribution.
n
i=1
Van Horne & Wachowicz,
© Pearson Education Limited 2004
V - 5
Fundamentals of Financial Management, 12/e
Chapter 5: Risk and Return
by Gregory A. Kuhlemeyer, Ph.D.,
Carroll College, Waukesha, WI
5-9
How to Determine the Expected
Return and Standard Deviation
How to Determine the Expected
Return and Standard Deviation
Stock BW
Ri Pi (Ri)(Pi) (Ri - R )2(Pi)
-.15 .10 -.015 .00576
-.03 .20 -.006 .00288
.09 .40 .036 .00000
.21 .20 .042 .00288
.33 .10 .033 .00576
Sum 1.00 .090 .01728
Stock BW
Ri Pi (Ri)(Pi) (Ri - R )2(Pi)
-.15 .10 -.015 .00576
-.03 .20 -.006 .00288
.09 .40 .036 .00000
.21 .20 .042 .00288
.33 .10 .033 .00576
Sum 1.00 .090 .01728
5-10
Determining Standard
Deviation (Risk Measure)
Determining Standard
Deviation (Risk Measure)
σσσσ = ΣΣΣΣ ( Ri - R )2( Pi )
σσσσ = .01728
σσσσ = .1315 or 13.15%
σσσσ = ΣΣΣΣ ( Ri - R )2( Pi )
σσσσ = .01728
σσσσ = .1315 or 13.15%
n
i=1
Van Horne & Wachowicz,
© Pearson Education Limited 2004
V - 6
Fundamentals of Financial Management, 12/e
Chapter 5: Risk and Return
by Gregory A. Kuhlemeyer, Ph.D.,
Carroll College, Waukesha, WI
5-11
Coefficient of VariationCoefficient of Variation
The ratio of the standard deviation of
a distribution to the mean of that
distribution.
It is a measure of RELATIVE risk.
CV = σσσσ / R
CV of BW = .1315 / .09 = 1.46
The ratio of the standard deviation of
a distribution to the mean of that
distribution.
It is a measure of RELATIVE risk.
CV = σσσσ / R
CV of BW = .1315 / .09 = 1.46
5-12
Discrete vs. Continuous
Distributions
0
0.05
0.1
0.15
0.2
0.25
0.3
0.35
0.4
-15% -3% 9% 21% 33%
Discrete Continuous
0
0.005
0.01
0.015
0.02
0.025
0.03
0.035
-50%
-41%
-32%
-23%
-14%
-5%
4%
13%
22%
31%
40%
49%
58%
67%
Van Horne & Wachowicz,
© Pearson Education Limited 2004
V - 7
Fundamentals of Financial Management, 12/e
Chapter 5: Risk and Return
by Gregory A. Kuhlemeyer, Ph.D.,
Carroll College, Waukesha, WI
5-13
Certainty Equivalent (CE) is the
amount of cash someone would
require with certainty at a point in
time to make the individual
indifferent between that certain
amount and an amount expected to
be received with risk at the same
point in time.
Certainty Equivalent (CE) is the
amount of cash someone would
require with certainty at a point in
time to make the individual
indifferent between that certain
amount and an amount expected to
be received with risk at the same
point in time.
Risk AttitudesRisk Attitudes
5-14
Certainty equivalent > Expected value
Risk Preference
Certainty equivalent = Expected value
Risk Indifference
Certainty equivalent < Expected value
Risk Aversion
Most individuals are Risk Averse.
Certainty equivalent > Expected value
Risk Preference
Certainty equivalent = Expected value
Risk Indifference
Certainty equivalent < Expected value
Risk Aversion
Most individuals are Risk Averse.
Risk AttitudesRisk Attitudes
Van Horne & Wachowicz,
© Pearson Education Limited 2004
V - 8
Fundamentals of Financial Management, 12/e
Chapter 5: Risk and Return
by Gregory A. Kuhlemeyer, Ph.D.,
Carroll College, Waukesha, WI
5-15
Risk Attitude Example
You have the choice between (1) a guaranteed
dollar reward or (2) a coin-flip gamble of
$100,000 (50% chance) or $0 (50% chance).
The expected value of the gamble is $50,000.
Mary requires a guaranteed $25,000, or more, to
call off the gamble.
Raleigh is just as happy to take $50,000 or take
the risky gamble.
Shannon requires at least $52,000 to call off the
gamble.
5-16
What are the Risk Attitude tendencies of each?
Risk Attitude ExampleRisk Attitude Example
Mary shows “risk aversion” because her
“certainty equivalent” < the expected value of
the gamble.
Raleigh exhibits “risk indifference” because her
“certainty equivalent” equals the expected value
of the gamble.
Shannon reveals a “risk preference” because her
“certainty equivalent” > the expected value of
the gamble.
Van Horne & Wachowicz,
© Pearson Education Limited 2004
V - 9
Fundamentals of Financial Management, 12/e
Chapter 5: Risk and Return
by Gregory A. Kuhlemeyer, Ph.D.,
Carroll College, Waukesha, WI
5-17
RP = ΣΣΣΣ ( Wj )( Rj )
RP is the expected return for the portfolio,
Wj is the weight (investment proportion)
for the jth asset in the portfolio,
Rj is the expected return of the jth asset,
m is the total number of assets in the
portfolio.
RP = ΣΣΣΣ ( Wj )( Rj )
RP is the expected return for the portfolio,
Wj is the weight (investment proportion)
for the jth asset in the portfolio,
Rj is the expected return of the jth asset,
m is the total number of assets in the
portfolio.
Determining Portfolio
Expected Return
Determining Portfolio
Expected Return
m
j=1
5-18
Determining Portfolio
Standard Deviation
Determining Portfolio
Standard Deviation
m
j=1
m
k=1
σσσσP = Σ ΣΣ ΣΣ ΣΣ Σ Wj Wk σσσσjk
Wj is the weight (investment proportion)
for the jth asset in the portfolio,
Wk is the weight (investment proportion)
for the kth asset in the portfolio,
σσσσjk is the covariance between returns for
the jth and kth assets in the portfolio.
σσσσP = Σ ΣΣ ΣΣ ΣΣ Σ Wj Wk σσσσjk
Wj is the weight (investment proportion)
for the jth asset in the portfolio,
Wk is the weight (investment proportion)
for the kth asset in the portfolio,
σσσσjk is the covariance between returns for
the jth and kth assets in the portfolio.
Van Horne & Wachowicz,
© Pearson Education Limited 2004
V - 10
Fundamentals of Financial Management, 12/e
Chapter 5: Risk and Return
by Gregory A. Kuhlemeyer, Ph.D.,
Carroll College, Waukesha, WI
5-19
Combining securities that are not perfectly,
positively correlated reduces risk.
Combining securities that are not perfectly,
positively correlated reduces risk.
Risk and DiversificationRisk and DiversificationINVESTMENTRETURN
TIME TIMETIME
SECURITY E SECURITY F
Combination
E and F
5-20
Systematic Risk is the variability of return
on stocks or portfolios associated with
changes in return on the market as a whole.
Unsystematic Risk is the variability of return
on stocks or portfolios not explained by
general market movements. It is avoidable
through diversification.
Systematic Risk is the variability of return
on stocks or portfolios associated with
changes in return on the market as a whole.
Unsystematic Risk is the variability of return
on stocks or portfolios not explained by
general market movements. It is avoidable
through diversification.
Total Risk = Systematic
Risk + Unsystematic Risk
Total Risk = Systematic
Risk + Unsystematic Risk
Total Risk = Systematic Risk +
Unsystematic Risk
Van Horne & Wachowicz,
© Pearson Education Limited 2004
V - 11
Fundamentals of Financial Management, 12/e
Chapter 5: Risk and Return
by Gregory A. Kuhlemeyer, Ph.D.,
Carroll College, Waukesha, WI
5-21
Total Risk = Systematic
Risk + Unsystematic Risk
Total Risk = Systematic
Risk + Unsystematic Risk
Total
Risk
Unsystematic risk
Systematic risk
STDDEVOFPORTFOLIORETURN
NUMBER OF SECURITIES IN THE PORTFOLIO
Factors such as changes in nation’s
economy, tax reform by the Congress,
or a change in the world situation.
5-22
Total Risk = Systematic
Risk + Unsystematic Risk
Total Risk = Systematic
Risk + Unsystematic Risk
Total
Risk
Unsystematic risk
Systematic risk
STDDEVOFPORTFOLIORETURN
NUMBER OF SECURITIES IN THE PORTFOLIO
Factors unique to a particular company
or industry. For example, the death of a
key executive or loss of a governmental
defense contract.
Van Horne & Wachowicz,
© Pearson Education Limited 2004
V - 12
Fundamentals of Financial Management, 12/e
Chapter 5: Risk and Return
by Gregory A. Kuhlemeyer, Ph.D.,
Carroll College, Waukesha, WI
5-23
CAPM is a model that describes the
relationship between risk and
expected (required) return; in this
model, a security’s expected
(required) return is the risk-free rate
plus a premium based on the
systematic risk of the security.
CAPM is a model that describes the
relationship between risk and
expected (required) return; in this
model, a security’s expected
(required) return is the risk-free rate
plus a premium based on the
systematic risk of the security.
Capital Asset
Pricing Model (CAPM)
Capital Asset
Pricing Model (CAPM)
5-24
1. Capital markets are efficient.
2. Homogeneous investor expectations
over a given period.
3. Risk-free asset return is certain
(use short- to intermediate-term
Treasuries as a proxy).
4. Market portfolio contains only
systematic risk (use S&P 500 Index
or similar as a proxy).
1. Capital markets are efficient.
2. Homogeneous investor expectations
over a given period.
3. Risk-free asset return is certain
(use short- to intermediate-term
Treasuries as a proxy).
4. Market portfolio contains only
systematic risk (use S&P 500 Index
or similar as a proxy).
CAPM AssumptionsCAPM Assumptions
Van Horne & Wachowicz,
© Pearson Education Limited 2004
V - 13
Fundamentals of Financial Management, 12/e
Chapter 5: Risk and Return
by Gregory A. Kuhlemeyer, Ph.D.,
Carroll College, Waukesha, WI
5-25
Characteristic LineCharacteristic Line
EXCESS RETURN
ON STOCK
EXCESS RETURN
ON MARKET PORTFOLIO
Narrower spread
is higher correlation
Characteristic Line
5-26
Calculating “Beta”
Time Pd. Market My Stock
1 9.6% 12%
2 -15.4% -5%
3 26.7% 19%
4 -.2% 3%
5 20.9% 13%
6 28.3% 14%
7 -5.9% -9%
8 3.3% -1%
9 12.2% 12%
10 10.5% 10%
The Market
and My
Stock
returns are
“excess
returns” and
have the
riskless rate
already
subtracted.
Van Horne & Wachowicz,
© Pearson Education Limited 2004
V - 14
Fundamentals of Financial Management, 12/e
Chapter 5: Risk and Return
by Gregory A. Kuhlemeyer, Ph.D.,
Carroll College, Waukesha, WI
5-27
Calculating “Beta”
Enter the excess market returns as “X”
observations of: 9.6%, -15.4%, 26.7%, -0.2%,
20.9%, 28.3%, -5.9%, 3.3%, 12.2%, and 10.5%.
Enter the excess stock returns as “Y” observations
of: 12%, -5%, 19%, 3%, 13%, 14%, -9%, -1%,
12%, and 10%.
5-28
Calculating “Beta”
The regression equation is Y=a+bX. Thus, our
characteristic line is Y = 1.4448 + 0.595 X and
indicates that our stock has a beta of 0.595.
Van Horne & Wachowicz,
© Pearson Education Limited 2004
V - 15
Fundamentals of Financial Management, 12/e
Chapter 5: Risk and Return
by Gregory A. Kuhlemeyer, Ph.D.,
Carroll College, Waukesha, WI
5-29
An index of systematic risk.
It measures the sensitivity of a
stock’s returns to changes in
returns on the market portfolio.
The beta for a portfolio is simply a
weighted average of the individual
stock betas in the portfolio.
An index of systematic risk.
It measures the sensitivity of a
stock’s returns to changes in
returns on the market portfolio.
The beta for a portfolio is simply a
weighted average of the individual
stock betas in the portfolio.
What is Beta?What is Beta?
5-30
Characteristic Lines
and Different Betas
Characteristic Lines
and Different Betas
EXCESS RETURN
ON STOCK
EXCESS RETURN
ON MARKET PORTFOLIO
Beta < 1
(defensive)
Beta = 1
Beta > 1
(aggressive)
Each characteristic
line has a
different slope.
Van Horne & Wachowicz,
© Pearson Education Limited 2004
V - 16
Fundamentals of Financial Management, 12/e
Chapter 5: Risk and Return
by Gregory A. Kuhlemeyer, Ph.D.,
Carroll College, Waukesha, WI
5-31
Rj is the required rate of return for stock j,
Rf is the risk-free rate of return,
ββββj is the beta of stock j (measures
systematic risk of stock j),
RM is the expected return for the market
portfolio.
Rj is the required rate of return for stock j,
Rf is the risk-free rate of return,
ββββj is the beta of stock j (measures
systematic risk of stock j),
RM is the expected return for the market
portfolio.
Security Market LineSecurity Market Line
Rj = Rf + ββββj(RM - Rf)
5-32
Security Market LineSecurity Market Line
Rj = Rf + ββββj(RM - Rf)
ββββM = 1.0
Systematic Risk (Beta)
Rf
RM
RequiredReturn
Risk
Premium
Risk-free
Return
Van Horne & Wachowicz,
© Pearson Education Limited 2004
V - 17
Fundamentals of Financial Management, 12/e
Chapter 5: Risk and Return
by Gregory A. Kuhlemeyer, Ph.D.,
Carroll College, Waukesha, WI
5-33
Security Market Line
(Obtaining information for
the model)
Security Market Line
(Obtaining information for
the model)
Obtaining Betas
Can use historical data if past best represents the
expectations of the future
Can also utilize services like Value Line, Ibbotson
Associates, etc.
Obtaining Betas
Can use historical data if past best represents the
expectations of the future
Can also utilize services like Value Line, Ibbotson
Associates, etc.
5-34
Adjusted Market return and Risk free rate
One may use past for obtaining market
return and risk free rate but only if past is a
good proxy.
Direct estimate of the risk free rate by
looking up the current rate of return on an
appropriate security.
Using forecasts for market return estimated
by thesecurity analysts, economists and
others who regularly predict such returns.
Security Market Line
(Obtaining information for
the model)
Security Market Line
(Obtaining information for
the model)
Van Horne & Wachowicz,
© Pearson Education Limited 2004
V - 18
Fundamentals of Financial Management, 12/e
Chapter 5: Risk and Return
by Gregory A. Kuhlemeyer, Ph.D.,
Carroll College, Waukesha, WI
5-35
Lisa Miller at Basket Wonders is
attempting to determine the rate of return
required by their stock investors. Lisa is
using a 6% Rf and a long-term market
expected rate of return of 10%. A stock
analyst following the firm has calculated
that the firm beta is 1.2. What is the
required rate of return on the stock of
Basket Wonders?
Determination of the
Required Rate of Return
Determination of the
Required Rate of Return
5-36
RBW = Rf + ββββj(RM - Rf)
RBW = 6% + 1.2(10% - 6%)
RBW = 10.8%
The required rate of return exceeds
the market rate of return as BW’s
beta exceeds the market beta (1.0).
RBW = Rf + ββββj(RM - Rf)
RBW = 6% + 1.2(10% - 6%)
RBW = 10.8%
The required rate of return exceeds
the market rate of return as BW’s
beta exceeds the market beta (1.0).
BWs Required
Rate of Return
BWs Required
Rate of Return
Van Horne & Wachowicz,
© Pearson Education Limited 2004
V - 19
Fundamentals of Financial Management, 12/e
Chapter 5: Risk and Return
by Gregory A. Kuhlemeyer, Ph.D.,
Carroll College, Waukesha, WI
5-37
Lisa Miller at BW is also attempting to
determine the intrinsic value of the stock.
She is using the constant growth model.
Lisa estimates that the dividend next period
will be $0.50 and that BW will grow at a
constant rate of 5.8%. The stock is currently
selling for $15.
What is the intrinsic value of the stock?
Is the stock over or underpriced?
Determination of the
Intrinsic Value of BW
Determination of the
Intrinsic Value of BW
5-38
The stock is OVERVALUED as
the market price ($15) exceeds
the intrinsic value ($10).
The stock is OVERVALUED as
the market price ($15) exceeds
the intrinsic value ($10).
Determination of the
Intrinsic Value of BW
Determination of the
Intrinsic Value of BW
$0.50
10.8% - 5.8%
Intrinsic
Value
=
= $10
Van Horne & Wachowicz,
© Pearson Education Limited 2004
V - 20
Fundamentals of Financial Management, 12/e
Chapter 5: Risk and Return
by Gregory A. Kuhlemeyer, Ph.D.,
Carroll College, Waukesha, WI
5-39
Security Market LineSecurity Market Line
Systematic Risk (Beta)
Rf
RequiredReturn
Direction of
Movement
Direction of
Movement
Stock Y (Overpriced)
Stock X (Underpriced)

More Related Content

PPT
A gibson 12e_ch01
PPTX
PPT
Investment decision
PPTX
Law of equi marginal utility gp
PPTX
Risk and Return
PPT
Stock Valuation
PPTX
The five competitive forces that shape strategy
PPTX
Chapter 5
A gibson 12e_ch01
Investment decision
Law of equi marginal utility gp
Risk and Return
Stock Valuation
The five competitive forces that shape strategy
Chapter 5

What's hot (20)

PPT
Financial Management Slides Ch 05
PPT
Overview of Working Capital Management
PPT
Financial Management Slides Ch 10
PPTX
Risk and return
PPT
valuation of bonds and share
PPT
Chapter 3 - Time Value of Money
PPT
Financial Management Slides Ch 11
PPT
Financial Management Ch 06
PPTX
financial institutions and markets
PPT
Investment Management Risk and Return
PPTX
Stock Valuation
PPT
Analysis of financial statement
PPT
Risk management in financial institution
PPT
The valuation of long-term securities
PPT
Value at Risk (VaR), Intro
PPT
Chapter 09_The Money Markets
PPT
Risk and return
PPT
Chapter 12 Cost Of Capital
PPTX
Stock valuation
PDF
Corporate valuation
Financial Management Slides Ch 05
Overview of Working Capital Management
Financial Management Slides Ch 10
Risk and return
valuation of bonds and share
Chapter 3 - Time Value of Money
Financial Management Slides Ch 11
Financial Management Ch 06
financial institutions and markets
Investment Management Risk and Return
Stock Valuation
Analysis of financial statement
Risk management in financial institution
The valuation of long-term securities
Value at Risk (VaR), Intro
Chapter 09_The Money Markets
Risk and return
Chapter 12 Cost Of Capital
Stock valuation
Corporate valuation
Ad

Similar to Risk and return (20)

PPT
Risk Return.ppt
PPT
9780273713654_pp05.ppt4-161111062526.pptx4-161111062526.pptx4-161111062526.pptx
PPT
Risk and Return Analysis in Financial Management.ppt
PPT
Chapter 5 Risk and Return from Fundamental of financial Management
PDF
Corporate Finance lecture material Powerpoint
PDF
4.3 presentation slides
PDF
Grey minimalist business project presentation (2).pdf
PDF
Valuation of long term securities
PPT
Chapter 12.Risk and Return
PPTX
PDF
Chapter 5: Risk and Return
PDF
Chapter 5:Risk and Return
PDF
Chapter 5
PPT
Fin254-ch08_nnh-Risk-return.pptvweveverververv
PPT
Risk and return of Pricipe managerial finance
PDF
Slides money banking risk reward capm
PPT
Intro to Value at Risk (VaR)
PPTX
Risk and return, corporate finance, chapter 11
PPTX
Investment presentation of chapter stock and bonds.pptx
Risk Return.ppt
9780273713654_pp05.ppt4-161111062526.pptx4-161111062526.pptx4-161111062526.pptx
Risk and Return Analysis in Financial Management.ppt
Chapter 5 Risk and Return from Fundamental of financial Management
Corporate Finance lecture material Powerpoint
4.3 presentation slides
Grey minimalist business project presentation (2).pdf
Valuation of long term securities
Chapter 12.Risk and Return
Chapter 5: Risk and Return
Chapter 5:Risk and Return
Chapter 5
Fin254-ch08_nnh-Risk-return.pptvweveverververv
Risk and return of Pricipe managerial finance
Slides money banking risk reward capm
Intro to Value at Risk (VaR)
Risk and return, corporate finance, chapter 11
Investment presentation of chapter stock and bonds.pptx
Ad

More from ISYousafzai (16)

PDF
Discrete probability distribution (complete)
PDF
Time value of money
PDF
Probability concepts
PDF
Introduction To Business Statistics
PPTX
Spread of western culture in pakistan
PDF
Business Communication by Dr. Syed Imad Shah
PPT
The Basic tools of Finance
PDF
Role Of Deoband Ulama in strenthening the foundation of Indian Freedom moveme...
PPT
Financial Statement Analysis
PDF
Role of financial management
PPSX
Logic By Dr. Syed Imad Shah
PPT
False dilemma
PPTX
Informal Fallacies
PPTX
China Pakistan Economic Corridor
PPTX
Success and failures of organizations
PPTX
Role of Deoband Ulama ... Its 1857* Sorry!
Discrete probability distribution (complete)
Time value of money
Probability concepts
Introduction To Business Statistics
Spread of western culture in pakistan
Business Communication by Dr. Syed Imad Shah
The Basic tools of Finance
Role Of Deoband Ulama in strenthening the foundation of Indian Freedom moveme...
Financial Statement Analysis
Role of financial management
Logic By Dr. Syed Imad Shah
False dilemma
Informal Fallacies
China Pakistan Economic Corridor
Success and failures of organizations
Role of Deoband Ulama ... Its 1857* Sorry!

Recently uploaded (20)

PPTX
operations management : demand supply ch
PPTX
Market and Demand Analysis.pptx for Management students
PDF
Communication Tactics in Legal Contexts: Historical Case Studies (www.kiu.ac...
PPT
Retail Management and Retail Markets and Concepts
PPTX
IITM - FINAL Option - 01 - 12.08.25.pptx
PDF
Middle East's Most Impactful Business Leaders to Follow in 2025
PPTX
Portfolio Example- Market & Consumer Insights – Strategic Entry for BYD UK.pptx
PPTX
Project Management_ SMART Projects Class.pptx
PPTX
Understanding Procurement Strategies.pptx Your score increases as you pick a ...
PDF
Chapter 2 - AI chatbots and prompt engineering.pdf
DOCX
80 DE ÔN VÀO 10 NĂM 2023vhkkkjjhhhhjjjj
PPTX
IMM.pptx marketing communication givguhfh thfyu
PPTX
CTG - Business Update 2Q2025 & 6M2025.pptx
PPTX
TRAINNING, DEVELOPMENT AND APPRAISAL.pptx
DOCX
Center Enamel A Strategic Partner for the Modernization of Georgia's Chemical...
PDF
THE COMPLETE GUIDE TO BUILDING PASSIVE INCOME ONLINE
PPTX
BUSINESS CYCLE_INFLATION AND UNEMPLOYMENT.pptx
PDF
HQ #118 / 'Building Resilience While Climbing the Event Mountain
PDF
1911 Gold Corporate Presentation Aug 2025.pdf
PPTX
interschool scomp.pptxzdkjhdjvdjvdjdhjhieij
operations management : demand supply ch
Market and Demand Analysis.pptx for Management students
Communication Tactics in Legal Contexts: Historical Case Studies (www.kiu.ac...
Retail Management and Retail Markets and Concepts
IITM - FINAL Option - 01 - 12.08.25.pptx
Middle East's Most Impactful Business Leaders to Follow in 2025
Portfolio Example- Market & Consumer Insights – Strategic Entry for BYD UK.pptx
Project Management_ SMART Projects Class.pptx
Understanding Procurement Strategies.pptx Your score increases as you pick a ...
Chapter 2 - AI chatbots and prompt engineering.pdf
80 DE ÔN VÀO 10 NĂM 2023vhkkkjjhhhhjjjj
IMM.pptx marketing communication givguhfh thfyu
CTG - Business Update 2Q2025 & 6M2025.pptx
TRAINNING, DEVELOPMENT AND APPRAISAL.pptx
Center Enamel A Strategic Partner for the Modernization of Georgia's Chemical...
THE COMPLETE GUIDE TO BUILDING PASSIVE INCOME ONLINE
BUSINESS CYCLE_INFLATION AND UNEMPLOYMENT.pptx
HQ #118 / 'Building Resilience While Climbing the Event Mountain
1911 Gold Corporate Presentation Aug 2025.pdf
interschool scomp.pptxzdkjhdjvdjvdjdhjhieij

Risk and return

  • 1. Van Horne & Wachowicz, © Pearson Education Limited 2004 V - 1 Fundamentals of Financial Management, 12/e Chapter 5: Risk and Return by Gregory A. Kuhlemeyer, Ph.D., Carroll College, Waukesha, WI 5-1 Chapter 5 Risk and Return Risk and Return © Pearson Education Limited 2004 Fundamentals of Financial Management, 12/e Created by: Gregory A. Kuhlemeyer, Ph.D. Carroll College, Waukesha, WI 5-2 Defining ReturnDefining Return Income received on an investment plus any change in market price, usually expressed as a percent of the beginning market price of the investment. Income received on an investment plus any change in market price, usually expressed as a percent of the beginning market price of the investment. Dt + (Pt - Pt-1 ) Pt-1 R =
  • 2. Van Horne & Wachowicz, © Pearson Education Limited 2004 V - 2 Fundamentals of Financial Management, 12/e Chapter 5: Risk and Return by Gregory A. Kuhlemeyer, Ph.D., Carroll College, Waukesha, WI 5-3 Return ExampleReturn Example The stock price for Stock A was $10 per share 1 year ago. The stock is currently trading at $9.50 per share and shareholders just received a $1 dividend. What return was earned over the past year? The stock price for Stock A was $10 per share 1 year ago. The stock is currently trading at $9.50 per share and shareholders just received a $1 dividend. What return was earned over the past year? 5-4 Return ExampleReturn Example The stock price for Stock A was $10 per share 1 year ago. The stock is currently trading at $9.50 per share and shareholders just received a $1 dividend. What return was earned over the past year? The stock price for Stock A was $10 per share 1 year ago. The stock is currently trading at $9.50 per share and shareholders just received a $1 dividend. What return was earned over the past year? $1.00 + ($9.50 - $10.00 ) $10.00R = = 5%
  • 3. Van Horne & Wachowicz, © Pearson Education Limited 2004 V - 3 Fundamentals of Financial Management, 12/e Chapter 5: Risk and Return by Gregory A. Kuhlemeyer, Ph.D., Carroll College, Waukesha, WI 5-5 Defining RiskDefining Risk The variability of returns from those that are expected. The variability of returns from those that are expected. 5-6 Determining Expected Return (Discrete Dist.) Determining Expected Return (Discrete Dist.) R = ΣΣΣΣ ( Ri )( Pi ) R is the expected return for the asset, Ri is the return for the ith possibility, Pi is the probability of that return occurring, n is the total number of possibilities. R = ΣΣΣΣ ( Ri )( Pi ) R is the expected return for the asset, Ri is the return for the ith possibility, Pi is the probability of that return occurring, n is the total number of possibilities. n i=1
  • 4. Van Horne & Wachowicz, © Pearson Education Limited 2004 V - 4 Fundamentals of Financial Management, 12/e Chapter 5: Risk and Return by Gregory A. Kuhlemeyer, Ph.D., Carroll College, Waukesha, WI 5-7 How to Determine the Expected Return and Standard Deviation How to Determine the Expected Return and Standard Deviation Stock BW Ri Pi (Ri)(Pi) -.15 .10 -.015 -.03 .20 -.006 .09 .40 .036 .21 .20 .042 .33 .10 .033 Sum 1.00 .090 Stock BW Ri Pi (Ri)(Pi) -.15 .10 -.015 -.03 .20 -.006 .09 .40 .036 .21 .20 .042 .33 .10 .033 Sum 1.00 .090 The expected return, R, for Stock BW is .09 or 9% 5-8 Determining Standard Deviation (Risk Measure) Determining Standard Deviation (Risk Measure) σσσσ = ΣΣΣΣ ( Ri - R )2( Pi ) Standard Deviation, σσσσ, is a statistical measure of the variability of a distribution around its mean. It is the square root of variance. Note, this is for a discrete distribution. σσσσ = ΣΣΣΣ ( Ri - R )2( Pi ) Standard Deviation, σσσσ, is a statistical measure of the variability of a distribution around its mean. It is the square root of variance. Note, this is for a discrete distribution. n i=1
  • 5. Van Horne & Wachowicz, © Pearson Education Limited 2004 V - 5 Fundamentals of Financial Management, 12/e Chapter 5: Risk and Return by Gregory A. Kuhlemeyer, Ph.D., Carroll College, Waukesha, WI 5-9 How to Determine the Expected Return and Standard Deviation How to Determine the Expected Return and Standard Deviation Stock BW Ri Pi (Ri)(Pi) (Ri - R )2(Pi) -.15 .10 -.015 .00576 -.03 .20 -.006 .00288 .09 .40 .036 .00000 .21 .20 .042 .00288 .33 .10 .033 .00576 Sum 1.00 .090 .01728 Stock BW Ri Pi (Ri)(Pi) (Ri - R )2(Pi) -.15 .10 -.015 .00576 -.03 .20 -.006 .00288 .09 .40 .036 .00000 .21 .20 .042 .00288 .33 .10 .033 .00576 Sum 1.00 .090 .01728 5-10 Determining Standard Deviation (Risk Measure) Determining Standard Deviation (Risk Measure) σσσσ = ΣΣΣΣ ( Ri - R )2( Pi ) σσσσ = .01728 σσσσ = .1315 or 13.15% σσσσ = ΣΣΣΣ ( Ri - R )2( Pi ) σσσσ = .01728 σσσσ = .1315 or 13.15% n i=1
  • 6. Van Horne & Wachowicz, © Pearson Education Limited 2004 V - 6 Fundamentals of Financial Management, 12/e Chapter 5: Risk and Return by Gregory A. Kuhlemeyer, Ph.D., Carroll College, Waukesha, WI 5-11 Coefficient of VariationCoefficient of Variation The ratio of the standard deviation of a distribution to the mean of that distribution. It is a measure of RELATIVE risk. CV = σσσσ / R CV of BW = .1315 / .09 = 1.46 The ratio of the standard deviation of a distribution to the mean of that distribution. It is a measure of RELATIVE risk. CV = σσσσ / R CV of BW = .1315 / .09 = 1.46 5-12 Discrete vs. Continuous Distributions 0 0.05 0.1 0.15 0.2 0.25 0.3 0.35 0.4 -15% -3% 9% 21% 33% Discrete Continuous 0 0.005 0.01 0.015 0.02 0.025 0.03 0.035 -50% -41% -32% -23% -14% -5% 4% 13% 22% 31% 40% 49% 58% 67%
  • 7. Van Horne & Wachowicz, © Pearson Education Limited 2004 V - 7 Fundamentals of Financial Management, 12/e Chapter 5: Risk and Return by Gregory A. Kuhlemeyer, Ph.D., Carroll College, Waukesha, WI 5-13 Certainty Equivalent (CE) is the amount of cash someone would require with certainty at a point in time to make the individual indifferent between that certain amount and an amount expected to be received with risk at the same point in time. Certainty Equivalent (CE) is the amount of cash someone would require with certainty at a point in time to make the individual indifferent between that certain amount and an amount expected to be received with risk at the same point in time. Risk AttitudesRisk Attitudes 5-14 Certainty equivalent > Expected value Risk Preference Certainty equivalent = Expected value Risk Indifference Certainty equivalent < Expected value Risk Aversion Most individuals are Risk Averse. Certainty equivalent > Expected value Risk Preference Certainty equivalent = Expected value Risk Indifference Certainty equivalent < Expected value Risk Aversion Most individuals are Risk Averse. Risk AttitudesRisk Attitudes
  • 8. Van Horne & Wachowicz, © Pearson Education Limited 2004 V - 8 Fundamentals of Financial Management, 12/e Chapter 5: Risk and Return by Gregory A. Kuhlemeyer, Ph.D., Carroll College, Waukesha, WI 5-15 Risk Attitude Example You have the choice between (1) a guaranteed dollar reward or (2) a coin-flip gamble of $100,000 (50% chance) or $0 (50% chance). The expected value of the gamble is $50,000. Mary requires a guaranteed $25,000, or more, to call off the gamble. Raleigh is just as happy to take $50,000 or take the risky gamble. Shannon requires at least $52,000 to call off the gamble. 5-16 What are the Risk Attitude tendencies of each? Risk Attitude ExampleRisk Attitude Example Mary shows “risk aversion” because her “certainty equivalent” < the expected value of the gamble. Raleigh exhibits “risk indifference” because her “certainty equivalent” equals the expected value of the gamble. Shannon reveals a “risk preference” because her “certainty equivalent” > the expected value of the gamble. Mary shows “risk aversion” because her “certainty equivalent” < the expected value of the gamble. Raleigh exhibits “risk indifference” because her “certainty equivalent” equals the expected value of the gamble. Shannon reveals a “risk preference” because her “certainty equivalent” > the expected value of the gamble.
  • 9. Van Horne & Wachowicz, © Pearson Education Limited 2004 V - 9 Fundamentals of Financial Management, 12/e Chapter 5: Risk and Return by Gregory A. Kuhlemeyer, Ph.D., Carroll College, Waukesha, WI 5-17 RP = ΣΣΣΣ ( Wj )( Rj ) RP is the expected return for the portfolio, Wj is the weight (investment proportion) for the jth asset in the portfolio, Rj is the expected return of the jth asset, m is the total number of assets in the portfolio. RP = ΣΣΣΣ ( Wj )( Rj ) RP is the expected return for the portfolio, Wj is the weight (investment proportion) for the jth asset in the portfolio, Rj is the expected return of the jth asset, m is the total number of assets in the portfolio. Determining Portfolio Expected Return Determining Portfolio Expected Return m j=1 5-18 Determining Portfolio Standard Deviation Determining Portfolio Standard Deviation m j=1 m k=1 σσσσP = Σ ΣΣ ΣΣ ΣΣ Σ Wj Wk σσσσjk Wj is the weight (investment proportion) for the jth asset in the portfolio, Wk is the weight (investment proportion) for the kth asset in the portfolio, σσσσjk is the covariance between returns for the jth and kth assets in the portfolio. σσσσP = Σ ΣΣ ΣΣ ΣΣ Σ Wj Wk σσσσjk Wj is the weight (investment proportion) for the jth asset in the portfolio, Wk is the weight (investment proportion) for the kth asset in the portfolio, σσσσjk is the covariance between returns for the jth and kth assets in the portfolio.
  • 10. Van Horne & Wachowicz, © Pearson Education Limited 2004 V - 10 Fundamentals of Financial Management, 12/e Chapter 5: Risk and Return by Gregory A. Kuhlemeyer, Ph.D., Carroll College, Waukesha, WI 5-19 Combining securities that are not perfectly, positively correlated reduces risk. Combining securities that are not perfectly, positively correlated reduces risk. Risk and DiversificationRisk and DiversificationINVESTMENTRETURN TIME TIMETIME SECURITY E SECURITY F Combination E and F 5-20 Systematic Risk is the variability of return on stocks or portfolios associated with changes in return on the market as a whole. Unsystematic Risk is the variability of return on stocks or portfolios not explained by general market movements. It is avoidable through diversification. Systematic Risk is the variability of return on stocks or portfolios associated with changes in return on the market as a whole. Unsystematic Risk is the variability of return on stocks or portfolios not explained by general market movements. It is avoidable through diversification. Total Risk = Systematic Risk + Unsystematic Risk Total Risk = Systematic Risk + Unsystematic Risk Total Risk = Systematic Risk + Unsystematic Risk
  • 11. Van Horne & Wachowicz, © Pearson Education Limited 2004 V - 11 Fundamentals of Financial Management, 12/e Chapter 5: Risk and Return by Gregory A. Kuhlemeyer, Ph.D., Carroll College, Waukesha, WI 5-21 Total Risk = Systematic Risk + Unsystematic Risk Total Risk = Systematic Risk + Unsystematic Risk Total Risk Unsystematic risk Systematic risk STDDEVOFPORTFOLIORETURN NUMBER OF SECURITIES IN THE PORTFOLIO Factors such as changes in nation’s economy, tax reform by the Congress, or a change in the world situation. 5-22 Total Risk = Systematic Risk + Unsystematic Risk Total Risk = Systematic Risk + Unsystematic Risk Total Risk Unsystematic risk Systematic risk STDDEVOFPORTFOLIORETURN NUMBER OF SECURITIES IN THE PORTFOLIO Factors unique to a particular company or industry. For example, the death of a key executive or loss of a governmental defense contract.
  • 12. Van Horne & Wachowicz, © Pearson Education Limited 2004 V - 12 Fundamentals of Financial Management, 12/e Chapter 5: Risk and Return by Gregory A. Kuhlemeyer, Ph.D., Carroll College, Waukesha, WI 5-23 CAPM is a model that describes the relationship between risk and expected (required) return; in this model, a security’s expected (required) return is the risk-free rate plus a premium based on the systematic risk of the security. CAPM is a model that describes the relationship between risk and expected (required) return; in this model, a security’s expected (required) return is the risk-free rate plus a premium based on the systematic risk of the security. Capital Asset Pricing Model (CAPM) Capital Asset Pricing Model (CAPM) 5-24 1. Capital markets are efficient. 2. Homogeneous investor expectations over a given period. 3. Risk-free asset return is certain (use short- to intermediate-term Treasuries as a proxy). 4. Market portfolio contains only systematic risk (use S&P 500 Index or similar as a proxy). 1. Capital markets are efficient. 2. Homogeneous investor expectations over a given period. 3. Risk-free asset return is certain (use short- to intermediate-term Treasuries as a proxy). 4. Market portfolio contains only systematic risk (use S&P 500 Index or similar as a proxy). CAPM AssumptionsCAPM Assumptions
  • 13. Van Horne & Wachowicz, © Pearson Education Limited 2004 V - 13 Fundamentals of Financial Management, 12/e Chapter 5: Risk and Return by Gregory A. Kuhlemeyer, Ph.D., Carroll College, Waukesha, WI 5-25 Characteristic LineCharacteristic Line EXCESS RETURN ON STOCK EXCESS RETURN ON MARKET PORTFOLIO Narrower spread is higher correlation Characteristic Line 5-26 Calculating “Beta” Time Pd. Market My Stock 1 9.6% 12% 2 -15.4% -5% 3 26.7% 19% 4 -.2% 3% 5 20.9% 13% 6 28.3% 14% 7 -5.9% -9% 8 3.3% -1% 9 12.2% 12% 10 10.5% 10% The Market and My Stock returns are “excess returns” and have the riskless rate already subtracted.
  • 14. Van Horne & Wachowicz, © Pearson Education Limited 2004 V - 14 Fundamentals of Financial Management, 12/e Chapter 5: Risk and Return by Gregory A. Kuhlemeyer, Ph.D., Carroll College, Waukesha, WI 5-27 Calculating “Beta” Enter the excess market returns as “X” observations of: 9.6%, -15.4%, 26.7%, -0.2%, 20.9%, 28.3%, -5.9%, 3.3%, 12.2%, and 10.5%. Enter the excess stock returns as “Y” observations of: 12%, -5%, 19%, 3%, 13%, 14%, -9%, -1%, 12%, and 10%. 5-28 Calculating “Beta” The regression equation is Y=a+bX. Thus, our characteristic line is Y = 1.4448 + 0.595 X and indicates that our stock has a beta of 0.595.
  • 15. Van Horne & Wachowicz, © Pearson Education Limited 2004 V - 15 Fundamentals of Financial Management, 12/e Chapter 5: Risk and Return by Gregory A. Kuhlemeyer, Ph.D., Carroll College, Waukesha, WI 5-29 An index of systematic risk. It measures the sensitivity of a stock’s returns to changes in returns on the market portfolio. The beta for a portfolio is simply a weighted average of the individual stock betas in the portfolio. An index of systematic risk. It measures the sensitivity of a stock’s returns to changes in returns on the market portfolio. The beta for a portfolio is simply a weighted average of the individual stock betas in the portfolio. What is Beta?What is Beta? 5-30 Characteristic Lines and Different Betas Characteristic Lines and Different Betas EXCESS RETURN ON STOCK EXCESS RETURN ON MARKET PORTFOLIO Beta < 1 (defensive) Beta = 1 Beta > 1 (aggressive) Each characteristic line has a different slope.
  • 16. Van Horne & Wachowicz, © Pearson Education Limited 2004 V - 16 Fundamentals of Financial Management, 12/e Chapter 5: Risk and Return by Gregory A. Kuhlemeyer, Ph.D., Carroll College, Waukesha, WI 5-31 Rj is the required rate of return for stock j, Rf is the risk-free rate of return, ββββj is the beta of stock j (measures systematic risk of stock j), RM is the expected return for the market portfolio. Rj is the required rate of return for stock j, Rf is the risk-free rate of return, ββββj is the beta of stock j (measures systematic risk of stock j), RM is the expected return for the market portfolio. Security Market LineSecurity Market Line Rj = Rf + ββββj(RM - Rf) 5-32 Security Market LineSecurity Market Line Rj = Rf + ββββj(RM - Rf) ββββM = 1.0 Systematic Risk (Beta) Rf RM RequiredReturn Risk Premium Risk-free Return
  • 17. Van Horne & Wachowicz, © Pearson Education Limited 2004 V - 17 Fundamentals of Financial Management, 12/e Chapter 5: Risk and Return by Gregory A. Kuhlemeyer, Ph.D., Carroll College, Waukesha, WI 5-33 Security Market Line (Obtaining information for the model) Security Market Line (Obtaining information for the model) Obtaining Betas Can use historical data if past best represents the expectations of the future Can also utilize services like Value Line, Ibbotson Associates, etc. Obtaining Betas Can use historical data if past best represents the expectations of the future Can also utilize services like Value Line, Ibbotson Associates, etc. 5-34 Adjusted Market return and Risk free rate One may use past for obtaining market return and risk free rate but only if past is a good proxy. Direct estimate of the risk free rate by looking up the current rate of return on an appropriate security. Using forecasts for market return estimated by thesecurity analysts, economists and others who regularly predict such returns. Security Market Line (Obtaining information for the model) Security Market Line (Obtaining information for the model)
  • 18. Van Horne & Wachowicz, © Pearson Education Limited 2004 V - 18 Fundamentals of Financial Management, 12/e Chapter 5: Risk and Return by Gregory A. Kuhlemeyer, Ph.D., Carroll College, Waukesha, WI 5-35 Lisa Miller at Basket Wonders is attempting to determine the rate of return required by their stock investors. Lisa is using a 6% Rf and a long-term market expected rate of return of 10%. A stock analyst following the firm has calculated that the firm beta is 1.2. What is the required rate of return on the stock of Basket Wonders? Lisa Miller at Basket Wonders is attempting to determine the rate of return required by their stock investors. Lisa is using a 6% Rf and a long-term market expected rate of return of 10%. A stock analyst following the firm has calculated that the firm beta is 1.2. What is the required rate of return on the stock of Basket Wonders? Determination of the Required Rate of Return Determination of the Required Rate of Return 5-36 RBW = Rf + ββββj(RM - Rf) RBW = 6% + 1.2(10% - 6%) RBW = 10.8% The required rate of return exceeds the market rate of return as BW’s beta exceeds the market beta (1.0). RBW = Rf + ββββj(RM - Rf) RBW = 6% + 1.2(10% - 6%) RBW = 10.8% The required rate of return exceeds the market rate of return as BW’s beta exceeds the market beta (1.0). BWs Required Rate of Return BWs Required Rate of Return
  • 19. Van Horne & Wachowicz, © Pearson Education Limited 2004 V - 19 Fundamentals of Financial Management, 12/e Chapter 5: Risk and Return by Gregory A. Kuhlemeyer, Ph.D., Carroll College, Waukesha, WI 5-37 Lisa Miller at BW is also attempting to determine the intrinsic value of the stock. She is using the constant growth model. Lisa estimates that the dividend next period will be $0.50 and that BW will grow at a constant rate of 5.8%. The stock is currently selling for $15. What is the intrinsic value of the stock? Is the stock over or underpriced? Lisa Miller at BW is also attempting to determine the intrinsic value of the stock. She is using the constant growth model. Lisa estimates that the dividend next period will be $0.50 and that BW will grow at a constant rate of 5.8%. The stock is currently selling for $15. What is the intrinsic value of the stock? Is the stock over or underpriced? Determination of the Intrinsic Value of BW Determination of the Intrinsic Value of BW 5-38 The stock is OVERVALUED as the market price ($15) exceeds the intrinsic value ($10). The stock is OVERVALUED as the market price ($15) exceeds the intrinsic value ($10). Determination of the Intrinsic Value of BW Determination of the Intrinsic Value of BW $0.50 10.8% - 5.8% Intrinsic Value = = $10
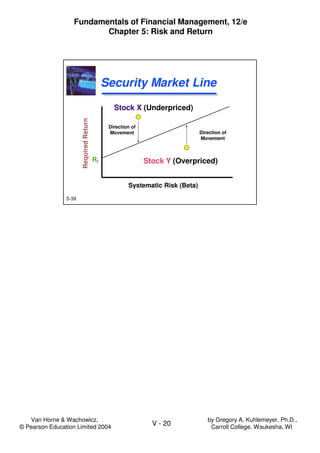
  • 20. Van Horne & Wachowicz, © Pearson Education Limited 2004 V - 20 Fundamentals of Financial Management, 12/e Chapter 5: Risk and Return by Gregory A. Kuhlemeyer, Ph.D., Carroll College, Waukesha, WI 5-39 Security Market LineSecurity Market Line Systematic Risk (Beta) Rf RequiredReturn Direction of Movement Direction of Movement Stock Y (Overpriced) Stock X (Underpriced)