SETTLING TANKS
• THEORY
• OPERATION
• DESIGN
THEORY
• Also referred as ‘SEDIMENTATION TANKS’.
• Settling- process by which particulates settle to the bottom of
a liquid and form a sediment.
• Particles experience a force, either due to gravity or due to
centrifugal motion; tend to move in a uniform manner in the
direction exerted by that force.
• Gravity settling- the particles will tend to fall to the bottom of
the vessel, forming a slurry at the vessel base.
• For dilute particle solutions, two main forces enacting upon
particle. Primary force is an applied force, such as gravity, and
a drag force that is due to the motion of the particle through
the fluid. The applied force is not affected by the particle's
velocity; the drag force is a function of the particle velocity.
Settling or Sedimentation
• Settling- a unit operation in which solids are drawn toward a
source of attraction. The particular type of settling that will be
discussed in this section is gravitational settling. It should be
noted that settling is different from sedimentation.
• Sedimentation- The condition whereby the solids are already
at the bottom and in the process of sedimenting. Settling is not
yet sedimenting, but the particles are falling down the water
column in response to gravity. Of course, as soon as the solids
reach the bottom, they begin sedimenting. In the physical
treatment of water and wastewater, settling is normally carried
out in settling or sedimentation basins.
Recirculating Aquaculture Systems Short
Course
Removal Mechanisms
Gravity separation
 Settling tanks, tube settlers and hydro cyclones
Filtration
 Screen, Granular media, or porous media filter
Flotation
 Foam Fractionation
Recirculating Aquaculture Systems Short
Course
Settling Basins
Advantages
• Simplest technologies
• Little energy input
• Relatively inexpensive to install and operate
• No specialized operational skills
• Easily incorporated into new or existing facilities



18
D
)
(
g
V
2
p
p
s


Disadvantages
• Low hydraulic loading rates
• Poor removal of small suspended solids
• Large floor space requirements
• Re-suspension of solids and leeching
Recirculating Aquaculture Systems Short
Course
Solids Physical Characteristics
• particle specific gravity
• particle size distribution
Two most important physical
characteristics of suspended solids:
DESIGN
In specifying a water and wastewater sedimentation tank size, the major features to be
considered are:
- tank cross sectional area,
- tank depth,
and type of cleaning mechanism used.
In specifying a design basis for water and wastewater sedimentation tanks; three
conditions are commonly considered:
- solid handling capacity (kg/day),
- overflow rate (lpm/m2),
- detention time.
Additional design data required to ascertain mechanical construction, specific gravity
of solids, size distribution of solids, underflow construction, operating temperature,
and geographical location. Typical dimensions of sedimentation tanks are given in
Table 1.
Recirculating Aquaculture Systems Short
Course
Sedimentation
Stokes Law
• Denser and large particles have a
higher settling velocity



18
D
)
(
g
V
2
p
p
s





18
)
( 2
p
p
s
D
g
V


Recirculating Aquaculture Systems Short
Course
Settling Basins
• Design to minimize turbulence:
chamfered weir
to enhance laminar flow
(85% of water depth)
full-width
weir
inlet outlet
effective settling zone
1–2 m
length:width = 4:1 to 8:1
sludge zone
Recirculating Aquaculture Systems Short
Course
Settling Basins
• Overflow rates are used for design: Vo
)
(
)
/
(
2
3
m
area
surface
settling
s
m
Rate
Flow
Rate
Overflow 
settling surface area = length x width
width
length
flow flow
Recirculating Aquaculture Systems Short
Course
Settling Basin Design
"Rule of Thumb"
Settling Basin Design
 basin floor area of 41 Lpm per m2 of flow.
 250 to 410 Lpm per m width of weir for outflow.
 submerge inlet weir 15% of basin water depth.
 use 25 cm wide weirs and use rounded edges .
 maximize length of settling chamber as much as possible.
Settling (Sedimentation)
Settling Tanks, Basins, or Clarifiers
Generally, two types of sedimentation basins (also called tanks,
or clarifiers) are used:
Rectangular and
Circular.
Rectangular settling, basins or clarifiers, are basins that are
rectangular in plans and cross sections. In plan, the length
may vary from two to four times the width.
The length may also vary from ten to 20 times the depth. The
depth of the basin may vary from 2 to 6 m. The influent is
introduced at one end and allowed to flow through the length
of the clarifier toward the other end.
Circular Basin Rectangular Basin
Basin Model
Settling Model
Vs = settling velocity of the particle
Vl = horizontal velocity of liquid flow
A particle that is just removed has a settling velocity v0.
This trajectory represents a particle which
has a settling velocity v0
v0 = h / t = Q / A
Where: t = V/Q
A = surface area of the basin
Critical Settling Velocity and Overflow Rate
v0 expressed in units of velocity (ft/s) is the critical settling velocity
Critical settling velocity is the settling velocity of particles which are
100% removed in the basin
v0 expressed in units of flow per unit area is called the
Overflow rate
As you can see the only difference between the critical settling
velocity and the overflow rate is the type of unit used to express
the number
The critical settling velocity and the overflow rate are the same
number, but proper units should be used to express each
Since smaller particles have lower settling velocities, if you want to
remove smaller particles in the settling basin you have to have a
lower overflow rate.
Since v0 = Q/A, to have a smaller v0 you have to have a larger area
(a bigger basin removes smaller particles)
Table 1 Typical Dimensions of Sedimentation
Tanks
______________________________________________________
Description Dimensions
Range Typical
______________________________________________________
Rectangular
Depth, m 3-5 3.5
Length, m 15-90 25-40
Width, m 3-24 6-10
Circular
Diameter, m 4-60 12-45
Depth, m 3-5 4.5
Bottom Slope, mm/m 60-160 80
______________________________________________________
Example 1
A water treatment plant has a flow rate of 0.6 m3/sec. The settling basin at the
plant has an effective settling volume that is 20 m long, 3 m tall and 6 m wide.
Will particles that have a settling velocity of 0.004 m/sec be completely
removed? If not, what percent of the particles will be removed?
v0 = Q/A = 0.6 m/sec / (20 m x 6 m) = 0.005 m/sec
Since v0 is greater than the settling velocity of the particle of interest,
they will not be completely removed.
The percent of particles which will be removed may be found using the
following formula:
Percent removed = (vp / v0) 100
= (0.004/0.005) 100 = 80 %
Example 2
How big would the basin need to be to remove 100% of the particles that
have a settling velocity of 0.004 m/sec?
v0 = Q / A
0.004 = 0.6 / A
A = 150 m3
If the basin keeps the same width (6 m):
A = 150 m3 = 6m x L
L = 25 m
Example 3
SETTLING TANKS PPT.ppt
Sludge zone
Length, L
Water Level
Particle trajectory
Settling zone
Sludge
zone
depth
Free
Board
Side
Water
Depth
H
0
Flocculant Settling OR Type II Settling;
Particle Trejectory
D
H
H0
0.5 m
Port 1 to 7
D= 15-20 cm
H= 2-4 m
H0= Design side water depth
Example
• Example Batch Settling test results reduction analysis for sample port no. 1
• Plot a grid showing percent TSS removal at each port at different time intervals
• Draw lines of equal % removal (isoremoval). These lines are drawn similarly to contour lines.
• Draw vertical line at each point an iso removal line intersects the x-axis (3.5 m depth). List
the observations
Time, min TSS removed, mg/l Removal efficiency, %
0 200 0 ?
10 134 66 ?
20 75 125 ?
30 51 149 ?
40 20 180 ?
• Observations
• For example, the R=60% isoremoval curve
intercept the x-axis at 38 minutes. The 60%
settling time t is therefore 38 min.
• 90% of the particles have settled 0.51 m or
more.
• 80% of the particles have settled 0.72 m or
more
• Likewise, 70 % and 60% of the particles have
settled 1.01 m, and 3.50 m or more
respectively.
Port
No.
Dept
h, m
Sampling time, min
10 20 30 40 50 60 70 80 90
1 0.5 33 62 74 90
2 1.0 21 41 65 71 80 89 90
3 1.5 16 36 59 67 74 81 86 91
4 2.0 17 33 56 64 71 78 82 88 91
5 2.5 14 32 54 64 70 78 82 85 88
6 3.0 14 30 52 63 69 75 81 83 85
7 3.5 12 30 51 60 69 74 80 83 84

More Related Content

PPTX
Types of sedimentation tank
PPTX
Reservoir sedimentation & its control
PPTX
Treatment of Water and Design Example on Sedimentation Tank
PDF
Ground water flow to wells
PPTX
Plain sedimentation
PPTX
Design of Canal (Kennedy & Lacey Theory) & Diversion Headwork
PPTX
Stream Gauging
PPTX
Coagulation and flocculation
Types of sedimentation tank
Reservoir sedimentation & its control
Treatment of Water and Design Example on Sedimentation Tank
Ground water flow to wells
Plain sedimentation
Design of Canal (Kennedy & Lacey Theory) & Diversion Headwork
Stream Gauging
Coagulation and flocculation

What's hot (20)

PPT
Types of earth dams
PPTX
PPTX
Sludge thickening and stabilization processes
PPTX
Spillway and its types
PDF
Presentation on notches and weirs
PPTX
Evaporation measurement device
PDF
Plain sedimentation
PPTX
Chapter 4.pptx
PDF
Sedimentation
PPTX
Sedimentation Tanks: Design and Working
PDF
L 10 sedimentation
PPT
CONVEYORS.ppt
PPTX
ARTIFICIAL RECHARGE OF GROUNDWATER
PDF
13. Canal Outlets & other Head Regulators.pdf
PDF
L 17 coagulation and flocculation
PDF
gravity dam elementary profile.pdf
PPTX
Sedimentation tanks in water treatment
PDF
Creep of Rails.pdf
PPT
Iron and Manganese Removal
PPTX
Water Treatment Process (Screening)
Types of earth dams
Sludge thickening and stabilization processes
Spillway and its types
Presentation on notches and weirs
Evaporation measurement device
Plain sedimentation
Chapter 4.pptx
Sedimentation
Sedimentation Tanks: Design and Working
L 10 sedimentation
CONVEYORS.ppt
ARTIFICIAL RECHARGE OF GROUNDWATER
13. Canal Outlets & other Head Regulators.pdf
L 17 coagulation and flocculation
gravity dam elementary profile.pdf
Sedimentation tanks in water treatment
Creep of Rails.pdf
Iron and Manganese Removal
Water Treatment Process (Screening)
Ad

Similar to SETTLING TANKS PPT.ppt (20)

PPTX
Sedimentation ( Settling ) Defination, Types, Design
PPTX
A Lecture notes on Sedimentation a perspective
PPTX
Coagulation and flocculation
PPTX
sedimentation
PPTX
Batch sedimentation, clarifiers
PPT
Treatment of water
PPTX
C-3_Sedimentation process of water treatment
PPT
Episode 44 : Flow Behavior of Granular Materials and Powders Part III
PPT
UNIT -II Treatment of water- aeration and sedimentation.ppt
PPT
15 secondary sedimentation
PDF
Unit III Quality and Treatment
PPTX
SEDIMENTATION
PDF
dewatering, hydrometallurgy and plant flowsheet of aluminium extraction mine...
PDF
Plain sedimentation tanks ,Types & Design considerations
PPT
sedimentation for Engineers
PPTX
UNIT-II-IWM.pptx
PPTX
UNIT-2-WASTE WATER TREATMENT PROCESSES.pptx
PPTX
Wwwe
PPT
Water treatment
Sedimentation ( Settling ) Defination, Types, Design
A Lecture notes on Sedimentation a perspective
Coagulation and flocculation
sedimentation
Batch sedimentation, clarifiers
Treatment of water
C-3_Sedimentation process of water treatment
Episode 44 : Flow Behavior of Granular Materials and Powders Part III
UNIT -II Treatment of water- aeration and sedimentation.ppt
15 secondary sedimentation
Unit III Quality and Treatment
SEDIMENTATION
dewatering, hydrometallurgy and plant flowsheet of aluminium extraction mine...
Plain sedimentation tanks ,Types & Design considerations
sedimentation for Engineers
UNIT-II-IWM.pptx
UNIT-2-WASTE WATER TREATMENT PROCESSES.pptx
Wwwe
Water treatment
Ad

Recently uploaded (20)

PDF
August 2025 - Top 10 Read Articles in Network Security & Its Applications
PPTX
Graph Data Structures with Types, Traversals, Connectivity, and Real-Life App...
PDF
22EC502-MICROCONTROLLER AND INTERFACING-8051 MICROCONTROLLER.pdf
PPTX
Module 8- Technological and Communication Skills.pptx
PPTX
Feature types and data preprocessing steps
PPT
INTRODUCTION -Data Warehousing and Mining-M.Tech- VTU.ppt
PDF
Design Guidelines and solutions for Plastics parts
PPTX
Amdahl’s law is explained in the above power point presentations
PDF
Human-AI Collaboration: Balancing Agentic AI and Autonomy in Hybrid Systems
PDF
ChapteR012372321DFGDSFGDFGDFSGDFGDFGDFGSDFGDFGFD
PDF
Visual Aids for Exploratory Data Analysis.pdf
PPTX
Current and future trends in Computer Vision.pptx
PDF
BIO-INSPIRED ARCHITECTURE FOR PARSIMONIOUS CONVERSATIONAL INTELLIGENCE : THE ...
PDF
UNIT no 1 INTRODUCTION TO DBMS NOTES.pdf
PPTX
Fundamentals of safety and accident prevention -final (1).pptx
PDF
PREDICTION OF DIABETES FROM ELECTRONIC HEALTH RECORDS
PDF
SMART SIGNAL TIMING FOR URBAN INTERSECTIONS USING REAL-TIME VEHICLE DETECTI...
PDF
EXPLORING LEARNING ENGAGEMENT FACTORS INFLUENCING BEHAVIORAL, COGNITIVE, AND ...
PPT
Total quality management ppt for engineering students
PPTX
6ME3A-Unit-II-Sensors and Actuators_Handouts.pptx
August 2025 - Top 10 Read Articles in Network Security & Its Applications
Graph Data Structures with Types, Traversals, Connectivity, and Real-Life App...
22EC502-MICROCONTROLLER AND INTERFACING-8051 MICROCONTROLLER.pdf
Module 8- Technological and Communication Skills.pptx
Feature types and data preprocessing steps
INTRODUCTION -Data Warehousing and Mining-M.Tech- VTU.ppt
Design Guidelines and solutions for Plastics parts
Amdahl’s law is explained in the above power point presentations
Human-AI Collaboration: Balancing Agentic AI and Autonomy in Hybrid Systems
ChapteR012372321DFGDSFGDFGDFSGDFGDFGDFGSDFGDFGFD
Visual Aids for Exploratory Data Analysis.pdf
Current and future trends in Computer Vision.pptx
BIO-INSPIRED ARCHITECTURE FOR PARSIMONIOUS CONVERSATIONAL INTELLIGENCE : THE ...
UNIT no 1 INTRODUCTION TO DBMS NOTES.pdf
Fundamentals of safety and accident prevention -final (1).pptx
PREDICTION OF DIABETES FROM ELECTRONIC HEALTH RECORDS
SMART SIGNAL TIMING FOR URBAN INTERSECTIONS USING REAL-TIME VEHICLE DETECTI...
EXPLORING LEARNING ENGAGEMENT FACTORS INFLUENCING BEHAVIORAL, COGNITIVE, AND ...
Total quality management ppt for engineering students
6ME3A-Unit-II-Sensors and Actuators_Handouts.pptx

SETTLING TANKS PPT.ppt

  • 3. THEORY • Also referred as ‘SEDIMENTATION TANKS’. • Settling- process by which particulates settle to the bottom of a liquid and form a sediment. • Particles experience a force, either due to gravity or due to centrifugal motion; tend to move in a uniform manner in the direction exerted by that force. • Gravity settling- the particles will tend to fall to the bottom of the vessel, forming a slurry at the vessel base. • For dilute particle solutions, two main forces enacting upon particle. Primary force is an applied force, such as gravity, and a drag force that is due to the motion of the particle through the fluid. The applied force is not affected by the particle's velocity; the drag force is a function of the particle velocity.
  • 4. Settling or Sedimentation • Settling- a unit operation in which solids are drawn toward a source of attraction. The particular type of settling that will be discussed in this section is gravitational settling. It should be noted that settling is different from sedimentation. • Sedimentation- The condition whereby the solids are already at the bottom and in the process of sedimenting. Settling is not yet sedimenting, but the particles are falling down the water column in response to gravity. Of course, as soon as the solids reach the bottom, they begin sedimenting. In the physical treatment of water and wastewater, settling is normally carried out in settling or sedimentation basins.
  • 5. Recirculating Aquaculture Systems Short Course Removal Mechanisms Gravity separation  Settling tanks, tube settlers and hydro cyclones Filtration  Screen, Granular media, or porous media filter Flotation  Foam Fractionation
  • 6. Recirculating Aquaculture Systems Short Course Settling Basins Advantages • Simplest technologies • Little energy input • Relatively inexpensive to install and operate • No specialized operational skills • Easily incorporated into new or existing facilities    18 D ) ( g V 2 p p s   Disadvantages • Low hydraulic loading rates • Poor removal of small suspended solids • Large floor space requirements • Re-suspension of solids and leeching
  • 7. Recirculating Aquaculture Systems Short Course Solids Physical Characteristics • particle specific gravity • particle size distribution Two most important physical characteristics of suspended solids:
  • 8. DESIGN In specifying a water and wastewater sedimentation tank size, the major features to be considered are: - tank cross sectional area, - tank depth, and type of cleaning mechanism used. In specifying a design basis for water and wastewater sedimentation tanks; three conditions are commonly considered: - solid handling capacity (kg/day), - overflow rate (lpm/m2), - detention time. Additional design data required to ascertain mechanical construction, specific gravity of solids, size distribution of solids, underflow construction, operating temperature, and geographical location. Typical dimensions of sedimentation tanks are given in Table 1.
  • 9. Recirculating Aquaculture Systems Short Course Sedimentation Stokes Law • Denser and large particles have a higher settling velocity    18 D ) ( g V 2 p p s      18 ) ( 2 p p s D g V  
  • 10. Recirculating Aquaculture Systems Short Course Settling Basins • Design to minimize turbulence: chamfered weir to enhance laminar flow (85% of water depth) full-width weir inlet outlet effective settling zone 1–2 m length:width = 4:1 to 8:1 sludge zone
  • 11. Recirculating Aquaculture Systems Short Course Settling Basins • Overflow rates are used for design: Vo ) ( ) / ( 2 3 m area surface settling s m Rate Flow Rate Overflow  settling surface area = length x width width length flow flow
  • 12. Recirculating Aquaculture Systems Short Course Settling Basin Design "Rule of Thumb" Settling Basin Design  basin floor area of 41 Lpm per m2 of flow.  250 to 410 Lpm per m width of weir for outflow.  submerge inlet weir 15% of basin water depth.  use 25 cm wide weirs and use rounded edges .  maximize length of settling chamber as much as possible.
  • 14. Settling Tanks, Basins, or Clarifiers Generally, two types of sedimentation basins (also called tanks, or clarifiers) are used: Rectangular and Circular. Rectangular settling, basins or clarifiers, are basins that are rectangular in plans and cross sections. In plan, the length may vary from two to four times the width. The length may also vary from ten to 20 times the depth. The depth of the basin may vary from 2 to 6 m. The influent is introduced at one end and allowed to flow through the length of the clarifier toward the other end.
  • 17. Settling Model Vs = settling velocity of the particle Vl = horizontal velocity of liquid flow
  • 18. A particle that is just removed has a settling velocity v0. This trajectory represents a particle which has a settling velocity v0 v0 = h / t = Q / A Where: t = V/Q A = surface area of the basin
  • 19. Critical Settling Velocity and Overflow Rate v0 expressed in units of velocity (ft/s) is the critical settling velocity Critical settling velocity is the settling velocity of particles which are 100% removed in the basin v0 expressed in units of flow per unit area is called the Overflow rate
  • 20. As you can see the only difference between the critical settling velocity and the overflow rate is the type of unit used to express the number The critical settling velocity and the overflow rate are the same number, but proper units should be used to express each Since smaller particles have lower settling velocities, if you want to remove smaller particles in the settling basin you have to have a lower overflow rate. Since v0 = Q/A, to have a smaller v0 you have to have a larger area (a bigger basin removes smaller particles)
  • 21. Table 1 Typical Dimensions of Sedimentation Tanks ______________________________________________________ Description Dimensions Range Typical ______________________________________________________ Rectangular Depth, m 3-5 3.5 Length, m 15-90 25-40 Width, m 3-24 6-10 Circular Diameter, m 4-60 12-45 Depth, m 3-5 4.5 Bottom Slope, mm/m 60-160 80 ______________________________________________________
  • 22. Example 1 A water treatment plant has a flow rate of 0.6 m3/sec. The settling basin at the plant has an effective settling volume that is 20 m long, 3 m tall and 6 m wide. Will particles that have a settling velocity of 0.004 m/sec be completely removed? If not, what percent of the particles will be removed? v0 = Q/A = 0.6 m/sec / (20 m x 6 m) = 0.005 m/sec Since v0 is greater than the settling velocity of the particle of interest, they will not be completely removed. The percent of particles which will be removed may be found using the following formula: Percent removed = (vp / v0) 100 = (0.004/0.005) 100 = 80 %
  • 23. Example 2 How big would the basin need to be to remove 100% of the particles that have a settling velocity of 0.004 m/sec? v0 = Q / A 0.004 = 0.6 / A A = 150 m3 If the basin keeps the same width (6 m): A = 150 m3 = 6m x L L = 25 m
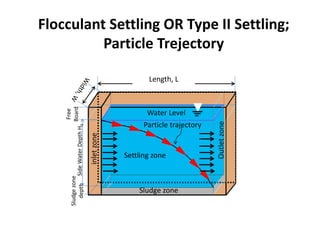
  • 29. Sludge zone Length, L Water Level Particle trajectory Settling zone Sludge zone depth Free Board Side Water Depth H 0 Flocculant Settling OR Type II Settling; Particle Trejectory
  • 30. D H H0 0.5 m Port 1 to 7 D= 15-20 cm H= 2-4 m H0= Design side water depth
  • 31. Example • Example Batch Settling test results reduction analysis for sample port no. 1 • Plot a grid showing percent TSS removal at each port at different time intervals • Draw lines of equal % removal (isoremoval). These lines are drawn similarly to contour lines. • Draw vertical line at each point an iso removal line intersects the x-axis (3.5 m depth). List the observations Time, min TSS removed, mg/l Removal efficiency, % 0 200 0 ? 10 134 66 ? 20 75 125 ? 30 51 149 ? 40 20 180 ?
  • 32. • Observations • For example, the R=60% isoremoval curve intercept the x-axis at 38 minutes. The 60% settling time t is therefore 38 min. • 90% of the particles have settled 0.51 m or more. • 80% of the particles have settled 0.72 m or more • Likewise, 70 % and 60% of the particles have settled 1.01 m, and 3.50 m or more respectively.
  • 33. Port No. Dept h, m Sampling time, min 10 20 30 40 50 60 70 80 90 1 0.5 33 62 74 90 2 1.0 21 41 65 71 80 89 90 3 1.5 16 36 59 67 74 81 86 91 4 2.0 17 33 56 64 71 78 82 88 91 5 2.5 14 32 54 64 70 78 82 85 88 6 3.0 14 30 52 63 69 75 81 83 85 7 3.5 12 30 51 60 69 74 80 83 84