SlideShare a Scribd company logo
SKEWNESS
&
KURTOSIS
Concept of Skewness
A distribution is said to be skewed-when the mean, median and mode fall at
different position in the distribution and the balance (or center of gravity) is
shifted to one side or the other i.e. to the left or to the right.
Therefore, the concept of skewness helps us to understand the
relationship between three measures-
• Mean.
• Median.
• Mode.
Symmetrical Distribution
• A frequency distribution is said to be symmetrical if the frequencies
are equally distributed on both the sides of central value.
• A symmetrical distribution may be either bell – shaped or U shaped.
• In symmetrical distribution, the values of mean, median and mode are
equal i.e. Mean=Median=Mode
Skewed Distribution
• A frequency distribution is said to be skewed if the frequencies are not
equally distributed on both the sides of the central value.
• A skewed distribution maybe-
• Positively Skewed
• Negatively Skewed
Skewed Distribution
• Negatively Skewed
• In this, the distribution is skewed
to the left (negative)
• Here, Mode exceeds Mean and
Median.
• Positively Skewed
• In this, the distribution is skewed
to the right (positive)
• Here, Mean exceeds Mode and
Median.
Mean<Median<Mode Mode<Median<Mean
Tests of Skewness
In order to ascertain whether a distribution is skewed or not the following
tests may be applied. Skewness is present if:
•The values of mean, median and mode do not coincide.
•When the data are plotted on a graph they do not give the normal bell shaped
form i.e. when cut along a vertical line through the center the two halves are not
equal.
•The sum of the positive deviations from the median is not equal to the sum of
the negative deviations.
•Quartiles are not equidistant from the median.
•Frequencies are not equally distributed at points of equal deviation from the
Graphical Measures of Skewness
• Measures of skewness help us to know to what degree and in which direction (positive or negative)
the frequency distribution has a departure from symmetry.
• Positive or negative skewness can be detected graphically (as below) depending on whether the
right tail or the left tail is longer but, we don’t get idea of the magnitude
• Hence some statistical measures are required to find the magnitude of lack of symmetry
Mean=Median=Mode Mean<Median<Mode
Mean> Median> Mode
Symmetrical Skewed to the Left Skewed to the Right
Statistical Measures of Skewness
Absolute Measures of Skewness
Following are the absolute measures of
skewness:
• Skewness (Sk) = Mean – Median
• Skewness (Sk) = Mean – Mode
• Skewness (Sk) = (Q3 - Q2) - (Q2 -
Q1)
Relative Measures of Skewness
There are four measures of skewness:
• β and γ Coefficient of skewness
• Karl Pearson's Coefficient of skewness
• Bowley’s Coefficient of skewness
• Kelly’s Coefficient of skewness
β and γ Coefficient of Skewness
Karl Pearson's Coefficient of Skewness……01
• This method is most frequently used for measuring skewness. The formula
for measuring coefficient of skewness is given by
Where,
SKP = Karl Pearson's Coefficient of skewness,
σ = standard deviation.
SKP = Mean – Mode
σ
Normally, this coefficient of skewness lies between -3 to +3.
In case the mode is indeterminate, the coefficient of skewness is:
Now this formula is equal to
The value of coefficient of skewness is zero, when the distribution is symmetrical.
The value of coefficient of skewness is positive, when the distribution is positively skewed.
The value of coefficient of skewness is negative, when the distribution is negatively skewed.
SKP =
Mean – (3 Median - 2 Mean)
σ
SKP =
3(Mean - Median)
σ
Karl Pearson's Coefficient of Skewness…..02
Bowley’s Coefficient of Skewness……01
Bowley developed a measure of skewness, which is based on quartile values.
The formula for measuring skewness is:
Where,
SKB = Bowley’s Coefficient of skewness,
Q1 = Quartile first Q2 = Quartile second
Q3 = Quartile Third
SKB =
(Q3 – Q2) – (Q2 – Q1)
(Q3 – Q1)
Bowley’s Coefficient of Skewness…..02
The above formula can be converted to-
The value of coefficientof skewnessis zero, if it is a symmetrical distribution.
If the value is greater than zero, it is positively skewed distribution.
And if the value is less than zero, it is negatively skewed distribution.
SKB = Q3 + Q1 – 2Median
(Q3 – Q1)
Kelly’s Coefficient of Skewness…..01
Kelly developed another measure of skewness, which is based on percentiles and
deciles.
The formula for measuring skewness is based on percentile as follows:
Where,
SKK = Kelly’s Coefficient of skewness,
P90
P50
P10
= Percentile Ninety.
= Percentile Fifty.
= Percentile Ten.
SKk =
P10
P90 – 2P50 +
P90 – P10
Kelly’s Coefficient of Skewness…..02
This formula for measuring skewness is based on percentile are as follows:
Where,
SKK = Kelly’s Coefficient of skewness,
D9 = Deciles Nine.
D5 = Deciles Five. D1 = Deciles one.
SKk = D9 – 2D5 + D1
D9 – D1
Example:
Homework:
• Ques: The following are the marks of 150 students in an examination. Calculate Karl Pearson’s
coefficient of skewness.
Marks No. of Students
0-10 20
10-20 10
20-30 40
30-40 0
40-50 15
50-60 20
60-70 15
70-80 10
80-90 30
Moments:
•In Statistics, moments is used to indicate peculiarities of a frequency
distribution.
•The utility of moments lies in the sense that they indicate different
aspects of a given distribution.
•Thus, by using moments, we can measure the central tendency of a
series, dispersion or variability, skewness and the peakedness of the
curve.
•The moments about the actual arithmetic mean are denoted by μ.
•The first four moments about mean or central moments are following:-
Moments:
Moments around Mean Moments around any Arbitrary No
Conversion formula for Moments
(Mean)
(Variance)
(Skewness)
(Kurtosis)
1st moment:
2nd moment:
3rd moment:
4th moment:
Two important constants calculated from μ2, μ3 and μ4 are:-
β1 (read as beta one) β2 (read as beta two)
Kurtosis
•Kurtosis is another measure of the shape of a frequency curve. It is a Greek word,
which means bulginess.
•While skewness signifies the extent of asymmetry, kurtosis measures the degree of
peakedness of a frequency distribution.
•Karl Pearson classified curves into three types on the basis of the shape of their
peaks. These are:-
•Leptokurtic
•Mesokurtic
•Platykurtic
Kurtosis
• When the peak of a curve becomes
relatively high then that curve is
called Leptokurtic.
• When the curve is flat-topped,
then it is called Platykurtic.
• Since normal curve is neither very
peaked nor very flat topped, so it
is taken as a basis for comparison.
• This normal curve is called
Mesokurtic.
Measure of Kurtosis
• There are two measure of Kurtosis:
• Karl Pearson’s Measures of Kurtosis
• Kelly’s Measure of Kurtosis
Karl Pearson’s Measures of Kurtosis
Formula Result:
Kelly’s Measure of Kurtosis
Formula Result:
Example:
Homework:
• Ques: The first four raw moments of a distribution are 2, 136, 320, and
40,000. Find out coefficients of skewness and kurtosis.

More Related Content

PPTX
Skewness
PPTX
Skewness and kurtosis ppt
PPTX
OUTCOME-BASED EDUCATION OBE.pptx
PDF
Measures of Dispersion
PPT
STEM General Biology 1: The Cells
PDF
Introduction to Statistics
PPTX
FIRSTMANTOCIRCLETHEGLOBE.pptx
PPT
Technology transfer & acquisition
Skewness
Skewness and kurtosis ppt
OUTCOME-BASED EDUCATION OBE.pptx
Measures of Dispersion
STEM General Biology 1: The Cells
Introduction to Statistics
FIRSTMANTOCIRCLETHEGLOBE.pptx
Technology transfer & acquisition

What's hot (20)

PPTX
Skewness and kurtosis
PPT
Measures of dispersion
PPTX
Measurement scales
PPTX
PROBABILITY
PPTX
Histogram
PDF
Standard deviation
PPT
Skewness & Kurtosis
PPTX
Measure of Dispersion in statistics
PPTX
Collection of data
PPTX
Measures of dispersion
PPT
SAMPLING AND SAMPLING ERRORS
PDF
Primary & Secondary Data
PPT
Measures of central tendency
PPTX
Correlation
PPTX
Correlation
PPTX
Basics stat ppt-types of data
PPT
Correlation
PPT
Statistics-Measures of dispersions
PPTX
Analysis of variance
PPTX
Sampling and its types
Skewness and kurtosis
Measures of dispersion
Measurement scales
PROBABILITY
Histogram
Standard deviation
Skewness & Kurtosis
Measure of Dispersion in statistics
Collection of data
Measures of dispersion
SAMPLING AND SAMPLING ERRORS
Primary & Secondary Data
Measures of central tendency
Correlation
Correlation
Basics stat ppt-types of data
Correlation
Statistics-Measures of dispersions
Analysis of variance
Sampling and its types
Ad

Similar to Skewness.ppt (20)

PPT
BS PPT.ppt
PPTX
Skewness and Kurtosis via Graphical Representation.pptx
PPTX
skewness-141018135304-conversion-gate01-converted.pptx
PDF
measures of asymmetry.pdf
PDF
Skewness-and-Kurtosis i-for-finance-and-banking-application-study-material.pdf
PPTX
Moments, Kurtosis N Skewness
PPT
skewness and kurtosis.ppt
PDF
Skewness.pdf
PPTX
Skewness
PPT
Univariant Descriptive Stats.skewness(3).ppt
PPTX
skewness and kurtosis -210108095452.pptx
PDF
Skewness Kurtosis.pdf biostatistics public helath
PPTX
Measure of skewness
PPTX
State presentation2
PDF
Variability, Skewness and Kurtosis in statistics
PPTX
statistics
PPTX
Measures of dispersion 5
PPTX
2. chapter ii(analyz)
PPTX
NORMAL CURVE in biostatistics and application
PPTX
Skew or kurtosis
BS PPT.ppt
Skewness and Kurtosis via Graphical Representation.pptx
skewness-141018135304-conversion-gate01-converted.pptx
measures of asymmetry.pdf
Skewness-and-Kurtosis i-for-finance-and-banking-application-study-material.pdf
Moments, Kurtosis N Skewness
skewness and kurtosis.ppt
Skewness.pdf
Skewness
Univariant Descriptive Stats.skewness(3).ppt
skewness and kurtosis -210108095452.pptx
Skewness Kurtosis.pdf biostatistics public helath
Measure of skewness
State presentation2
Variability, Skewness and Kurtosis in statistics
statistics
Measures of dispersion 5
2. chapter ii(analyz)
NORMAL CURVE in biostatistics and application
Skew or kurtosis
Ad

Recently uploaded (20)

PPTX
CHAPTER IV. MAN AND BIOSPHERE AND ITS TOTALITY.pptx
PPTX
Computer Architecture Input Output Memory.pptx
PDF
Τίμαιος είναι φιλοσοφικός διάλογος του Πλάτωνα
PDF
1.3 FINAL REVISED K-10 PE and Health CG 2023 Grades 4-10 (1).pdf
PDF
FORM 1 BIOLOGY MIND MAPS and their schemes
PPTX
Virtual and Augmented Reality in Current Scenario
PDF
Paper A Mock Exam 9_ Attempt review.pdf.
PDF
Weekly quiz Compilation Jan -July 25.pdf
PDF
Trump Administration's workforce development strategy
PDF
Hazard Identification & Risk Assessment .pdf
PPTX
202450812 BayCHI UCSC-SV 20250812 v17.pptx
PDF
CISA (Certified Information Systems Auditor) Domain-Wise Summary.pdf
PDF
What if we spent less time fighting change, and more time building what’s rig...
PPTX
B.Sc. DS Unit 2 Software Engineering.pptx
PDF
IGGE1 Understanding the Self1234567891011
PDF
RTP_AR_KS1_Tutor's Guide_English [FOR REPRODUCTION].pdf
PPTX
Introduction to Building Materials
PDF
احياء السادس العلمي - الفصل الثالث (التكاثر) منهج متميزين/كلية بغداد/موهوبين
PDF
ChatGPT for Dummies - Pam Baker Ccesa007.pdf
PDF
LDMMIA Reiki Yoga Finals Review Spring Summer
CHAPTER IV. MAN AND BIOSPHERE AND ITS TOTALITY.pptx
Computer Architecture Input Output Memory.pptx
Τίμαιος είναι φιλοσοφικός διάλογος του Πλάτωνα
1.3 FINAL REVISED K-10 PE and Health CG 2023 Grades 4-10 (1).pdf
FORM 1 BIOLOGY MIND MAPS and their schemes
Virtual and Augmented Reality in Current Scenario
Paper A Mock Exam 9_ Attempt review.pdf.
Weekly quiz Compilation Jan -July 25.pdf
Trump Administration's workforce development strategy
Hazard Identification & Risk Assessment .pdf
202450812 BayCHI UCSC-SV 20250812 v17.pptx
CISA (Certified Information Systems Auditor) Domain-Wise Summary.pdf
What if we spent less time fighting change, and more time building what’s rig...
B.Sc. DS Unit 2 Software Engineering.pptx
IGGE1 Understanding the Self1234567891011
RTP_AR_KS1_Tutor's Guide_English [FOR REPRODUCTION].pdf
Introduction to Building Materials
احياء السادس العلمي - الفصل الثالث (التكاثر) منهج متميزين/كلية بغداد/موهوبين
ChatGPT for Dummies - Pam Baker Ccesa007.pdf
LDMMIA Reiki Yoga Finals Review Spring Summer

Skewness.ppt

  • 2. Concept of Skewness A distribution is said to be skewed-when the mean, median and mode fall at different position in the distribution and the balance (or center of gravity) is shifted to one side or the other i.e. to the left or to the right. Therefore, the concept of skewness helps us to understand the relationship between three measures- • Mean. • Median. • Mode.
  • 3. Symmetrical Distribution • A frequency distribution is said to be symmetrical if the frequencies are equally distributed on both the sides of central value. • A symmetrical distribution may be either bell – shaped or U shaped. • In symmetrical distribution, the values of mean, median and mode are equal i.e. Mean=Median=Mode
  • 4. Skewed Distribution • A frequency distribution is said to be skewed if the frequencies are not equally distributed on both the sides of the central value. • A skewed distribution maybe- • Positively Skewed • Negatively Skewed
  • 5. Skewed Distribution • Negatively Skewed • In this, the distribution is skewed to the left (negative) • Here, Mode exceeds Mean and Median. • Positively Skewed • In this, the distribution is skewed to the right (positive) • Here, Mean exceeds Mode and Median. Mean<Median<Mode Mode<Median<Mean
  • 6. Tests of Skewness In order to ascertain whether a distribution is skewed or not the following tests may be applied. Skewness is present if: •The values of mean, median and mode do not coincide. •When the data are plotted on a graph they do not give the normal bell shaped form i.e. when cut along a vertical line through the center the two halves are not equal. •The sum of the positive deviations from the median is not equal to the sum of the negative deviations. •Quartiles are not equidistant from the median. •Frequencies are not equally distributed at points of equal deviation from the
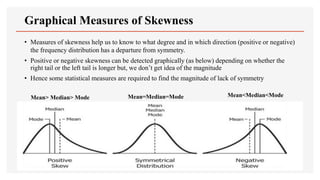
  • 7. Graphical Measures of Skewness • Measures of skewness help us to know to what degree and in which direction (positive or negative) the frequency distribution has a departure from symmetry. • Positive or negative skewness can be detected graphically (as below) depending on whether the right tail or the left tail is longer but, we don’t get idea of the magnitude • Hence some statistical measures are required to find the magnitude of lack of symmetry Mean=Median=Mode Mean<Median<Mode Mean> Median> Mode Symmetrical Skewed to the Left Skewed to the Right
  • 8. Statistical Measures of Skewness Absolute Measures of Skewness Following are the absolute measures of skewness: • Skewness (Sk) = Mean – Median • Skewness (Sk) = Mean – Mode • Skewness (Sk) = (Q3 - Q2) - (Q2 - Q1) Relative Measures of Skewness There are four measures of skewness: • β and γ Coefficient of skewness • Karl Pearson's Coefficient of skewness • Bowley’s Coefficient of skewness • Kelly’s Coefficient of skewness
  • 9. β and γ Coefficient of Skewness
  • 10. Karl Pearson's Coefficient of Skewness……01 • This method is most frequently used for measuring skewness. The formula for measuring coefficient of skewness is given by Where, SKP = Karl Pearson's Coefficient of skewness, σ = standard deviation. SKP = Mean – Mode σ Normally, this coefficient of skewness lies between -3 to +3.
  • 11. In case the mode is indeterminate, the coefficient of skewness is: Now this formula is equal to The value of coefficient of skewness is zero, when the distribution is symmetrical. The value of coefficient of skewness is positive, when the distribution is positively skewed. The value of coefficient of skewness is negative, when the distribution is negatively skewed. SKP = Mean – (3 Median - 2 Mean) σ SKP = 3(Mean - Median) σ Karl Pearson's Coefficient of Skewness…..02
  • 12. Bowley’s Coefficient of Skewness……01 Bowley developed a measure of skewness, which is based on quartile values. The formula for measuring skewness is: Where, SKB = Bowley’s Coefficient of skewness, Q1 = Quartile first Q2 = Quartile second Q3 = Quartile Third SKB = (Q3 – Q2) – (Q2 – Q1) (Q3 – Q1)
  • 13. Bowley’s Coefficient of Skewness…..02 The above formula can be converted to- The value of coefficientof skewnessis zero, if it is a symmetrical distribution. If the value is greater than zero, it is positively skewed distribution. And if the value is less than zero, it is negatively skewed distribution. SKB = Q3 + Q1 – 2Median (Q3 – Q1)
  • 14. Kelly’s Coefficient of Skewness…..01 Kelly developed another measure of skewness, which is based on percentiles and deciles. The formula for measuring skewness is based on percentile as follows: Where, SKK = Kelly’s Coefficient of skewness, P90 P50 P10 = Percentile Ninety. = Percentile Fifty. = Percentile Ten. SKk = P10 P90 – 2P50 + P90 – P10
  • 15. Kelly’s Coefficient of Skewness…..02 This formula for measuring skewness is based on percentile are as follows: Where, SKK = Kelly’s Coefficient of skewness, D9 = Deciles Nine. D5 = Deciles Five. D1 = Deciles one. SKk = D9 – 2D5 + D1 D9 – D1
  • 17. Homework: • Ques: The following are the marks of 150 students in an examination. Calculate Karl Pearson’s coefficient of skewness. Marks No. of Students 0-10 20 10-20 10 20-30 40 30-40 0 40-50 15 50-60 20 60-70 15 70-80 10 80-90 30
  • 18. Moments: •In Statistics, moments is used to indicate peculiarities of a frequency distribution. •The utility of moments lies in the sense that they indicate different aspects of a given distribution. •Thus, by using moments, we can measure the central tendency of a series, dispersion or variability, skewness and the peakedness of the curve. •The moments about the actual arithmetic mean are denoted by μ. •The first four moments about mean or central moments are following:-
  • 19. Moments: Moments around Mean Moments around any Arbitrary No
  • 20. Conversion formula for Moments (Mean) (Variance) (Skewness) (Kurtosis) 1st moment: 2nd moment: 3rd moment: 4th moment:
  • 21. Two important constants calculated from μ2, μ3 and μ4 are:- β1 (read as beta one) β2 (read as beta two)
  • 22. Kurtosis •Kurtosis is another measure of the shape of a frequency curve. It is a Greek word, which means bulginess. •While skewness signifies the extent of asymmetry, kurtosis measures the degree of peakedness of a frequency distribution. •Karl Pearson classified curves into three types on the basis of the shape of their peaks. These are:- •Leptokurtic •Mesokurtic •Platykurtic
  • 23. Kurtosis • When the peak of a curve becomes relatively high then that curve is called Leptokurtic. • When the curve is flat-topped, then it is called Platykurtic. • Since normal curve is neither very peaked nor very flat topped, so it is taken as a basis for comparison. • This normal curve is called Mesokurtic.
  • 24. Measure of Kurtosis • There are two measure of Kurtosis: • Karl Pearson’s Measures of Kurtosis • Kelly’s Measure of Kurtosis
  • 25. Karl Pearson’s Measures of Kurtosis Formula Result:
  • 26. Kelly’s Measure of Kurtosis Formula Result:
  • 28. Homework: • Ques: The first four raw moments of a distribution are 2, 136, 320, and 40,000. Find out coefficients of skewness and kurtosis.

Editor's Notes

  • #6: Mean = 64; Median =64.8 and Mode= 65.2....... Negatively Skewed Mean>Median>Mode.... Positively skewed
  • #11: Mode = 3 Median – 2 Mean
  • #12: If Sk = + or – 3: Perfectly Positively/Negatively Skewed. If Sk = +/- 2 to 2.99 : High degree Positive/Negative skewness If Sk = +/- 1 to 1.99 : Moderate degree Positive/Negative skewness; If Sk = +/- 0.1 to 0.99 : Low degree Positive/Negative skewness