SlideShare a Scribd company logo
Introduction to SPSS
Topics we will cover today
• SPSS at a glance
• Basic Structure of SPSS
• Descriptive Statistics
• The basic analysis in SPSS
Introduction: What is SPSS?
•Originally it is an acronym of Statistical
Package for the Social Science but now it
stands for Statistical Product and Service
Solutions
•One of the most popular statistical
packages which can perform highly
complex data manipulation and analysis
with simple instructions
Example
•Used by e.g. retail and consumer product
companies
•Trying to learn about and describe their
customers' buying habits, gender, age, income
level, etc.
•These companies tailor their marketing and
product development strategies to each
consumer group to increase sales and build
brand loyalty.
•A valuable approach in Market Research, and
SPSS offers some useful tools to facilitate this
commercial process
Basic structure of SPSS
• There are two different windows in SPSS
• 1st
– Data Editor Window - shows data in two forms
• Data view
• Variable view
• 2nd
– Output viewer Window – shows results of data analysis
• *You must save the data editor window and output viewer
window separately. Make sure to save both if you want to
save your changes in data or analysis.*
The two Windows: Data Editor
• Data Editor
Spreadsheet-like system for defining, entering, editing,
and displaying data. Extension of the saved file will be
“sav.”
The two Windows: Output Viewer
• Output Viewer
Displays output and errors. Extension of the saved file will
be “spv.”
The basics of managing
data files
Opening SPSS
• Start → All Programs → SPSS Inc→ SPSS 17.0 →
SPSS 17.0
Opening SPSS
• The default window will have the data editor
• There are two sheets in the window:
1. Data view 2. Variable view
Data View window
• The Data View window
This sheet is visible when you first open the Data Editor
and this sheet contains the data
• Click on the tab labeled Variable View
Click
Variable View window
• This sheet contains information about the data set that is stored
with the dataset
• Name
• The first character of the variable name must be alphabetic
• Variable names must be unique, and have to be less than 64
characters.
• Spaces are NOT allowed.
Variable View window: Type
• Type
• Click on the ‘type’ box. The two basic types of variables
that you will use are numeric and string. This column
enables you to specify the type of variable.
Variable View window: Width
• Width
• Width allows you to determine the number of
characters SPSS will allow to be entered for the
variable
Variable View window: Decimals
•Decimals
• Number of decimals
• It has to be less than or equal to 16

3.14159265
Variable View window: Label
•Label
• You can specify the details of the variable
• You can write characters with spaces up to 256
characters
Variable View window: Values
•Values
• This is used and to suggest which numbers
represent which categories when the
variable represents a category
Defining the value labels
• Click the cell in the values column as shown below
• For the value, and the label, you can put up to 60
characters.
• After defining the values click add and then click OK.
Click
Data view vs. Variable view
• Data view
• Rows are cases
• Columns are variables
• Variable view
• Rows define the variables
• Name, Type, Width, Decimals, Label, Missing, etc.
• Scale – age, weight, income
• Nominal – categories that cannot be ranked (ID number)
• Ordinal – categories that can be ranked (level of satisfaction)
Practice 1
• How would you put the following information into
SPSS?
Value = 1 represents Male and Value = 2 represents Female
Name Gender Height
JAUNITA 2 5.4
SALLY 2 5.3
DONNA 2 5.6
SABRINA 2 5.7
JOHN 1 5.7
MARK 1 6
ERIC 1 6.4
BRUCE 1 5.9
Practice 1 (Solution Sample)
Click
Click
Saving the data
• To save the data file you created simply click ‘file’ and
click ‘save as.’ You can save the file in different forms by
clicking “Save as type.”
Click
Sorting the data
• Click ‘Data’ and then click Sort Cases
Sorting the data (cont’d)
• Double Click ‘Name of the students.’ Then click ok.
Click
Click
The basic analysis
The basic analysis of SPSS that will
be introduced in this class
•Frequencies
• This analysis produces frequency tables showing
frequency counts and percentages of the values of
individual variables.
•Descriptives
• This analysis shows the maximum, minimum,
mean, and standard deviation of the variables
•Linear regression analysis
• Linear Regression estimates the coefficients of the
linear equation
Opening the sample data
• Open ‘Employee data.sav’ from the SPSS
• Go to “File,” “Open,” and Click Data
Opening the sample data
• Go to Program Files,” “SPSSInc,” “SPSS17,” and
“Samples” folder.
• Open “Employee Data.sav” file
Frequencies
• Click ‘Analyze,’ ‘Descriptive statistics,’ then
click ‘Frequencies’
Frequencies
• Click gender and put it into the variable box.
• Click ‘Charts.’
• Then click ‘Bar charts’ and click ‘Continue.’
Click Click
Frequencies
•Finally Click OK in the Frequencies box.
Click
Spss briefintroduction Spss introduction, biostatistics, biostatistics Spss window Spss data view  Spss variable view It gives a simple presentation on spss About spss and its window  How to start spss
Descriptives
• Click ‘Analyze,’ ‘Descriptive statistics,’ then
click ‘Descriptives…’
• Click ‘Educational level’ and ‘Beginning Salary,’
and put it into the variable box.
• Click Options
Click
Descriptives
• The options allows you to analyze other
descriptive statistics besides the mean and Std.
• Click ‘variance’ and ‘kurtosis’
• Finally click ‘Continue’
Click
Click
Descriptives
• Finally Click OK in the Descriptives box. You will
be able to see the result of the analysis.

More Related Content

PDF
ELEMENTARY STATISTICS (INTRODUCTION TO SPSS)
PPT
Spss (1)
PPTX
Data analysis using spss
PPT
SPSS an intro...
PPT
Beginners SPSS.ppt
PDF
Introduction to the Research Method and SPSS
PPT
An introduction to spss
PPT
Basic Introduction of SPSS software_presentation
ELEMENTARY STATISTICS (INTRODUCTION TO SPSS)
Spss (1)
Data analysis using spss
SPSS an intro...
Beginners SPSS.ppt
Introduction to the Research Method and SPSS
An introduction to spss
Basic Introduction of SPSS software_presentation

Similar to Spss briefintroduction Spss introduction, biostatistics, biostatistics Spss window Spss data view Spss variable view It gives a simple presentation on spss About spss and its window How to start spss (20)

PPT
trs-3.ppt
PPT
training about new methodologies.Google's service, offered free of charge, in...
PPT
Analyzing_the_Nutritional_Awareness_Dietary
PPT
trs-3.ppt
PPT
trs-3.ppt
PPT
trs-3.ppt
PPTX
Training in basic drug abuse data management and analysis
PPT
Software packages for statistical analysis - SPSS
PPTX
Spss by vijay ambast
PPTX
PPTX
Tutorial of SPSS
PPTX
An introduction to spss
PPTX
Lec 3 HRA SPSS
PPTX
Data processing & Analysis: SPSS an overview
PPT
Spss intro for engineering
PPTX
Statistical Package for Social Science TRAINING - RADOKI..pptx
PPTX
Introduction To SPSS
PPTX
1. chapter i(pasw)
PPTX
SPSS.pptx(unit 4).pptx
PPT
Spss beginners
trs-3.ppt
training about new methodologies.Google's service, offered free of charge, in...
Analyzing_the_Nutritional_Awareness_Dietary
trs-3.ppt
trs-3.ppt
trs-3.ppt
Training in basic drug abuse data management and analysis
Software packages for statistical analysis - SPSS
Spss by vijay ambast
Tutorial of SPSS
An introduction to spss
Lec 3 HRA SPSS
Data processing & Analysis: SPSS an overview
Spss intro for engineering
Statistical Package for Social Science TRAINING - RADOKI..pptx
Introduction To SPSS
1. chapter i(pasw)
SPSS.pptx(unit 4).pptx
Spss beginners
Ad

Recently uploaded (20)

PPTX
Tissue processing ( HISTOPATHOLOGICAL TECHNIQUE
PPTX
PPT- ENG7_QUARTER1_LESSON1_WEEK1. IMAGERY -DESCRIPTIONS pptx.pptx
PDF
RMMM.pdf make it easy to upload and study
PPTX
Pharmacology of Heart Failure /Pharmacotherapy of CHF
PDF
Computing-Curriculum for Schools in Ghana
PDF
grade 11-chemistry_fetena_net_5883.pdf teacher guide for all student
PPTX
GDM (1) (1).pptx small presentation for students
PDF
ANTIBIOTICS.pptx.pdf………………… xxxxxxxxxxxxx
PDF
Supply Chain Operations Speaking Notes -ICLT Program
PPTX
Cell Structure & Organelles in detailed.
PPTX
Cell Types and Its function , kingdom of life
PDF
102 student loan defaulters named and shamed – Is someone you know on the list?
PDF
Microbial disease of the cardiovascular and lymphatic systems
PDF
O5-L3 Freight Transport Ops (International) V1.pdf
PDF
Black Hat USA 2025 - Micro ICS Summit - ICS/OT Threat Landscape
PDF
01-Introduction-to-Information-Management.pdf
PDF
2.FourierTransform-ShortQuestionswithAnswers.pdf
PDF
3rd Neelam Sanjeevareddy Memorial Lecture.pdf
PPTX
202450812 BayCHI UCSC-SV 20250812 v17.pptx
PDF
VCE English Exam - Section C Student Revision Booklet
Tissue processing ( HISTOPATHOLOGICAL TECHNIQUE
PPT- ENG7_QUARTER1_LESSON1_WEEK1. IMAGERY -DESCRIPTIONS pptx.pptx
RMMM.pdf make it easy to upload and study
Pharmacology of Heart Failure /Pharmacotherapy of CHF
Computing-Curriculum for Schools in Ghana
grade 11-chemistry_fetena_net_5883.pdf teacher guide for all student
GDM (1) (1).pptx small presentation for students
ANTIBIOTICS.pptx.pdf………………… xxxxxxxxxxxxx
Supply Chain Operations Speaking Notes -ICLT Program
Cell Structure & Organelles in detailed.
Cell Types and Its function , kingdom of life
102 student loan defaulters named and shamed – Is someone you know on the list?
Microbial disease of the cardiovascular and lymphatic systems
O5-L3 Freight Transport Ops (International) V1.pdf
Black Hat USA 2025 - Micro ICS Summit - ICS/OT Threat Landscape
01-Introduction-to-Information-Management.pdf
2.FourierTransform-ShortQuestionswithAnswers.pdf
3rd Neelam Sanjeevareddy Memorial Lecture.pdf
202450812 BayCHI UCSC-SV 20250812 v17.pptx
VCE English Exam - Section C Student Revision Booklet
Ad

Spss briefintroduction Spss introduction, biostatistics, biostatistics Spss window Spss data view Spss variable view It gives a simple presentation on spss About spss and its window How to start spss

  • 2. Topics we will cover today • SPSS at a glance • Basic Structure of SPSS • Descriptive Statistics • The basic analysis in SPSS
  • 3. Introduction: What is SPSS? •Originally it is an acronym of Statistical Package for the Social Science but now it stands for Statistical Product and Service Solutions •One of the most popular statistical packages which can perform highly complex data manipulation and analysis with simple instructions
  • 4. Example •Used by e.g. retail and consumer product companies •Trying to learn about and describe their customers' buying habits, gender, age, income level, etc. •These companies tailor their marketing and product development strategies to each consumer group to increase sales and build brand loyalty. •A valuable approach in Market Research, and SPSS offers some useful tools to facilitate this commercial process
  • 5. Basic structure of SPSS • There are two different windows in SPSS • 1st – Data Editor Window - shows data in two forms • Data view • Variable view • 2nd – Output viewer Window – shows results of data analysis • *You must save the data editor window and output viewer window separately. Make sure to save both if you want to save your changes in data or analysis.*
  • 6. The two Windows: Data Editor • Data Editor Spreadsheet-like system for defining, entering, editing, and displaying data. Extension of the saved file will be “sav.”
  • 7. The two Windows: Output Viewer • Output Viewer Displays output and errors. Extension of the saved file will be “spv.”
  • 8. The basics of managing data files
  • 9. Opening SPSS • Start → All Programs → SPSS Inc→ SPSS 17.0 → SPSS 17.0
  • 10. Opening SPSS • The default window will have the data editor • There are two sheets in the window: 1. Data view 2. Variable view
  • 11. Data View window • The Data View window This sheet is visible when you first open the Data Editor and this sheet contains the data • Click on the tab labeled Variable View Click
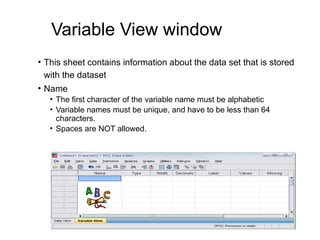
  • 12. Variable View window • This sheet contains information about the data set that is stored with the dataset • Name • The first character of the variable name must be alphabetic • Variable names must be unique, and have to be less than 64 characters. • Spaces are NOT allowed.
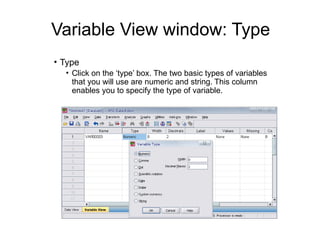
  • 13. Variable View window: Type • Type • Click on the ‘type’ box. The two basic types of variables that you will use are numeric and string. This column enables you to specify the type of variable.
  • 14. Variable View window: Width • Width • Width allows you to determine the number of characters SPSS will allow to be entered for the variable
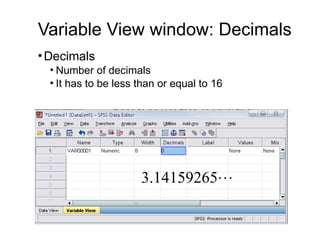
  • 15. Variable View window: Decimals •Decimals • Number of decimals • It has to be less than or equal to 16  3.14159265
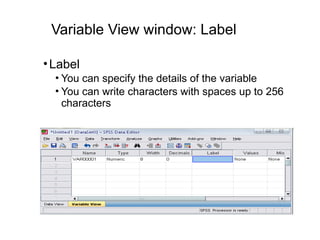
  • 16. Variable View window: Label •Label • You can specify the details of the variable • You can write characters with spaces up to 256 characters
  • 17. Variable View window: Values •Values • This is used and to suggest which numbers represent which categories when the variable represents a category
  • 18. Defining the value labels • Click the cell in the values column as shown below • For the value, and the label, you can put up to 60 characters. • After defining the values click add and then click OK. Click
  • 19. Data view vs. Variable view • Data view • Rows are cases • Columns are variables • Variable view • Rows define the variables • Name, Type, Width, Decimals, Label, Missing, etc. • Scale – age, weight, income • Nominal – categories that cannot be ranked (ID number) • Ordinal – categories that can be ranked (level of satisfaction)
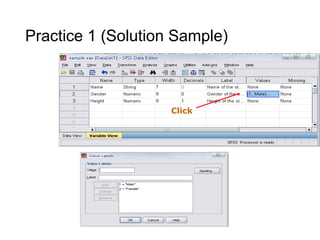
  • 20. Practice 1 • How would you put the following information into SPSS? Value = 1 represents Male and Value = 2 represents Female Name Gender Height JAUNITA 2 5.4 SALLY 2 5.3 DONNA 2 5.6 SABRINA 2 5.7 JOHN 1 5.7 MARK 1 6 ERIC 1 6.4 BRUCE 1 5.9
  • 21. Practice 1 (Solution Sample) Click
  • 22. Click
  • 23. Saving the data • To save the data file you created simply click ‘file’ and click ‘save as.’ You can save the file in different forms by clicking “Save as type.” Click
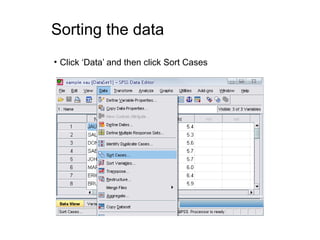
  • 24. Sorting the data • Click ‘Data’ and then click Sort Cases
  • 25. Sorting the data (cont’d) • Double Click ‘Name of the students.’ Then click ok. Click Click
  • 27. The basic analysis of SPSS that will be introduced in this class •Frequencies • This analysis produces frequency tables showing frequency counts and percentages of the values of individual variables. •Descriptives • This analysis shows the maximum, minimum, mean, and standard deviation of the variables •Linear regression analysis • Linear Regression estimates the coefficients of the linear equation
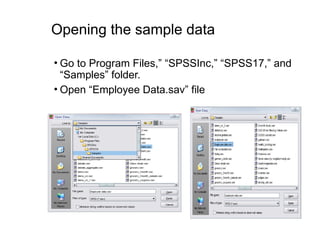
  • 28. Opening the sample data • Open ‘Employee data.sav’ from the SPSS • Go to “File,” “Open,” and Click Data
  • 29. Opening the sample data • Go to Program Files,” “SPSSInc,” “SPSS17,” and “Samples” folder. • Open “Employee Data.sav” file
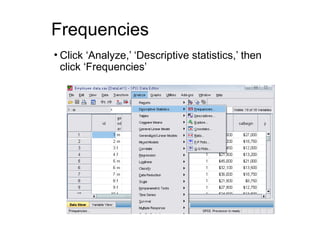
  • 30. Frequencies • Click ‘Analyze,’ ‘Descriptive statistics,’ then click ‘Frequencies’
  • 31. Frequencies • Click gender and put it into the variable box. • Click ‘Charts.’ • Then click ‘Bar charts’ and click ‘Continue.’ Click Click
  • 32. Frequencies •Finally Click OK in the Frequencies box. Click
  • 34. Descriptives • Click ‘Analyze,’ ‘Descriptive statistics,’ then click ‘Descriptives…’ • Click ‘Educational level’ and ‘Beginning Salary,’ and put it into the variable box. • Click Options Click
  • 35. Descriptives • The options allows you to analyze other descriptive statistics besides the mean and Std. • Click ‘variance’ and ‘kurtosis’ • Finally click ‘Continue’ Click Click
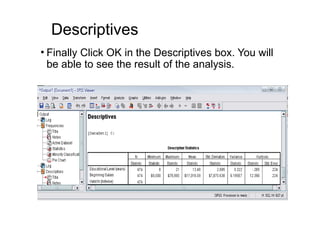
  • 36. Descriptives • Finally Click OK in the Descriptives box. You will be able to see the result of the analysis.

Editor's Notes

  • #7: The graph shows that more people who receives wireless service tends to own PDA compared to people who doesn’t receive wireless service.
  • #11: This window shows the actual data values and the name of the variables.