SlideShare a Scribd company logo
DB2 For z/OS Solutions
SoftBase Batch Healthcare


Batch Healthcare Consists of:

    Attach Facility (DB2 Call Attach)

    Checkpoint (Checkpoint Facility)

    Batch Analyzer ( DB2 Batch Analysis)

    DeadLock Advisor (DeadLock-Timeout Reporting)


 - All can be licensed separately or in combination
SoftBase Batch Analyzer
Batch Healthcare Solution
SoftBase Batch Analyzer


Nightly DB2 Batch Overview


Where is bad DB2 for z/OS SQL? Which Jobs (applications) need tuning?
SQL Job Performance Analysis


  Select the Most Expensive Job
SoftBase Systems            Batch Analyzer Version 3.1.0
                       === SQL Performance Analysis (Jobs) ===
 Command ===>                                                Scroll ===> CSR
 Filter: ON Intervals: OFF From: 08/11/11 To: 08/12/11 Loctn: DB8G
                                                                                                 ->
                           +--- RUN TIME ---+---CPU UTILIZED--+
                 Job Start |   Job    DB2 % |        Job       DB2 % |       DB2 CPU%        Total
   Jobname       Timestamp | Elapsed of Et |         CPU      of CPU | I all Jobs          DB2 Cost
   -------- ----------- -------- ------          -------- ------ -- --------               --------
_ HRBKUPQ2 08/12 19:33 06:04:56        58.3      04:30:08        52.9 --            38.2   $8582.36
_ HRBKUPMO 08/12 03:11 04:51:07        63.2      02:55:00        68.4 --            32.0   $7191.54
_ HRDLY001 08/12 18:36 00:55:18        96.5      00:34:37        95.4 --             8.8   $1982.46
_ DLYRATEX 08/12 03:04 00:56:13        55.3      00:44:43        46.9 --             5.6   $1259.18
_ HRBKUPMU 08/12 01:26 01:31:29
Select the most expensive              29.1      01:13:45        25.1 --             4.9   $1111.53
 DB2 Job to see 08/12 19:32 00:51:52
_ HRMTHLY2      Job Step               97.4 is the most expensive DB2 Job
                                                 00:14:46        95.2 --             3.7   $ 843.96
                                       What
      performance.
_ HR430003 08/12 00:34 00:33:48        89.2 the last 24 hours? Job HRBKUPQ2 used
                                       during    00:12:56        81.2 --             2.8   $ 630.92
_ INVCMTH1 08/12 15:34 00:48:22        more than00:42:56
                                       15.1       38% of all DB2 CPU during this time!
                                                                 13.2 --             1.5   $ 340.25
_ HR430001 08/12 13:14 00:18:12        16.8      00:16:18        15.0 --             0.6   $ 147.46
_ HR430001 08/12 17:21 00:17:05        15.2      00:15:20        13.5 --             0.5   $ 125.08
SQL Job Performance Analysis


  Select the Most Expensive Step
 SoftBase Systems            Batch Analyzer Version 3.1.0
                       === SQL Performance Analysis (Steps) ===
 Command ===>                                                Scroll ===> CSR
 Filter: ON Intervals: OFF From: 08/11/11 To: 08/13/11 Loctn: DB8G
                                                                                          ->
                                       +-- RUN TIME --+-CPU UTILIZED-+          DB2
                            Step Start | Step    DB2 %| Step        DB2 %|      CPU%   Total
   Jobname StepName          Timestamp Elapsed of Et      CPU        CPU     I Steps DB2 Cost
   -------- --------        ----------- -------- ----- -------- ----- -- ----- --------
S HRBKUPQ2 HRBKUPDL         08/12 20:23 03:26:50 86.2 02:24:31 81.5 -- 82.4 $7075.64
_ HRBKUPQ2 HRBK00Z          08/13 00:31 01:07:00 16.8 01:01:03 16.2 --           6.9 $ 593.73
_ HRBKUPQ2 HRBKUPQ2         08/12 23:54 00:37:20 24.6 00:34:29 22.6 --           5.4 $ 468.02
_ HRBKUPQ2 HRBKUPMO         08/12 19:33 00:45:14 19.1 00:25:50 14.3 --           2.6 $ 223.15
                                                      The most expensive steps
_ HRBKUPQ2 HRBKCHK2
Select the most expensive   08/12 23:50 00:03:21 99.0 00:02:34 first. Step --
                                                         are listed  99.7        1.7 $ 153.79
     Step to see SQL
_ HRBKUPQ2 HRBKCHK          08/12 20:18 00:02:04 97.8 HRBKUPDL used 82.4% of
                                                       00:01:06 99.6 --          0.7 $ 65.92
_statement performance.
   HRBKUPQ2 HRBKUPN1        08/12 20:20 00:03:01   0.0 00:00:31 CPU. --
                                                            the DB2 0.0          0.0 $   0.01
_ HRBKUPQ2 HRBK00X          08/12 23:53 00:00:07 33.3 00:00:03 68.8 --           0.0 $   2.11
SQL Job Performance Analysis


 Select the Most Expensive Statement
 SoftBase Systems          Batch Analyzer Version 3.1.0
                         === SQL Performance Analysis ===
 Command ===>                                                                Scroll ===> CSR
 Filter: ON Intervals: OFF From: 08/11/11 To: 08/13/11 Loctn: DB8G
                              Commands: S : Show SQL D : Dynamic SQL L : timeLine ->
                                   Step Start   Stmt Stmt              DB2 CPU %     Total
S Jobname          Plan   Package Timestamp      Num Type I All Stmts                 Cost
- -------- -------- -------- ----------- ----- ----- --- --------- --------
S HRBKUPQ2 PDGF450 DLYRATEX 08/12 20:23          559 UPDAT -               94.5   $6687.90
_ HRBKUPQ2 PDGF450 DLYRATEX 08/12 20:23          446 OPEN         -         2.8   $ 203.81
_ HRBKUPQ2 PDGF450 DLYRATEX 08/12 20:23          508 SELCT -                0.9   $ 70.53
_ HRBKUPQ2 PDGF450 DLYRATEX 08/12 20:23 The most expensive SQL 0.7
                                                 470 FETCH -                      $ 52.07
Select the most expensive DLYRATEX 08/12 20:23 statements are listed first. 0.5
_ HRBKUPQ2 PDGF450                               520 SELCT -                      $ 39.28
_ HRBKUPQ2 for details. DLYRATEX 08/12 20:23 This UPDATE statement
SQL statement PDGF450                            535 SELCT -                0.2   $ 20.69
_ HRBKUPQ2 PDGF450 DLYRATEX 08/12 20:23          400 FETCH -
                                                 used 94.5% of all DB2      0.0   $   1.27
_ HRBKUPQ2 PDGF450 DLYRATEX 08/12 20:23            CPU in this batch
                                                 276 SELCT -                0.0   $   0.10
                                                       program.
_ HRBKUPQ2 PDGF450 DLYRATEX 08/12 20:23          493 CLOSE -                0.0   $   0.01
_ HRBKUPQ2 PDGF450 DLYRATEX 08/12 20:23          380 OPEN         -         0.0   $   0.01
SQL Job Performance Analysis


  Actual Text of The Most Expensive Statement
 SoftBase Systems      Batch Analyzer Version 3.1.0                  Row 1 of 3

Command ===>                                         Scroll ===> CSR

 JobName: HRBKUPQ2   Step: HRBKUPDL   Program: DLYRATEX SSID: DB8G
    Plan: PDGF450    Type: PACKAGE     Collid: PDGF450DB8G

 ------------------------ Performance ----------------------------
 CPU as pct of Elapsed..        65.5        Total Cost..: $6687.90
  SQL statement you Average       Maximum        Total %of Total
   should tune first! --------- ---------    ---------     -----
                                                                   Actual SQL Text is
 Elapsed.Time...          0.013     6.710    10196.763      95.3     now displayed.
 CPU Time.......          0.008     0.027     6687.897      94.5     Notice that the
 Rows Affected..             96        96     76800000              WHERE clause is
-------- SQL Text ( statement number:    559 ) ------------------- written to update
UPDATE ACCT_NOTES SET NOTE_TEXT2 =                                 ALL account note
                                                                   records instead of
:W-WORKING-STORAGE.W-NEW-INVC-NOTE WHERE CUST_N =
                                                                          one.
:DCLACCOUNT.ACCT-CUST-N
Batch Throughput Analysis


    Identifies Batch Contention Issues
SoftBase Systems              Batch Analyzer Version 3.1.0
                         === Batch Throughput Analysis (Jobs) ===
Command ===>                                                Scroll ===> CSR
Filter: ON Intervals: OFF From: 08/11/11 To: 08/13/11 Loctn: DB8G

                               +--- RUN TIME ---+
                Job Start |         Job        DB2 % |                        Deadlck   Comt Chg    Commit
    Jobname     Timestamp | Elapsed of Et | DB2 CPU I Timeout                            Cnt Pct    Freqncy
    --------   -----------|-------- ------ |-------- -- -------                         ---- ----- --------
_   HRDLY001   08/12 03:04 00:01:41             91.9         ~ 0:00 --             3       0 99.9 NO CMT
_   HRMTHLY2   08/12 03:04 00:01:05             94.6         ~ 0:00 --             2       0 99.9 NO CMT
                   Displays DB2 batch jobs encountering
_   HRMTHLY2   08/12 03:09 00:01:05             94.7         ~ 0:00 --             2       0 99.9 NO CMT
                timeouts and deadlocks. Job HRDLY had 3
_   HRMTHLY2   08/12 19:32issued no COMMITS during
                 timeouts, and 00:51:52         97.4 00:14:46 --                   1     133 96.1 00:00:23
_   HR430003   08/12 00:34 execution.
                                00:33:48        89.2 00:12:56 --                   0       0 91.7 NO CMT
_   MTHBILLN   08/12 00:36 00:30:33             16.6 00:15:01 --                   0       0   0.0 NO CMT
_   HRBKUPMU   08/12 01:26 01:31:29             29.1 01:13:45 --                   0    2601 13.1 00:00:02
                                     Chg Pct is a critical number – it is the
_   HRBKUPMO   08/12 03:11 04:51:07             63.2 02:55:00 --                   0    1601 88.6 00:00:10
                                        percent of time, out of all I/O, that
_   ACCTHIST   08/12 11:54 00:09:23     programs 0.0 00:03:42 --
                                                  are changing DB2 data.           0       0   0.0 NO CMT
_   MTHBILL3   08/12 13:03 00:06:55             10.8 00:06:20 --                   0       0   0.0 NO CMT
Recovery Impact Analysis


    Identifies Potential Rollbacks
SoftBase Systems           Batch Analyzer Version 3.1.0
                       === Recovery Impact Analysis (Jobs) ===
 Command ===>                                                Scroll ===> CSR
 Filter: ON Intervals: OFF From: 08/11/11 To: 08/13/11 Loctn: DB8G

                               +-- RUN TIME---+
                 Job Start | Job             DB2 %|   Deadlck Chg Comit Commit Rollback
    Jobname      Timestamp |Elapsed of Et| I Timeout Pct           Cnt Frequncy Estimate
    -------- -----------|-------- -----|-- ------- ----- ----- -------- --------
_   HRBKUPQ2 08/12 19:33 06:04:56 58.3 --                 0   80.7 2601 00:00:08 05:39:53
_   HRBKUPMO 08/12 03:11 04:51:07 63.2 --                 0   88.6 1601 00:00:10 05:26:30
_   HR430003 08/12 00:34 00:33:48 89.2 --                 0   91.7    0 NO CMT 00:55:22
_   DLYRATEX 08/12 03:04 00:56:13 55.3 --                 0   56.8 1601 00:00:02 00:35:22
_       The Recovery Impact Analysis Report 91.9 --
    HRDLY001 08/12 03:04 00:01:41                         3   99.9    0 NO CMT 00:01:03
       provides an estimate of how long each
_   HRMTHLY2 08/12 03:09 00:01:05 94.7 --                 2   99.9    0 NO CMT 00:01:03
         DB2 batch program will require to
_   HRMTHLY2 08/12 19:32 00:51:52 97.4 --
        ROLLBACK any changes it has made                  1   96.1  133 00:00:23 00:01:03
_   HRMTHLY2 08/12 COMMIT statement.
          since the last 03:04 00:01:05 94.6 --           2   99.9    0 NO CMT 00:01:02
_   HR430002 08/12 17:46 00:47:59              1.0 --     0   86.4    1 00:47:59 00:00:51
_   HRDLY001 08/12 18:36 00:55:18 96.5 --                 0   97.9  300 00:00:11 00:00:42
SoftBase Batch Analyzer Installation


Batch Analyzer Installation Procedure

    Installation time is usually maximum of 1 – 2 hours

    DB2 DBA performs the Batch Analyzer installation – System
     Programmer SMP type install is not required!

    Initial installation is done into a test DB2 environment

    DBAs and Developers usually review Batch Analyzer reports after
     it collects data for several days
SoftBase Batch Analyzer POC


Batch Analyzer Deployment

    Batch Analyzer’s Touch Free Collector can begin gathering
     performance data for all DB2 batch jobs in seconds –WITHOUT
     JCL CHANGES

    Performance collection overhead is typically 1% - 3% for each Job
     watched – most customers say it is not even noticeable

    Batch Analyzer Touch Free Collector can be started and stopped
     with a single command

    Batch Analyzer does not require a lengthy trial – it either finds
     significant performance problems immediately or it doesn’t!
SoftBase Batch Analyzer
Batch Healthcare Solution
SoftBase
   20 Fall Pippin Lane, Suite 202
   Asheville, NC USA 28803
   sales@softbase.com
   support@softbase.com
   800-669-7076


© 2011 Candescent SoftBase, LLC
SoftBase® is a Registered Trademark. All Right Reserved.
Phone: (800) 669-7076 | (828) 670-9900

More Related Content

DOCX
12c: Testing audit features for Data Pump (Export & Import) and RMAN jobs
PDF
PoC Oracle Exadata - Retour d'expérience
PDF
AWR Ambiguity: Performance reasoning when the numbers don't add up
PPT
Rmoug ashmaster
PPT
Ash masters : advanced ash analytics on Oracle
PDF
PostgreSQL Portland Performance Practice Project - Database Test 2 Howto
PDF
Rac 12c optimization
PPTX
Using AWR/Statspack for Wait Analysis
12c: Testing audit features for Data Pump (Export & Import) and RMAN jobs
PoC Oracle Exadata - Retour d'expérience
AWR Ambiguity: Performance reasoning when the numbers don't add up
Rmoug ashmaster
Ash masters : advanced ash analytics on Oracle
PostgreSQL Portland Performance Practice Project - Database Test 2 Howto
Rac 12c optimization
Using AWR/Statspack for Wait Analysis

What's hot (20)

PDF
Data Guard Deep Dive UKOUG 2012
PPT
Oracle Open World Thursday 230 ashmasters
PDF
12c for Developers - Feb 2014
PDF
PostgreSQL Portland Performance Practice Project - Database Test 2 Tuning
PPT
Intro to ASH
PDF
Dataguard fsfo-implementation
PDF
Profiling the logwriter and database writer
PDF
Hotsos 2011: Mining the AWR repository for Capacity Planning, Visualization, ...
PDF
Oracle Database SQL Tuning Concept
PPTX
OpenWorld Sep14 12c for_developers
PPTX
Indexing in Exadata
PDF
Oracle 12 c new-features
PPTX
Oracle: Binding versus caging
PDF
Tuning SQL for Oracle Exadata: The Good, The Bad, and The Ugly Tuning SQL fo...
PPT
Using AWR for IO Subsystem Analysis
PDF
Dataguard broker and observerst
PPTX
Shareplex Presentation
PPT
Thomas+Niewel+ +Oracletuning
PDF
How to Avoid Pitfalls in Schema Upgrade with Galera
PPT
Performance Tuning With Oracle ASH and AWR. Part 1 How And What
Data Guard Deep Dive UKOUG 2012
Oracle Open World Thursday 230 ashmasters
12c for Developers - Feb 2014
PostgreSQL Portland Performance Practice Project - Database Test 2 Tuning
Intro to ASH
Dataguard fsfo-implementation
Profiling the logwriter and database writer
Hotsos 2011: Mining the AWR repository for Capacity Planning, Visualization, ...
Oracle Database SQL Tuning Concept
OpenWorld Sep14 12c for_developers
Indexing in Exadata
Oracle 12 c new-features
Oracle: Binding versus caging
Tuning SQL for Oracle Exadata: The Good, The Bad, and The Ugly Tuning SQL fo...
Using AWR for IO Subsystem Analysis
Dataguard broker and observerst
Shareplex Presentation
Thomas+Niewel+ +Oracletuning
How to Avoid Pitfalls in Schema Upgrade with Galera
Performance Tuning With Oracle ASH and AWR. Part 1 How And What
Ad

Similar to Quickly Locate Poorly Performing DB2 for z/OS Batch SQL (20)

PPTX
Analyzing SQL Traces generated by EVENT 10046.pptx
PPT
Run Your Business 6X Faster at Lower Costs!
PDF
SQL Server Performance Analysis
PDF
Ajuste (tuning) del rendimiento de SQL Server 2008
PDF
Microsoft SQL Server Query Tuning
PDF
Oracle Database Performance Tuning Concept
PPTX
SQL Tuning 101 - Sep 2013
PDF
Lessons learned from Isbank - A Story of a DB2 for z/OS Initiative
PDF
Back2 Basic Tools
PDF
Back 2 basics - SSMS Tips (IDf)
PDF
Advanced Oracle Troubleshooting
PPTX
What's new in SQL Server Integration Services 2012?
PDF
System z Technology Summit Streamlining Utilities
PDF
Sql Performance Tuning For Developers
PDF
Hailey_Database_Performance_Made_Easy_through_Graphics.pdf
PDF
Databse & Technology 2 | Connor McDonald | Managing Optimiser Statistics - A ...
PPTX
Ten query tuning techniques every SQL Server programmer should know
PPTX
SQL Server 2012 Best Practices
PDF
Bank Data Frank Peterson DB2 10-Early_Experiences_pdf
PDF
Drilling Deep Into Exadata Performance
Analyzing SQL Traces generated by EVENT 10046.pptx
Run Your Business 6X Faster at Lower Costs!
SQL Server Performance Analysis
Ajuste (tuning) del rendimiento de SQL Server 2008
Microsoft SQL Server Query Tuning
Oracle Database Performance Tuning Concept
SQL Tuning 101 - Sep 2013
Lessons learned from Isbank - A Story of a DB2 for z/OS Initiative
Back2 Basic Tools
Back 2 basics - SSMS Tips (IDf)
Advanced Oracle Troubleshooting
What's new in SQL Server Integration Services 2012?
System z Technology Summit Streamlining Utilities
Sql Performance Tuning For Developers
Hailey_Database_Performance_Made_Easy_through_Graphics.pdf
Databse & Technology 2 | Connor McDonald | Managing Optimiser Statistics - A ...
Ten query tuning techniques every SQL Server programmer should know
SQL Server 2012 Best Practices
Bank Data Frank Peterson DB2 10-Early_Experiences_pdf
Drilling Deep Into Exadata Performance
Ad

More from softbasemarketing (7)

PPTX
Improve DB2 z/OS Test Data Management
PPTX
DB2 for z/OS Solutions
PPTX
Improve DB2 testing environments
PPTX
Instantly find the causes of DB2 deadlocks and timeouts
PPTX
DB2 for z/OS Checkpoint and Restart Solution
PPTX
Execute DB2 applications more efficiently, in less time and with greater flex...
PPTX
Developing and Deploying Reliable DB2 Applications
Improve DB2 z/OS Test Data Management
DB2 for z/OS Solutions
Improve DB2 testing environments
Instantly find the causes of DB2 deadlocks and timeouts
DB2 for z/OS Checkpoint and Restart Solution
Execute DB2 applications more efficiently, in less time and with greater flex...
Developing and Deploying Reliable DB2 Applications

Recently uploaded (20)

PPTX
cloud_computing_Infrastucture_as_cloud_p
PPTX
Chapter 5: Probability Theory and Statistics
PDF
Approach and Philosophy of On baking technology
PPTX
1. Introduction to Computer Programming.pptx
PDF
Getting Started with Data Integration: FME Form 101
PDF
Unlocking AI with Model Context Protocol (MCP)
PDF
A novel scalable deep ensemble learning framework for big data classification...
PDF
Zenith AI: Advanced Artificial Intelligence
PPTX
A Presentation on Artificial Intelligence
PDF
project resource management chapter-09.pdf
PPTX
OMC Textile Division Presentation 2021.pptx
PDF
1 - Historical Antecedents, Social Consideration.pdf
PDF
7 ChatGPT Prompts to Help You Define Your Ideal Customer Profile.pdf
PDF
From MVP to Full-Scale Product A Startup’s Software Journey.pdf
PPTX
Group 1 Presentation -Planning and Decision Making .pptx
PDF
gpt5_lecture_notes_comprehensive_20250812015547.pdf
PDF
August Patch Tuesday
PPTX
Tartificialntelligence_presentation.pptx
PDF
Hindi spoken digit analysis for native and non-native speakers
PDF
Building Integrated photovoltaic BIPV_UPV.pdf
cloud_computing_Infrastucture_as_cloud_p
Chapter 5: Probability Theory and Statistics
Approach and Philosophy of On baking technology
1. Introduction to Computer Programming.pptx
Getting Started with Data Integration: FME Form 101
Unlocking AI with Model Context Protocol (MCP)
A novel scalable deep ensemble learning framework for big data classification...
Zenith AI: Advanced Artificial Intelligence
A Presentation on Artificial Intelligence
project resource management chapter-09.pdf
OMC Textile Division Presentation 2021.pptx
1 - Historical Antecedents, Social Consideration.pdf
7 ChatGPT Prompts to Help You Define Your Ideal Customer Profile.pdf
From MVP to Full-Scale Product A Startup’s Software Journey.pdf
Group 1 Presentation -Planning and Decision Making .pptx
gpt5_lecture_notes_comprehensive_20250812015547.pdf
August Patch Tuesday
Tartificialntelligence_presentation.pptx
Hindi spoken digit analysis for native and non-native speakers
Building Integrated photovoltaic BIPV_UPV.pdf

Quickly Locate Poorly Performing DB2 for z/OS Batch SQL

  • 1. DB2 For z/OS Solutions
  • 2. SoftBase Batch Healthcare Batch Healthcare Consists of:  Attach Facility (DB2 Call Attach)  Checkpoint (Checkpoint Facility)  Batch Analyzer ( DB2 Batch Analysis)  DeadLock Advisor (DeadLock-Timeout Reporting) - All can be licensed separately or in combination
  • 3. SoftBase Batch Analyzer Batch Healthcare Solution
  • 4. SoftBase Batch Analyzer Nightly DB2 Batch Overview Where is bad DB2 for z/OS SQL? Which Jobs (applications) need tuning?
  • 5. SQL Job Performance Analysis Select the Most Expensive Job SoftBase Systems Batch Analyzer Version 3.1.0 === SQL Performance Analysis (Jobs) === Command ===> Scroll ===> CSR Filter: ON Intervals: OFF From: 08/11/11 To: 08/12/11 Loctn: DB8G -> +--- RUN TIME ---+---CPU UTILIZED--+ Job Start | Job DB2 % | Job DB2 % | DB2 CPU% Total Jobname Timestamp | Elapsed of Et | CPU of CPU | I all Jobs DB2 Cost -------- ----------- -------- ------ -------- ------ -- -------- -------- _ HRBKUPQ2 08/12 19:33 06:04:56 58.3 04:30:08 52.9 -- 38.2 $8582.36 _ HRBKUPMO 08/12 03:11 04:51:07 63.2 02:55:00 68.4 -- 32.0 $7191.54 _ HRDLY001 08/12 18:36 00:55:18 96.5 00:34:37 95.4 -- 8.8 $1982.46 _ DLYRATEX 08/12 03:04 00:56:13 55.3 00:44:43 46.9 -- 5.6 $1259.18 _ HRBKUPMU 08/12 01:26 01:31:29 Select the most expensive 29.1 01:13:45 25.1 -- 4.9 $1111.53 DB2 Job to see 08/12 19:32 00:51:52 _ HRMTHLY2 Job Step 97.4 is the most expensive DB2 Job 00:14:46 95.2 -- 3.7 $ 843.96 What performance. _ HR430003 08/12 00:34 00:33:48 89.2 the last 24 hours? Job HRBKUPQ2 used during 00:12:56 81.2 -- 2.8 $ 630.92 _ INVCMTH1 08/12 15:34 00:48:22 more than00:42:56 15.1 38% of all DB2 CPU during this time! 13.2 -- 1.5 $ 340.25 _ HR430001 08/12 13:14 00:18:12 16.8 00:16:18 15.0 -- 0.6 $ 147.46 _ HR430001 08/12 17:21 00:17:05 15.2 00:15:20 13.5 -- 0.5 $ 125.08
  • 6. SQL Job Performance Analysis Select the Most Expensive Step SoftBase Systems Batch Analyzer Version 3.1.0 === SQL Performance Analysis (Steps) === Command ===> Scroll ===> CSR Filter: ON Intervals: OFF From: 08/11/11 To: 08/13/11 Loctn: DB8G -> +-- RUN TIME --+-CPU UTILIZED-+ DB2 Step Start | Step DB2 %| Step DB2 %| CPU% Total Jobname StepName Timestamp Elapsed of Et CPU CPU I Steps DB2 Cost -------- -------- ----------- -------- ----- -------- ----- -- ----- -------- S HRBKUPQ2 HRBKUPDL 08/12 20:23 03:26:50 86.2 02:24:31 81.5 -- 82.4 $7075.64 _ HRBKUPQ2 HRBK00Z 08/13 00:31 01:07:00 16.8 01:01:03 16.2 -- 6.9 $ 593.73 _ HRBKUPQ2 HRBKUPQ2 08/12 23:54 00:37:20 24.6 00:34:29 22.6 -- 5.4 $ 468.02 _ HRBKUPQ2 HRBKUPMO 08/12 19:33 00:45:14 19.1 00:25:50 14.3 -- 2.6 $ 223.15 The most expensive steps _ HRBKUPQ2 HRBKCHK2 Select the most expensive 08/12 23:50 00:03:21 99.0 00:02:34 first. Step -- are listed 99.7 1.7 $ 153.79 Step to see SQL _ HRBKUPQ2 HRBKCHK 08/12 20:18 00:02:04 97.8 HRBKUPDL used 82.4% of 00:01:06 99.6 -- 0.7 $ 65.92 _statement performance. HRBKUPQ2 HRBKUPN1 08/12 20:20 00:03:01 0.0 00:00:31 CPU. -- the DB2 0.0 0.0 $ 0.01 _ HRBKUPQ2 HRBK00X 08/12 23:53 00:00:07 33.3 00:00:03 68.8 -- 0.0 $ 2.11
  • 7. SQL Job Performance Analysis Select the Most Expensive Statement SoftBase Systems Batch Analyzer Version 3.1.0 === SQL Performance Analysis === Command ===> Scroll ===> CSR Filter: ON Intervals: OFF From: 08/11/11 To: 08/13/11 Loctn: DB8G Commands: S : Show SQL D : Dynamic SQL L : timeLine -> Step Start Stmt Stmt DB2 CPU % Total S Jobname Plan Package Timestamp Num Type I All Stmts Cost - -------- -------- -------- ----------- ----- ----- --- --------- -------- S HRBKUPQ2 PDGF450 DLYRATEX 08/12 20:23 559 UPDAT - 94.5 $6687.90 _ HRBKUPQ2 PDGF450 DLYRATEX 08/12 20:23 446 OPEN - 2.8 $ 203.81 _ HRBKUPQ2 PDGF450 DLYRATEX 08/12 20:23 508 SELCT - 0.9 $ 70.53 _ HRBKUPQ2 PDGF450 DLYRATEX 08/12 20:23 The most expensive SQL 0.7 470 FETCH - $ 52.07 Select the most expensive DLYRATEX 08/12 20:23 statements are listed first. 0.5 _ HRBKUPQ2 PDGF450 520 SELCT - $ 39.28 _ HRBKUPQ2 for details. DLYRATEX 08/12 20:23 This UPDATE statement SQL statement PDGF450 535 SELCT - 0.2 $ 20.69 _ HRBKUPQ2 PDGF450 DLYRATEX 08/12 20:23 400 FETCH - used 94.5% of all DB2 0.0 $ 1.27 _ HRBKUPQ2 PDGF450 DLYRATEX 08/12 20:23 CPU in this batch 276 SELCT - 0.0 $ 0.10 program. _ HRBKUPQ2 PDGF450 DLYRATEX 08/12 20:23 493 CLOSE - 0.0 $ 0.01 _ HRBKUPQ2 PDGF450 DLYRATEX 08/12 20:23 380 OPEN - 0.0 $ 0.01
  • 8. SQL Job Performance Analysis Actual Text of The Most Expensive Statement SoftBase Systems Batch Analyzer Version 3.1.0 Row 1 of 3 Command ===> Scroll ===> CSR JobName: HRBKUPQ2 Step: HRBKUPDL Program: DLYRATEX SSID: DB8G Plan: PDGF450 Type: PACKAGE Collid: PDGF450DB8G ------------------------ Performance ---------------------------- CPU as pct of Elapsed.. 65.5 Total Cost..: $6687.90 SQL statement you Average Maximum Total %of Total should tune first! --------- --------- --------- ----- Actual SQL Text is Elapsed.Time... 0.013 6.710 10196.763 95.3 now displayed. CPU Time....... 0.008 0.027 6687.897 94.5 Notice that the Rows Affected.. 96 96 76800000 WHERE clause is -------- SQL Text ( statement number: 559 ) ------------------- written to update UPDATE ACCT_NOTES SET NOTE_TEXT2 = ALL account note records instead of :W-WORKING-STORAGE.W-NEW-INVC-NOTE WHERE CUST_N = one. :DCLACCOUNT.ACCT-CUST-N
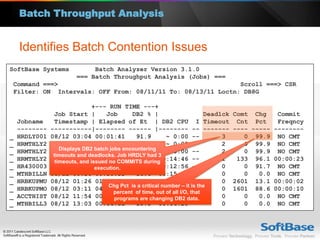
  • 9. Batch Throughput Analysis Identifies Batch Contention Issues SoftBase Systems Batch Analyzer Version 3.1.0 === Batch Throughput Analysis (Jobs) === Command ===> Scroll ===> CSR Filter: ON Intervals: OFF From: 08/11/11 To: 08/13/11 Loctn: DB8G +--- RUN TIME ---+ Job Start | Job DB2 % | Deadlck Comt Chg Commit Jobname Timestamp | Elapsed of Et | DB2 CPU I Timeout Cnt Pct Freqncy -------- -----------|-------- ------ |-------- -- ------- ---- ----- -------- _ HRDLY001 08/12 03:04 00:01:41 91.9 ~ 0:00 -- 3 0 99.9 NO CMT _ HRMTHLY2 08/12 03:04 00:01:05 94.6 ~ 0:00 -- 2 0 99.9 NO CMT Displays DB2 batch jobs encountering _ HRMTHLY2 08/12 03:09 00:01:05 94.7 ~ 0:00 -- 2 0 99.9 NO CMT timeouts and deadlocks. Job HRDLY had 3 _ HRMTHLY2 08/12 19:32issued no COMMITS during timeouts, and 00:51:52 97.4 00:14:46 -- 1 133 96.1 00:00:23 _ HR430003 08/12 00:34 execution. 00:33:48 89.2 00:12:56 -- 0 0 91.7 NO CMT _ MTHBILLN 08/12 00:36 00:30:33 16.6 00:15:01 -- 0 0 0.0 NO CMT _ HRBKUPMU 08/12 01:26 01:31:29 29.1 01:13:45 -- 0 2601 13.1 00:00:02 Chg Pct is a critical number – it is the _ HRBKUPMO 08/12 03:11 04:51:07 63.2 02:55:00 -- 0 1601 88.6 00:00:10 percent of time, out of all I/O, that _ ACCTHIST 08/12 11:54 00:09:23 programs 0.0 00:03:42 -- are changing DB2 data. 0 0 0.0 NO CMT _ MTHBILL3 08/12 13:03 00:06:55 10.8 00:06:20 -- 0 0 0.0 NO CMT
  • 10. Recovery Impact Analysis Identifies Potential Rollbacks SoftBase Systems Batch Analyzer Version 3.1.0 === Recovery Impact Analysis (Jobs) === Command ===> Scroll ===> CSR Filter: ON Intervals: OFF From: 08/11/11 To: 08/13/11 Loctn: DB8G +-- RUN TIME---+ Job Start | Job DB2 %| Deadlck Chg Comit Commit Rollback Jobname Timestamp |Elapsed of Et| I Timeout Pct Cnt Frequncy Estimate -------- -----------|-------- -----|-- ------- ----- ----- -------- -------- _ HRBKUPQ2 08/12 19:33 06:04:56 58.3 -- 0 80.7 2601 00:00:08 05:39:53 _ HRBKUPMO 08/12 03:11 04:51:07 63.2 -- 0 88.6 1601 00:00:10 05:26:30 _ HR430003 08/12 00:34 00:33:48 89.2 -- 0 91.7 0 NO CMT 00:55:22 _ DLYRATEX 08/12 03:04 00:56:13 55.3 -- 0 56.8 1601 00:00:02 00:35:22 _ The Recovery Impact Analysis Report 91.9 -- HRDLY001 08/12 03:04 00:01:41 3 99.9 0 NO CMT 00:01:03 provides an estimate of how long each _ HRMTHLY2 08/12 03:09 00:01:05 94.7 -- 2 99.9 0 NO CMT 00:01:03 DB2 batch program will require to _ HRMTHLY2 08/12 19:32 00:51:52 97.4 -- ROLLBACK any changes it has made 1 96.1 133 00:00:23 00:01:03 _ HRMTHLY2 08/12 COMMIT statement. since the last 03:04 00:01:05 94.6 -- 2 99.9 0 NO CMT 00:01:02 _ HR430002 08/12 17:46 00:47:59 1.0 -- 0 86.4 1 00:47:59 00:00:51 _ HRDLY001 08/12 18:36 00:55:18 96.5 -- 0 97.9 300 00:00:11 00:00:42
  • 11. SoftBase Batch Analyzer Installation Batch Analyzer Installation Procedure  Installation time is usually maximum of 1 – 2 hours  DB2 DBA performs the Batch Analyzer installation – System Programmer SMP type install is not required!  Initial installation is done into a test DB2 environment  DBAs and Developers usually review Batch Analyzer reports after it collects data for several days
  • 12. SoftBase Batch Analyzer POC Batch Analyzer Deployment  Batch Analyzer’s Touch Free Collector can begin gathering performance data for all DB2 batch jobs in seconds –WITHOUT JCL CHANGES  Performance collection overhead is typically 1% - 3% for each Job watched – most customers say it is not even noticeable  Batch Analyzer Touch Free Collector can be started and stopped with a single command  Batch Analyzer does not require a lengthy trial – it either finds significant performance problems immediately or it doesn’t!
  • 13. SoftBase Batch Analyzer Batch Healthcare Solution
  • 14. SoftBase 20 Fall Pippin Lane, Suite 202 Asheville, NC USA 28803 sales@softbase.com support@softbase.com 800-669-7076 © 2011 Candescent SoftBase, LLC SoftBase® is a Registered Trademark. All Right Reserved. Phone: (800) 669-7076 | (828) 670-9900

Editor's Notes

  • #3: SoftBase Batch Health Care Consists of:Attach Facility - DB2 Call Attach which permits DB2 batch applications to be run as native MVS jobstreamsCheckpoint - Checkpoint Facility which permits DB2 batch applications to restart at or near the point of failureBatch Analyzer - DB2 Batch Analysis which pinpoints the most expensive batch applications and SQL statements anywhere in batchDeadLock Advisor - DeadLock-Timeout Reporting that immediately reports on all batch jobs involved in -904/-911 situations.
  • #6: Your most expensive batch job will be at the top of the list of all jobs that ran in the past 24 hour interval.SELECT that job.
  • #7: Your most expensive Step of the batch job you selected will be at the top of the list.SELECT that Step.
  • #8: Your most expensive Statement of the Step you selected will be at the top of the list.SELECT that Statement.
  • #9: The actual SQL Text of the Statement will be displayed. This is the Most Expensive SQL Statement in your entire DB2 batch stream and the one you should tune first.