SlideShare a Scribd company logo
3
Most read
4
Most read
5
Most read
Polytechnic University of the
Philippines
Graduate Studies – College of
Education
Sta. Mesa, Manila
STATISTICAL TOOLS
RSH 731 Dissertation 2
Kathleen C. Abaja
DEM Student
Dr. Milagrina A. Gomez
Course Specialist
SEQUENCE OF
PRESENTATION
DEFINITION
OF
STATISTICS
CORRELATION HYPOTHESIS
CHI-SQUARE
TEST OF
INDEPENDENCE
REGRESSION
ANALYSIS
FACTOR
ANALYSIS
REFERENCES
• Hypothesis :
Alpha
• Hypothesis :
Beta
Statistics Defined
Statistics is the science and practice of developing human
knowledge through the use of empirical data expressed in
quantitative form. It is based on statistical theory which is a
branch of applied mathematics. Within statistical theory,
randomness and uncertainty are modelled by probability
theory. (Wikipedia Encyclopaedia)
What is statistics?
The collecting, summarizing, and analysing of data.
The term also refers to raw numbers, or “stats”, and to the
summarization of data.
Example: Frequencies
Correlation
Correlation
• Correlation is Positive when the values increase together, and
• Correlation is Negative when one value decreases as the other
increases.
Hypothesis
Hypothesis : Alpha
Hypothesis : Beta
Chi-Square Test of Independence
• The test is applied when you have two qualitative variables from a
single population.
• It is used to determine whether there is a significant association
between the two variables.
• For example, in an election survey, voters might be classified by
gender (male or female) and voting preference (BJP, Congress or
AAP).
– We could use a chi-square test for independence to determine
whether gender is related to voting preference
Voting Preferences
Row total
BJP Congress AAP
Male 200 150 50 400
Female 250 300 50 600
Column
total
450 450 100 1000
Chi-Square Test of Independence
Regression analysis
Regression analysis
Illustration of linear regression on a data set.
Factor Analysis
Factor Analysis
Variables
Factor 1 Factor 2
Income 0.65 0.11
Education
0.59 0.25
Occupation
0.48 0.19
House value
0.38 0.60
Number of public parks in
neighborhood
0.13 0.57
Number of violent crimes per
year in neighbourhood
0.23 0.55
Indicators of wealth, with six variables and two resulting factors.
Factor Analysis
• The variable with the strongest association to the underlying
latent variable. Factor 1, is income, with a factor loading of 0.65.
• Since factor loadings can be interpreted like standardized
regression coefficients, one could also say that the variable
income has a correlation of 0.65 with Factor 1. This would be
considered a strong association for a factor analysis in most
research fields.
• Two other variables, education and occupation, are also
associated with Factor 1. Based on the variables loading highly
onto Factor 1, we could call it “Individual socioeconomic status.”
• Notice that the variable house value also is marginally important
in Factor 1 (loading = 0.38). This makes sense, since the value
of a person’s house should be associated with his or her income.
References
• http://
dss.princeton.edu/online_help/analysis/regression_intro.htm
• http://stattrek.com/chi-square-test/independence.aspx
• http://
www.statsoft.com/Textbook/Principal-Components-Factor-An
• http://www.theanalysisfactor.com/factor-analysis-1-
introduction/
• http://mathworld.wolfram.com/HypothesisTesting.html
• https://www.mathsisfun.com/data/correlation.html
Statistical Tools

More Related Content

PPTX
Inferential Statistics
PPTX
Statistical analysis and interpretation
PDF
Introduction to Statistics
PPTX
Types of error in hypothesis
PPTX
Basic Statistics & Data Analysis
PPT
Statistics: Probability
PPTX
The mann whitney u test
PPTX
Introduction to statistics
Inferential Statistics
Statistical analysis and interpretation
Introduction to Statistics
Types of error in hypothesis
Basic Statistics & Data Analysis
Statistics: Probability
The mann whitney u test
Introduction to statistics

What's hot (20)

PPTX
statistic
PPTX
Scatter Diagram
PPTX
Importance of statistics
PPT
Quartile in Statistics
PPTX
Inferential statistics
PPTX
Quantitative Data Analysis
PPTX
Research data interpretation
PPT
Chapter 8 (procedure of data collection)
PPTX
Sampling and sampling distributions
PPT
Correlation
PDF
Chapter 5 part1- The Sampling Distribution of a Sample Mean
PPT
Data organization and presentation (statistics for research)
PPTX
Analysis and interpretation of data
PPTX
LEVEL OF SIGNIFICANCE.pptx
PPTX
One sided or one-tailed tests
PPTX
coefficient correlation
PPTX
What is statistics
PPTX
Tabular and Graphical Representation of Data
PDF
Data Analysis with SPSS PPT.pdf
PPTX
Sample Size Determination
statistic
Scatter Diagram
Importance of statistics
Quartile in Statistics
Inferential statistics
Quantitative Data Analysis
Research data interpretation
Chapter 8 (procedure of data collection)
Sampling and sampling distributions
Correlation
Chapter 5 part1- The Sampling Distribution of a Sample Mean
Data organization and presentation (statistics for research)
Analysis and interpretation of data
LEVEL OF SIGNIFICANCE.pptx
One sided or one-tailed tests
coefficient correlation
What is statistics
Tabular and Graphical Representation of Data
Data Analysis with SPSS PPT.pdf
Sample Size Determination
Ad

Similar to Statistical Tools (20)

PPTX
Statistical tools in research
PDF
Katagorisel veri analizi
DOCX
29510Nominal Data and the Chi-Square TestsJupiterimag.docx
ODP
Power, Effect Sizes, Confidence Intervals, & Academic Integrity
PDF
Econometrics notes (Introduction, Simple Linear regression, Multiple linear r...
DOCX
2019 10 3 Originality ReportinalityReportultraattemptI.docx
PPTX
Introduction to statistical learning - Some basics
PDF
Paktia university lecture prepare by hameed gul ahmadzai
PPTX
Statistical Analysis in Social Science Researches.pptx
PDF
Statistics text book higher secondary
PPT
Introductory_Statistics_Masters student (1).ppt
DOCX
MethodUnderstandingStatisticalSignificanceMatthew .docx
PPT
Lecture-10 Correlation-and-Regression.ppt
PPT
lecture-10----Correlation-and-Regression.ppt
PDF
Factor Analysis - Statistics
PPTX
No support for declining effect sizes over time - Chris C Martin and Gregory ...
PPTX
No support for declining effect sizes over time - SSSP 2014
PDF
Mathematical Biology Research Trends Wilson L Eds
PDF
Business Statistics.pdf
PDF
Business Statistics.pdf
Statistical tools in research
Katagorisel veri analizi
29510Nominal Data and the Chi-Square TestsJupiterimag.docx
Power, Effect Sizes, Confidence Intervals, & Academic Integrity
Econometrics notes (Introduction, Simple Linear regression, Multiple linear r...
2019 10 3 Originality ReportinalityReportultraattemptI.docx
Introduction to statistical learning - Some basics
Paktia university lecture prepare by hameed gul ahmadzai
Statistical Analysis in Social Science Researches.pptx
Statistics text book higher secondary
Introductory_Statistics_Masters student (1).ppt
MethodUnderstandingStatisticalSignificanceMatthew .docx
Lecture-10 Correlation-and-Regression.ppt
lecture-10----Correlation-and-Regression.ppt
Factor Analysis - Statistics
No support for declining effect sizes over time - Chris C Martin and Gregory ...
No support for declining effect sizes over time - SSSP 2014
Mathematical Biology Research Trends Wilson L Eds
Business Statistics.pdf
Ad

More from Kathleen Abaja (20)

PDF
Leadership - Organization and Management
PDF
Theories of Motivation
PDF
Theories of Motivation
PDF
Planning at Different Levels in the Firm
PDF
Delegation & Formal and Informal Organization
PDF
Decision making
PDF
Types of plans
PDF
Nature of planning
PDF
Role of business in relation to the economy
PDF
Systems Theory and X & Y Theory
PDF
Theories of management 2
PDF
Elements of Firm's Environment
PPTX
Definition and function of management
PDF
Roles, skills of a manager
PDF
Theories of management - Scientific, Administrative
DOCX
Trifocalization in the Educational System of the Philippines
DOCX
System Analysis in Education
DOCX
The Complete 101 Collection What Every Leader Needs to Know
PPT
Management of Curriculum and Instruction
PPTX
Research management in higher education institutions
Leadership - Organization and Management
Theories of Motivation
Planning at Different Levels in the Firm
Delegation & Formal and Informal Organization
Decision making
Types of plans
Nature of planning
Role of business in relation to the economy
Systems Theory and X & Y Theory
Theories of management 2
Elements of Firm's Environment
Definition and function of management
Roles, skills of a manager
Theories of management - Scientific, Administrative
Trifocalization in the Educational System of the Philippines
System Analysis in Education
The Complete 101 Collection What Every Leader Needs to Know
Management of Curriculum and Instruction
Research management in higher education institutions

Recently uploaded (20)

PPTX
202450812 BayCHI UCSC-SV 20250812 v17.pptx
PPTX
UV-Visible spectroscopy..pptx UV-Visible Spectroscopy – Electronic Transition...
PDF
medical_surgical_nursing_10th_edition_ignatavicius_TEST_BANK_pdf.pdf
PPTX
Lesson notes of climatology university.
PDF
احياء السادس العلمي - الفصل الثالث (التكاثر) منهج متميزين/كلية بغداد/موهوبين
PDF
Complications of Minimal Access Surgery at WLH
PPTX
Unit 4 Skeletal System.ppt.pptxopresentatiom
PDF
Indian roads congress 037 - 2012 Flexible pavement
PPTX
Digestion and Absorption of Carbohydrates, Proteina and Fats
PDF
Computing-Curriculum for Schools in Ghana
PDF
1_English_Language_Set_2.pdf probationary
PDF
GENETICS IN BIOLOGY IN SECONDARY LEVEL FORM 3
PPTX
Introduction-to-Literarature-and-Literary-Studies-week-Prelim-coverage.pptx
PDF
Hazard Identification & Risk Assessment .pdf
PDF
RMMM.pdf make it easy to upload and study
PDF
Empowerment Technology for Senior High School Guide
PPTX
1st Inaugural Professorial Lecture held on 19th February 2020 (Governance and...
PPTX
Introduction to Building Materials
PDF
SOIL: Factor, Horizon, Process, Classification, Degradation, Conservation
DOC
Soft-furnishing-By-Architect-A.F.M.Mohiuddin-Akhand.doc
202450812 BayCHI UCSC-SV 20250812 v17.pptx
UV-Visible spectroscopy..pptx UV-Visible Spectroscopy – Electronic Transition...
medical_surgical_nursing_10th_edition_ignatavicius_TEST_BANK_pdf.pdf
Lesson notes of climatology university.
احياء السادس العلمي - الفصل الثالث (التكاثر) منهج متميزين/كلية بغداد/موهوبين
Complications of Minimal Access Surgery at WLH
Unit 4 Skeletal System.ppt.pptxopresentatiom
Indian roads congress 037 - 2012 Flexible pavement
Digestion and Absorption of Carbohydrates, Proteina and Fats
Computing-Curriculum for Schools in Ghana
1_English_Language_Set_2.pdf probationary
GENETICS IN BIOLOGY IN SECONDARY LEVEL FORM 3
Introduction-to-Literarature-and-Literary-Studies-week-Prelim-coverage.pptx
Hazard Identification & Risk Assessment .pdf
RMMM.pdf make it easy to upload and study
Empowerment Technology for Senior High School Guide
1st Inaugural Professorial Lecture held on 19th February 2020 (Governance and...
Introduction to Building Materials
SOIL: Factor, Horizon, Process, Classification, Degradation, Conservation
Soft-furnishing-By-Architect-A.F.M.Mohiuddin-Akhand.doc

Statistical Tools

  • 1. Polytechnic University of the Philippines Graduate Studies – College of Education Sta. Mesa, Manila STATISTICAL TOOLS RSH 731 Dissertation 2 Kathleen C. Abaja DEM Student Dr. Milagrina A. Gomez Course Specialist
  • 2. SEQUENCE OF PRESENTATION DEFINITION OF STATISTICS CORRELATION HYPOTHESIS CHI-SQUARE TEST OF INDEPENDENCE REGRESSION ANALYSIS FACTOR ANALYSIS REFERENCES • Hypothesis : Alpha • Hypothesis : Beta
  • 3. Statistics Defined Statistics is the science and practice of developing human knowledge through the use of empirical data expressed in quantitative form. It is based on statistical theory which is a branch of applied mathematics. Within statistical theory, randomness and uncertainty are modelled by probability theory. (Wikipedia Encyclopaedia) What is statistics? The collecting, summarizing, and analysing of data. The term also refers to raw numbers, or “stats”, and to the summarization of data. Example: Frequencies
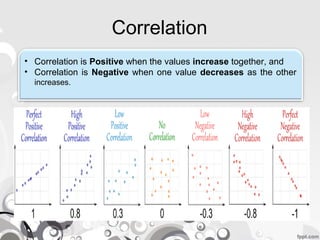
  • 5. Correlation • Correlation is Positive when the values increase together, and • Correlation is Negative when one value decreases as the other increases.
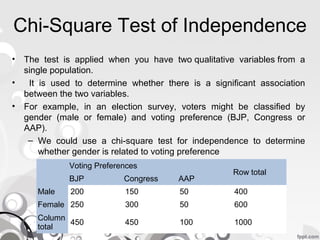
  • 9. Chi-Square Test of Independence • The test is applied when you have two qualitative variables from a single population. • It is used to determine whether there is a significant association between the two variables. • For example, in an election survey, voters might be classified by gender (male or female) and voting preference (BJP, Congress or AAP). – We could use a chi-square test for independence to determine whether gender is related to voting preference Voting Preferences Row total BJP Congress AAP Male 200 150 50 400 Female 250 300 50 600 Column total 450 450 100 1000
  • 10. Chi-Square Test of Independence
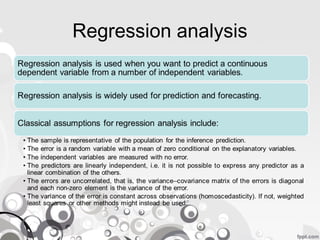
  • 12. Regression analysis Illustration of linear regression on a data set.
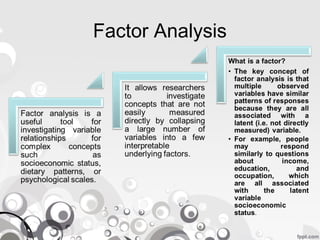
  • 14. Factor Analysis Variables Factor 1 Factor 2 Income 0.65 0.11 Education 0.59 0.25 Occupation 0.48 0.19 House value 0.38 0.60 Number of public parks in neighborhood 0.13 0.57 Number of violent crimes per year in neighbourhood 0.23 0.55 Indicators of wealth, with six variables and two resulting factors.
  • 15. Factor Analysis • The variable with the strongest association to the underlying latent variable. Factor 1, is income, with a factor loading of 0.65. • Since factor loadings can be interpreted like standardized regression coefficients, one could also say that the variable income has a correlation of 0.65 with Factor 1. This would be considered a strong association for a factor analysis in most research fields. • Two other variables, education and occupation, are also associated with Factor 1. Based on the variables loading highly onto Factor 1, we could call it “Individual socioeconomic status.” • Notice that the variable house value also is marginally important in Factor 1 (loading = 0.38). This makes sense, since the value of a person’s house should be associated with his or her income.
  • 16. References • http:// dss.princeton.edu/online_help/analysis/regression_intro.htm • http://stattrek.com/chi-square-test/independence.aspx • http:// www.statsoft.com/Textbook/Principal-Components-Factor-An • http://www.theanalysisfactor.com/factor-analysis-1- introduction/ • http://mathworld.wolfram.com/HypothesisTesting.html • https://www.mathsisfun.com/data/correlation.html