SlideShare a Scribd company logo
Thresholds of Detection for Falling Snow  from Satellite-Borne Active and Passive Sensors  IGARSS 2011 Vancouver, Canada Gail Skofronick Jackson Benjamin Johnson Joe Munchak NASA Goddard Space Flight Center,  Greenbelt, Maryland [email_address]
Presentation Outline Contributions to Brightness Temperatures  Falling Snow Detection Thresholds Analysis framework Active thresholds based on instrument sensitivity Passive thresholds Comparison between active and passive Future improvements Snow Field Campaign (Jan – Feb 2012) Summary
Percentages from  Surface ,  Snow , &  Water Vapor Lake Effect 2-3km tops  (0.5 to 1.0 IWP) Synoptic 5-7km tops  (0.5 to 1.0 IWP) Blizzard ~10km tops  (0.5 to 1.0 IWP) Blizzard ~10km tops  (9 to 10 IWP) “ Surface and Atmospheric Contributions to Microwave Brightness Temperatures for Falling Snow   Events,” by Gail Skofronick-Jackson and Benjamin Johnson, JGR-Atmos, published Jan 2011. (a) (b) (a) (b) Macro and microphysical cloud characteristics affect TB signal These use dendrite snowflakes
Falling Snow Detection Thresholds What are the thresholds of detection in terms of IWP or IWC of falling snow? Analysis Approach: Use WRF models of Lake Effect and Synoptic snow Vertical profiles: IWC, temperature, water vapor profiles Surface: temperature, land classification, snow depth Joint active and passive computations of Z and TB Use Liu’s 2004 DDA tables for abs, scat, asymmetry, & backscatter 11 non-spherical snowflake shapes Adjust N0 to integrate Liu’s min-max DDA sizes to ensure WRF IWC is preserved
(1) Surface Emissivity Part 1 Urban   crop land  deciduous   evergreen/mixed   water Surface Temperature Vegetation Type Snow Depth WRF Simulations Courtesy of W.-K. Tao & team Lake Effect Case Synoptic Snow Case IWP (Jan 20 0400UTC) IWP (Jan 22 0600UTC)
Radar Calculations W-Band (-26dBZ)   Ka-Band (12dBZ)  Ku-Band (18dBZ)  Thresholds of Detection for Falling Snow from Satellite-borne Active and  Passive Sensors by G. Skofronick-Jackson, et al., IEEE TGRS, submit 9/11 These use 3-bullet rosette snowflakes
Reflectivities Depend on Particle Shape  W-Band   Ka-Band  Ku-Band
Reflectivities Depend on Particle Shape  W-Band   Ka-Band  Ku-Band  Ka
Z-Thresholds Depend on Particle Shape  Average IWC Detected   at Surface Assumed minimum instrument Z: Ku: 18 dBZ Ka: 12 dBZ W: -15 dBZ ±One std dev of variability over 11 shapes is plotted Snowflake Shape (#) Ku-Band Ka-Band W-Band Long Hex Col. (0) 0.037 0.020 0.0020 Short Hex Col. (1) 0.037 0.020 0.0019 Block Hexag. Col. (2) 0.039 0.020 0.0020 Thick Hex Plate (3) 0.035 0.019 0.0019 Thin Hex Plate (4) 0.033 0.018 0.0022 3-Bullet Rosette (5) 0.062 0.038 0.0018 4-Bullet Rosette (6) 0.065 0.052 0.0026 5-Bullet Rosette (7) 0.062 0.047 0.0022 Six Bullet Rosette (8) 0.063 0.101 0.0023 Sector Snowflake (9) 0.077 0.049 0.0018 Dendrite Snow (10) 0.079 0.145 0.0032
Radiometer Threshold Procedure Y-Axis: TBhydr – TBclearair  (with perfect surface, etc knowledge) X-Axis: IWP  (max of 6 kg/m 2 ) 3-Bullet Rosette Shape: Red Line = Land surfaces, Blue line = Water Surfaces These use 3-bullet rosette snowflakes 10V  183 ± 3V  166V  89V  37V  183 ± 7V
Radiometer Thresholds Depend on Shape 89V  166V  166V  166H  183 ± 3V  183 ± 7V  166V 22 Jan
Radiometer Thresholds Depend on Snow Vertical Structure and Surface Type Channel (GHz) Total Threshold Cutoff (rounded up) (in K) From 0.05 error in emissivity From 10 o C error in surface T From 10% change in Tprofile From 10% change in RHprof 10 25 14 10 0 0 19 25 14 10 0 0 23 25 14 10 0 0 37 25 13 10 0 0 89 25 13 9 0 0 166 20 11 8 1 1 183±3 5 1 2 1 1 183±7 15 5 6 0 1
Radiometer Thresholds Depend on Snow Vertical Structure and Surface Type Channel (GHz) Total Threshold Cutoff Average Detected IWP Lake  Effect  over  Land Detected IWP Lake Effect  over  Lakes V-pol Detected IWP Lake Effect  over  Lakes  H-pol Detected IWP Synoptic  over  Land Detected IWP Synoptic  over  Lakes  V-pol Detected IWP Synoptic  over  Lakes H-pol 10 25 19 25 23 25 3.2 na na 37 25 1.2 2.0 1.1 89 25 0.4 0.5 1.5 0.5 0.6 0.8 166 20 0.2 0.2 0.2 0.3 0.3 0.3 183±3 5 1.8 na 1.1 1.1 na 183±7 15 0.4 0.4 na 0.6 0.6 na
Active Versus Passive Snow Detection Thresholds of Detection for Falling Snow from Satellite-borne Active and  Passive Sensors by G. Skofronick-Jackson, et al., IEEE TGRS, submit 9/11 Active Avg. Surface IWC Detected:  Ku  Ka  W  Units 0.08 0.07 0.004 g m -3 Simple falling snow conversion (melted snow rate) 1.01 0.93 0.027 mm hr -1 Passive over land Avg. Columnar IWP Detected:  89  166  183±3  183±7 Units Land V-Pol Lake Effect 0.43 0.16 1.85 0.37 kg m -2 Land V-Pol Synoptic 0.53 0.26 1.10 0.63 kg m -2 Simple IWC conversion (correct assumption????) Lake Effect (3 km clouds) 0.14 0.05 0.62 0.12 g m -3 Synoptic (6 km clouds) 0.09 0.04 0.18 0.11 g m -3 Simple falling snow conversion (melted snow rate) Lake Effect (3 km clouds) 1.97 0.61 11.19 1.65 mm hr -1 Synoptic (6 km clouds) 1.11 0.47 2.64 1.36 mm hr -1 Thresholds for passive could be improved with additional information
RGB Composite AMSU-B Emissivity Map Three Color Emissivity Map by Joe Munchak 89 GHz (red),   150 GHz (green),   183 GHz (blue) Darker colors indicate lower emissivities (more reflective)  Missing data (black).
GCPEx Snowfall Campaign  (Near Toronto, Canada Jan.-Feb. 2012) GV Science Radiometer/DPR Snowfall measurement sensitivities to snow type, rate, surface and tropospheric characteristics Physics of snowfall in the column and relation to extinction characteristics Model databases for forward modeling and retrieval development. Approach:  DFIR instrument clusters (account for measurement uncertainty, mitigate wind, complimentary physics) centered around X/W/Ka-KU/MRR radars and a ground-staring radiometer at CARE site. Clusters located under C-band/D3R multi-freq/dual-pol radar umbrella; D3R V-point with W and X-bands or cover clusters in scanning/RHI/spectral sampling modes.  Overfly in-situ aircraft in coordination with DC-8 (APR-2 and CoSMIR radiometer); Pre and post land surface radiative measurements by Ka-Ku and radiometers. O (60 km) O (10 km) 7-8 km 0.4-0.8 km Ht. King City C-band Dual-pol DFIR Clusters x Georgian Bay CARE D3R PSD:    2DVD, Parsivel, POSS,SVI Radar:    Ka/Ku,X,W(2),MRR SWER:  Pluvio, Hot Plate SWE/Depth   L-Band +   -sensor  (Land/Snow)  10-89 GHz Radiometer Aircraft:  DC-8, Citation x
Today’s Messages Falling snow retrievals are complex Challenges being addressed: non-spherical particles surface emissivity (2) Thresholds of Detection Theoretical thresholds of detection are promising Differences between active and passive detection thresholds Thresholds for passive could be improved with additional constraints (3) What matters?  IWP, cloud thickness, surface underneath, snow particle shapes and PSD limits, and more (4) The GCPEx Field Campaign in 2012 will provide data to help address challenges and finalize algorithms.
Questions? Questions? IEEE Geoscience and Remote Sensing Society  Administrative Committee (AdCom) Member Voting is open All GRSS members can vote for new AdCom members Please vote this week at the GRSS booth  or online by Sept. 16, 2011

More Related Content

PDF
TH1.T04.2_MULTI-FREQUENCY MICROWAVE EMISSION OF THE EAST ANTARCTIC PLATEAU_IG...
PPTX
igarss11stiles_ver3.pptx
PDF
Xu_IGARSS11_snow_f.pdf
PPT
Notarnicola_TH2_TO4.2.ppt
PDF
nwood_igarss_2011_rev2.pdf
PPT
TU1.L10.2 - ESTIMATION OF ICE THICKNESS OF TUNDRA LAKES USING ERS–ENVISAT CR...
PPT
Rocca.ppt
PPT
TU2.T10.2.ppt
TH1.T04.2_MULTI-FREQUENCY MICROWAVE EMISSION OF THE EAST ANTARCTIC PLATEAU_IG...
igarss11stiles_ver3.pptx
Xu_IGARSS11_snow_f.pdf
Notarnicola_TH2_TO4.2.ppt
nwood_igarss_2011_rev2.pdf
TU1.L10.2 - ESTIMATION OF ICE THICKNESS OF TUNDRA LAKES USING ERS–ENVISAT CR...
Rocca.ppt
TU2.T10.2.ppt

What's hot (16)

PPT
Validation_SWOT_ground_airborne_Fjortoft.ppt
PPT
Kummerow.1.1B.ppt
PDF
Using GPS to Measure Precipitable Water Vapor in Antarctica
PPTX
Kvt mapping of_icing
PDF
3_derosnay_IGARSS_2011.pdf
PDF
Snow Analysis for Numerical Weather prediction at ECMWF
PPT
IGARSS2011-ppt - Ji Dabin.ppt
PPTX
Sabaghy_Workshop
PPT
Brazil2
PDF
AGU - DEC 2015 - Point Grey Poster-Nov112015
PPTX
Dozier UCLA 2017-04-10
PPT
The Use of WSR_88D radar data at NCEP_2015_AMS_20141222
PDF
Drinkwater ice sheet symposium - tu delft climate inst., 17 oct 2013(1)
PDF
Miren sympo17oct13
PPT
3_Xorbits_InSAR_IGARSS2011.ppt
PPT
Night Water Vapor Borel Spie 8 12 08 White
Validation_SWOT_ground_airborne_Fjortoft.ppt
Kummerow.1.1B.ppt
Using GPS to Measure Precipitable Water Vapor in Antarctica
Kvt mapping of_icing
3_derosnay_IGARSS_2011.pdf
Snow Analysis for Numerical Weather prediction at ECMWF
IGARSS2011-ppt - Ji Dabin.ppt
Sabaghy_Workshop
Brazil2
AGU - DEC 2015 - Point Grey Poster-Nov112015
Dozier UCLA 2017-04-10
The Use of WSR_88D radar data at NCEP_2015_AMS_20141222
Drinkwater ice sheet symposium - tu delft climate inst., 17 oct 2013(1)
Miren sympo17oct13
3_Xorbits_InSAR_IGARSS2011.ppt
Night Water Vapor Borel Spie 8 12 08 White
Ad

Viewers also liked (6)

PPT
5_Glacier_IGARSS11_Eineder.ppt
PPT
2011_0728_IGARSS2011_Motohka.ppt
PDF
TU2.L09.1 - COMPACT POLARIMETRY AT THE MOON: THE MINI-RF RADARS
PDF
FR1.L10.5: SMOS SOIL MOISTURE VALIDATION: STATUS AT THE UPPER DANUBE CAL/VAL ...
PPTX
EVALUATING TRANSFER LEARNING APPROACHES FOR IMAGE INFORMATION.pptx
PDF
Tangent height accuracy of Superconducting Submillimeter-Wave Limb-Emission S...
5_Glacier_IGARSS11_Eineder.ppt
2011_0728_IGARSS2011_Motohka.ppt
TU2.L09.1 - COMPACT POLARIMETRY AT THE MOON: THE MINI-RF RADARS
FR1.L10.5: SMOS SOIL MOISTURE VALIDATION: STATUS AT THE UPPER DANUBE CAL/VAL ...
EVALUATING TRANSFER LEARNING APPROACHES FOR IMAGE INFORMATION.pptx
Tangent height accuracy of Superconducting Submillimeter-Wave Limb-Emission S...
Ad

Similar to Thresholds of Detection for Falling Snow from Satellite-Borne Active and Passive Sensors (20)

PDF
nwood_igarss_2011_rev2.pdf
PDF
nwood_igarss_2011_rev2.pdf
PDF
nwood_igarss_2011_rev2.pdf
PDF
nwood_igarss_2011_rev2.pdf
PPT
TH4.TO4.5.ppt
PPTX
BJohnson_1473_IGARSS_2011_oral_final.pptx
PPTX
BJohnson_1473_IGARSS_2011_oral_final.pptx
PPTX
BJohnson_1473_IGARSS_2011_oral_final.pptx
PDF
Passive Microwave Remote Sensing Of Landatmosphere Interactions Reprint 2020 ...
PDF
Passive Microwave Remote Sensing Of Landatmosphere Interactions Reprint 2020 ...
PPTX
TH3.TO4.1.pptx
PDF
07 big skyearth_dlr_7_april_2016
PPT
aft_4_Luojus_GlobSnow_IGARSS_2011_final.ppt
PPT
1_Arslan_Igarss2011.ppt
PDF
AIAA Paper dlt228
PDF
passive and active remote sensing systems, characteristics and operations
PPT
TH4.TO4.4.ppt
PPT
SPACEBORNE_MICROWAVE_OBSERVATIONS_OF_RAIN 1972-1997.ppt
PPT
SPACEBORNE_MICROWAVE_OBSERVATIONS_OF_RAIN 1972-1997.ppt
PPT
SPACEBORNE_MICROWAVE_OBSERVATIONS_OF_RAIN 1972-1997.ppt
nwood_igarss_2011_rev2.pdf
TH4.TO4.5.ppt
BJohnson_1473_IGARSS_2011_oral_final.pptx
Passive Microwave Remote Sensing Of Landatmosphere Interactions Reprint 2020 ...
TH3.TO4.1.pptx
07 big skyearth_dlr_7_april_2016
aft_4_Luojus_GlobSnow_IGARSS_2011_final.ppt
1_Arslan_Igarss2011.ppt
AIAA Paper dlt228
passive and active remote sensing systems, characteristics and operations
TH4.TO4.4.ppt
SPACEBORNE_MICROWAVE_OBSERVATIONS_OF_RAIN 1972-1997.ppt

More from grssieee (20)

PDF
SEGMENTATION OF POLARIMETRIC SAR DATA WITH A MULTI-TEXTURE PRODUCT MODEL
PPTX
TWO-POINT STATISTIC OF POLARIMETRIC SAR DATA TWO-POINT STATISTIC OF POLARIMET...
PPT
THE SENTINEL-1 MISSION AND ITS APPLICATION CAPABILITIES
PPTX
GMES SPACE COMPONENT:PROGRAMMATIC STATUS
PPTX
PROGRESSES OF DEVELOPMENT OF CFOSAT SCATTEROMETER
PPT
DEVELOPMENT OF ALGORITHMS AND PRODUCTS FOR SUPPORTING THE ITALIAN HYPERSPECTR...
PPT
EO-1/HYPERION: NEARING TWELVE YEARS OF SUCCESSFUL MISSION SCIENCE OPERATION A...
PPT
EO-1/HYPERION: NEARING TWELVE YEARS OF SUCCESSFUL MISSION SCIENCE OPERATION A...
PPT
EO-1/HYPERION: NEARING TWELVE YEARS OF SUCCESSFUL MISSION SCIENCE OPERATION A...
PDF
Test
PPT
test 34mb wo animations
PPT
Test 70MB
PPT
Test 70MB
PDF
2011_Fox_Tax_Worksheets.pdf
PPT
DLR open house
PPT
DLR open house
PPT
DLR open house
PPT
Tana_IGARSS2011.ppt
PPT
Solaro_IGARSS_2011.ppt
PPT
Sakkas.ppt
SEGMENTATION OF POLARIMETRIC SAR DATA WITH A MULTI-TEXTURE PRODUCT MODEL
TWO-POINT STATISTIC OF POLARIMETRIC SAR DATA TWO-POINT STATISTIC OF POLARIMET...
THE SENTINEL-1 MISSION AND ITS APPLICATION CAPABILITIES
GMES SPACE COMPONENT:PROGRAMMATIC STATUS
PROGRESSES OF DEVELOPMENT OF CFOSAT SCATTEROMETER
DEVELOPMENT OF ALGORITHMS AND PRODUCTS FOR SUPPORTING THE ITALIAN HYPERSPECTR...
EO-1/HYPERION: NEARING TWELVE YEARS OF SUCCESSFUL MISSION SCIENCE OPERATION A...
Test
test 34mb wo animations
Test 70MB
Test 70MB
2011_Fox_Tax_Worksheets.pdf
DLR open house
DLR open house
DLR open house
Tana_IGARSS2011.ppt
Solaro_IGARSS_2011.ppt
Sakkas.ppt

Thresholds of Detection for Falling Snow from Satellite-Borne Active and Passive Sensors

  • 1. Thresholds of Detection for Falling Snow from Satellite-Borne Active and Passive Sensors IGARSS 2011 Vancouver, Canada Gail Skofronick Jackson Benjamin Johnson Joe Munchak NASA Goddard Space Flight Center, Greenbelt, Maryland [email_address]
  • 2. Presentation Outline Contributions to Brightness Temperatures Falling Snow Detection Thresholds Analysis framework Active thresholds based on instrument sensitivity Passive thresholds Comparison between active and passive Future improvements Snow Field Campaign (Jan – Feb 2012) Summary
  • 3. Percentages from Surface , Snow , & Water Vapor Lake Effect 2-3km tops (0.5 to 1.0 IWP) Synoptic 5-7km tops (0.5 to 1.0 IWP) Blizzard ~10km tops (0.5 to 1.0 IWP) Blizzard ~10km tops (9 to 10 IWP) “ Surface and Atmospheric Contributions to Microwave Brightness Temperatures for Falling Snow   Events,” by Gail Skofronick-Jackson and Benjamin Johnson, JGR-Atmos, published Jan 2011. (a) (b) (a) (b) Macro and microphysical cloud characteristics affect TB signal These use dendrite snowflakes
  • 4. Falling Snow Detection Thresholds What are the thresholds of detection in terms of IWP or IWC of falling snow? Analysis Approach: Use WRF models of Lake Effect and Synoptic snow Vertical profiles: IWC, temperature, water vapor profiles Surface: temperature, land classification, snow depth Joint active and passive computations of Z and TB Use Liu’s 2004 DDA tables for abs, scat, asymmetry, & backscatter 11 non-spherical snowflake shapes Adjust N0 to integrate Liu’s min-max DDA sizes to ensure WRF IWC is preserved
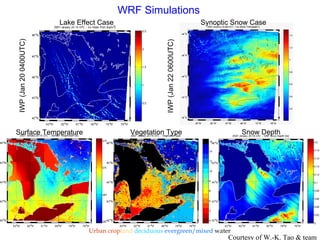
  • 5. (1) Surface Emissivity Part 1 Urban crop land deciduous evergreen/mixed water Surface Temperature Vegetation Type Snow Depth WRF Simulations Courtesy of W.-K. Tao & team Lake Effect Case Synoptic Snow Case IWP (Jan 20 0400UTC) IWP (Jan 22 0600UTC)
  • 6. Radar Calculations W-Band (-26dBZ) Ka-Band (12dBZ) Ku-Band (18dBZ) Thresholds of Detection for Falling Snow from Satellite-borne Active and Passive Sensors by G. Skofronick-Jackson, et al., IEEE TGRS, submit 9/11 These use 3-bullet rosette snowflakes
  • 7. Reflectivities Depend on Particle Shape W-Band Ka-Band Ku-Band
  • 8. Reflectivities Depend on Particle Shape W-Band Ka-Band Ku-Band Ka
  • 9. Z-Thresholds Depend on Particle Shape Average IWC Detected at Surface Assumed minimum instrument Z: Ku: 18 dBZ Ka: 12 dBZ W: -15 dBZ ±One std dev of variability over 11 shapes is plotted Snowflake Shape (#) Ku-Band Ka-Band W-Band Long Hex Col. (0) 0.037 0.020 0.0020 Short Hex Col. (1) 0.037 0.020 0.0019 Block Hexag. Col. (2) 0.039 0.020 0.0020 Thick Hex Plate (3) 0.035 0.019 0.0019 Thin Hex Plate (4) 0.033 0.018 0.0022 3-Bullet Rosette (5) 0.062 0.038 0.0018 4-Bullet Rosette (6) 0.065 0.052 0.0026 5-Bullet Rosette (7) 0.062 0.047 0.0022 Six Bullet Rosette (8) 0.063 0.101 0.0023 Sector Snowflake (9) 0.077 0.049 0.0018 Dendrite Snow (10) 0.079 0.145 0.0032
  • 10. Radiometer Threshold Procedure Y-Axis: TBhydr – TBclearair (with perfect surface, etc knowledge) X-Axis: IWP (max of 6 kg/m 2 ) 3-Bullet Rosette Shape: Red Line = Land surfaces, Blue line = Water Surfaces These use 3-bullet rosette snowflakes 10V 183 ± 3V 166V 89V 37V 183 ± 7V
  • 11. Radiometer Thresholds Depend on Shape 89V 166V 166V 166H 183 ± 3V 183 ± 7V 166V 22 Jan
  • 12. Radiometer Thresholds Depend on Snow Vertical Structure and Surface Type Channel (GHz) Total Threshold Cutoff (rounded up) (in K) From 0.05 error in emissivity From 10 o C error in surface T From 10% change in Tprofile From 10% change in RHprof 10 25 14 10 0 0 19 25 14 10 0 0 23 25 14 10 0 0 37 25 13 10 0 0 89 25 13 9 0 0 166 20 11 8 1 1 183±3 5 1 2 1 1 183±7 15 5 6 0 1
  • 13. Radiometer Thresholds Depend on Snow Vertical Structure and Surface Type Channel (GHz) Total Threshold Cutoff Average Detected IWP Lake Effect over Land Detected IWP Lake Effect over Lakes V-pol Detected IWP Lake Effect over Lakes H-pol Detected IWP Synoptic over Land Detected IWP Synoptic over Lakes V-pol Detected IWP Synoptic over Lakes H-pol 10 25 19 25 23 25 3.2 na na 37 25 1.2 2.0 1.1 89 25 0.4 0.5 1.5 0.5 0.6 0.8 166 20 0.2 0.2 0.2 0.3 0.3 0.3 183±3 5 1.8 na 1.1 1.1 na 183±7 15 0.4 0.4 na 0.6 0.6 na
  • 14. Active Versus Passive Snow Detection Thresholds of Detection for Falling Snow from Satellite-borne Active and Passive Sensors by G. Skofronick-Jackson, et al., IEEE TGRS, submit 9/11 Active Avg. Surface IWC Detected: Ku Ka W Units 0.08 0.07 0.004 g m -3 Simple falling snow conversion (melted snow rate) 1.01 0.93 0.027 mm hr -1 Passive over land Avg. Columnar IWP Detected: 89 166 183±3 183±7 Units Land V-Pol Lake Effect 0.43 0.16 1.85 0.37 kg m -2 Land V-Pol Synoptic 0.53 0.26 1.10 0.63 kg m -2 Simple IWC conversion (correct assumption????) Lake Effect (3 km clouds) 0.14 0.05 0.62 0.12 g m -3 Synoptic (6 km clouds) 0.09 0.04 0.18 0.11 g m -3 Simple falling snow conversion (melted snow rate) Lake Effect (3 km clouds) 1.97 0.61 11.19 1.65 mm hr -1 Synoptic (6 km clouds) 1.11 0.47 2.64 1.36 mm hr -1 Thresholds for passive could be improved with additional information
  • 15. RGB Composite AMSU-B Emissivity Map Three Color Emissivity Map by Joe Munchak 89 GHz (red), 150 GHz (green), 183 GHz (blue) Darker colors indicate lower emissivities (more reflective) Missing data (black).
  • 16. GCPEx Snowfall Campaign (Near Toronto, Canada Jan.-Feb. 2012) GV Science Radiometer/DPR Snowfall measurement sensitivities to snow type, rate, surface and tropospheric characteristics Physics of snowfall in the column and relation to extinction characteristics Model databases for forward modeling and retrieval development. Approach: DFIR instrument clusters (account for measurement uncertainty, mitigate wind, complimentary physics) centered around X/W/Ka-KU/MRR radars and a ground-staring radiometer at CARE site. Clusters located under C-band/D3R multi-freq/dual-pol radar umbrella; D3R V-point with W and X-bands or cover clusters in scanning/RHI/spectral sampling modes. Overfly in-situ aircraft in coordination with DC-8 (APR-2 and CoSMIR radiometer); Pre and post land surface radiative measurements by Ka-Ku and radiometers. O (60 km) O (10 km) 7-8 km 0.4-0.8 km Ht. King City C-band Dual-pol DFIR Clusters x Georgian Bay CARE D3R PSD: 2DVD, Parsivel, POSS,SVI Radar: Ka/Ku,X,W(2),MRR SWER: Pluvio, Hot Plate SWE/Depth L-Band +  -sensor  (Land/Snow) 10-89 GHz Radiometer Aircraft: DC-8, Citation x
  • 17. Today’s Messages Falling snow retrievals are complex Challenges being addressed: non-spherical particles surface emissivity (2) Thresholds of Detection Theoretical thresholds of detection are promising Differences between active and passive detection thresholds Thresholds for passive could be improved with additional constraints (3) What matters? IWP, cloud thickness, surface underneath, snow particle shapes and PSD limits, and more (4) The GCPEx Field Campaign in 2012 will provide data to help address challenges and finalize algorithms.
  • 18. Questions? Questions? IEEE Geoscience and Remote Sensing Society Administrative Committee (AdCom) Member Voting is open All GRSS members can vote for new AdCom members Please vote this week at the GRSS booth or online by Sept. 16, 2011

Editor's Notes

  • #5: At 340GHz and higher, spheres were used instead of Liu non-spheres
  • #11: A 1kg/m^2 threshold of detection for say 89 GHz means that if you distribute that 1kg/m^2 over a 5km cloud thickness (and if I did my math correctly) this means that one would need a surface LIQUID equivalent snow rate of ~3mm/hr (Hence the focus on the blizzard like events in the literature for passive snow events). For 0.5kg/m^2 the liquid equivalent is: 1.25mm/hr
  • #12: A 1kg/m^2 threshold of detection for say 89 GHz means that if you distribute that 1kg/m^2 over a 5km cloud thickness (and if I did my math correctly) this means that one would need a surface LIQUID equivalent snow rate of ~3mm/hr (Hence the focus on the blizzard like events in the literature for passive snow events). For 0.5kg/m^2 the liquid equivalent is: 1.25mm/hr
  • #16: dark=low emissivity, in this case from snow cover from blizzards in December 2006), why the oceans are blue (89=red,150=green,183=blue + emissivity increases with frequency = blue oceans), and why there is missing data (cloud cover or too much water vapor for all channels to "see" surface).