Future of Ports:
Towards Green and Decarbonized Ports
By
Dr.Khalid Bichou
KL, 28-29 Feb 2024
2012-Present
Ports & Logistics
Consultants
Ltd.
Khalid Bichou (PhD, DIC, MSc, FCILT,
FANI)
1991-2012
Khalid BICHOU
PhD (Imperial), MSc (Plymouth), MSc (WMU), BSc (ENA)
www.ports-logistics.com
Consulting and Advisory Research and Academia
• Over 120 consulting & advisory projects
• 100+ countries of work experience
• Senior Advisor EBRD Transport Team
• Maritime Transport Advisor WB/IFC
• Transport Logistics Advisor UNCTAD
• Port Advisor UK House of Commons
• Port and Supply Chain Advisor UKTI
• Maritime and Port Advisor, COMCEC /IOC
• Assessor and Rapporteur TEN-TA
• Intl.Advisor Supply Chain Logistics Group
• Int.Advisor Container Security Laboratory
• Port Policy Advisor EP
• Port, maritime, and transport logistics advisory:
9 port operators, 4 law firms, 6 IFIs, 36 port
and maritime authorities, 12 government
agencies, 7 development agencies.
• Co-founder and member of Intl. Advisory
Board PORTEC (Imperial College)
• Founder and Intl. Advisor Global Port
Research Alliance -GPRA (Imperial College,
MISCI, MIT, Hamburg Uni., HK Polytechnic,
NUS, Univ. of Sydney, Univ. of Sao Paulo,TU
Delft)
• Visiting academic: Imperial College, UCL,
City University, MIT,NUS, HK PolyU,
Middlesex University, Lloyds Maritime
Academy
• Lectured in MSc and PhD courses
• Supervised 22PhDs and 150+ master
students
• Designed and delivered over120 training
workshops & professional courses
• Published 6 books and over 100 articles
• Chartered Member (CILT), International Advisor
(SCLG), Member (IAME), Member (GPF),
Fellow (TEG), Member (GPF), Partner (GFPTT)
Towards Green and Decarbonized Ports (1).pptx
Port Environmental Management
Port environmental risks and concerns
The relationship between ports and environmental risks can be categorised into 4 broad areas:
1. Climate Change
 Rising temperature
 Sea Level Rise
 Extreme Weather Conditions
2. Air Pollution
 GHG emissions from marine and inland systems
 Air pollutants
 Air quality and odour
3. Marine,Water and Soil Pollution
 Biodiversity, water environment and land quality
 Waste management
 Pollution from marine and land base sources
4. Other Environmental Risks and Factors
 Noise
 Landscape and visual impact
 Historical environment
 Community and social impacts
 Traffic impacts and transport network users
Port Environmental Management- Regulatory framework
 1992 UNFCCC
 1997 Kyoto Protocol
 Post-Kyoto 2012
 IMO 2018 Initial GHG Strategy and Short-term measures
 Various ECAs and SECAs
 International Maritime Emission Reduction Scheme (proposition by Norway)
 2005/21 EU Emission Trading Scheme (ETS)
 2008 Climate change levy in the United Kingdom
 Australia’s GHG abatement programme
 Carbon tax and negotiated GHG agreement in New Zealand
 Western Climate Initiative – US and Canada
 Port Climate Change Action, Eco-ports, CARB, etc.
 United Nations Convention on the Law of the Sea, UNCLOS
 Prevention of pollution by sea – London Dumping Convention
 Prevention of pollution by ships – MARPOL
 Oil Pollution Preparedness, Response and Cooperation – OPRC
 International Maritime Dangerous Goods Code (IMDG Code)
 Convention for Safe Containers (CSC)
 Control and Management of Ships' Ballast Water and Sediments (BWM Convention)
 Control of Harmful Anti-Fouling Systems on Ships, 2001 (AFS Convention)
 Biofouling guidelines
 Guidelines on the Provision of Adequate Reception Facilities in Ports
 Code of Safe Practice for Cargo Stowage and Securing (CSS Code)
 International Ship Management (ISM) Code
 IMO Manual on Oil Pollution
 Crude Oil Washing guidelines (COW Systems)
 Procedures for the Control of Ships and Discharges
 Guidelines for the identification and designation of Particularly Sensitive Sea Areas (PSSAs)
 Ship recycling, Hong Kong convention
Maritime Environment -Relevant regulations (IMO)
Port Environmental Management
Climate Change
Risk factor Implications on Ports
 Hot days and heat waves
 Melting ice (for frozen winters)
 Large variations
 Frequent freeze and thaw cycles
 Changes in water chemistry
 SLR
 Extreme weather events
 Challenges to port development and operating practices
 Increased maintenance costs, e.g. for dredging, upgrade, retrofitting, etc.
 Increased energy use; e.g. for refrigerated storage
 Disruptions to service and operational reliability
 Route diversions and loss of competitivity and market share
 Socio-economic, environmental and political implications
 Longer shipping season (NSR), new sea routes ( e.g. NWP)
 Need for new or adapted support services, e.g. SAR, AtoNs, ice-breaking, etc.
Climate change risks and impacts- rising temperature
Source: NOAA Source: IPCC
Climate change risks and impacts- Sea Level Rise
Risk factor Implications on Ports
 MSL
 Flooding and inundation
 Erosion of coastal areas
 Storm surges
 Land subsidence
 Relocation, redesign and construction of port/coastal infrastructure
 Asset protection schemes (e.g. levees, seawalls, dikes, infrastructure elevation)
 Asset Insurance, risk and management practices
 Operational and service disruptions
 Reduction or avoidance of development/settlement in port and surrounding areas
 Provision for evacuation routes and operational plans
Source:
Frederikse
et
al.
(2020)
from
NASA’s
Goddard
Space
Flight
Center/PO.DAAC
Risk factor Direct Impacts on Ports
 Tsunamis  Damage to infrastructure, utilities, superstructure, vehicles and cargo
 Hurricanes  Erosion, sedimentation, subsidence and landslide
 Storm surge  Operational disruptions, reduced visibility and service reliability
 Precipitation & rainfall  Need for emergency evacuations and management
 Strong Winds and fogs  Need for asset protection schemes (e.g. levees, seawalls, dikes, infrastructure elevation)
 MSL, tide and waves  Increased asset insurance premium, adaptation and mitigation costs
Climate change risks and impacts- Extreme weather events
Source:
Munich
Re,
Geo
Risks
Research,
NatCatSERVICE.
As
of
March
2019
Weather related natural catastrophes
Climate
change
planning
and
adaptation
Stages
in
the
climate
adaptation
planning
process
(PIANC,
2020)
Example 1: Port Expansion in Poland
15
Key climate risks:
• Changes in sea ice (positive)
• Sea level rise
• Changes in rainfall intensity
• Changes in wave conditions
Adaptation measures adopted:
• Quayside structures designed to
cope with sea level rise of
approximately 6-10mm per year
over the next 100 years
• Communication channel
established with the Port
Authority to receive relevant
information about sea level
extremes and wave overtopping
of port structures
Example 2: New Port Facility in Morocco
Key climate risks:
• Sea level rise
• Increased storminess
• Increased extreme heat events
Adaptation measures adopted:
• Analyse breakwater design taking into account expected sea-level rise over the design life of
the Port
• installation of surfacing, mechanical and electrical equipment designed to withstand
• projected temperature extremes (>40 degrees C)
• Installation of surface drainage design able to cope with extreme rainfall and overtopping
events
• Installation of storage facilities able to withstand extreme temperatures and extreme weather
events
• Adoption of Emergency Response Plan and Coastal Erosion Monitoring Scheme
16
Scaling up action on climate resilient ports in Morocco
Emerging partnerships to rise to this challenge:
• PIANC Working Group 178 on Climate Change Adaptation
for Ports and Navigation Infrastructure
• Moroccan port authorities will be supported to benefit from
emerging PIANC guidance
• GEF Special Climate Change Fund has awarded USD 6
million grant resources to co-finance innovative investment in
port sector climate resilient upgrades in Morocco
‘la houle exceptionelle’ of January 2014 has raised awareness of climate risks to port
infrastructure in Morocco
Port Environmental Management
Emissions and Air Pollution
Emissions, energy use and air pollution in ports
Sources of emissions and air pollution in ports may be categorised under7 broad areas:
1. Sulphur and exhaust emissions from ships calling at the port
2. Ship GHG emissions (CO2, NOx, PM, Methane, etc.);
3. Emissions and energy use from port buildings and facilities
4. Emissions from cargo handling and operational use
5. Emissions from port crafts / vessels
6. Emissions from hinterland distribution and traffic congestion
7. Air pollution from port development and operations (dust, fumes, vaporisation, chemicals, etc.)
Main emissions of concern
◗ Nitrogen Oxides (NOx):.
◗ Particulate Matters (PM):
◗ Sulphur Oxides (SOx):
◗ VOC (Vloatile Organic Compounds) - Some ports
◗ Some carbon monoxide and unburned hydrocarbons
Source: Port of Los Angeles Inventory of Air Emissions
(2021)
Port emissions by source
Maritime Industry-related Emissions by Category at the port of Los Angeles
PM10
tons
PM2.5
tons
DPM
tons
NOx
tons
SOx
tons
CO
tons
HC
tons
CO2e
tonnes
2020
Ocean-going vessels 52 48 34 2,867 96 273 127 212,248
Harbor craft 24 22 24 721 1 539 82 60,374
Cargo handling equipment 6 5 4 366 2 643 66 165,961
Locomotives 29 27 29 786 1 189 45 65,987
Heavy-duty vehicles 6 6 6 1,075 4 284 43 398,679
Total 117 108 97 5,814 104 1,928 363 903,250
2005
Ocean-going vessels 611 491 450 5,193 4,668 469 215 281,239
Harbor craft 55 51 55 1,318 6 364 87 56,925
Cargo handling equipment 54 50 53 1,573 9 822 92 134,621
Locomotives 57 53 57 1,712 98 237 89 82,201
Heavy-duty vehicles 248 238 248 6,307 45 1,865 368 474,877
Total 1,025 882 863 16,103 4,826 3,757 852 1,029,863
Change between 2005 and 2020 (percent)
Ocean-going vessels -91% -90% -93% -45% -98% -42% -41% -25%
Harbor craft -57% -57% -57% -45% -89% 48% -6% 6%
Cargo handling equipment -89% -89% -91% -77% -81% -22% -28% 23%
Locomotives -48% -49% -48% -54% -99% -20% -50% -20%
Heavy-duty vehicles -98% -98% -98% -83% -92% -85% -88% -16%
Total -89% -88% -89% -64% -98% -49% -57% -12%
Port Emissions and Air Pollution
Ship Related Emissions
Ship emissions in ports
Ship emissions during anchorage / waiting for berth:
• Fuel consumption from Main engines (for limited time queuing)
• Fuel consumption from Auxiliary engines (at all times)
• Fuel consumption from Auxiliary boilers (when Main engines are switched off)
◗ Port characteristics, performance, sequencing and scheduling influence ship queuing and therefore emissions
Ship emissions during approach and pilotage:
• Main engines usually off
• Fuel consumption from Auxiliary engines (higher loads / spikes)
• Fuel consumption from Auxiliary boilers (when Main engines are off)
• Tugboat emissions
◗ Port characteristics and pilotage influence ship manoeuvring and therefore emissions
Ship emissions at berth:
• Main engines turned off (with exceptions)
• Fuel consumption from Auxiliary engines (loads depending on ship specs)
• Fuel consumption from Auxiliary boilers (loads depend on Main engine requirements)
• On cold ironing, only boilers operate
◗ Ship emissions at berth is also influence by port and berth characteristics, handling configurations, bunkering requirements
and availability of cold ironing
Ship sulphur emissions
 The shipping industry has for long been using bunker fuel grades with a high sulphur content, a level that
is not accepted in road or rail transport.
 IMO 2020 regulations require a reduction of ship’s fuel sulphur content to 0.5% max (down from 3.5%
in 2012). For some designated ECAs and jurisdictions, tighter sulphur limits are set to 0.1% max.
 T
o comply with the regulations, ship operators can use one or a combination of many strategies: speed
reduction, retrofitting (EGCS / scrubbers), fuel conversion to (V)LSFO, machinery technology solutions,
fleet renewal and use of alternative fuel.
 For ports, and besides compliance monitoring, ports can invest in V/LSFO bunkering, shore power
and cold ironing (SSP / AMP), and alternative fuel bunkering and storage.
Share of global fleet fitted with scrubber systems (Source: IMCO)
Towards Green and Decarbonized Ports (1).pptx
Ship’s emissions and fuel type
Solutions to reduce ship emissions in ports
◗ Main measures include:
◗ Efficient Ship operations.
◗ Ship’s cleaner fuels.
◗ Ship’s emissions abatement technologies.
◗ Ship-board energy efficiency when in port.
◗ Use of OPS/AMP.
Solutions to reduce ship emissions
◗ Numerous operational and technical measures are available for ship-port emissions reduction
and energy efficiency.
 There are no “one size fit all” technical measure solution for ships and ports.
 The operational measures focus on ship and port energy efficiency, and include reducing ship’s
WT (use virtual arrivals, improve cargo handling, upgrade cargo equipment, coordinate port
management systems, promote JIT, etc.)
◗ The technical measures are quite extensive including engines, boilers, after treatment
technologies, fuel options, etc.
◗ There are solutions underway that focus on the use of alternative maritime power and zero-
emission fuels.
◗ Other initiatives look at economic and market-based measures such abatements, price
incentives, trading schemes, etc.
Port activity emissions and energy use
 Stemming from port activities, buildings, equipment and machinery, etc.
 Specific operations require more energy use; e.g., night operations (lighting), reefer containers,
and building energy requirements
 Most port machinery and vehicles can be procured, retrofitted or converted to run on electricity
and/or other clean fuels.
 Port operations and processes can also be streamlined to reduce energy use and emissions:
 Electrify port equipment
 Reduce queuing and congestion on the water and landside
 Optimize ship and truck/rail planning, scheduling and booking systems
 Minimize idling and
 Optimize cargo (e.g., container) and traffic (e.g., vehicle) management
 Vessel and truck speed reduction programmes
 Reward cleaner ships and inland trucks and vehicles
 Invest in AMP (clod ironing) and cleaner bunker fuels (hydrogen, methanol, ammonia, etc.)
 Implement regulatory and policy measures; first mover advantage
 Introduce emissions trading and market-based measures
Air Pollution from port operations
 Stemming from various port activities and operations including:
 Dust, especially from dry bulk handling, stockpiling, and transportation
 Fumes and vaporizations from O&G and chemical handling and operations
 Odours, especially from chemicals and some dry bulk cargoes
 inflammable toxics from IMDG and HAZMAT types of cargo and operations
 Dark smoke and hazardous substances from fire, explosion and other safety incidents
 Air pollution stemming from industrial and processing sites inside or next to port areas.
 Most regulators impose strict rules and requirements to minimize or eliminate air pollution in ports.
 Requirements for equipment, installations and procedures to minimize dust, fumes, odours, etc.
 Regulations for safe storage and handling for various types of cargoes and products.
 Specific or targeted regulations for the handling of HAZMAT and dangerous goods.
 Certified plans and procedures to assess, manage and mitigate safety, security and air pollution incidents and accidents
GHG emissions- IMO Strategy
 IMO 2018 GHG Initial Strategy aims at reducing sector-wide shipping emissions by at least 50%
by 2050. Other countries and jurisdictions have set tighter and earlier targets.
 T
o achieve low carbon or zero-carbon shipping, the IMO measures are set as short-term
operational and technical measures (2018-2023), medium-term market-based and energy
efficiency measures (2023-2030), and long-term alternative fuel and zero-carbon energy
measures (2030-2050)
 The transition towards maritime decarbonisation will likely require a combination of several
pathways including new (or improved) technologies and operating systems, alternative fuel and
supply and storage infrastructures, innovative business models and financing schemes, and other
associated and supporting measures.
 The success and delivery of each pathway will depend on several factors and uncertainties
around technology’s availability and scalability, level of demand, infrastructure and technical
challenges, costs and prices, and skills development and transition,
 Ports are essential to maritime decarbonisation and transition as they feature in all potential
tools and solutions, and in some cases they constitute the main component of decarbonisation.
In addition, ports themselves have to limit their GHG emissions and must achieve a range of
decarbonisation targets set at local or national levels.
Mapping GHG Solutions: Operational and performance solutions
Zero or minimum costs
Most relevant to old or end life-cycle assets
 Includes policy measures, e.g., IMO Ship Energy Efficiency Management Plan (SEEMP)
High commercial, coordination & supply chain risk
Not relevant to long-term innovation needs
Option/
Solution
Function /Objective Impact
on GHG
Commercial &
Contractual
risks
Policy and
Regulatory
risks
Safety &
Security
risks
Interface &
Coordinatio
n
risks
Speed
Reduction
Slow steaming reduces fuel consumption
and saves energy.
Medium High High Medium Medium
Performanc
e
Management
Systems and Plans to measure, track and
report fuel consumption and improve
energy efficiency
Low Low Medium Medium High
Weathe
r
Routing
Capture emissions onboard, convert or
store them for discharge onshore or at sea
Low High Medium Medium High
Integrated
Planning and
data
sharing
Operational data sharing and integration in
order to optimise ship voyage and port
interface operations, leading to a reduction
in energy use.
Medium Low Low High High
Mapping GHG Solutions: Design and technical solutions
Option/
Solution
Function /
Objective
Impact on
GHG
Technolog
y risk
Policy &
Regulatory
risk
Investment &
Financing
risk
Design and structural
modifications
Changes in ship design parameters and
shipbuilding materials to increase ship’s capacity
and reduce energy use
Medium Medium Low Medium
Retrofitting and
Machinery technology
Retrofitting or installation of onboard equipment
to meet regulatory requirements and extend
asset lifecycle
Medium High Medium Medium
Carbon Capture and
Storage (CCS)
Capture emissions onboard, convert or store
them for discharge onshore or at sea
Medium High Medium High
Energy saving devices
Energy saving and flow conditioning devices to
increase energy efficiency without retrofitting or
design changes
Low Low Low Low
Hull coatings and skin-
drag reductions
Skin friction reductions and hull coatings to save
fuel costs and reduce GHG emissions
Medium Low Low Low
Renewable technology
integration
Hybridisation and intelligent power management,
integration with renewable energy to increase fuel
efficiency and test-pilot renewable systems
Low Low Low High
 Initially rolled out to reduce energy costs
 Includes policy measures, e.g. IMO’s Energy Efficiency Design Index (EEDI/EEXI) and Carbon Intensity rating (CII).
 Offer short-to-medium term transition pathway
 Suffers from technological depreciation, market fluctuations and lender’s risk
Mapping GHG Solutions: zero-carbon energy and fuel technology options
Option/
Solution
Function / Objective
Impact
on GHG
reduction
Technology &
Operational
Risk
Availability
& Scalability
Risk
Investment
and Financing
Risk
LNG Mature, available and scalable technology for use as a step
towards the energy transition
Medium Low Low Medium
Methanol Low cost and proven use. Can be employed in a dual-fuel
engine and make use of existing bunkering facilities
Ver
y
High
Medium Medium Medium
Biofuels
Blending potential with fossil fuels. Lacks global infrastructure
and bunkering facilities but can be distributed through existing
HFO/MGO systems.
Medium Medium Medium Medium
Ammonia
Large-scale potential for use in ocean shipping; has challenges
with supply and mass transport of ammonia.Those can be
resolved by developing liquefied ammonia gas carriers.
Ver
y
High
High Medium High
Hydrogen
Large potential with adaptations to marine engines at an early
development stage. Liquification needed to achieve a
comparable energy density to ammonia and fuel. CCS & land-
side investment would also be required.
Very High High Medium High
Wind & Solar
renewables
Contribute to auxiliary power requirements, but current
technology does not offer sufficient energy density
Medium High
Offer direct route to low or zero carbon shipping
Differences in readiness, cost and scalability
Inter-operability risk with supply and port infrastructure
Provide ready to deploy options for some markets
GHG emissions: Market based measures
Measure types Examples
• Environmentally differentiated rates/dues
• Cap and trade (emissions cap and allowance)
• Baseline and credit system
• Subsidies
• ESG financing
• Industry-led voluntary schemes
• Fairway dues in Sweden, Green Award
Scheme, differentiated tonnage tax in Norway
• Kyoto CDM and JI
• EU ETS
• California Air Investment Programme
• Preferential contracting
• Poseidon principles
• Potential global fuel tax
A carbon levy directly fixes a price for carbon dioxide (usually per ton as in an emissions trading
system) and can be applied as a fuel levy on the carbon content of fossil fuels.As opposed to an
emissions trading system, the emissions reduction outcome is not predetermined but the
carbon price is (non-market-based price setting).
Port Initiatives to Reduce Ship’s Emissions
The formula for the ESI Score is:
2 x ESI NOX+ ESI SOX + ESI CO2 + OPS
3.1
• Some ports have committed themselves to reducing the port-related GHG within an initiative
called the World Port Climate Initiative (WPCI)).
• Ships receive incentives, via calculation and reduction of WPCI’s Environmental Ship Index
(ESI).
• The ESI identifies seagoing ships that perform better the IMO requirements.
• ESI relies on various formulas to cater for NOx, Sox, CO2 and OPS elements.
Green Port Initiatives – Environmental Ship Index (ESI)
• ESI gives a bonus for use OPS and reporting / monitoring of energy efficiency.
• The ESI Score ranges from 0 (for a ship meeting IMO regulations) and 100 (for a ship that emits
no SOx and no NOx and reports or monitors its energy efficiency).
• Currently the best performing ships score at around 40 points.
Green Port Initiatives – Clean Air Programme
◗ A comprehensive initiative used by some ports to address air emissions from shipping and
port operations.
◗ Mainly advocated and implemented by a port authority with input from other
stakeholders.
◗ Program normally includes:
◗ A set of specific emission reduction targets
◗ A roadmap to achieve those targets.
◗ T
o ensure success, the management system style continuous improvement is applied during
implementation
◗ Commitment by the management and staff of port authorities and regulatory agencies are
essential for success.
◗ Monitoring and benchmarking will be part of the implementation process.
◗ This could be comparable to another management plans (e.g. SEEMP) but a different scope
(port environment)
Green Port Initiatives – Norway Tax and Nox Fund
◗ This is a NOx tax applicable mainly to national industries including shipping.
◗ The NOx tax is collected from participating industries and is fed into a NOx fund.
◗ The NOx fund then provides finances to those organisations that want to implement NOx
reduction measures including shipping industry.
◗ This scheme is only applicable to domestic shipping around Norway.
◗ It is an example of an effective local program that tries to create a financail scheme and
business case for NOx reduction.
◗ On the basis of the scheme, a large number of ships have so far been equipped with NOx
reduction technologies.
◗ This fund has also widely finaced major Norwegian initiatives such as the move to LNG as fuel
for ships operating in Norwegian water.
Market based measures-Examples
NOx reduction incentives in port of Gothenburg
Differentiated Port Dues
Differentiated Flag Dues
Singapore-flagged ships registered on or after 1 July 2011, which go beyond the requirements of
the IMO’s EEDI, will enjoy a 50% reduction on the Initial Registration Fees and a 20% Annual
Tonnage Tax rebate. ….
OSP, AMP and Cold Ironing
• On Shore Power (OSP/SP) is known in the industry by various terms: Cold ironing system,
Alternative Maritime Power (AMP), Shore side electricity, and/or Shore power
 OSP is used when ship is stationary at berth to support non-propulsion functions (ventilation,
heating, cooling, pumping, cargo handling, etc.), thus reducing or eliminating air emissions and
noise.
• Supply of power from onshore (port) to ship.
• Allows ships to turn off their engines when in port.
 Small ships with power requirements of less than 50-100 kw, e.g., tugs and fishing vessels, can draw
shore power from normal grid and frequency, as is widely used in most ports around the world.
 For large ships with higher power requirements, dedicated installations and systems are needed
for Alternative Maritime Power (AMP) or cold-ironing:
• Grid capacity upgrade and alternative onsite / local off-grids (wind turbines, solar panels, etc.);
• New port substations, charging points and connectors, frequency convertors/transformers,
• Power Management Systems (PMS) to electronically monitor/control shore power use and peaks in
demand.
• Onboard ship systems’ adaptations for varying voltage and frequency range, control panel, etc.
Source: http://www.cruisecritic.co.uk/
Onshore Power Supply (OPS) – Ship and Shore-side infrastructure
On the land side, the high power cold ironing system consists of the following:
• High voltage grid to the port
• Frequency and voltage convertors/transformers
• Control panels and connection boxes
• Cable reel and connectors
On the ship side the following will have to be installed:
• The grid power solution and the frequency converters typically represent the costliest
elements on the shore side.
• Depending on the availability of grid power and the power requirements, the cost of
installing shore power on the shore side will vary considerably.
• Transformer
• Power distribution system
• Control panel
• Frequency converter (optional for greater flexibility)
• Connectors and cable reel (optional for greater flexibility)
Onshore Power Supply (OPS)
– Typical system specs for the different power requirements
Power Capacity Typical spec
<100kW 230/400/440V – 50/60hz
100 – 500kW 400/440/690V – 50/60hz
500-1000kW 690V/6.6/11kV – 50/60hz
>1MW 6.6/11kV – 50/60hz
Onshore Power Supply (OPS)
– Typical system requirements for different ship types and sizes
Vessel types <= 999
1000 – 4999
GT
5000 – 9999
GT
10000 –
24999 GT
25000 –
49999 GT
50000 – 99999
GT
>= 100000
GT
Oil tankers
230/400/440
V – 50/60hz
400/440/690V
– 50/60hz
690V/6.6/11k
VV –
50/60hz
690V/6.6/11kV
V – 50/60hz
690V/6.6/11kV
V – 50/60hz
6.6/11kV –
50/60hz
6.6/11kV –
50/60hz
Chemical/product
tankers
400/440/690
V – 50/60hz
400/440/690V
– 50/60hz
690V/6.6/11k
VV –
50/60hz
6.6/11kV –
50/60hz
6.6/11kV –
50/60hz
Gas tankers
400/440/690
V – 50/60hz
400/440/690V
– 50/60hz
6.6/11kV –
50/60hz
6.6/11kV –
50/60hz
6.6/11kV –
50/60hz
6.6/11kV –
50/60hz
6.6/11kV –
50/60hz
Bulk carriers
230/400/440
V – 50/60hz
400/440/690V
– 50/60hz
400/440/690
V – 50/60hz
400/440/690V –
50/60hz
400/440/690V –
50/60hz
690V/6.6/11kVV –
50/60hz
General cargo
230/400/440
V – 50/60hz
400/440/690V
– 50/60hz
400/440/690
V – 50/60hz
400/440/690V –
50/60hz
690V/6.6/11kV
V – 50/60hz
Container
s vessels
400/440/690V
– 50/60hz
400/440/690
V – 50/60hz
690V/6.6/11kV
V – 50/60hz
6.6/11kV –
50/60hz
6.6/11kV –
50/60hz
6.6/11kV –
50/60hz
Ro Ro vessels
230/400/440
V – 50/60hz
400/440/690V
– 50/60hz
400/440/690
V – 50/60hz
690V/6.6/11kV
V – 50/60hz
690V/6.6/11kV
V – 50/60hz
6.6/11kV –
50/60hz
Reefers
230/400/440
V – 50/60hz
400/440/690V
– 50/60hz
400/440/690
V – 50/60hz
690V/6.6/11kV
V – 50/60hz
Passengers vessels
230/400/440
V – 50/60hz
400/440/690V
– 50/60hz
400/440/690
V – 50/60hz
690V/6.6/11kV
V – 50/60hz
6.6/11kV –
50/60hz
6.6/11kV –
50/60hz
6.6/11kV –
50/60hz
Offshore supply
vessel
230/400/440
V – 50/60hz
400/440/690V
– 50/60hz
6.6/11kV –
50/60hz
Other offshore
service vessels
230/400/440
V – 50/60hz
400/440/690V
– 50/60hz
690V/6.6/11k
VV –
50/60hz
690V/6.6/11kV
V – 50/60hz
690V/6.6/11kV
V – 50/60hz
690V/6.6/11kVV –
50/60hz
690V/6.6/11kV
V – 50/60hz
Other activities
230/400/440
V – 50/60hz
400/440/690V
– 50/60hz
690V/6.6/11k
VV –
50/60hz
6.6/11kV –
50/60hz
6.6/11kV –
50/60hz
6.6/11kV –
50/60hz
6.6/11kV –
50/60hz
Onshore Power Supply (OPS)
– Estimated cost for implementing shore power on board vessels
vestment cost for
vessel (USD)
1000 – 4999
GT
5000 – 9999
GT
10000 –
24999 GT
25000 –
49999 GT
50000 – 99999
GT
>= 100000
GT
Crude tankers
$50 000 – $350
000
$100 000 –
$400 000
$100 000 –
$400 000
$100 000 –
$400 000
$300 000 –
$750 000
$300 000 –
$750 000
Chemical / product
tankers
$50 000 – $350
000
$100 000 –
$400 000
$300 000 –
$750 000
$300 000 –
$750 000
Gas tankers
$50 000 – $350
000
$300 000 –
$750 000
$300 000 –
$750 000
$300 000 –
$750 000
$300 000 –
$750 000
$300 000 –
$750 000
Bulk carriers
$50 000 – $350
000
$50 000 –
$350 000
0,5 – 3 Mill 0,5 – 3 Mill
$100 000 –
$400 000
General cargo
$50 000 – $350
000
$50 000 –
$350 000
0,5 – 3 Mill
$100 000 –
$400 000
Container vessels $50 000 – $350
000
$50 000 –
$350 000
$100 000 –
$400 000
$300 000 –
$750 000
$300 000 –
$750 000
$300 000 –
$750 000
Ro Ro vessels
$50 000 – $350
000
$50 000 –
$350 000
$100 000 –
$400 000
$100 000 –
$400 000
$300 000 –
$750 000
Reefer
$50 000 – $350
000
$50 000 –
$350 000
$100 000 –
$400 000
Passenger ship
$50 000 – $350
000
$50 000 –
$350 000
$100 000 –
$400 000
$300 000 –
$750 000
$300 000 –
$750 000
$300 000 –
$750 000
Offshore supply ship
$50 000 – $350
000
$100 000 –
$400 000
Other offshore service
ships
$50 000 – $
350 000
$100 000 –
$400 000
$100 000 –
$400 000
$100 000 –
$400 000
$100 000 –
$400 000
$100 000 –
$400 000
Other activities
$50 000 – $
350 000
$100 000 –
$400 000
$300 000 –
$750 000
$300 000 –
$750 000
$300 000 –
$750 000
$300 000 –
$750 000
Fishing vessels
$50 000 – $
350 000
$100 000 –
$400 000
Onshore Power Supply (OPS)
– Need for Standardisation
• No IMO regulation yet.
• There have been proposals to add some new regulations to MARPOL Annex VI; but mainly on
the following topics:
Exemptions:
• For ships with low emissions or high ship-board energy efficient power generation as compared to
OPS.
• Period in port: Not required to connect to OPS when the berth stay is less than some hours.
Availability of OPS: The port shall provide sufficient electrical power to sustain all operations including
peak consumptions.
Cost of OPS electricity: The electricity costs for the ship to connect to shore power at berth should
not exceed the cost of supplied electricity.
• ISO SO/IEC/IEEE 80005-1:2012: Utility connections in port — Part 1: High Voltage Shore
Connection (HVSC) Systems- General requirements; (See https://www.iso.org/standard/53588.html)
Progress made so far…
https://electrek.co/2022/06/08/meet-sparky-the-electric-tugboat-operating-in-the-ports-of-
auckland-with-2784-kwh-of-power/
https://maritime-executive.com/article/video-world-s-first-hydrogen-carrier-departs-japan-on-
maiden-voyage
https://youtu.be/xv-cZt-FpGM
https://youtu.be/JpFOf4jrlpI
https://sea-lng.org/why-lng/
global-fleet/
Relevant Benchmarks and References
CEM Global Ports Hydrogen Coalition (https://www.iea.org/programmes/cem-hydrogen-initiative)
• https://pla.co.uk/Sea-Land-and-Port-Smart-Integration-of-a-Hydrogen-Highway
• https://www.portofamsterdam.com/en/news/how-do-we-safely-bunker-alternative-fuels
• https://cleanairactionplan.org/
• ISO SO/IEC/IEEE 80005-1:2012: Utility connections in port — Part 1: High Voltage Shore
Connection (HVSC) Systems- General requirements; (https://www.iso.org/standard/53588.html )
Initiatives to Reduce Port Emissions
Port Emissions and Energy Use
• Greening port equipment:
• E-RTG, E-STS, E-SL, E-Trains, E-trucks, etc.
• E-mooring, E-reefer plug-ins, E-warehouse systems,
etc.
• Hybrid models re also widely used
• Energy efficiency
• Port efficiency
• Good practices
• Lighting
• Green Training
• Production of Green Energy (wave, offshore wind, etc.)
• Considerations of charging points and voltage lines
• Considerations for energy source, use, grid capacity
• Considerations of energy costs and conversion costs
Electrification of Handling Equipment: Some early adopters in Asia
Port Environmental Management
Marine, water and soil Pollution
Marine, water and soil pollution
 Ballast Water
 Ballast water from one sea area often contains invasive species that disrupt a marine eco system of another area
 IMO Ballast water convention requires ships to discharge ballast water in specific port facilities
 Spills
 Oil spills from ships and ship movements in ports, tanks and tank farms, cargo handling and transfer operations
 Other causes of liquid spills include anti-fouling paint,
 Follow related regulations (MARPOL, OFCIM, IMDG, etc.) and procedures (risk assessment, contingency plans, etc.)
 Sewage and sludges
 Wastewater from ships, port or industrial facilities are prohibited to be discharged directly into sea and port waters.
 Regulation requires ships to notify and dispose of their waste at designated reception facilities, but not all ports have
installed waste reception facilities.
 Solid waste and garbage
 Solid waste and garbage should also be disposed of in special reception garbage areas in the port.
 The solid waste reception areas are often integrated with the local/city system for recycling and waste management.
Other pollution and risks in ports
 Dredging and channel works
 Harbour and quay construction
 Modification of currents
 Alters natural environment
 Habitat loss or degradation
 Accidents, collusion and grounding
 Land and sea contamination
 Industrial effluent
 Hazardous cargo
 Port and area maintenance
Port noise and visual intrusion
 Port noise stems from various sources: ships, machinery, vehicles, etc. and at various stages of
port development and operations.
 Many ports limit noise-producing activities by working zone or time of operation.
 Port visual intrusion takes place where seascape, landscape and visual characteristics of the port
are negatively impacted, especially for port localities depending on tourism or those surrounded
by protected/ preserved areas.
 Often, a Landscape and Visual Impact Appraisal (LVIA) is undertaken prior to port
facility development, expansion or upgrade.
Port Emissions Assessment
Assessment of Environmental Sustainability
• T
o assess environmental sustainability in ports, relevant port data and information should be
regularly collected, assessed, and monitored against established standards.
• Environmental sustainability indicators should cover at least, but are not necessarily limited to
the following areas:
 GHG emissions
 Air pollutants
 Energy use and energy efficiency
 Solid waste
 Liquid waste (incl. oil pollution, ballast water and wastewater)
 Noise pollution
 Light pollution
 Biodiversity
• Ports should be assessed on both their physical infrastructure and operational practices to have
a comprehensive overview of their environmental sustainability. Environmental assessment
frameworks can also use both quantitative and qualitative ranking systems for internal
evaluation and external benchmarking.
Guides and Steps
• To-date, there is no common international standard or regulation for assessing or certifying
port emissions.There are several international guidelines, (e.g. IAPH and WSP) while some
ports have developed their own standards and guidelines.
• In general, port emissions assessment consists of two to three stages:
• Emissions inventories; cataloguing various port emissions sources and their activities,
translate these into energy consumption levels and then translate energy consumption
into emissions.
• Emission metrics and indicators; establishing baselines, targets and benchmarks for
emissions monitoring, control and reduction.
• Emissions forecasts; estimates of future emissions projections based on ship and
vehicle traffic and cargo throughput forecasts and changes in design, equipment and
operations. Forecasts help in port planning and decision making.
Scopes of Emissions Assessment and Reporting
Greenhouse Gas Protocol (GHP) is an internationally accepted set of (accounting) standards
which sets global standards for how to measure, manage and report GHG. Under GHP guidelines,
the terminal operator calculate their emissions taking into consideration all their scope 1and 2
Emissions.
Scope emissions describe the categorisation of GHG emissions into groups to facilitate universal
international accounting and reporting.There are 3 main distinct scopes:
• Scope 1 emissions or direct emissions are GHG emissions from the sources that are
owned or controlled by the reporting entity. For ports, this refers primarily to emissions
from port infrastructures and operations.
• Scope 2 or indirect emissions are GHG emissions specifically from the generation of
purchased or acquired electricity, steam, heat, or cooling consumed by the reporting entity.
• Scope 3 emissions refers to all indirect GHG emissions from all sources whether upstream
or downstream of a value chain and which are not owned or controlled by the reporting
entity directly.
Carbon offsetting, Insetting and Neutrality
 Offsetting describes the climate action that enables individuals and organisations to
compensate for their emissions, by supporting worthy projects that reduce emissions
somewhere else.
 More specifically, it is a term used to describe the act of reducing GHG emissions or
increasing GHG removals through activities external to an activity or outside of the supply
chain, to reduce the net contribution to global emissions.
 Offsetting is typically arranged through a marketplace for carbon credits or other exchange
mechanism. Offsetting claims are only valid under a rigorous set of conditions, including
ensuring that the reductions/removals involved are additional, not over-estimated, and
exclusively claimed.
 Insetting is similar of offsetting but whilst the principles are the same it differs as it applies to
a company offsetting its emissions through a project within its own value chain
 Carbon neutrality is where carbon emission generated, throughout the life cycle of the
product/activity, are removed during the same cycle as a result of carbon reduction measures
such as environmental actions, carbon capture, operational efficiencies, use of green fuels and
renewables, as well as carbon offsetting and insetting.
Planning for emission assessment
A general framework for planning emission assessment follows 10 generic steps:
1. Catalogue and group drivers
2. Define intended uses
3. Select air pollutants
4. Select emissions sources
5. Select geographical and operational domains
6. Identify outside emissions sources near port
7. Select inventory period and frequency
8. Identify documentation and reporting requirements
9. Select level of detail
10. Select assessment platform
Cataloguing group drivers
ERS – Emissions reduction strategy
CSR – Corporate social responsibility
Examples of priority grouping of drivers for a port emissions assessment (WPCT)
Selecting environmental pollutants and GHG
Pollutants and GHG Main categories
Pollutants • Nitrogen oxides (NOx)
• Particulate matter7 (PM), which is further
classified by size: PM10 and PM2.5
• Sulphur oxides (SOx)
• Volatile organic compounds (VOCs)
• Carbon monoxide (CO)
GHG • Carbon dioxide (CO2)
• Nitrous oxide (N2O)
• Methane (CH4)
Scoping / selecting emission sources
Emission source category Coverage
Mobile Cargo handling equipment
Trucks and vehicles
Railroad vehicles and locomotives
Port owned vessels
Seagoing and domestic vessels
Construction equipment
Stationary Electrical grids
Power Plant
Power generators
Industrial
facilities
Buildings and
offices
Other stationary
facilities:
wastewater
plants, reception
facilities, ops.
sites, ..
Purchased Electricity Lighting, instrumentation, comfort cooling, computers, ventilation, etc.
Employee Commuting Emissions from the transportation of employees between their homes and
worksites.
 Scope 1: Mobile + Stationary + Employee Commuting (Authority)
 Scope 2: Purchased Electricity (Authority)
 Scope 3 : Mobile + Stationary + Purchased Electricity + Employee Commuting (Tenants)
Select Operational boundaries and identify emissions near ports
In tandem with emissions properly, the port should select the geographical and operational
boundaries to be included in (excluded from) emissions inventory and assessment.
 The Port of Rotterdam has limited its geographical domain to include its administrative
boundary and its operational domain to its owned and operated emissions sources.
 The Hamburg Port Authority has limited its emissions inventory to the local port
administrative boundary.This boundary was set in conjunction with the Hamburg
environmental agency’s emissions inventory geographical domain.
 Port of Vancouver Port Emission Inventory includes cargo-related and administrative
emissions sources and includes an overwater and overland boundary related to the air
quality modelling domain for Metro Vancouver (greater than the port’s administrative
boundary).
 PLOA/PLOB geographical domain includes all cargo operational boundaries, extends inland
to cover a city-port area of 10 million inhabitants and waterside to 130 nm out to sea.
Select assessment platforms
 Internal: Spreadsheets, desktop database, server-based database, etc.
 External: Off the shelf tool calculators (commercial, governments, NGOs,
etc.)
 Purpose built: Purpose built software by external consultants or internally.
Emissions estimating methods
 Ships:
• General data: tanker, containership, bulker, tugs, dredgers, river boats,
etc.
• Technical data: age, speed, engine, load factor, etc.
• Operation data: manoeuvring, transit, stationary/berthing
• Geographical domain data: by anchorage/terminal/port site
• Fuel type: HFO, LFO,VLFO, LNG, etc.
 Equipment and Vehicles
• Type: crane, truck, vehicle, etc.
• Technical data: model, age, engine, certification, etc.
• Energy data: fuel type, rated power, etc.
• Activity data: hours of ops., load factor, energy consumption, etc.
• Geographical domain data: yard, terminal, port, hinterland, etc.
Emissions estimating methods: Some equations for ships
Ei = Energyi x EF x FCF x CF
Where:
Ei =
Energyi =
EF =
FCF =
CF =
emissions by operating mode i
energy demand by mode i, calculated using Equation 2 below as the energy output of the
engine(s) or boiler(s) over the period of time, kWh
emission factor, expressed in terms of g/kWh, depends on engine type, IMO NOx
standards and fuel used
fuel correction factor, unitless
control factor(s) for emissions reduction technologies, unitless
Ei = Loadi x Activityi
Where:
Energyi =
Loadi =
energy demand by mode i, kWh
maximum continuous rated (MCR) power times load factor (LF) for propulsion engine
power, kW; reported operational load of the auxiliary engine(s), by mode i, kW; or
operational load of the auxiliary boiler, by mode i, kW
Activityi = activity for mode i, hours
Activityi = Di / Speedi
Where:
Activityi = activity, hours
Di = distance travelled while in mode i, nautical
miles Speedi = actual ship speed by mode i, knots
Emissions
Energy
Activity
Emissions estimating methods: Some equations for equipment
Emissions
Energy
E = Fuel Consumption x EF x FCF x
CF
Where:
E =
Fuel Consumption =
EF =
FCF =
CF =
emissions, grams/year
fuel consumed, litres
emission factor, grams
of pollutant per gallon
of fuel consumed,
g/litre
fuel correction factors are used to adjust from a base fuel associated with
the EF and the fuel being used, dimensionless
control factor to reflect changes in emissions due to installation of
emissions reduction technologies not originally reflected in the emission
factors, dimensionless
E = Energy x EF x FCF x CF
Where:
E =
Energy =
EF =
FCF =
CF =
emissions, grams/year
energy demand per engine, kWh, calculated using Equation 10
emission factor, grams of pollutant per unit of work, g/kWh or g/hp-hr, depends on
engine type, emissions standards applicable in the region of operation and fuel type
fuel correction factors are used to adjust from a base fuel associated with the EF and the
fuel being used, dimensionless
control factor to reflect changes in emissions due to installation of emissions reduction
technologies not originally reflected in the emission factors, dimensionless
Developing metrics
 Asset based
 Activity base
 Emission base
 Baseline
 Forecast
Emissions-based
emissions/time period total PM tonnes/year
total NOx tonnes/year
total CO2e tonnes/year
seagoing vessel PM tonnes/year
cargo handling equipment NOx tonnes/year
heavy duty vehicle CO2e tonnes/year
bulk ship PM tonnes/year
cargo handling equipment NOx tonnes/year
rubber-tyred gantry PM tonnes/year
assist tug NOx tonnes/year
grid-based CO2e tonnes/year
emissions/cargo throughput total PM tonnes/tonne
container-related NOx tonnes/10,000 teus
bulk liquid-related CO2e tonnes/barrel
containership PM tonnes/10,000 teus
cargo handling equipment NOx tonnes/tonne
heavy duty vehicle CO2e tonnes/10,000 teus
cruise ship PM tonnes/passenger
crane NOx tonnes/10,000 teus
grid-based CO2e tonnes/tonne
locomotive NOx tonnes/10,000 teus
general cargo ship CO2e tonnes/tonne of steel
Emission reduction plans
A general framework for an emissions reduction plan follows 10 generic steps:
1. Select target pollutants for reduction
2. Selection reduction targets
3. Evaluate emission inventory data
4. Review emission programmes of other ports
5. Benchmark in time series
6. Benchmark in cross-sectional
7. Review and monitor
8. Identify corrective actions
9. Develop implementation plan
10. Formalise implementation plan
Green Port Benchmarks
Green Port Road Map
GPH and Environmental Reporting
• GHG emissions are usually measured by using CO2-conversion factors recommended by GHP.
UK DEFRA are widely used in the UK and elsewhere, covering all types of fuels.
• The adoption of common CO2-conversion factors are important to ensure common
standards.
• Other common denominators include the ‘number of boxes entering and leaving the terminal”.
So total GHG emissions are divided by the number of boxes / containers handled to lead to a
KgCO2e/box.The same approach is used for other cargo (e.g., KgCO2e/ton)
GPH and Environmental Reporting
Green Port Benchmarks- Dredging Management Plan
Examples of analogous plan:
•In 2003 the Port of London Authority (PLA) published the Maintenance Dredging Framework for the Thames
to guide decisions on maintenance dredging and ensure sustainability.This Framework provides for the
coordinated assessment and management of dredging operations on the tidal Thames and includes the
consideration of any likely impacts on designated conservation sites.
•Wheatstone Project - Dredging and Dredge Spoil Placement Environmental Monitoring and Management Plan.
This is a state of the art plan, made for a project in an area with very sensitive habitats (e.g. corral). It may be
too complex for the PoB situation, but it is always easier to simplify a good plan than to start from scratch.
Recommendation on the structure of the plan should be based on the following guidance
documents:
• OSPAR Guidelines for the Management of Dredged Material at Sea (Agreement 2014-06);
•Technical Annex included in both the OSPAR and HELCOM guidelines to minimize the effects on the
environment of dredging operations as far as practicable;
•PIANC, IADC and CEDA dredging guidance documents for monitoring and management of dredging
activities.
• Environmental, Health and Safety Guidelines for Ports, Harbours and Terminals (IFC, 2017); and
• General EHS Guidelines - Waste management guidance for non-hazardous and hazardous waste
(IFC, 2017).
Green Port Benchmarks- Cold Ironing in European Ports
In the Port of Rotterdam for example there is a prohibition for inland vessels to use their power
generators and all inland ships must use shore power instead of generator power.
16 Megawatt power supply in Kristiansand for cruise ships
10 Megawatt shore installation entered service at the German port of Cuxhaven, in the North
Sea, west of Hamburg, in May 2018
Other installations are also under consideration or under way in ports in Northern Europe
including the ports of Antwerp,Amsterdam, Bremen, Gothenburg, the Hamburg Port Authority,
Port of Le Havre, Stadtwerke Lubeck,̈ port of Kiel, and the port of Copenhagen/Malmö.
Green Port Benchmarks- Air Emissions in European Ports
Emission inventory:
• Port of London Emission Inventory 2016.
• Port of Long Beach Air Emission inventory 2017-Present
Incentive schemes on reduction of carbon emissions
•Port of Rotterdam ambition: energy transition leader.The Port of Rotterdam Authority stimulates the use of
clean shipping fuels by offering incentives to inland shipping (e.g. the Environmental Ship Index and the discount
on port dues for inland shipping) and by lobbying to reduce the sulphur content in shipping fuels, for example
(IMO 2020), as well as by contributing to research on climate-friendly production technology.The study
commissioned in 2018 by the Port of Rotterdam, Deep decarbonisation pathways for transport and logistics
identified the following pathways: energy efficiency, modal shift and fuel shift.
• Hamburg Port Authority: LNG, shoreside power and more.
•Port of London Authority introduced in January 2017 the UK’s first Green Tariff, incentivising operators to use
cleaner vessels. It exceeds the standards set by the International Maritime Organisation.
• In 2011, the Hamburg Port Authority (HPA) has introduced a discount on port dues for environmentally
friendly ships, the so-called Green Port Fee (based Environmental Ship Index).
• Cleaner Air Strategy 2018-2025 Port of Southampton.
Hydrogen fuel cells:
• Ports of Auckland to build Auckland’s first hydrogen production and refuelling facility
•Valencia Launches Hydrogen Pilot Scheme
•Toyota has unveiled the second iteration of its hydrogen fuel cell electric Class 8 truck which will help clean
up emissions at the Ports of Long Beach and Los Angeles.
Port Environmental Certification
Relevant ISO Standards
 ISO 14001: Environmental management systems
 ISO 14064: Quantifying and reporting GHG
 ISO 14090:Adaptation to Climate Change
 ISO 14083: GHG from transport chain operations
 ISO 16304: Marine environment protection
 ISO 50001: Energy management systems
ESPO EcoPorts PERS
 The Port Environmental Review System (PERS) does not only incorporate the main general
requirements of recognised environmental management standards (e.g. ISO 14001), but also takes
into account the specificities of ports. PERS builds upon the policy recommendations of ESPO
and gives ports clear objectives to aim for.Its implementation is independently reviewed by
LRQA Nederland B.V.A PERS certification is valid for a period of 2 years.
 Self Diagnosis Method (SDM) is user-friendly environmental checklist comprised of three parts:
- SDM checklist: Filling in the SDM checklist is your 'passport' to the EcoPorts network.
- SDM Comparison: Compare your SDM score with the European average
- SDM Review: Review your SDM score and receive expert's advice and customised
recommendations.
 SDM is a checklist that allows you to identify and reflect on environmental risks in your port.
Aggregated and anonymised data provided by EcoPorts members are used to build and update
the sector’s benchmark of performance in environmental management. A completed SDM is valid
for a period of 2 years.
IAPH World Ports Sustainability Awards
 The objective of E(S)IA is to identify the most environmental parameters spanning pollutants,
emissions, waste and noise during both construction and operation phases; emphasize their
negative impacts and externalities, and propose recommendations, measures and action plans for
mitigation
 ESIA has three dimensions depending on the Project Category:
 Scoping exercise;
 Preliminary assessment, or
 Detailed assessment
 ESIA preparation shall be caried out in accordance with national regulations and procedural
guidelines as well as those of IFIs and MDBs. ESIA often includes a public consultation
component.
 Any EIA starts with the collection of baseline project data and environmental parameters
including the physical environment (geology, geography, hydrology), climate, air quality, noise,
soil and ground water pollution, biodiversity, and protected areas where applicable.
Port Environmental Management
Environmental (and Social) Impact Assessment E(S)IA
EIA
 The objective of EIA is to identify the most environmental parameters spanning pollutants,
emissions, waste and noise during both construction and operation phases; emphasize their
negative impacts and externalities, and propose recommendations, measures and action plans for
mitigation
 EIA has three dimensions depending on the Project Category:
 Scoping exercise;
 Preliminary assessment, or
 Detailed assessment
 EIA preparation shall be caried out in accordance with national regulations and procedural
guidelines as well as those of IFIs and MDBs. ESIA often includes a public consultation
component.
 Any EIA starts with the collection of baseline project data and environmental parameters
including the physical environment (geology, geography, hydrology), climate, air quality, noise,
soil and ground water pollution, biodiversity, and protected areas where applicable.
Some environmental elements of a port project
Ecological Characteristics
Natural habitats
Flora
Fauna
Natural drainage
Surface features
General
environmental
quality
Air Quality (including GHG emission)
Noise Level
Ground Water Quality
Soil and surface deposits
Public and Private Services
Transportation services
Drinking water supply
Sewage services
Energy services
Education
Health care facilities
Housing
Emergency services
Traffic flow
Parking
Public security
Shopping
Socioeconomic Elements
Local economy
Accessibility to public services
Community development potential
Land use pattern
Aesthetic and Cultural Aspects
Attractiveness and view opportunities
Archaeological, landmarks and historical sites
Environmental impacts during a port or terminal life-cycle
Planning and site selection Construction Operation
• Land acquisition
• Acquisition of the land and areas
necessary for the “right of way”
• Site surveys and investigations
• Increased truck traffic (construction
material and waste)
• Vehicle/construction equipment
parking/storage outside the
site
• Base camp establishment and
operation
• Workers’ accommodation
• Construction activities at areas accessible
to the public.
• Workers' activities and construction site
management
• Levelling, land clearing and
earthworks/railway embankment
• Paving/asphalting
• General construction
• Noise generation
• Air pollution emissions
• Hazardous emissions
• Water consumption
• Increased truck traffic
• Railway traffic
• Vehicular emissions
• On-site train sidings (rail yard)
• Truck loading area
• Container Storage areas (yard)
(including refrigerated containers)
• Engineering workshops
• Customs and Health inspection
sites
• Administrative offices
• Solid waste management
• Infrastructure buildings
• Main incoming power sub-station
• Power distribution sub-stations
• Generator house
• Pumps house
• Fire pumps house
• Fuel storage and fuel filling
stations
THANK
YOU
Dr.Khalid BICHOU
Email:
Khalid.Bichou@ports-logistics.com
admin@ports-logistics.com
Web:
www.ports-logistics.com
www.imperial.ac.uk/cts
www.portec.org.uk
www.gpra.info

More Related Content

PPTX
Towards Green and Decarbonized Ports edited.pptx
PDF
Climate change impacts and the need for adaptation.pdf
PDF
Mr. Lluis Tarafa IDOM consulting Investing in Geen Ports Initiatives
PDF
document.pdf
PDF
Ocimf annual report_2013
PDF
Andrea Marroni - Expert Leader - Climate Change, AF - Mercados EMI Europe
PDF
3. IMO regulatory by Mr. Kang(Korea).pdf
PPTX
Envisum first_results_2017
Towards Green and Decarbonized Ports edited.pptx
Climate change impacts and the need for adaptation.pdf
Mr. Lluis Tarafa IDOM consulting Investing in Geen Ports Initiatives
document.pdf
Ocimf annual report_2013
Andrea Marroni - Expert Leader - Climate Change, AF - Mercados EMI Europe
3. IMO regulatory by Mr. Kang(Korea).pdf
Envisum first_results_2017

Similar to Towards Green and Decarbonized Ports (1).pptx (20)

PDF
Shipping One Sheet
DOCX
The research focuses on investigating into the type and amount of ship-gener...
PPT
maritime safety at sea and why it is important .ppt
PPTX
Marine Pollution
PPT
Maritime operation assignment imo
PPT
The Port Environment – Emissions, Issues and Action
DOCX
Shipping in the Arctic My Arctic your ArcticM.K Afenyo, PhD.docx
DOCX
Shipping in the Arctic My Arctic your ArcticM.K Afenyo, PhD.docx
PDF
RAMSSES_Final_Conference_05_Keynote_Research_projects_BV.pdf
PDF
MRV - Monitoring & Reporting - A Brief Explanation
PPTX
8. IMPACT ANALYSIS (PHE) GTU 3170623
PPTX
Improved Marine Meteorological Services
PPTX
Development of regulations for the offshore wind energy sector - Crew transfe...
PDF
Colombia seaport maritime industry
PDF
RESULTS OF A WORKING GROUP OF THE EUROPEAN COMMISSION CONSISTING OF REPRESEN...
PDF
50 years working together against oil pollution from ships
 
PPTX
Impact of environmental protection requirements on the design
PPTX
Environmental Considerations in Port Development: Balancing Growth and Sustai...
PDF
Dr Michael Bull, Arup - How much do shipping and ports contribute to air qual...
PPTX
SUNY Maritime and Lyceum Northwestern University project (1).pptx
Shipping One Sheet
The research focuses on investigating into the type and amount of ship-gener...
maritime safety at sea and why it is important .ppt
Marine Pollution
Maritime operation assignment imo
The Port Environment – Emissions, Issues and Action
Shipping in the Arctic My Arctic your ArcticM.K Afenyo, PhD.docx
RAMSSES_Final_Conference_05_Keynote_Research_projects_BV.pdf
MRV - Monitoring & Reporting - A Brief Explanation
8. IMPACT ANALYSIS (PHE) GTU 3170623
Improved Marine Meteorological Services
Development of regulations for the offshore wind energy sector - Crew transfe...
Colombia seaport maritime industry
RESULTS OF A WORKING GROUP OF THE EUROPEAN COMMISSION CONSISTING OF REPRESEN...
50 years working together against oil pollution from ships
 
Impact of environmental protection requirements on the design
Environmental Considerations in Port Development: Balancing Growth and Sustai...
Dr Michael Bull, Arup - How much do shipping and ports contribute to air qual...
SUNY Maritime and Lyceum Northwestern University project (1).pptx
Ad

Recently uploaded (20)

PPTX
earthgworm a nd its reproductive systemon.pptx
PPTX
FINANCIAL MARKETS 05Av ghg6ggjgt gygffghuhjggv gvgf. hg
PPTX
climate change (environmental studies).pptx
DOCX
Aluminum Geodesic Dome Roof for Raw Water Tanks Shields Untreated Water from ...
PPTX
Black Minimal Nature Beautiful Presentation.pptx
DOCX
Aluminum Geodesic Dome Roof for Bulk Solid Storage Tanks Provides a Lightweig...
PPTX
Ph. D. progress Seminar-Hritankhi Tripathy.pptx
PPT
Bahan kuliah Pecemar Water pollution.ppt
PPTX
IMPERYALISMO MJIOAJOAINCIUHAUINIANUHIBAISN
PPTX
Geographic Information Systems ( GIS)-1.pptx
PPTX
Noise Pollution and its effects on health and Enviroment
PPTX
Forest and wildlife Presentation for the students
PDF
Ontologies in an Open Knowledge Network: The Example of Hydro Ontologies
PDF
AReviewonClimateChangeanditsImpactonAgricultureinIndia.pdf
PPTX
LESSON 2 community health and environmental health
PPTX
Flood management in Bangladesh with respect to the disaster management cycle
PPTX
Rainwater Harvesting Methods and Techniques for Sustainable Water Management”
PPTX
MITIGATION OF HUMAN – WILDLIFE CONFLICT - Copy.pptx
PPTX
STUDY OF POULTRY FARM MANAGEMENT PRACTICES IN KAMSAGARA, KADUR TQ..pptx
PPT
地信专业英语.ppt地信专业英语.ppt地信专业英语.ppt地信专业英语.ppt
earthgworm a nd its reproductive systemon.pptx
FINANCIAL MARKETS 05Av ghg6ggjgt gygffghuhjggv gvgf. hg
climate change (environmental studies).pptx
Aluminum Geodesic Dome Roof for Raw Water Tanks Shields Untreated Water from ...
Black Minimal Nature Beautiful Presentation.pptx
Aluminum Geodesic Dome Roof for Bulk Solid Storage Tanks Provides a Lightweig...
Ph. D. progress Seminar-Hritankhi Tripathy.pptx
Bahan kuliah Pecemar Water pollution.ppt
IMPERYALISMO MJIOAJOAINCIUHAUINIANUHIBAISN
Geographic Information Systems ( GIS)-1.pptx
Noise Pollution and its effects on health and Enviroment
Forest and wildlife Presentation for the students
Ontologies in an Open Knowledge Network: The Example of Hydro Ontologies
AReviewonClimateChangeanditsImpactonAgricultureinIndia.pdf
LESSON 2 community health and environmental health
Flood management in Bangladesh with respect to the disaster management cycle
Rainwater Harvesting Methods and Techniques for Sustainable Water Management”
MITIGATION OF HUMAN – WILDLIFE CONFLICT - Copy.pptx
STUDY OF POULTRY FARM MANAGEMENT PRACTICES IN KAMSAGARA, KADUR TQ..pptx
地信专业英语.ppt地信专业英语.ppt地信专业英语.ppt地信专业英语.ppt
Ad

Towards Green and Decarbonized Ports (1).pptx

  • 1. Future of Ports: Towards Green and Decarbonized Ports By Dr.Khalid Bichou KL, 28-29 Feb 2024
  • 2. 2012-Present Ports & Logistics Consultants Ltd. Khalid Bichou (PhD, DIC, MSc, FCILT, FANI) 1991-2012
  • 3. Khalid BICHOU PhD (Imperial), MSc (Plymouth), MSc (WMU), BSc (ENA) www.ports-logistics.com Consulting and Advisory Research and Academia • Over 120 consulting & advisory projects • 100+ countries of work experience • Senior Advisor EBRD Transport Team • Maritime Transport Advisor WB/IFC • Transport Logistics Advisor UNCTAD • Port Advisor UK House of Commons • Port and Supply Chain Advisor UKTI • Maritime and Port Advisor, COMCEC /IOC • Assessor and Rapporteur TEN-TA • Intl.Advisor Supply Chain Logistics Group • Int.Advisor Container Security Laboratory • Port Policy Advisor EP • Port, maritime, and transport logistics advisory: 9 port operators, 4 law firms, 6 IFIs, 36 port and maritime authorities, 12 government agencies, 7 development agencies. • Co-founder and member of Intl. Advisory Board PORTEC (Imperial College) • Founder and Intl. Advisor Global Port Research Alliance -GPRA (Imperial College, MISCI, MIT, Hamburg Uni., HK Polytechnic, NUS, Univ. of Sydney, Univ. of Sao Paulo,TU Delft) • Visiting academic: Imperial College, UCL, City University, MIT,NUS, HK PolyU, Middlesex University, Lloyds Maritime Academy • Lectured in MSc and PhD courses • Supervised 22PhDs and 150+ master students • Designed and delivered over120 training workshops & professional courses • Published 6 books and over 100 articles • Chartered Member (CILT), International Advisor (SCLG), Member (IAME), Member (GPF), Fellow (TEG), Member (GPF), Partner (GFPTT)
  • 7. Port environmental risks and concerns The relationship between ports and environmental risks can be categorised into 4 broad areas: 1. Climate Change  Rising temperature  Sea Level Rise  Extreme Weather Conditions 2. Air Pollution  GHG emissions from marine and inland systems  Air pollutants  Air quality and odour 3. Marine,Water and Soil Pollution  Biodiversity, water environment and land quality  Waste management  Pollution from marine and land base sources 4. Other Environmental Risks and Factors  Noise  Landscape and visual impact  Historical environment  Community and social impacts  Traffic impacts and transport network users
  • 8. Port Environmental Management- Regulatory framework  1992 UNFCCC  1997 Kyoto Protocol  Post-Kyoto 2012  IMO 2018 Initial GHG Strategy and Short-term measures  Various ECAs and SECAs  International Maritime Emission Reduction Scheme (proposition by Norway)  2005/21 EU Emission Trading Scheme (ETS)  2008 Climate change levy in the United Kingdom  Australia’s GHG abatement programme  Carbon tax and negotiated GHG agreement in New Zealand  Western Climate Initiative – US and Canada  Port Climate Change Action, Eco-ports, CARB, etc.
  • 9.  United Nations Convention on the Law of the Sea, UNCLOS  Prevention of pollution by sea – London Dumping Convention  Prevention of pollution by ships – MARPOL  Oil Pollution Preparedness, Response and Cooperation – OPRC  International Maritime Dangerous Goods Code (IMDG Code)  Convention for Safe Containers (CSC)  Control and Management of Ships' Ballast Water and Sediments (BWM Convention)  Control of Harmful Anti-Fouling Systems on Ships, 2001 (AFS Convention)  Biofouling guidelines  Guidelines on the Provision of Adequate Reception Facilities in Ports  Code of Safe Practice for Cargo Stowage and Securing (CSS Code)  International Ship Management (ISM) Code  IMO Manual on Oil Pollution  Crude Oil Washing guidelines (COW Systems)  Procedures for the Control of Ships and Discharges  Guidelines for the identification and designation of Particularly Sensitive Sea Areas (PSSAs)  Ship recycling, Hong Kong convention Maritime Environment -Relevant regulations (IMO)
  • 11. Risk factor Implications on Ports  Hot days and heat waves  Melting ice (for frozen winters)  Large variations  Frequent freeze and thaw cycles  Changes in water chemistry  SLR  Extreme weather events  Challenges to port development and operating practices  Increased maintenance costs, e.g. for dredging, upgrade, retrofitting, etc.  Increased energy use; e.g. for refrigerated storage  Disruptions to service and operational reliability  Route diversions and loss of competitivity and market share  Socio-economic, environmental and political implications  Longer shipping season (NSR), new sea routes ( e.g. NWP)  Need for new or adapted support services, e.g. SAR, AtoNs, ice-breaking, etc. Climate change risks and impacts- rising temperature Source: NOAA Source: IPCC
  • 12. Climate change risks and impacts- Sea Level Rise Risk factor Implications on Ports  MSL  Flooding and inundation  Erosion of coastal areas  Storm surges  Land subsidence  Relocation, redesign and construction of port/coastal infrastructure  Asset protection schemes (e.g. levees, seawalls, dikes, infrastructure elevation)  Asset Insurance, risk and management practices  Operational and service disruptions  Reduction or avoidance of development/settlement in port and surrounding areas  Provision for evacuation routes and operational plans Source: Frederikse et al. (2020) from NASA’s Goddard Space Flight Center/PO.DAAC
  • 13. Risk factor Direct Impacts on Ports  Tsunamis  Damage to infrastructure, utilities, superstructure, vehicles and cargo  Hurricanes  Erosion, sedimentation, subsidence and landslide  Storm surge  Operational disruptions, reduced visibility and service reliability  Precipitation & rainfall  Need for emergency evacuations and management  Strong Winds and fogs  Need for asset protection schemes (e.g. levees, seawalls, dikes, infrastructure elevation)  MSL, tide and waves  Increased asset insurance premium, adaptation and mitigation costs Climate change risks and impacts- Extreme weather events Source: Munich Re, Geo Risks Research, NatCatSERVICE. As of March 2019 Weather related natural catastrophes
  • 15. Example 1: Port Expansion in Poland 15 Key climate risks: • Changes in sea ice (positive) • Sea level rise • Changes in rainfall intensity • Changes in wave conditions Adaptation measures adopted: • Quayside structures designed to cope with sea level rise of approximately 6-10mm per year over the next 100 years • Communication channel established with the Port Authority to receive relevant information about sea level extremes and wave overtopping of port structures
  • 16. Example 2: New Port Facility in Morocco Key climate risks: • Sea level rise • Increased storminess • Increased extreme heat events Adaptation measures adopted: • Analyse breakwater design taking into account expected sea-level rise over the design life of the Port • installation of surfacing, mechanical and electrical equipment designed to withstand • projected temperature extremes (>40 degrees C) • Installation of surface drainage design able to cope with extreme rainfall and overtopping events • Installation of storage facilities able to withstand extreme temperatures and extreme weather events • Adoption of Emergency Response Plan and Coastal Erosion Monitoring Scheme 16
  • 17. Scaling up action on climate resilient ports in Morocco Emerging partnerships to rise to this challenge: • PIANC Working Group 178 on Climate Change Adaptation for Ports and Navigation Infrastructure • Moroccan port authorities will be supported to benefit from emerging PIANC guidance • GEF Special Climate Change Fund has awarded USD 6 million grant resources to co-finance innovative investment in port sector climate resilient upgrades in Morocco ‘la houle exceptionelle’ of January 2014 has raised awareness of climate risks to port infrastructure in Morocco
  • 19. Emissions, energy use and air pollution in ports Sources of emissions and air pollution in ports may be categorised under7 broad areas: 1. Sulphur and exhaust emissions from ships calling at the port 2. Ship GHG emissions (CO2, NOx, PM, Methane, etc.); 3. Emissions and energy use from port buildings and facilities 4. Emissions from cargo handling and operational use 5. Emissions from port crafts / vessels 6. Emissions from hinterland distribution and traffic congestion 7. Air pollution from port development and operations (dust, fumes, vaporisation, chemicals, etc.)
  • 20. Main emissions of concern ◗ Nitrogen Oxides (NOx):. ◗ Particulate Matters (PM): ◗ Sulphur Oxides (SOx): ◗ VOC (Vloatile Organic Compounds) - Some ports ◗ Some carbon monoxide and unburned hydrocarbons
  • 21. Source: Port of Los Angeles Inventory of Air Emissions (2021) Port emissions by source Maritime Industry-related Emissions by Category at the port of Los Angeles PM10 tons PM2.5 tons DPM tons NOx tons SOx tons CO tons HC tons CO2e tonnes 2020 Ocean-going vessels 52 48 34 2,867 96 273 127 212,248 Harbor craft 24 22 24 721 1 539 82 60,374 Cargo handling equipment 6 5 4 366 2 643 66 165,961 Locomotives 29 27 29 786 1 189 45 65,987 Heavy-duty vehicles 6 6 6 1,075 4 284 43 398,679 Total 117 108 97 5,814 104 1,928 363 903,250 2005 Ocean-going vessels 611 491 450 5,193 4,668 469 215 281,239 Harbor craft 55 51 55 1,318 6 364 87 56,925 Cargo handling equipment 54 50 53 1,573 9 822 92 134,621 Locomotives 57 53 57 1,712 98 237 89 82,201 Heavy-duty vehicles 248 238 248 6,307 45 1,865 368 474,877 Total 1,025 882 863 16,103 4,826 3,757 852 1,029,863 Change between 2005 and 2020 (percent) Ocean-going vessels -91% -90% -93% -45% -98% -42% -41% -25% Harbor craft -57% -57% -57% -45% -89% 48% -6% 6% Cargo handling equipment -89% -89% -91% -77% -81% -22% -28% 23% Locomotives -48% -49% -48% -54% -99% -20% -50% -20% Heavy-duty vehicles -98% -98% -98% -83% -92% -85% -88% -16% Total -89% -88% -89% -64% -98% -49% -57% -12%
  • 22. Port Emissions and Air Pollution Ship Related Emissions
  • 23. Ship emissions in ports Ship emissions during anchorage / waiting for berth: • Fuel consumption from Main engines (for limited time queuing) • Fuel consumption from Auxiliary engines (at all times) • Fuel consumption from Auxiliary boilers (when Main engines are switched off) ◗ Port characteristics, performance, sequencing and scheduling influence ship queuing and therefore emissions Ship emissions during approach and pilotage: • Main engines usually off • Fuel consumption from Auxiliary engines (higher loads / spikes) • Fuel consumption from Auxiliary boilers (when Main engines are off) • Tugboat emissions ◗ Port characteristics and pilotage influence ship manoeuvring and therefore emissions Ship emissions at berth: • Main engines turned off (with exceptions) • Fuel consumption from Auxiliary engines (loads depending on ship specs) • Fuel consumption from Auxiliary boilers (loads depend on Main engine requirements) • On cold ironing, only boilers operate ◗ Ship emissions at berth is also influence by port and berth characteristics, handling configurations, bunkering requirements and availability of cold ironing
  • 24. Ship sulphur emissions  The shipping industry has for long been using bunker fuel grades with a high sulphur content, a level that is not accepted in road or rail transport.  IMO 2020 regulations require a reduction of ship’s fuel sulphur content to 0.5% max (down from 3.5% in 2012). For some designated ECAs and jurisdictions, tighter sulphur limits are set to 0.1% max.  T o comply with the regulations, ship operators can use one or a combination of many strategies: speed reduction, retrofitting (EGCS / scrubbers), fuel conversion to (V)LSFO, machinery technology solutions, fleet renewal and use of alternative fuel.  For ports, and besides compliance monitoring, ports can invest in V/LSFO bunkering, shore power and cold ironing (SSP / AMP), and alternative fuel bunkering and storage. Share of global fleet fitted with scrubber systems (Source: IMCO)
  • 28. Solutions to reduce ship emissions in ports ◗ Main measures include: ◗ Efficient Ship operations. ◗ Ship’s cleaner fuels. ◗ Ship’s emissions abatement technologies. ◗ Ship-board energy efficiency when in port. ◗ Use of OPS/AMP.
  • 29. Solutions to reduce ship emissions ◗ Numerous operational and technical measures are available for ship-port emissions reduction and energy efficiency.  There are no “one size fit all” technical measure solution for ships and ports.  The operational measures focus on ship and port energy efficiency, and include reducing ship’s WT (use virtual arrivals, improve cargo handling, upgrade cargo equipment, coordinate port management systems, promote JIT, etc.) ◗ The technical measures are quite extensive including engines, boilers, after treatment technologies, fuel options, etc. ◗ There are solutions underway that focus on the use of alternative maritime power and zero- emission fuels. ◗ Other initiatives look at economic and market-based measures such abatements, price incentives, trading schemes, etc.
  • 30. Port activity emissions and energy use  Stemming from port activities, buildings, equipment and machinery, etc.  Specific operations require more energy use; e.g., night operations (lighting), reefer containers, and building energy requirements  Most port machinery and vehicles can be procured, retrofitted or converted to run on electricity and/or other clean fuels.  Port operations and processes can also be streamlined to reduce energy use and emissions:  Electrify port equipment  Reduce queuing and congestion on the water and landside  Optimize ship and truck/rail planning, scheduling and booking systems  Minimize idling and  Optimize cargo (e.g., container) and traffic (e.g., vehicle) management  Vessel and truck speed reduction programmes  Reward cleaner ships and inland trucks and vehicles  Invest in AMP (clod ironing) and cleaner bunker fuels (hydrogen, methanol, ammonia, etc.)  Implement regulatory and policy measures; first mover advantage  Introduce emissions trading and market-based measures
  • 31. Air Pollution from port operations  Stemming from various port activities and operations including:  Dust, especially from dry bulk handling, stockpiling, and transportation  Fumes and vaporizations from O&G and chemical handling and operations  Odours, especially from chemicals and some dry bulk cargoes  inflammable toxics from IMDG and HAZMAT types of cargo and operations  Dark smoke and hazardous substances from fire, explosion and other safety incidents  Air pollution stemming from industrial and processing sites inside or next to port areas.  Most regulators impose strict rules and requirements to minimize or eliminate air pollution in ports.  Requirements for equipment, installations and procedures to minimize dust, fumes, odours, etc.  Regulations for safe storage and handling for various types of cargoes and products.  Specific or targeted regulations for the handling of HAZMAT and dangerous goods.  Certified plans and procedures to assess, manage and mitigate safety, security and air pollution incidents and accidents
  • 32. GHG emissions- IMO Strategy  IMO 2018 GHG Initial Strategy aims at reducing sector-wide shipping emissions by at least 50% by 2050. Other countries and jurisdictions have set tighter and earlier targets.  T o achieve low carbon or zero-carbon shipping, the IMO measures are set as short-term operational and technical measures (2018-2023), medium-term market-based and energy efficiency measures (2023-2030), and long-term alternative fuel and zero-carbon energy measures (2030-2050)  The transition towards maritime decarbonisation will likely require a combination of several pathways including new (or improved) technologies and operating systems, alternative fuel and supply and storage infrastructures, innovative business models and financing schemes, and other associated and supporting measures.  The success and delivery of each pathway will depend on several factors and uncertainties around technology’s availability and scalability, level of demand, infrastructure and technical challenges, costs and prices, and skills development and transition,  Ports are essential to maritime decarbonisation and transition as they feature in all potential tools and solutions, and in some cases they constitute the main component of decarbonisation. In addition, ports themselves have to limit their GHG emissions and must achieve a range of decarbonisation targets set at local or national levels.
  • 33. Mapping GHG Solutions: Operational and performance solutions Zero or minimum costs Most relevant to old or end life-cycle assets  Includes policy measures, e.g., IMO Ship Energy Efficiency Management Plan (SEEMP) High commercial, coordination & supply chain risk Not relevant to long-term innovation needs Option/ Solution Function /Objective Impact on GHG Commercial & Contractual risks Policy and Regulatory risks Safety & Security risks Interface & Coordinatio n risks Speed Reduction Slow steaming reduces fuel consumption and saves energy. Medium High High Medium Medium Performanc e Management Systems and Plans to measure, track and report fuel consumption and improve energy efficiency Low Low Medium Medium High Weathe r Routing Capture emissions onboard, convert or store them for discharge onshore or at sea Low High Medium Medium High Integrated Planning and data sharing Operational data sharing and integration in order to optimise ship voyage and port interface operations, leading to a reduction in energy use. Medium Low Low High High
  • 34. Mapping GHG Solutions: Design and technical solutions Option/ Solution Function / Objective Impact on GHG Technolog y risk Policy & Regulatory risk Investment & Financing risk Design and structural modifications Changes in ship design parameters and shipbuilding materials to increase ship’s capacity and reduce energy use Medium Medium Low Medium Retrofitting and Machinery technology Retrofitting or installation of onboard equipment to meet regulatory requirements and extend asset lifecycle Medium High Medium Medium Carbon Capture and Storage (CCS) Capture emissions onboard, convert or store them for discharge onshore or at sea Medium High Medium High Energy saving devices Energy saving and flow conditioning devices to increase energy efficiency without retrofitting or design changes Low Low Low Low Hull coatings and skin- drag reductions Skin friction reductions and hull coatings to save fuel costs and reduce GHG emissions Medium Low Low Low Renewable technology integration Hybridisation and intelligent power management, integration with renewable energy to increase fuel efficiency and test-pilot renewable systems Low Low Low High  Initially rolled out to reduce energy costs  Includes policy measures, e.g. IMO’s Energy Efficiency Design Index (EEDI/EEXI) and Carbon Intensity rating (CII).  Offer short-to-medium term transition pathway  Suffers from technological depreciation, market fluctuations and lender’s risk
  • 35. Mapping GHG Solutions: zero-carbon energy and fuel technology options Option/ Solution Function / Objective Impact on GHG reduction Technology & Operational Risk Availability & Scalability Risk Investment and Financing Risk LNG Mature, available and scalable technology for use as a step towards the energy transition Medium Low Low Medium Methanol Low cost and proven use. Can be employed in a dual-fuel engine and make use of existing bunkering facilities Ver y High Medium Medium Medium Biofuels Blending potential with fossil fuels. Lacks global infrastructure and bunkering facilities but can be distributed through existing HFO/MGO systems. Medium Medium Medium Medium Ammonia Large-scale potential for use in ocean shipping; has challenges with supply and mass transport of ammonia.Those can be resolved by developing liquefied ammonia gas carriers. Ver y High High Medium High Hydrogen Large potential with adaptations to marine engines at an early development stage. Liquification needed to achieve a comparable energy density to ammonia and fuel. CCS & land- side investment would also be required. Very High High Medium High Wind & Solar renewables Contribute to auxiliary power requirements, but current technology does not offer sufficient energy density Medium High Offer direct route to low or zero carbon shipping Differences in readiness, cost and scalability Inter-operability risk with supply and port infrastructure Provide ready to deploy options for some markets
  • 36. GHG emissions: Market based measures Measure types Examples • Environmentally differentiated rates/dues • Cap and trade (emissions cap and allowance) • Baseline and credit system • Subsidies • ESG financing • Industry-led voluntary schemes • Fairway dues in Sweden, Green Award Scheme, differentiated tonnage tax in Norway • Kyoto CDM and JI • EU ETS • California Air Investment Programme • Preferential contracting • Poseidon principles • Potential global fuel tax A carbon levy directly fixes a price for carbon dioxide (usually per ton as in an emissions trading system) and can be applied as a fuel levy on the carbon content of fossil fuels.As opposed to an emissions trading system, the emissions reduction outcome is not predetermined but the carbon price is (non-market-based price setting).
  • 37. Port Initiatives to Reduce Ship’s Emissions
  • 38. The formula for the ESI Score is: 2 x ESI NOX+ ESI SOX + ESI CO2 + OPS 3.1 • Some ports have committed themselves to reducing the port-related GHG within an initiative called the World Port Climate Initiative (WPCI)). • Ships receive incentives, via calculation and reduction of WPCI’s Environmental Ship Index (ESI). • The ESI identifies seagoing ships that perform better the IMO requirements. • ESI relies on various formulas to cater for NOx, Sox, CO2 and OPS elements. Green Port Initiatives – Environmental Ship Index (ESI) • ESI gives a bonus for use OPS and reporting / monitoring of energy efficiency. • The ESI Score ranges from 0 (for a ship meeting IMO regulations) and 100 (for a ship that emits no SOx and no NOx and reports or monitors its energy efficiency). • Currently the best performing ships score at around 40 points.
  • 39. Green Port Initiatives – Clean Air Programme ◗ A comprehensive initiative used by some ports to address air emissions from shipping and port operations. ◗ Mainly advocated and implemented by a port authority with input from other stakeholders. ◗ Program normally includes: ◗ A set of specific emission reduction targets ◗ A roadmap to achieve those targets. ◗ T o ensure success, the management system style continuous improvement is applied during implementation ◗ Commitment by the management and staff of port authorities and regulatory agencies are essential for success. ◗ Monitoring and benchmarking will be part of the implementation process. ◗ This could be comparable to another management plans (e.g. SEEMP) but a different scope (port environment)
  • 40. Green Port Initiatives – Norway Tax and Nox Fund ◗ This is a NOx tax applicable mainly to national industries including shipping. ◗ The NOx tax is collected from participating industries and is fed into a NOx fund. ◗ The NOx fund then provides finances to those organisations that want to implement NOx reduction measures including shipping industry. ◗ This scheme is only applicable to domestic shipping around Norway. ◗ It is an example of an effective local program that tries to create a financail scheme and business case for NOx reduction. ◗ On the basis of the scheme, a large number of ships have so far been equipped with NOx reduction technologies. ◗ This fund has also widely finaced major Norwegian initiatives such as the move to LNG as fuel for ships operating in Norwegian water.
  • 41. Market based measures-Examples NOx reduction incentives in port of Gothenburg Differentiated Port Dues Differentiated Flag Dues Singapore-flagged ships registered on or after 1 July 2011, which go beyond the requirements of the IMO’s EEDI, will enjoy a 50% reduction on the Initial Registration Fees and a 20% Annual Tonnage Tax rebate. ….
  • 42. OSP, AMP and Cold Ironing • On Shore Power (OSP/SP) is known in the industry by various terms: Cold ironing system, Alternative Maritime Power (AMP), Shore side electricity, and/or Shore power  OSP is used when ship is stationary at berth to support non-propulsion functions (ventilation, heating, cooling, pumping, cargo handling, etc.), thus reducing or eliminating air emissions and noise. • Supply of power from onshore (port) to ship. • Allows ships to turn off their engines when in port.  Small ships with power requirements of less than 50-100 kw, e.g., tugs and fishing vessels, can draw shore power from normal grid and frequency, as is widely used in most ports around the world.  For large ships with higher power requirements, dedicated installations and systems are needed for Alternative Maritime Power (AMP) or cold-ironing: • Grid capacity upgrade and alternative onsite / local off-grids (wind turbines, solar panels, etc.); • New port substations, charging points and connectors, frequency convertors/transformers, • Power Management Systems (PMS) to electronically monitor/control shore power use and peaks in demand. • Onboard ship systems’ adaptations for varying voltage and frequency range, control panel, etc.
  • 43. Source: http://www.cruisecritic.co.uk/ Onshore Power Supply (OPS) – Ship and Shore-side infrastructure On the land side, the high power cold ironing system consists of the following: • High voltage grid to the port • Frequency and voltage convertors/transformers • Control panels and connection boxes • Cable reel and connectors On the ship side the following will have to be installed: • The grid power solution and the frequency converters typically represent the costliest elements on the shore side. • Depending on the availability of grid power and the power requirements, the cost of installing shore power on the shore side will vary considerably. • Transformer • Power distribution system • Control panel • Frequency converter (optional for greater flexibility) • Connectors and cable reel (optional for greater flexibility)
  • 44. Onshore Power Supply (OPS) – Typical system specs for the different power requirements Power Capacity Typical spec <100kW 230/400/440V – 50/60hz 100 – 500kW 400/440/690V – 50/60hz 500-1000kW 690V/6.6/11kV – 50/60hz >1MW 6.6/11kV – 50/60hz
  • 45. Onshore Power Supply (OPS) – Typical system requirements for different ship types and sizes Vessel types <= 999 1000 – 4999 GT 5000 – 9999 GT 10000 – 24999 GT 25000 – 49999 GT 50000 – 99999 GT >= 100000 GT Oil tankers 230/400/440 V – 50/60hz 400/440/690V – 50/60hz 690V/6.6/11k VV – 50/60hz 690V/6.6/11kV V – 50/60hz 690V/6.6/11kV V – 50/60hz 6.6/11kV – 50/60hz 6.6/11kV – 50/60hz Chemical/product tankers 400/440/690 V – 50/60hz 400/440/690V – 50/60hz 690V/6.6/11k VV – 50/60hz 6.6/11kV – 50/60hz 6.6/11kV – 50/60hz Gas tankers 400/440/690 V – 50/60hz 400/440/690V – 50/60hz 6.6/11kV – 50/60hz 6.6/11kV – 50/60hz 6.6/11kV – 50/60hz 6.6/11kV – 50/60hz 6.6/11kV – 50/60hz Bulk carriers 230/400/440 V – 50/60hz 400/440/690V – 50/60hz 400/440/690 V – 50/60hz 400/440/690V – 50/60hz 400/440/690V – 50/60hz 690V/6.6/11kVV – 50/60hz General cargo 230/400/440 V – 50/60hz 400/440/690V – 50/60hz 400/440/690 V – 50/60hz 400/440/690V – 50/60hz 690V/6.6/11kV V – 50/60hz Container s vessels 400/440/690V – 50/60hz 400/440/690 V – 50/60hz 690V/6.6/11kV V – 50/60hz 6.6/11kV – 50/60hz 6.6/11kV – 50/60hz 6.6/11kV – 50/60hz Ro Ro vessels 230/400/440 V – 50/60hz 400/440/690V – 50/60hz 400/440/690 V – 50/60hz 690V/6.6/11kV V – 50/60hz 690V/6.6/11kV V – 50/60hz 6.6/11kV – 50/60hz Reefers 230/400/440 V – 50/60hz 400/440/690V – 50/60hz 400/440/690 V – 50/60hz 690V/6.6/11kV V – 50/60hz Passengers vessels 230/400/440 V – 50/60hz 400/440/690V – 50/60hz 400/440/690 V – 50/60hz 690V/6.6/11kV V – 50/60hz 6.6/11kV – 50/60hz 6.6/11kV – 50/60hz 6.6/11kV – 50/60hz Offshore supply vessel 230/400/440 V – 50/60hz 400/440/690V – 50/60hz 6.6/11kV – 50/60hz Other offshore service vessels 230/400/440 V – 50/60hz 400/440/690V – 50/60hz 690V/6.6/11k VV – 50/60hz 690V/6.6/11kV V – 50/60hz 690V/6.6/11kV V – 50/60hz 690V/6.6/11kVV – 50/60hz 690V/6.6/11kV V – 50/60hz Other activities 230/400/440 V – 50/60hz 400/440/690V – 50/60hz 690V/6.6/11k VV – 50/60hz 6.6/11kV – 50/60hz 6.6/11kV – 50/60hz 6.6/11kV – 50/60hz 6.6/11kV – 50/60hz
  • 46. Onshore Power Supply (OPS) – Estimated cost for implementing shore power on board vessels vestment cost for vessel (USD) 1000 – 4999 GT 5000 – 9999 GT 10000 – 24999 GT 25000 – 49999 GT 50000 – 99999 GT >= 100000 GT Crude tankers $50 000 – $350 000 $100 000 – $400 000 $100 000 – $400 000 $100 000 – $400 000 $300 000 – $750 000 $300 000 – $750 000 Chemical / product tankers $50 000 – $350 000 $100 000 – $400 000 $300 000 – $750 000 $300 000 – $750 000 Gas tankers $50 000 – $350 000 $300 000 – $750 000 $300 000 – $750 000 $300 000 – $750 000 $300 000 – $750 000 $300 000 – $750 000 Bulk carriers $50 000 – $350 000 $50 000 – $350 000 0,5 – 3 Mill 0,5 – 3 Mill $100 000 – $400 000 General cargo $50 000 – $350 000 $50 000 – $350 000 0,5 – 3 Mill $100 000 – $400 000 Container vessels $50 000 – $350 000 $50 000 – $350 000 $100 000 – $400 000 $300 000 – $750 000 $300 000 – $750 000 $300 000 – $750 000 Ro Ro vessels $50 000 – $350 000 $50 000 – $350 000 $100 000 – $400 000 $100 000 – $400 000 $300 000 – $750 000 Reefer $50 000 – $350 000 $50 000 – $350 000 $100 000 – $400 000 Passenger ship $50 000 – $350 000 $50 000 – $350 000 $100 000 – $400 000 $300 000 – $750 000 $300 000 – $750 000 $300 000 – $750 000 Offshore supply ship $50 000 – $350 000 $100 000 – $400 000 Other offshore service ships $50 000 – $ 350 000 $100 000 – $400 000 $100 000 – $400 000 $100 000 – $400 000 $100 000 – $400 000 $100 000 – $400 000 Other activities $50 000 – $ 350 000 $100 000 – $400 000 $300 000 – $750 000 $300 000 – $750 000 $300 000 – $750 000 $300 000 – $750 000 Fishing vessels $50 000 – $ 350 000 $100 000 – $400 000
  • 47. Onshore Power Supply (OPS) – Need for Standardisation • No IMO regulation yet. • There have been proposals to add some new regulations to MARPOL Annex VI; but mainly on the following topics: Exemptions: • For ships with low emissions or high ship-board energy efficient power generation as compared to OPS. • Period in port: Not required to connect to OPS when the berth stay is less than some hours. Availability of OPS: The port shall provide sufficient electrical power to sustain all operations including peak consumptions. Cost of OPS electricity: The electricity costs for the ship to connect to shore power at berth should not exceed the cost of supplied electricity. • ISO SO/IEC/IEEE 80005-1:2012: Utility connections in port — Part 1: High Voltage Shore Connection (HVSC) Systems- General requirements; (See https://www.iso.org/standard/53588.html)
  • 48. Progress made so far… https://electrek.co/2022/06/08/meet-sparky-the-electric-tugboat-operating-in-the-ports-of- auckland-with-2784-kwh-of-power/ https://maritime-executive.com/article/video-world-s-first-hydrogen-carrier-departs-japan-on- maiden-voyage https://youtu.be/xv-cZt-FpGM https://youtu.be/JpFOf4jrlpI https://sea-lng.org/why-lng/ global-fleet/
  • 49. Relevant Benchmarks and References CEM Global Ports Hydrogen Coalition (https://www.iea.org/programmes/cem-hydrogen-initiative) • https://pla.co.uk/Sea-Land-and-Port-Smart-Integration-of-a-Hydrogen-Highway • https://www.portofamsterdam.com/en/news/how-do-we-safely-bunker-alternative-fuels • https://cleanairactionplan.org/ • ISO SO/IEC/IEEE 80005-1:2012: Utility connections in port — Part 1: High Voltage Shore Connection (HVSC) Systems- General requirements; (https://www.iso.org/standard/53588.html )
  • 50. Initiatives to Reduce Port Emissions
  • 51. Port Emissions and Energy Use • Greening port equipment: • E-RTG, E-STS, E-SL, E-Trains, E-trucks, etc. • E-mooring, E-reefer plug-ins, E-warehouse systems, etc. • Hybrid models re also widely used • Energy efficiency • Port efficiency • Good practices • Lighting • Green Training • Production of Green Energy (wave, offshore wind, etc.) • Considerations of charging points and voltage lines • Considerations for energy source, use, grid capacity • Considerations of energy costs and conversion costs
  • 52. Electrification of Handling Equipment: Some early adopters in Asia
  • 53. Electrification of Handling Equipment: Some early adopters in Asia
  • 54. Port Environmental Management Marine, water and soil Pollution
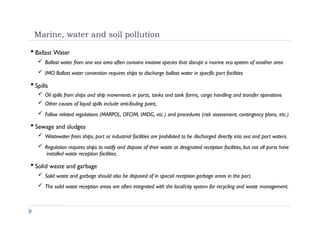
  • 55. Marine, water and soil pollution  Ballast Water  Ballast water from one sea area often contains invasive species that disrupt a marine eco system of another area  IMO Ballast water convention requires ships to discharge ballast water in specific port facilities  Spills  Oil spills from ships and ship movements in ports, tanks and tank farms, cargo handling and transfer operations  Other causes of liquid spills include anti-fouling paint,  Follow related regulations (MARPOL, OFCIM, IMDG, etc.) and procedures (risk assessment, contingency plans, etc.)  Sewage and sludges  Wastewater from ships, port or industrial facilities are prohibited to be discharged directly into sea and port waters.  Regulation requires ships to notify and dispose of their waste at designated reception facilities, but not all ports have installed waste reception facilities.  Solid waste and garbage  Solid waste and garbage should also be disposed of in special reception garbage areas in the port.  The solid waste reception areas are often integrated with the local/city system for recycling and waste management.
  • 56. Other pollution and risks in ports  Dredging and channel works  Harbour and quay construction  Modification of currents  Alters natural environment  Habitat loss or degradation  Accidents, collusion and grounding  Land and sea contamination  Industrial effluent  Hazardous cargo  Port and area maintenance
  • 57. Port noise and visual intrusion  Port noise stems from various sources: ships, machinery, vehicles, etc. and at various stages of port development and operations.  Many ports limit noise-producing activities by working zone or time of operation.  Port visual intrusion takes place where seascape, landscape and visual characteristics of the port are negatively impacted, especially for port localities depending on tourism or those surrounded by protected/ preserved areas.  Often, a Landscape and Visual Impact Appraisal (LVIA) is undertaken prior to port facility development, expansion or upgrade.
  • 59. Assessment of Environmental Sustainability • T o assess environmental sustainability in ports, relevant port data and information should be regularly collected, assessed, and monitored against established standards. • Environmental sustainability indicators should cover at least, but are not necessarily limited to the following areas:  GHG emissions  Air pollutants  Energy use and energy efficiency  Solid waste  Liquid waste (incl. oil pollution, ballast water and wastewater)  Noise pollution  Light pollution  Biodiversity • Ports should be assessed on both their physical infrastructure and operational practices to have a comprehensive overview of their environmental sustainability. Environmental assessment frameworks can also use both quantitative and qualitative ranking systems for internal evaluation and external benchmarking.
  • 60. Guides and Steps • To-date, there is no common international standard or regulation for assessing or certifying port emissions.There are several international guidelines, (e.g. IAPH and WSP) while some ports have developed their own standards and guidelines. • In general, port emissions assessment consists of two to three stages: • Emissions inventories; cataloguing various port emissions sources and their activities, translate these into energy consumption levels and then translate energy consumption into emissions. • Emission metrics and indicators; establishing baselines, targets and benchmarks for emissions monitoring, control and reduction. • Emissions forecasts; estimates of future emissions projections based on ship and vehicle traffic and cargo throughput forecasts and changes in design, equipment and operations. Forecasts help in port planning and decision making.
  • 61. Scopes of Emissions Assessment and Reporting Greenhouse Gas Protocol (GHP) is an internationally accepted set of (accounting) standards which sets global standards for how to measure, manage and report GHG. Under GHP guidelines, the terminal operator calculate their emissions taking into consideration all their scope 1and 2 Emissions. Scope emissions describe the categorisation of GHG emissions into groups to facilitate universal international accounting and reporting.There are 3 main distinct scopes: • Scope 1 emissions or direct emissions are GHG emissions from the sources that are owned or controlled by the reporting entity. For ports, this refers primarily to emissions from port infrastructures and operations. • Scope 2 or indirect emissions are GHG emissions specifically from the generation of purchased or acquired electricity, steam, heat, or cooling consumed by the reporting entity. • Scope 3 emissions refers to all indirect GHG emissions from all sources whether upstream or downstream of a value chain and which are not owned or controlled by the reporting entity directly.
  • 62. Carbon offsetting, Insetting and Neutrality  Offsetting describes the climate action that enables individuals and organisations to compensate for their emissions, by supporting worthy projects that reduce emissions somewhere else.  More specifically, it is a term used to describe the act of reducing GHG emissions or increasing GHG removals through activities external to an activity or outside of the supply chain, to reduce the net contribution to global emissions.  Offsetting is typically arranged through a marketplace for carbon credits or other exchange mechanism. Offsetting claims are only valid under a rigorous set of conditions, including ensuring that the reductions/removals involved are additional, not over-estimated, and exclusively claimed.  Insetting is similar of offsetting but whilst the principles are the same it differs as it applies to a company offsetting its emissions through a project within its own value chain  Carbon neutrality is where carbon emission generated, throughout the life cycle of the product/activity, are removed during the same cycle as a result of carbon reduction measures such as environmental actions, carbon capture, operational efficiencies, use of green fuels and renewables, as well as carbon offsetting and insetting.
  • 63. Planning for emission assessment A general framework for planning emission assessment follows 10 generic steps: 1. Catalogue and group drivers 2. Define intended uses 3. Select air pollutants 4. Select emissions sources 5. Select geographical and operational domains 6. Identify outside emissions sources near port 7. Select inventory period and frequency 8. Identify documentation and reporting requirements 9. Select level of detail 10. Select assessment platform
  • 64. Cataloguing group drivers ERS – Emissions reduction strategy CSR – Corporate social responsibility Examples of priority grouping of drivers for a port emissions assessment (WPCT)
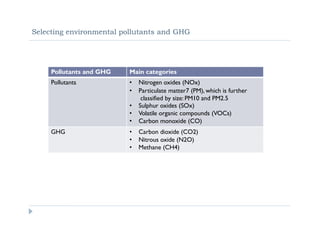
  • 65. Selecting environmental pollutants and GHG Pollutants and GHG Main categories Pollutants • Nitrogen oxides (NOx) • Particulate matter7 (PM), which is further classified by size: PM10 and PM2.5 • Sulphur oxides (SOx) • Volatile organic compounds (VOCs) • Carbon monoxide (CO) GHG • Carbon dioxide (CO2) • Nitrous oxide (N2O) • Methane (CH4)
  • 66. Scoping / selecting emission sources Emission source category Coverage Mobile Cargo handling equipment Trucks and vehicles Railroad vehicles and locomotives Port owned vessels Seagoing and domestic vessels Construction equipment Stationary Electrical grids Power Plant Power generators Industrial facilities Buildings and offices Other stationary facilities: wastewater plants, reception facilities, ops. sites, .. Purchased Electricity Lighting, instrumentation, comfort cooling, computers, ventilation, etc. Employee Commuting Emissions from the transportation of employees between their homes and worksites.  Scope 1: Mobile + Stationary + Employee Commuting (Authority)  Scope 2: Purchased Electricity (Authority)  Scope 3 : Mobile + Stationary + Purchased Electricity + Employee Commuting (Tenants)
  • 67. Select Operational boundaries and identify emissions near ports In tandem with emissions properly, the port should select the geographical and operational boundaries to be included in (excluded from) emissions inventory and assessment.  The Port of Rotterdam has limited its geographical domain to include its administrative boundary and its operational domain to its owned and operated emissions sources.  The Hamburg Port Authority has limited its emissions inventory to the local port administrative boundary.This boundary was set in conjunction with the Hamburg environmental agency’s emissions inventory geographical domain.  Port of Vancouver Port Emission Inventory includes cargo-related and administrative emissions sources and includes an overwater and overland boundary related to the air quality modelling domain for Metro Vancouver (greater than the port’s administrative boundary).  PLOA/PLOB geographical domain includes all cargo operational boundaries, extends inland to cover a city-port area of 10 million inhabitants and waterside to 130 nm out to sea.
  • 68. Select assessment platforms  Internal: Spreadsheets, desktop database, server-based database, etc.  External: Off the shelf tool calculators (commercial, governments, NGOs, etc.)  Purpose built: Purpose built software by external consultants or internally.
  • 69. Emissions estimating methods  Ships: • General data: tanker, containership, bulker, tugs, dredgers, river boats, etc. • Technical data: age, speed, engine, load factor, etc. • Operation data: manoeuvring, transit, stationary/berthing • Geographical domain data: by anchorage/terminal/port site • Fuel type: HFO, LFO,VLFO, LNG, etc.  Equipment and Vehicles • Type: crane, truck, vehicle, etc. • Technical data: model, age, engine, certification, etc. • Energy data: fuel type, rated power, etc. • Activity data: hours of ops., load factor, energy consumption, etc. • Geographical domain data: yard, terminal, port, hinterland, etc.
  • 70. Emissions estimating methods: Some equations for ships Ei = Energyi x EF x FCF x CF Where: Ei = Energyi = EF = FCF = CF = emissions by operating mode i energy demand by mode i, calculated using Equation 2 below as the energy output of the engine(s) or boiler(s) over the period of time, kWh emission factor, expressed in terms of g/kWh, depends on engine type, IMO NOx standards and fuel used fuel correction factor, unitless control factor(s) for emissions reduction technologies, unitless Ei = Loadi x Activityi Where: Energyi = Loadi = energy demand by mode i, kWh maximum continuous rated (MCR) power times load factor (LF) for propulsion engine power, kW; reported operational load of the auxiliary engine(s), by mode i, kW; or operational load of the auxiliary boiler, by mode i, kW Activityi = activity for mode i, hours Activityi = Di / Speedi Where: Activityi = activity, hours Di = distance travelled while in mode i, nautical miles Speedi = actual ship speed by mode i, knots Emissions Energy Activity
  • 71. Emissions estimating methods: Some equations for equipment Emissions Energy E = Fuel Consumption x EF x FCF x CF Where: E = Fuel Consumption = EF = FCF = CF = emissions, grams/year fuel consumed, litres emission factor, grams of pollutant per gallon of fuel consumed, g/litre fuel correction factors are used to adjust from a base fuel associated with the EF and the fuel being used, dimensionless control factor to reflect changes in emissions due to installation of emissions reduction technologies not originally reflected in the emission factors, dimensionless E = Energy x EF x FCF x CF Where: E = Energy = EF = FCF = CF = emissions, grams/year energy demand per engine, kWh, calculated using Equation 10 emission factor, grams of pollutant per unit of work, g/kWh or g/hp-hr, depends on engine type, emissions standards applicable in the region of operation and fuel type fuel correction factors are used to adjust from a base fuel associated with the EF and the fuel being used, dimensionless control factor to reflect changes in emissions due to installation of emissions reduction technologies not originally reflected in the emission factors, dimensionless
  • 72. Developing metrics  Asset based  Activity base  Emission base  Baseline  Forecast Emissions-based emissions/time period total PM tonnes/year total NOx tonnes/year total CO2e tonnes/year seagoing vessel PM tonnes/year cargo handling equipment NOx tonnes/year heavy duty vehicle CO2e tonnes/year bulk ship PM tonnes/year cargo handling equipment NOx tonnes/year rubber-tyred gantry PM tonnes/year assist tug NOx tonnes/year grid-based CO2e tonnes/year emissions/cargo throughput total PM tonnes/tonne container-related NOx tonnes/10,000 teus bulk liquid-related CO2e tonnes/barrel containership PM tonnes/10,000 teus cargo handling equipment NOx tonnes/tonne heavy duty vehicle CO2e tonnes/10,000 teus cruise ship PM tonnes/passenger crane NOx tonnes/10,000 teus grid-based CO2e tonnes/tonne locomotive NOx tonnes/10,000 teus general cargo ship CO2e tonnes/tonne of steel
  • 73. Emission reduction plans A general framework for an emissions reduction plan follows 10 generic steps: 1. Select target pollutants for reduction 2. Selection reduction targets 3. Evaluate emission inventory data 4. Review emission programmes of other ports 5. Benchmark in time series 6. Benchmark in cross-sectional 7. Review and monitor 8. Identify corrective actions 9. Develop implementation plan 10. Formalise implementation plan
  • 76. GPH and Environmental Reporting • GHG emissions are usually measured by using CO2-conversion factors recommended by GHP. UK DEFRA are widely used in the UK and elsewhere, covering all types of fuels. • The adoption of common CO2-conversion factors are important to ensure common standards. • Other common denominators include the ‘number of boxes entering and leaving the terminal”. So total GHG emissions are divided by the number of boxes / containers handled to lead to a KgCO2e/box.The same approach is used for other cargo (e.g., KgCO2e/ton)
  • 78. Green Port Benchmarks- Dredging Management Plan Examples of analogous plan: •In 2003 the Port of London Authority (PLA) published the Maintenance Dredging Framework for the Thames to guide decisions on maintenance dredging and ensure sustainability.This Framework provides for the coordinated assessment and management of dredging operations on the tidal Thames and includes the consideration of any likely impacts on designated conservation sites. •Wheatstone Project - Dredging and Dredge Spoil Placement Environmental Monitoring and Management Plan. This is a state of the art plan, made for a project in an area with very sensitive habitats (e.g. corral). It may be too complex for the PoB situation, but it is always easier to simplify a good plan than to start from scratch. Recommendation on the structure of the plan should be based on the following guidance documents: • OSPAR Guidelines for the Management of Dredged Material at Sea (Agreement 2014-06); •Technical Annex included in both the OSPAR and HELCOM guidelines to minimize the effects on the environment of dredging operations as far as practicable; •PIANC, IADC and CEDA dredging guidance documents for monitoring and management of dredging activities. • Environmental, Health and Safety Guidelines for Ports, Harbours and Terminals (IFC, 2017); and • General EHS Guidelines - Waste management guidance for non-hazardous and hazardous waste (IFC, 2017).
  • 79. Green Port Benchmarks- Cold Ironing in European Ports In the Port of Rotterdam for example there is a prohibition for inland vessels to use their power generators and all inland ships must use shore power instead of generator power. 16 Megawatt power supply in Kristiansand for cruise ships 10 Megawatt shore installation entered service at the German port of Cuxhaven, in the North Sea, west of Hamburg, in May 2018 Other installations are also under consideration or under way in ports in Northern Europe including the ports of Antwerp,Amsterdam, Bremen, Gothenburg, the Hamburg Port Authority, Port of Le Havre, Stadtwerke Lubeck,̈ port of Kiel, and the port of Copenhagen/Malmö.
  • 80. Green Port Benchmarks- Air Emissions in European Ports Emission inventory: • Port of London Emission Inventory 2016. • Port of Long Beach Air Emission inventory 2017-Present Incentive schemes on reduction of carbon emissions •Port of Rotterdam ambition: energy transition leader.The Port of Rotterdam Authority stimulates the use of clean shipping fuels by offering incentives to inland shipping (e.g. the Environmental Ship Index and the discount on port dues for inland shipping) and by lobbying to reduce the sulphur content in shipping fuels, for example (IMO 2020), as well as by contributing to research on climate-friendly production technology.The study commissioned in 2018 by the Port of Rotterdam, Deep decarbonisation pathways for transport and logistics identified the following pathways: energy efficiency, modal shift and fuel shift. • Hamburg Port Authority: LNG, shoreside power and more. •Port of London Authority introduced in January 2017 the UK’s first Green Tariff, incentivising operators to use cleaner vessels. It exceeds the standards set by the International Maritime Organisation. • In 2011, the Hamburg Port Authority (HPA) has introduced a discount on port dues for environmentally friendly ships, the so-called Green Port Fee (based Environmental Ship Index). • Cleaner Air Strategy 2018-2025 Port of Southampton. Hydrogen fuel cells: • Ports of Auckland to build Auckland’s first hydrogen production and refuelling facility •Valencia Launches Hydrogen Pilot Scheme •Toyota has unveiled the second iteration of its hydrogen fuel cell electric Class 8 truck which will help clean up emissions at the Ports of Long Beach and Los Angeles.
  • 82. Relevant ISO Standards  ISO 14001: Environmental management systems  ISO 14064: Quantifying and reporting GHG  ISO 14090:Adaptation to Climate Change  ISO 14083: GHG from transport chain operations  ISO 16304: Marine environment protection  ISO 50001: Energy management systems
  • 83. ESPO EcoPorts PERS  The Port Environmental Review System (PERS) does not only incorporate the main general requirements of recognised environmental management standards (e.g. ISO 14001), but also takes into account the specificities of ports. PERS builds upon the policy recommendations of ESPO and gives ports clear objectives to aim for.Its implementation is independently reviewed by LRQA Nederland B.V.A PERS certification is valid for a period of 2 years.  Self Diagnosis Method (SDM) is user-friendly environmental checklist comprised of three parts: - SDM checklist: Filling in the SDM checklist is your 'passport' to the EcoPorts network. - SDM Comparison: Compare your SDM score with the European average - SDM Review: Review your SDM score and receive expert's advice and customised recommendations.  SDM is a checklist that allows you to identify and reflect on environmental risks in your port. Aggregated and anonymised data provided by EcoPorts members are used to build and update the sector’s benchmark of performance in environmental management. A completed SDM is valid for a period of 2 years.
  • 84. IAPH World Ports Sustainability Awards  The objective of E(S)IA is to identify the most environmental parameters spanning pollutants, emissions, waste and noise during both construction and operation phases; emphasize their negative impacts and externalities, and propose recommendations, measures and action plans for mitigation  ESIA has three dimensions depending on the Project Category:  Scoping exercise;  Preliminary assessment, or  Detailed assessment  ESIA preparation shall be caried out in accordance with national regulations and procedural guidelines as well as those of IFIs and MDBs. ESIA often includes a public consultation component.  Any EIA starts with the collection of baseline project data and environmental parameters including the physical environment (geology, geography, hydrology), climate, air quality, noise, soil and ground water pollution, biodiversity, and protected areas where applicable.
  • 85. Port Environmental Management Environmental (and Social) Impact Assessment E(S)IA
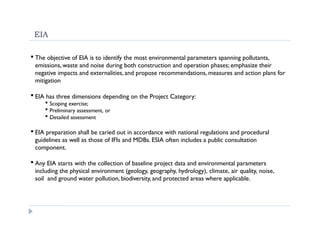
  • 86. EIA  The objective of EIA is to identify the most environmental parameters spanning pollutants, emissions, waste and noise during both construction and operation phases; emphasize their negative impacts and externalities, and propose recommendations, measures and action plans for mitigation  EIA has three dimensions depending on the Project Category:  Scoping exercise;  Preliminary assessment, or  Detailed assessment  EIA preparation shall be caried out in accordance with national regulations and procedural guidelines as well as those of IFIs and MDBs. ESIA often includes a public consultation component.  Any EIA starts with the collection of baseline project data and environmental parameters including the physical environment (geology, geography, hydrology), climate, air quality, noise, soil and ground water pollution, biodiversity, and protected areas where applicable.
  • 87. Some environmental elements of a port project Ecological Characteristics Natural habitats Flora Fauna Natural drainage Surface features General environmental quality Air Quality (including GHG emission) Noise Level Ground Water Quality Soil and surface deposits Public and Private Services Transportation services Drinking water supply Sewage services Energy services Education Health care facilities Housing Emergency services Traffic flow Parking Public security Shopping Socioeconomic Elements Local economy Accessibility to public services Community development potential Land use pattern Aesthetic and Cultural Aspects Attractiveness and view opportunities Archaeological, landmarks and historical sites
  • 88. Environmental impacts during a port or terminal life-cycle Planning and site selection Construction Operation • Land acquisition • Acquisition of the land and areas necessary for the “right of way” • Site surveys and investigations • Increased truck traffic (construction material and waste) • Vehicle/construction equipment parking/storage outside the site • Base camp establishment and operation • Workers’ accommodation • Construction activities at areas accessible to the public. • Workers' activities and construction site management • Levelling, land clearing and earthworks/railway embankment • Paving/asphalting • General construction • Noise generation • Air pollution emissions • Hazardous emissions • Water consumption • Increased truck traffic • Railway traffic • Vehicular emissions • On-site train sidings (rail yard) • Truck loading area • Container Storage areas (yard) (including refrigerated containers) • Engineering workshops • Customs and Health inspection sites • Administrative offices • Solid waste management • Infrastructure buildings • Main incoming power sub-station • Power distribution sub-stations • Generator house • Pumps house • Fire pumps house • Fuel storage and fuel filling stations