SlideShare a Scribd company logo
Tune Your ASP.NET Application Using Visual Studio 2010 Profiler Abhijit Jana  │  Consultant, Microsoft http:// abhijitjana.net   |   @abhijitjana virtual techdays INDIA  │  28-30 September 2011
Introducing Profiling  Introducing Visual Studio 2010 Profiler  Choose right Profiling Methods Deep dive into Visual studio profiler Use different techniques of profiling with asp.net apps Profile ASP.NET applications  with IIS  Profiling JavaScript ASP.NET load testing and Profiling Q/A S E S S I O N  A G E N D A virtual techdays INDIA  │  28-30 September 2011
Performance   of an application is a key element that should be  analyzed  and  optimized   before it go for live. The most common use of profiling information is to help application  performance optimization . This helps to find out  memory usages ,  usage of particular instructions ,  check for CPU Utilization  or  frequency and duration of specific function calls . Analyze  your application performance,  review   and  optimize  your code then  rerun   the profiler. Compare  the result with your  baseline   result. Let your code  fly Introducing Profiling Why do we need this ? Why it is important ?  virtual techdays INDIA  │  28-30 September 2011
Application Profiling Life Cycle Just look into the different steps of Application Profiling Run Profiler Performance Report Application Analyze Reports Code Optimization Compare Performance Report virtual techdays INDIA  │  28-30 September 2011
Microsoft Visual Studio 2010  comes with built-in profiling tools that offer developers  to analyze their application. Very Powerful tooling support to analyze.  Visual Studio Profiling Tools support below methods of collecting performance data Sampling Instrumentation Memory Allocation Concurrency Supports  JavaScript Profiling  and  Tier Interaction (TIP) It’s also helps to compare different performance reports  Introducing Visual Studio 2010 Profiler  Applicable with only Visual Studio 2010 Ultimate and Premium Edition virtual techdays INDIA  │  28-30 September 2011
Choose right Profiling Methods  First know which method is suitable for your application. Sampling :  This is useful for initial analysis of your application. Use sampling for analyzing  CPU utilization issues . Instrumentation : Inspect the  time  for all functions used in the application during the current profile session. Check for all call out and call in functions For analyzing  input/output performance issues . Memory Allocation :  This uses  sampling profiling method to collects .NET Framework memory allocation data  Concurrency : Visualize the behavior of Multithread application virtual techdays INDIA  │  28-30 September 2011
DEMO:  Deep dive into Visual studio profiler Abhijit Jana │  Consultant, Microsoft virtual techdays INDIA  │  28-30 September 2011
Inside Sampling Know something more about Sampling Profiling Visual Studio Profiler collects the function call stack by sending some interrupts the computer processor at set of intervals.  The profiler analysis determines whether the processor is executing code in the target process.  If the processor is executing the target code, the profiler increments the sample counts for each function on the call stack Measurements Inclusive samples Exclusive samples Inclusive percent Exclusive percent http :// msdn.microsoft.com/en-us/library/ms242753.aspx Profiler virtual techdays INDIA  │  28-30 September 2011
Inside Instrumentation Know more about Instrumentation Visual Studio Profiling Tools injects code at the start and end of target functions in the profiled binary This also inject codes before and after each call by instrumented functions to other functions. Main Measurement Elapsed Inclusive Elapsed Exclusive Application Inclusive Application Exclusive http:// msdn.microsoft.com/en-us/library/ms182369.aspx virtual techdays INDIA  │  28-30 September 2011
DEMO: Using Instrumentation With  ASP.NET Application Abhijit Jana │  Consultant, Microsoft virtual techdays INDIA  │  28-30 September 2011
DEMO: Compering Profiler Result Abhijit Jana │  Consultant, Microsoft virtual techdays INDIA  │  28-30 September 2011
DEMO:  Profiling ASP.NET Application With IIS Abhijit Jana │  Consultant, Microsoft virtual techdays INDIA  │  28-30 September 2011
DEMO:  JavaScript Profiling Abhijit Jana │  Consultant, Microsoft virtual techdays INDIA  │ 28-30 September 2011
DEMO:  ASP.NET Load Testing and Profiling Abhijit Jana │  Consultant, Microsoft virtual techdays INDIA  │ 28-30 September 2011
Beginners Guide to Performance  Profiling Analyzing Application Performance by Using Profiling  Tools How  to Profile IIS Express with Visual Studio 2010  SP1 Useful Resources  virtual techdays INDIA  │  28-30 September 2011
Questions & Answer virtual techdays INDIA │ 28-30 September 2011
abhijan@microsoft.com  │  http://abhijitjana.net   │  @AbhijitJana Thank You virtual techdays INDIA │ 28-30 September 2011

More Related Content

DOCX
ShubhamResume
DOCX
Resume
PDF
Test automation_strategy_for_legacysystems
PDF
Comparative Study on Different Mobile Application Frameworks
PDF
Presentation Verification & Validation
PPTX
Automation Testing with Test Complete
PPTX
Building Resilient Automated UI Tests for Cloud Applications using Scripless ...
PPTX
Framework For Automation Testing Practice Sharing
ShubhamResume
Resume
Test automation_strategy_for_legacysystems
Comparative Study on Different Mobile Application Frameworks
Presentation Verification & Validation
Automation Testing with Test Complete
Building Resilient Automated UI Tests for Cloud Applications using Scripless ...
Framework For Automation Testing Practice Sharing

What's hot (20)

DOC
vinayak chavan-tester
PPTX
Software-automation-testing-course-navi-mumbai-software-automation-testing-co...
PPTX
Smart : Comprehensive and unified framework for test automation of web and mo...
PPTX
From One Test To Test Framework With Rapise
PPTX
Thesis presentation over Web Development
PDF
Suhas Ukkalam
PPTX
TestComplete – A Sophisticated Automated Testing Tool by SmartBear
DOC
CV - Rakesh Sharma
PPTX
Mobile Automation Meetup Presentation [English]
PPTX
Selenium Tutorial for Beginners | Automation framework Basics
DOC
Shivani_Sethi__Resume
PPTX
Appium Presentation
PDF
RFT Tutorial 4 How Do We Record A Script Using Rational Functional Tester - RFT
PPT
Automation testing IBM RFT - Rational Functional Tester
PPT
Spiral model explanation
DOCX
Rima Dasgupta_CV
PPT
Hybrid Automation Framework Development introduction
PPTX
Ranorex presentation
PPTX
RAD Model & Prototyping Of Software Engineering
DOCX
Hafs Qaddoura Resume
vinayak chavan-tester
Software-automation-testing-course-navi-mumbai-software-automation-testing-co...
Smart : Comprehensive and unified framework for test automation of web and mo...
From One Test To Test Framework With Rapise
Thesis presentation over Web Development
Suhas Ukkalam
TestComplete – A Sophisticated Automated Testing Tool by SmartBear
CV - Rakesh Sharma
Mobile Automation Meetup Presentation [English]
Selenium Tutorial for Beginners | Automation framework Basics
Shivani_Sethi__Resume
Appium Presentation
RFT Tutorial 4 How Do We Record A Script Using Rational Functional Tester - RFT
Automation testing IBM RFT - Rational Functional Tester
Spiral model explanation
Rima Dasgupta_CV
Hybrid Automation Framework Development introduction
Ranorex presentation
RAD Model & Prototyping Of Software Engineering
Hafs Qaddoura Resume
Ad

Viewers also liked (15)

PPTX
Effective intellitrace Debugging with VS 11
DOC
crossword
PPTX
A lap around ASP.NET 4.5 and Visual Studio 2011 Developer Preview
PDF
XIX Foro Juan Luis Vives Agenda
PPTX
What's new in vs 2010 sp1 for web developers
KEY
Marketing and PR for startups
PDF
Portfolio: Aaron Schwartz
PPT
kuulsuste galerii
PPT
19
PDF
Uwicore vtc07 effect of channel-quality indicator delay on hsdpa performance
ODP
Using stop smoking aids
PPT
Gender & tobacco
PPT
The paper
PDF
Are good SharePoint solutions only a myth?
PPT
PoolParty Advanced Semantic Search
Effective intellitrace Debugging with VS 11
crossword
A lap around ASP.NET 4.5 and Visual Studio 2011 Developer Preview
XIX Foro Juan Luis Vives Agenda
What's new in vs 2010 sp1 for web developers
Marketing and PR for startups
Portfolio: Aaron Schwartz
kuulsuste galerii
19
Uwicore vtc07 effect of channel-quality indicator delay on hsdpa performance
Using stop smoking aids
Gender & tobacco
The paper
Are good SharePoint solutions only a myth?
PoolParty Advanced Semantic Search
Ad

Similar to Tune Your ASP.NET Application Using Visual Studio 2010 Profiler (20)

PDF
Visual Studio Profiler
PPTX
Visual Studio 2010 Testing for Developers
PPTX
Dot Net performance monitoring
PPTX
Visual Studio 2013 Profiling
PPTX
Diagnosing issues in your ASP.NET applications in production with Visual Stud...
PPTX
Analyze Your Code With Visual Studio 2015 Diagnostic Tools
PPTX
Whats New In 2010 (Msdn & Visual Studio)
PDF
Kostiantyn Yelisavenko "Mastering Macro Benchmarking in .NET"
PPTX
Introduction to .NET Performance Measurement
PPTX
"Making .NET Application Even Faster", Sergey Teplyakov.pptx
PPTX
Application Quality Best Practices with Visual Studio 2010 - Adrian Dunne
PPTX
Application Quality Best Practices with VS2010
PDF
Chicago ALM User Group - Nov 2014 - Application Insights 101
PDF
Continuous Profiling in Production: What, Why and How
PPTX
Load testing with Visual Studio and Azure - Andrew Siemer
PPTX
Visual Studio Testing Tool 2010
PDF
Automated Performance Profiling with Continuous Integration
PPTX
Performance Managment
PDF
Production profiling what, why and how technical audience (3)
PPT
Performance and Debugging with the Diagnostics Hub in Visual Studio 2013
Visual Studio Profiler
Visual Studio 2010 Testing for Developers
Dot Net performance monitoring
Visual Studio 2013 Profiling
Diagnosing issues in your ASP.NET applications in production with Visual Stud...
Analyze Your Code With Visual Studio 2015 Diagnostic Tools
Whats New In 2010 (Msdn & Visual Studio)
Kostiantyn Yelisavenko "Mastering Macro Benchmarking in .NET"
Introduction to .NET Performance Measurement
"Making .NET Application Even Faster", Sergey Teplyakov.pptx
Application Quality Best Practices with Visual Studio 2010 - Adrian Dunne
Application Quality Best Practices with VS2010
Chicago ALM User Group - Nov 2014 - Application Insights 101
Continuous Profiling in Production: What, Why and How
Load testing with Visual Studio and Azure - Andrew Siemer
Visual Studio Testing Tool 2010
Automated Performance Profiling with Continuous Integration
Performance Managment
Production profiling what, why and how technical audience (3)
Performance and Debugging with the Diagnostics Hub in Visual Studio 2013

Recently uploaded (20)

PPTX
Cloud computing and distributed systems.
PDF
Reach Out and Touch Someone: Haptics and Empathic Computing
PDF
KodekX | Application Modernization Development
PDF
Electronic commerce courselecture one. Pdf
PDF
Unlocking AI with Model Context Protocol (MCP)
PDF
Empathic Computing: Creating Shared Understanding
PPTX
Spectroscopy.pptx food analysis technology
PDF
Mobile App Security Testing_ A Comprehensive Guide.pdf
PDF
Advanced methodologies resolving dimensionality complications for autism neur...
PPTX
Big Data Technologies - Introduction.pptx
PDF
Approach and Philosophy of On baking technology
PPTX
MYSQL Presentation for SQL database connectivity
PPTX
VMware vSphere Foundation How to Sell Presentation-Ver1.4-2-14-2024.pptx
PPTX
Programs and apps: productivity, graphics, security and other tools
PDF
Build a system with the filesystem maintained by OSTree @ COSCUP 2025
PDF
Architecting across the Boundaries of two Complex Domains - Healthcare & Tech...
PPTX
KOM of Painting work and Equipment Insulation REV00 update 25-dec.pptx
PDF
Review of recent advances in non-invasive hemoglobin estimation
PPTX
Understanding_Digital_Forensics_Presentation.pptx
PDF
Building Integrated photovoltaic BIPV_UPV.pdf
Cloud computing and distributed systems.
Reach Out and Touch Someone: Haptics and Empathic Computing
KodekX | Application Modernization Development
Electronic commerce courselecture one. Pdf
Unlocking AI with Model Context Protocol (MCP)
Empathic Computing: Creating Shared Understanding
Spectroscopy.pptx food analysis technology
Mobile App Security Testing_ A Comprehensive Guide.pdf
Advanced methodologies resolving dimensionality complications for autism neur...
Big Data Technologies - Introduction.pptx
Approach and Philosophy of On baking technology
MYSQL Presentation for SQL database connectivity
VMware vSphere Foundation How to Sell Presentation-Ver1.4-2-14-2024.pptx
Programs and apps: productivity, graphics, security and other tools
Build a system with the filesystem maintained by OSTree @ COSCUP 2025
Architecting across the Boundaries of two Complex Domains - Healthcare & Tech...
KOM of Painting work and Equipment Insulation REV00 update 25-dec.pptx
Review of recent advances in non-invasive hemoglobin estimation
Understanding_Digital_Forensics_Presentation.pptx
Building Integrated photovoltaic BIPV_UPV.pdf

Tune Your ASP.NET Application Using Visual Studio 2010 Profiler

  • 1. Tune Your ASP.NET Application Using Visual Studio 2010 Profiler Abhijit Jana │ Consultant, Microsoft http:// abhijitjana.net | @abhijitjana virtual techdays INDIA │ 28-30 September 2011
  • 2. Introducing Profiling Introducing Visual Studio 2010 Profiler Choose right Profiling Methods Deep dive into Visual studio profiler Use different techniques of profiling with asp.net apps Profile ASP.NET applications with IIS Profiling JavaScript ASP.NET load testing and Profiling Q/A S E S S I O N A G E N D A virtual techdays INDIA │ 28-30 September 2011
  • 3. Performance of an application is a key element that should be analyzed and optimized before it go for live. The most common use of profiling information is to help application performance optimization . This helps to find out memory usages , usage of particular instructions , check for CPU Utilization or frequency and duration of specific function calls . Analyze your application performance, review and optimize your code then rerun the profiler. Compare the result with your baseline result. Let your code fly Introducing Profiling Why do we need this ? Why it is important ? virtual techdays INDIA │ 28-30 September 2011
  • 4. Application Profiling Life Cycle Just look into the different steps of Application Profiling Run Profiler Performance Report Application Analyze Reports Code Optimization Compare Performance Report virtual techdays INDIA │ 28-30 September 2011
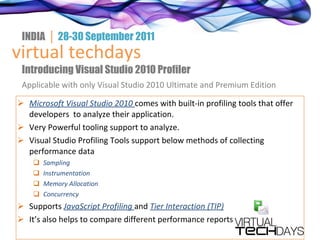
  • 5. Microsoft Visual Studio 2010 comes with built-in profiling tools that offer developers to analyze their application. Very Powerful tooling support to analyze. Visual Studio Profiling Tools support below methods of collecting performance data Sampling Instrumentation Memory Allocation Concurrency Supports JavaScript Profiling and Tier Interaction (TIP) It’s also helps to compare different performance reports Introducing Visual Studio 2010 Profiler Applicable with only Visual Studio 2010 Ultimate and Premium Edition virtual techdays INDIA │ 28-30 September 2011
  • 6. Choose right Profiling Methods First know which method is suitable for your application. Sampling : This is useful for initial analysis of your application. Use sampling for analyzing CPU utilization issues . Instrumentation : Inspect the time for all functions used in the application during the current profile session. Check for all call out and call in functions For analyzing input/output performance issues . Memory Allocation : This uses sampling profiling method to collects .NET Framework memory allocation data Concurrency : Visualize the behavior of Multithread application virtual techdays INDIA │ 28-30 September 2011
  • 7. DEMO: Deep dive into Visual studio profiler Abhijit Jana │ Consultant, Microsoft virtual techdays INDIA │ 28-30 September 2011
  • 8. Inside Sampling Know something more about Sampling Profiling Visual Studio Profiler collects the function call stack by sending some interrupts the computer processor at set of intervals. The profiler analysis determines whether the processor is executing code in the target process. If the processor is executing the target code, the profiler increments the sample counts for each function on the call stack Measurements Inclusive samples Exclusive samples Inclusive percent Exclusive percent http :// msdn.microsoft.com/en-us/library/ms242753.aspx Profiler virtual techdays INDIA │ 28-30 September 2011
  • 9. Inside Instrumentation Know more about Instrumentation Visual Studio Profiling Tools injects code at the start and end of target functions in the profiled binary This also inject codes before and after each call by instrumented functions to other functions. Main Measurement Elapsed Inclusive Elapsed Exclusive Application Inclusive Application Exclusive http:// msdn.microsoft.com/en-us/library/ms182369.aspx virtual techdays INDIA │ 28-30 September 2011
  • 10. DEMO: Using Instrumentation With ASP.NET Application Abhijit Jana │ Consultant, Microsoft virtual techdays INDIA │ 28-30 September 2011
  • 11. DEMO: Compering Profiler Result Abhijit Jana │ Consultant, Microsoft virtual techdays INDIA │ 28-30 September 2011
  • 12. DEMO: Profiling ASP.NET Application With IIS Abhijit Jana │ Consultant, Microsoft virtual techdays INDIA │ 28-30 September 2011
  • 13. DEMO: JavaScript Profiling Abhijit Jana │ Consultant, Microsoft virtual techdays INDIA │ 28-30 September 2011
  • 14. DEMO: ASP.NET Load Testing and Profiling Abhijit Jana │ Consultant, Microsoft virtual techdays INDIA │ 28-30 September 2011
  • 15. Beginners Guide to Performance Profiling Analyzing Application Performance by Using Profiling Tools How to Profile IIS Express with Visual Studio 2010 SP1 Useful Resources virtual techdays INDIA │ 28-30 September 2011
  • 16. Questions & Answer virtual techdays INDIA │ 28-30 September 2011
  • 17. abhijan@microsoft.com │ http://abhijitjana.net │ @AbhijitJana Thank You virtual techdays INDIA │ 28-30 September 2011