Understanding big data and data analytics big data
1 like2,150 views

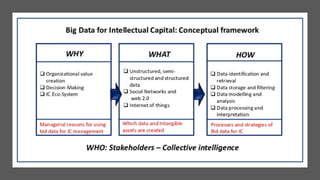
The document discusses the concepts and importance of big data, business intelligence, and data analytics, emphasizing their roles in informed decision-making in today's complex business environment. It outlines the characteristics of big data, types of data, and the significance of bridging the information gap through effective data handling. Additionally, it highlights various opportunities presented by big data, including quality improvement and fraud detection in businesses.


Understanding big data and data analytics big data
- 1. Understanding Big Data and Data Analytics Seta A. Wicaksana Founder and CEO of www.humanikaconsulting.com 1
- 2. Seta A. Wicaksana 0811 19 53 43 wicaksana@humanikaconsulting.com • Managing Director of Humanika Amanah Indonesia – Humanika Consulting • Managing Director of Humanika Bisnis Digital – hipotest.com • Wakil Ketua Asosiasi Psikologi Forensik Indonesia wilayah DKI • Business Psychologist • Certified of Assessor Talent Management • Certified of Human Resources as a Business Partner • Certified of Risk Professional • Certified of HR Audit • Certified of I/O Psychologist • Dosen Tetap Fakultas Psikologi Universitas Pancasila • Pembina Yayasan Humanika Edukasi Indonesia • Penulis Buku : “SOBAT WAY: Mengubah Potensi menjadi kompetensi” Elexmedia Gramedia 2016, Industri dan Organisasi: Pendekatan Integratif menghadapi perubahan, DD Publishing, 2020. Human Factor Engineering: Manusia dan Lingkungan Kerja. DD Publishing, 2021, Psikologi Industri dan Organisasi, DD Publishing, 2021 • Organizational Development Expertise • Sedang mengikuti tugas belajar Doktoral (S3) di Fakultas Ilmu Ekonomi dan Bisnis Universitas Pancasila Bidang MSDM Disertasi Peran Utama Budaya Organisasi dalam Agilitas Organisasi di Lembaga Pemerintah Non Kementrian XYZ • Fakultas Psikologi S1 dan S2 Universitas Indonesia • Mathematics: Cryptology sekolah ikatan dinas Akademi Sandi Negara
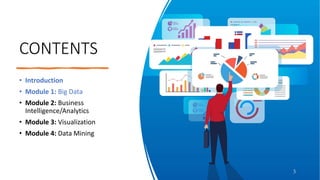
- 3. CONTENTS • Introduction • Module 1: Big Data • Module 2: Business Intelligence/Analytics • Module 3: Visualization • Module 4: Data Mining 3
- 4. Learning Objectives Upon successful completion of this chapter, you will be able to: • Explain the difference between BI, Analytics, Data Marts and Big Data. • Define the characteristics of data for good decision making. • Describe what Data Mining is. • Explain market basket and cluster analysis.
- 6. Business Analytics, BI, Big Data, Data Mining - What’s the difference? • Business Analytics – Tools to explore past data to gain insight into future business decisions. • BI – Tools and techniques to turn data into meaningful information. • Big Data –data sets that are so large or complex that traditional data processing applications are inadequate. • Data Mining - Tools for discovering patterns in large data sets.
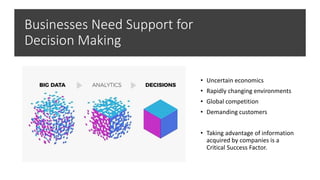
- 7. Businesses Need Support for Decision Making • Uncertain economics • Rapidly changing environments • Global competition • Demanding customers • Taking advantage of information acquired by companies is a Critical Success Factor.
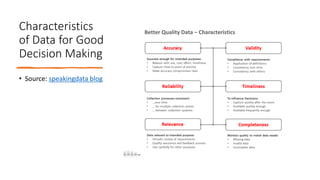
- 8. Characteristics of Data for Good Decision Making • Source: speakingdata blog
- 9. The Information Gap • The shortfall between gathering information and using it for decision making. • Firms have inadequate data warehouses. • Business Analysts spend 2 days a week gathering and formatting data, instead of performing analysis. (Data Warehousing Institute). • Business Intelligence (BI) seeks to bridge the information gap.
- 10. 10 What is Big Data? MODULE 1
- 11. What is Big Data? • Massive sets of unstructured/semi-structured data from Web traffic, social media, sensors, etc • Petabytes, exabytes of data • Volumes too great for typical DBMS • Information from multiple internal and external sources: • Transactions • Social media • Enterprise content • Sensors • Mobile devices • In the last minute there were ……. • 204 million emails sent • 61,000 hours of music listened to on Pandora • 20 million photo views • 100,000 tweets • 6 million views and 277,000 Facebook Logins • 2+ million Google searches • 3 million uploads on Flickr
- 12. What is Big Data? continued • Companies leverage data to adapt products and services to: • Meet customer needs • Optimize operations • Optimize infrastructure • Find new sources of revenue • Can reveal more patterns and anomalies • IBM estimates that by 2015 4.4 million jobs will be created globally to support big data • 1.9 million of these jobs will be in the United States
- 14. Where does Big Data come from? Enterprise “Dark Data” Partner, Employee Customer, Supplier Public Commercial Social Media Transactions Monitoring Sensor Economic Population Sentiment Email Contracts Network Industry Credit Weather
- 16. Types of Data
- 17. Types of Data • When collecting or gathering data we collect data from individuals cases on particular variables. • A variable is a unit of data collection whose value can vary. • Variables can be defined into types according to the level of mathematical scaling that can be carried out on the data. • There are four types of data or levels of measurement:
- 18. Categorical (Nominal) data • Nominal or categorical data is data that comprises of categories that cannot be rank ordered – each category is just different. • The categories available cannot be placed in any order and no judgement can be made about the relative size or distance from one category to another. • Categories bear no quantitative relationship to one another • Examples: • - customer’s location (America, Europe, Asia) • - employee classification (manager, supervisor, • associate) • What does this mean? No mathematical operations can be performed on the data relative to each other. • Therefore, nominal data reflect qualitative differences rather than quantitative ones.
- 19. •Systems for measuring nominal data must ensure that each category is mutually exclusive and the system of measurement needs to be exhaustive. •Exhaustive: the system of categories system should have enough categories for all the observations • Variables that have only two responses i.e. Yes or No, are known as dichotomies. Nominal data Examples: What is your gender? (please tick) Male Female Did you enjoy the film? (please tick) Yes No
- 21. • Ordinal data is data that comprises of categories that can be rank ordered. • Similarly with nominal data the distance between each category cannot be calculated but the categories can be ranked above or below each other. No fixed units of measurement Examples: - college football rankings - survey responses (poor, average, good, very good, excellent) •What does this mean?Can make statistical judgements and perform limited maths. Ordinal data How satisfied are you with the level of service you have received? (please tick) Very satisfied Somewhat satisfied Neutral Somewhat dissatisfied Very dissatisfied Example:
- 23. Interval and ratio data • Both interval and ratio data are examples of scale data. • Scale data: • data is in numeric format ($50, $100, $150) • data that can be measured on a continuous scale • the distance between each can be observed and as a result measured • the data can be placed in rank order.
- 24. Interval data • Ordinal data but with constant differences between observations • Ratios are not meaningful • Examples: • Time – moves along a continuous measure or seconds, minutes and so on and is without a zero point of time. • Temperature – moves along a continuous measure of degrees and is without a true zero. • SAT scores
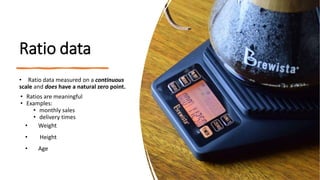
- 26. Ratio data • Ratio data measured on a continuous scale and does have a natural zero point. • Ratios are meaningful • Examples: • monthly sales • delivery times • Weight • Height • Age
- 28. (continued) Classifying Data Elements in a Purchasing Database Data for Business Analytics 1-28 Figure 1.2 If there was field (column) for Supplier Rating (Excellent, Good, Acceptable, Bad), that data would be classified as Ordinal
- 29. Big Data Characteristics Quickening speed of data e.g. smart meters, process monitoring Growing quantity of data e.g. social media, behavioral, video Increase in types of data e.g. app data, unstructured data VELOCITY VOLUME Gartner, Feb 2001
- 30. Variety of data 48% Volume of data 35% Velocity of data 16% Source: Getting Value from Big Data, Gartner Webinar, May 2012 Which Big Data characteristic is the biggest issue for your organization?
- 31. Volume • Volume •Petabytes, exabytes of data •Volumes too great for typical DBMS
- 32. Volume - Bytes Defined eBay data warehouse (2010) = 10 PB eBay will increase this 2.5 times by 2011 Teradata > 10 PB Megabyte: 220 bytes or, loosely, one million bytes Gigabyte: 230 bytes or, loosely one billion bytes
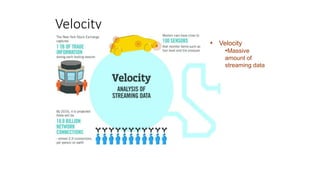
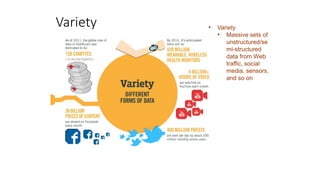
- 34. Variety • Variety • Massive sets of unstructured/se mi-structured data from Web traffic, social media, sensors, and so on
- 35. Big Data Opportunities Discovering hidden insights e.g. anomalies forensics, patterns, trends Making better informed decisions e.g. strategies, recommendations Automating business processes e.g. complex events, translation
- 40. Which is the biggest opportunity for Big Data in your organization?
- 42. Quality Improvement • Opportunity • Move from manual to automated inspection of burger bun production to ensure and improve quality • Data & Analytics • Photo-analyze over 1000 buns-per-minute for color, shape and seed distribution • Continually adjust ovens and process automatically • Result • Eliminate 1000s of pounds of wasted product per year; speed production; save energy; Reduce manual labor costs • Is the company using all of its “senses” to observe, measure and optimize business processes?
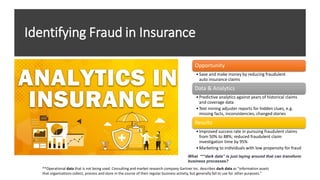
- 44. Identifying Fraud in Insurance Opportunity •Save and make money by reducing fraudulent auto insurance claims Data & Analytics •Predictive analytics against years of historical claims and coverage data •Text mining adjuster reports for hidden clues, e.g. missing facts, inconsistencies, changed stories Results •Improved success rate in pursuing fraudulent claims from 50% to 88%; reduced fraudulent claim investigation time by 95% •Marketing to individuals with low propensity for fraud What **“dark data” is just laying around that can transform business processes? **Operational data that is not being used. Consulting and market research company Gartner Inc. describes dark data as "information assets that organizations collect, process and store in the course of their regular business activity, but generally fail to use for other purposes."